
Abstract
Background:
Information on pre-pregnancy body mass index (BMI), gestational weight gain (GWG), and adverse outcomes in the Philippines is limited particularly in primary care settings.
Objectives:
This study aims to assess the nutritional status of Filipino women in early pregnancy, their GWG, and associated outcomes.
Design:
This prospective study included 176 Filipino pregnant women aged 15–49 years, recruited from 35 locations between October 2021 and December 2022.
Methods:
Measured weight was recorded in the mother–infant booklet by midwives as reported by pregnant women through phone interviews. Weight during the first prenatal visit (<15 completed weeks) was considered the pre-pregnancy weight (PPW). Pre-pregnancy BMI was calculated using the World Health Organization and Centers for Disease Control and Prevention classifications. Total GWG (tGWG) was determined by subtracting PPW from the weight measured at the last prenatal visit, assessed according to the 2009 Institute of Medicine (IOM) recommendations, and analyzed using logistic regression. Dietary intake was assessed using the standardized 24-h food recall method.
Results:
Of the study participants, 15.3% were underweight, 56.8% normal, and 27.8% overweight/obese. The mean tGWG was 9.0 ± 4.9 kg, with most women having a tGWG below the 2009 IOM recommendations. Overweight and obese women had nearly three times the odds of having a cesarean section (odds ratio [OR] 2.85 (95% confidence interval [CI] 1.14–7.13), p = 0.025), while those whose gestational weight gain was below the IOM recommendations had significantly lower odds of having such a procedure (OR 0.24 (95% CI 0.09–0.67), p = 0.007).
Conclusion:
Total GWG varies by pre-pregnancy BMI, with many Filipino women not meeting the 2009 IOM recommendations for GWG, yet without negative outcomes. These findings indicate that lower GWG may be typical among Filipino women. From the outcomes studied, only the rate of cesarean sections and having a GWG below the 2009 IOM recommendations reached statistical significance. This highlights the need for further evaluation of the 2009 IOM recommendations for Filipino women through well-designed prospective studies.
Plain Language Summary
Maternal nutritional status and gestational weight gain (GWG) are linked to negative pregnancy and birth outcomes. However, this information about the Filipino female population is understudied in the Philippines. The study aimed to examine these associations.
The team conducted phone interviews with pregnant women nationwide, using a structured questionnaire to gather socio-demographic, obstetric, and other relevant information including maternal and fetal outcomes. Midwives measured the maternal weight and height during antenatal check-ups, and participating women provided screenshots of these measurements for verification after each interview.
Among the participants, 15.3% were underweight, 56.8% were normal weight, and 27.8% were overweight or obese. Most women had GWG below the 2009 IOM recommendations, with no negative effects observed, except that overweight and obese women were nearly three times more likely to have cesarean sections than those whose GWG was below the aforementioned recommendations.
The study highlights that GWG varies by pre-pregnancy BMI, with underweight women gaining the most weight. Lower GWG is common among Filipino women. The impact of being overweight or obese on maternal outcomes is significant and cannot be overlooked. Given the limited sample size, this underscores the need for a thorough evaluation of the applicability of IOM recommendations specifically for Filipino women. Therefore, well-designed future research is essential to validate and strengthen the conclusions drawn from this study.
Keywords
Introduction
In the Philippines, for the past several decades, the nutritional status of pregnant women is assessed on the basis of the maternal weight as a percentage of the standard owing to the unavailability of preconception weight. Unlike in many other countries, the nutritional status of pregnant women is generally assessed by the pre-pregnancy body mass index (BMI) and classified according to the World Health Organization (WHO) guidelines for adults. 1 Pre-pregnancy BMI is a known determinant of many pregnancy outcomes. 2 Substantial evidence has shown that women who become pregnant while having a BMI below or above the normal range (18.5–24.9 kg/m2) are believed to have an elevated risk of adverse pregnancy outcomes such as gestational diabetes, preeclampsia, and cesarean delivery3,4 and of birth outcomes such as an increased risk for low-birth-weight (LBW) delivery, macrosomia, birth injuries, stillbirth, preterm birth,5,6 and possibly future childhood obesity. 2 Furthermore, the Institute of Medicine (IOM) showed that gestational weight gain (GWG) may also affect long-term maternal and child health. 7 Mothers with suboptimal weight gain during pregnancy are at a higher risk of delivering babies with LBW, small-for-gestational-age,8,9 and preterm birth. 1 On the other hand, women who gain excessive weight are at an increased risk of delivery of a large-for-gestational-age or macrosomic infant, 10 pregnancy-associated hypertension, complications during labor, and delivery by cesarean section (CS). 2 Furthermore, cesarean delivery was found to be an independent risk factor for adverse outcomes 11 and has been a public health concern globally. 12 Unfortunately, in the Philippines, an alarming rate of 36.2% in cesarean delivery was observed according to Macayaon et al. 13 Currently, data are scarce on pre-pregnancy BMI and GWG with regard to pregnancy and birth outcomes among Filipinos especially in the primary care settings. The association between pre-pregnancy BMI and GWG provides solid evidence of their health implications on the mother and her infant.14–16 In the 1990 IOM 17 guidelines for weight gain in pregnancy, there was only one weight target for all pregnant women; however, since evidence has shown that weight gain varies by pre-pregnancy BMI, 18 it is therefore crucial to assess the nutritional status in the local setting based on pre-pregnancy BMI. 19 Hence, this study aims to determine the nutritional status in early pregnancy and track the GWG throughout the pregnancy and their associations with pregnancy and birth outcomes. The study hypothesized that the total GWG (tGWG) of Filipino women varies by pre-pregnancy BMI and that the tGWG is within the 2009 IOM recommendations. This study will provide a unique opportunity for the government health authority to identify problems related to inadequate or excessive weight gain and provide evidence on the association of pre-pregnancy BMI and GWG with outcome measures comparable with those of other countries.
Materials and methods
Study design and population
This is a pilot study using a prospective study design nested in the 2021 Expanded National Nutrition Survey (ENNS). The 2021 ENNS 20 was a nationally representative household survey that collected information on various food, nutrition, and health indicators across different population groups. Details on the survey methodology and recruitment are available elsewhere. 21 Based on the assumption of four to five pregnant women in the sampled households per province and highly urbanized cities (HUCs) and an attrition rate of 25%, a minimum sample size of 219 participants was calculated. This pilot study was conducted through structured phone interviews of pregnant women between October 2021 and December 2022 in 35 provinces and HUCs across the country such as in the following places: Sarangani, Agusan del Sur, Davao de Oro (Compostela Valley), Surigao del Norte, Bohol, Apayao, Ifugao, Batangas, Bacolod, Negros Occidental, Iligan City, Tawi Tawi, Leyte, Cebu City, Catanduanes, Albay, Masbate, Lucena City, Romblon, Ilocos Sur, Batanes, Muntinlupa, Navotas City, Valenzuela City, Bataan, Negros Oriental, Tarlac, Cotabato City, North Cotabato, Davao del Sur, La Union, Cavite, Aurora, Occidental Mindoro, and General Santos City.
The reporting guideline for this study was the Strengthening the Reporting of Observational Studies in Epidemiology (STROBE)—Nutritional Epidemiology: an extension of the STROBE statement. 22
Objectives
This study aims to assess the nutritional status of Filipino women in early pregnancy, their GWG, and their associations with pregnancy and birth outcomes. Specifically, this study aims to (1) assess the nutritional status using the weight at the first prenatal visit, (2) determine the tGWG by pre-pregnancy BMI categories, and (3) determine the associations of pre-pregnancy BMI and GWG with selected pregnancy and birth outcomes.
Recruitment
During the recruitment, one city and one municipality from each province/HUC were selected randomly, and then, two districts/barangays (the smallest administrative division in the Philippines; it may refer to a village or suburb), that is, poblacion (the administrative center of a municipality) and non-poblacion, from each city were selected randomly via three-stage cluster sampling. Two potential participants were chosen from each district/barangay with the help of the midwives in the health centers in the area with following the set criteria: pregnant women aged 15–49 years, with known last menstrual period (LMP), <15 weeks of gestation during their first prenatal visit, with mobile phones, and willingness to participate. Only those who met the eligibility criteria were enrolled in the study. In instances where the research team experienced difficulty contacting the study participants through their mobile phone during two scheduled interviews, replacements were requested from the midwives.
A total of 224 pregnant women were recruited for the study with the assistance of the midwives between October 2021 and December 2022. Excluded were women who were lost to follow-up, those who transferred to other health centers, those who had miscarriages and multiple births, those who withdrew, and those whose early pregnancy BMI and GWG data were missing. These left us with a sample of 190 women. Further excluding women who had newborns without records of birth weight and had stillbirths gave us a final sample of 176 pregnant women (Figure 1).
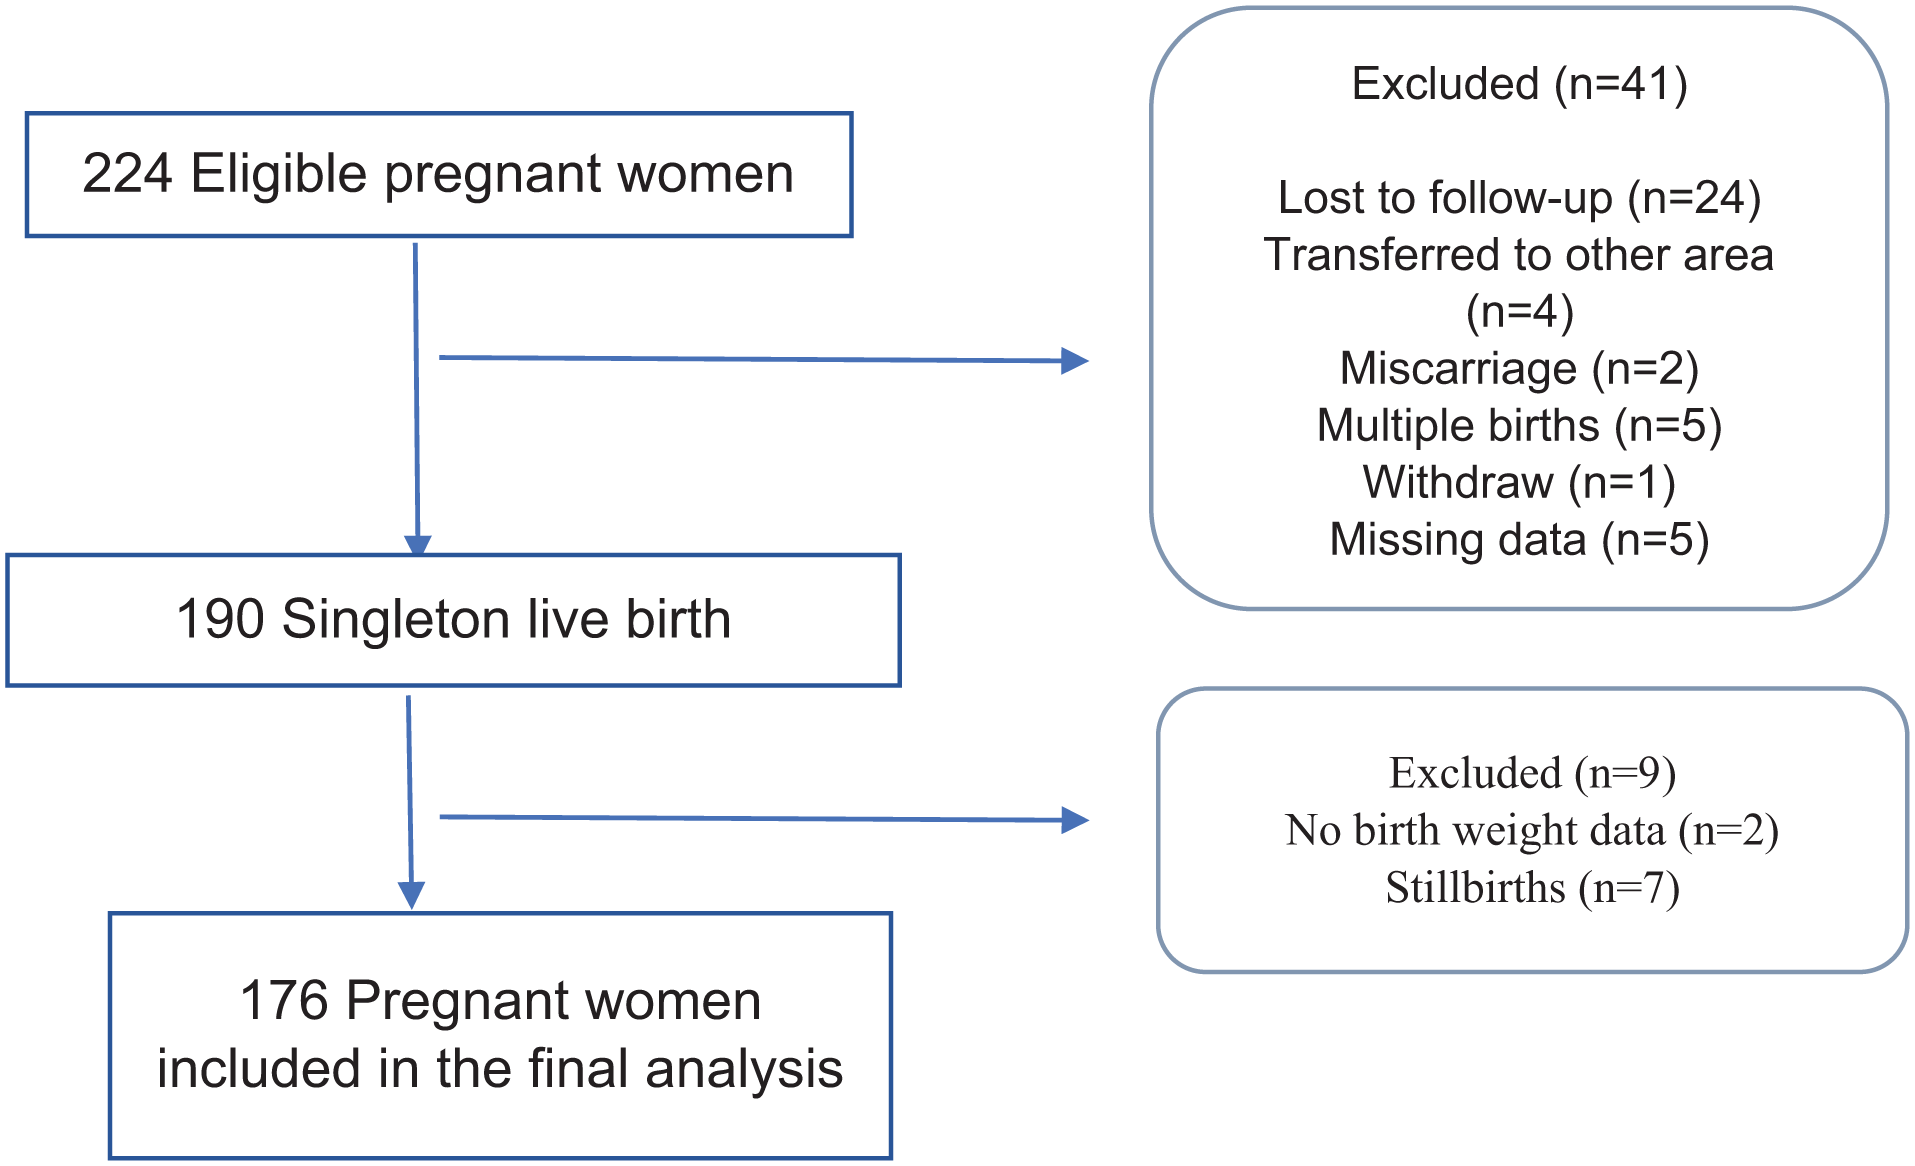
Selection of study participants.
Study variables and related covariates
Maternal age (years: 15–18, 19–34, and 35–49 age bracket); height (cm: <150, 150–155, and 156–160); maternal weight (kg) measured during routine prenatal visits; educational attainment (completed years of formal education); marital status (married, cohabiting, or single mother); work status (unemployed, currently employed self-employed, or student); average family income per month (<₱5000, ₱5000–10,000, ₱11,000–15,000, ₱16,000–20,000, or ₱>21,000); parity (primiparous or multiparous); alcohol consumption during pregnancy (non-alcohol drinker or alcohol drinker); smoking during pregnancy (not smoking or smoking); physical activity during pregnancy (no routine physical activity or with routine physical activity); pregnancy complications; dietary intake (energy, macronutrients, and micronutrients); mode of delivery (normal delivery or CS); reasons for cesarean delivery; infant sex as male and female; infant birth weight (g: <2500, 2500–3999, and ≥4000). All data were collected after their scheduled prenatal visits to their respective health centers through structured phone interviews of the pregnant women.
Measurements and outcomes
Maternal weight at the first prenatal visit (<15 completed weeks) was considered as the pre-pregnancy weight (PPW). The pre-pregnancy BMI was calculated from the height and PPW by dividing the maternal weight in kilograms by the square of the height in meters. The pre-pregnancy BMI was categorized as underweight (<18.5 kg/m2), normal weight (18.5–24.9 kg/m2), overweight (25–29.9 kg/m2), and obese (⩾30 kg/m2) according to the WHO criteria. For women <20 years old, the age- and sex-specific BMI percentiles were calculated, and the BMI categories were defined according to the Centers for Disease Control and Prevention definitions. tGWG (kg) was calculated by subtracting the PPW from the weight at the last prenatal visit. The tGWG was categorized as below, within, and above the 2009 IOM recommendations. Gestational age estimation was based on the first day of the LMP. Gestational age at delivery was calculated as the number of completed weeks of gestation from the LMP to the date of delivery. The energy (kcal/day), macronutrient (g/day), and micronutrient (mg/day) intakes were taken once during the second and third trimesters of pregnancy using the standardized 24-h food recall and were analyzed using the Individual Dietary Evaluation System developed by the Food and Nutrition Research Institute (FNRI) to evaluate the energy and nutrient content of foods consumed by each individual. This system contains the data of the expanded Food Composition Table; they were then compared with the 2015 Philippine Dietary Reference Intake (2015 PDRI). The adjusted associations of pre-pregnancy BMI and GWG with outcome measures include preterm birth (before 37 weeks of gestation), LBW (<2500 g), and cesarean delivery.
Data collection
A standardized protocol was implemented for data collection, which involved training the research staff on how to gather and enter data into the computer to minimize inter-observer variability. Before the data collection commenced, the research team organized a series of online orientations for the midwives, emphasizing the critical importance of the information recorded in the mother–infant booklet. All adult participants provided verbal consent before the start of the data collection. For participants aged 15–17 years, informed assent was obtained, along with parental consent from their parents or legally authorized representatives (LAR).
The submitted study protocol to the FNRI’s Institutional Ethics Review Committee clearly outlined in the methodology that data collection would occur through phone interviews. It also specified that verbal consent would be obtained from the study participants as well as from their parents or LAR.
The phone interviews were conducted by trained research staff once each trimester, typically the day after their antenatal visits to the health center, and again at 6 weeks after delivery using a pretested and validated structured questionnaire. During routine antenatal check-ups at the rural health units, midwives measured anthropometric data, including maternal weight and height, using standardized techniques and recorded them in the mother–infant booklet. Biochemical and diagnostic data, including ultrasound results, were obtained from the participants clinical records through screenshot copies. Clinical information, such as blood pressure recorded in the mother–infant booklet and a list of medications prescribed by midwives or doctors, was collected during the interviews. Dietary intake was assessed once during both the second and third trimesters of pregnancy using a standardized 24-h dietary recall method. This method has been utilized in previous national nutrition surveys, including both face-to-face and telephone-based interviews. The following information was collected in each meal: a complete list of food items and time of meals, the amount consumed, and the cooking method used. Additionally, a set of pictures of different tools like measuring cups, tablespoons, and teaspoons and a set of wooden matchbox (to estimate sizes of fish, meat, and poultry) were sent through phone to help participants estimate the food consumed in common household measures.
These measurements and other results were later requested from the participants to verify their responses during the phone interviews.
Permission for audio recording by the trained research staff was obtained prior to each interview. Although four interviews were scheduled, data on subsequent prenatal care, including GWG, pregnancy complications, and other pertinent information, were collected on a monthly basis. Each interview lasted ~45 min to 1 h. All collected data were encoded and reviewed by the trained research staff. To ensure the completeness and accuracy of the questionnaire responses, the research team cross-verified the encoded information against screenshot copies of the mother–infant booklet, along with the biochemical and diagnostic laboratory results, and the pictures of the medications, vitamins, and mineral supplements consumed. Data were entered into a computer using Microsoft Excel in Google Sheets format. The audio recordings, submitted photos, and biochemical results were saved in files stored in a shared Google Drive that is accessible only to the research team.
Statistical analysis
Descriptive statistics of the pregnant women were computed using frequencies, percentages, and means. Inferential statistics (odds ratios (OR) with 95% confidence intervals (CIs) and p values) were employed in the study. All test results were considered significant at p < 0.05.
The adjusted association of pre-pregnancy BMI and GWG with selected outcomes (pre-term birth, LBW, and cesarean section) including confounder-adjusted variables was determined by logistic regression analysis for the categorical outcomes and by multiple linear regression for the continuous outcomes using the Stata software, version 16.0.
Results
Of the 176 pregnant women, 15.3% were underweight, 56.8% were of normal weight, and 27.8% were overweight and obese (the obese group was combined with the overweight group owing to the scarcity of data for the former). The mean age of the women was 27.3 ± 6.1 years. The mean height and PPW were 153.7 ± 6.6 cm and 54.3 ± 11.3 kg, respectively. The mean age of gestation was 9.6 ± 3.2 weeks at the first prenatal visit and 39.0 + 2.1 weeks at delivery. More than half of the women reached high school level, while only one-third attained college. Moreover, slightly more than 50% of the women were cohabiting and were unemployed. Most of the women had an average income of between ₱5000 and ₱10,000, and were multiparous, non-alcohol drinkers, non-smokers, and physically active. Moreover, 34% of the women experienced pregnancy complications across different pre-pregnancy BMI categories. Majority of the women had a normal delivery. Notably, among those who had a CS, the most common reasons were malpresentation, dry labor, and gestational hypertension. Regarding the infant characteristics, there were more female than male infants and the mean birth weight was 2958 ± 441 g; infant complication was highest among the overweight or obese mothers (Table 1).
Maternal and infant characteristics by pre-pregnancy BMI.

BMI: body mass index; CS: cesarean section; SD: standard deviation.
Table 2 shows the mean tGWG throughout the pregnancy. A highly significant relationship was observed between tGWG and pre-pregnancy BMI, parity, and mode of delivery. An inverse relationship was observed between tGWG and pre-pregnancy BMI (p = 0.016). Women with a lower pre-pregnancy BMI had a higher tGWG (11.3 ± 4.8 kg) compared to women with normal weight (9.3 ± 4.4 kg) or overweight and obese (7.2 ± 5.4 kg). Moreover, primiparous women had a significantly higher mean tGWG than that of multiparous women (10.8 ± 4.8 versus 8.3 ± 4.8 kg, p = 0.010). Similarly, women who had a cesarean delivery had a higher mean tGWG than that of women with normal delivery (11.3 ± 5.2 versus 8.5 ± 4.7 kg).
Mean (±SD) total gestational weight gain of pregnant women during pregnancy.

Note. Remarks ‘a’, ‘b’, and ‘c’ indicate significant differences across categories at p < 0.05.
BMI: body mass index; SD: standard deviation.
p < 0.01, highly significant.
Table 3 shows that the mean energy intake of all the participants (n = 137) was 1781.4 ± 830.5 kcal/day, which is lower than the recommended energy intake per day based on the 2015 PDRI 23 of 2230 kcal/day for pregnant women aged 19–29 years as reference. The average energy intake of underweight pregnant women was reported to be higher than those with normal and overweight/obese BMI. The same observation can be said in regard to the intake of macronutrients (protein, carbohydrates, and fats) and micronutrients.
Mean energy and nutrient intake of pregnant women by pre-pregnancy BMI status (n = 137).

BMI: body mass index; SD: standard deviation.
Note. Dietary intake included vitamins and mineral supplements.
Table 4 shows that the mean energy and nutrient intake per day for those meeting and not meeting the estimated average requirements (EARs) per day were within the reference values or 95% CI of the means. The mean caloric intake of pregnant women not meeting the EAR is 1328.3 kcal, while that of women meeting the EAR for energy is (mean (SE)) 2842.3 kcal (73.8). When the daily caloric intake was compared to the PDRI for adequacy, 70.1% of the participants did not meet the recommended energy intake. For the macronutrients, 64.2% and 52.6% of the participants did not meet the acceptable macronutrient distribution range (AMDR) per day for carbohydrates and protein, respectively, whereas 56.9% of the women met the recommendations for fat.
Percent and mean energy, and nutrient content of the estimate average requirements per day of pregnant women (n = 137).

CI: confidence interval.
Note. Dietary intake included vitamins and mineral supplements.
A greater proportion (83.2%) of the women did not meet the recommended dietary fiber intake: (mean (SE)) 10.5 (0.4) versus 25 g. For micronutrients, 97.1% of women did not meet the EAR of 31.7 mg of iron, with only an estimated intake of 14.2 mg. Even though it was recommended to eat foods rich in vitamin C during the time of the dietary interviews owing to the COVID-19 pandemic, more than half (55.9%) of the participants did not meet the recommended EAR for vitamin C. Additionally, 87.6% of women did not meet the EAR for sodium, with a mean intake of 1789.7 mg. For calcium and phosphorus, 53.3% and 82.5%, respectively, met the EAR, with a mean intake of 908 mg for calcium and 1188.4 mg for phosphorus. For the vitamins, 65.7% of the women met the EAR for vitamin A, with a mean intake of 1077.9 mg. For the B vitamins thiamin and riboflavin, more than half of the women met the EAR (50.4% and 51.1%, respectively), with a mean intake of 2.0 and 2.2 mg, respectively, while 75% of the women met the EAR for niacin, with an average intake of 26.1 mg.
Furthermore, using the 2009 IOM recommendations, the study was able to establish the relationship between pre-pregnancy BMI and GWG. It shows that the majority of the study participants had a GWG below the 2009 IOM recommendations across the different pre-pregnancy BMI categories (Table 5).
Pre-pregnancy BMI and GWG as per the 2009 IOM recommendations.
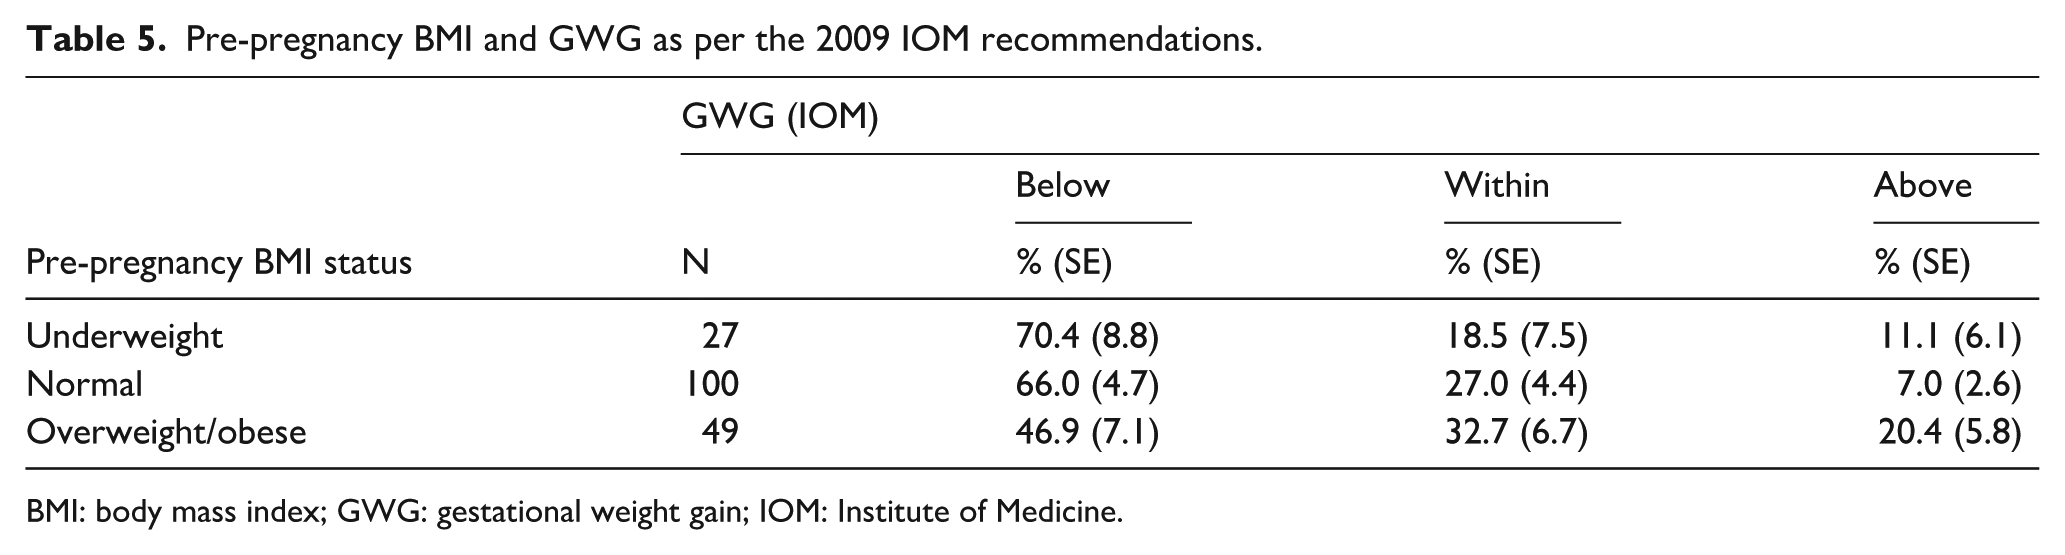
BMI: body mass index; GWG: gestational weight gain; IOM: Institute of Medicine.
Table 6 shows the adverse outcomes across the different pre-pregnancy BMI categories and GWG groups, using women with a normal weight (18.5–24.9 kg/m2) as the reference group. All ORs were mutually adjusted for maternal age, educational attainment, average income, parity, and mode of delivery. Of the three pregnancy outcomes studied, only cesarean delivery was significantly associated with pre-pregnancy BMI and GWG. It shows that being overweight/obese had significantly nearly thrice the risk of having a cesarean delivery (OR 2.85 (95% CI 1.14–7.13), p = 0.025). Compared with the GWG in the 2009 IOM recommendations, pregnant women who gained weight below the recommendation had significantly decreased odds of having a cesarean delivery (OR 0.24 (95% CI 0.09–0.67), p = 0.007).
Adjusted OR between maternal nutritional status and GWG with adverse outcomes.

BMI: body mass index; CI: confidence interval; GWG: gestational weight gain; IOM: Institute of Medicine; OR: odds ratio.
Adjusted OR for age, income, and mother’s classification.
Based on IOM guidelines.
p < 0.05, statistically significant. **p < 0.01, highly significant.
Discussion
This study assessed the nutritional status of Filipino pregnant women based on their pre-pregnancy BMI, taking into account their weight at the first prenatal visit within the first trimester of pregnancy. This approach has been adopted in various countries where preconception weight is unavailable, assuming that weight gain during this period was minimal or negligible. 24 Over the years, the Philippines has made significant system-wide reforms in maternal health, demonstrating that it is feasible to record weight during the first trimester through frequent visits to health centers for prenatal check-ups. The mean gestational age at the first prenatal visit was 9.6 ± 3.2 weeks. Weight measurements taken during this first prenatal visit are now widely used as a proxy for preconception or self-reported weight. Other studies have shown a strong correlation between self-reported pre-pregnancy weight and weight measured in the first trimester, which can be used to estimate pre-pregnancy BMI and GWG.25,26
In the present study, the tGWG observed among Filipino women was nearly close to that of women from other Asian countries such as Indonesia (10.2 ± 6.0 kg), Japan (10.11 ± 3.9 kg), Nepal (10.21 kg), and India (10.51 kg).27–30 Asian populations tend to be smaller in stature and often have lower BMIs and GWGs. 31 These variations may be attributed to racial differences in body composition, dietary patterns, and lifestyle choices when compared to Western populations. 32 Research indicates that adiposity in Asians differs from that in other global populations. 33 Within Asia, Asian Indians generally have the highest body fat percentage, followed by Malays and Chinese. 34 Additionally, a study found that Asians are more predisposed to abdominal adiposity at higher BMI levels than Caucasians. 35 At any level of adiposity, Asians also face a significantly elevated metabolic risk for obesity-related diseases compared to their Caucasian counterparts. 36
When stratified by pre-pregnancy BMI, it is clear that the tGWG among Filipino women varies significantly based on their pre-pregnancy BMI. Underweight women consistently gain more weight than those who are of normal weight, overweight, or obese. This observation is supported by findings from studies across other Asian countries,28,37 as well as in Europe, North America, and Oceania. 38 Furthermore, findings of established research on pregnancy outcomes indicate that weight gain recommendations for underweight women are notably higher than those for normal-weight or overweight women, as outlined by the IOM. The IOM guidelines for GWG are the most widely accepted recommendations. 39 However, a significant proportion of Filipino women did not meet the 2009 IOM recommendations. Many of these women had tGWGs below the said recommendations, while among the overweight or obese, 20.4% exceeded the IOM recommended weight gain. Similar trends were observed among Malaysian women, where the overweight or obese have excessive weight gain. 40 Studies conducted in China and Japan revealed similar outcomes, with weight gain often falling outside the IOM recommendations,41,42 while in Thailand, about one-third of both underweight group and normal weight group gained the appropriate weight based on the IOM recommendations. 43 This is not surprising because weight gain outside the IOM recommendations is common. 44 Consequently, each of these countries has developed its own country-specific guidelines for optimal GWG tailored to their unique populations.
In the present study, unemployed Filipino women and those with a monthly income of between <₱5000 and ₱15,000 have the lowest GWG. A study reported that low-income women exhibited the lowest estimates for GWG, while the upper-middle-income ones showed the highest values. 45 These findings highlight the disparities in work status, income, and advice that women receive during pregnancy. Unemployed women and those with low income are less likely to have access to health information, do not follow medical recommendations more closely, and do not adopt behaviors that contribute to a healthy pregnancy.
The increasing prevalence of obesity during pregnancy may be linked to rapid nutritional transitions, characterized by a greater intake of ultra-processed foods and a notable decline in physical activity. 46 In the Philippines, dietary habits have become increasingly energy-dense over the past decade, a change likely influenced by urbanization. 47 In the present study, ~70% of pregnant women in the Philippines do not meet the recommended energy intake and their consumption of macronutrients and certain micronutrients falls below the AMDR. Nutrient deficiencies have been noted, including protein, dietary fiber, riboflavin, and vitamin C, which highlight nutritional gaps that may pose health risks during pregnancy. These findings are supported by the study of Goyena et al., 48 where pregnant and lactating women also experienced inadequate energy and protein intake, alongside widespread micronutrient deficiencies, particularly in iron, calcium, vitamin C, and riboflavin. These deficiencies can be attributed to dietary patterns that heavily rely on rice, fish, and vegetables, while showing limited consumption of nutrient-dense foods such as meat, dairy products, eggs, legumes, nuts, starchy roots, and fruits. Additionally, in the Philippines, fast food has become more available and popular. More people are eating meals outside their homes, and street food is common, especially near schools, transport hubs, and markets. Overall, these changes mean that many foods are high in sodium, sugar, saturated fats, and refined grains. These observations are not far from those in other South and Southeast Asian countries. For instance, a study noted a growing dependence on processed foods in nations such as Myanmar, Haiti, Malaysia, and Indonesia. 46 Additionally, Thailand has shifted from traditional diets to more processed, low-nutrient options. The increasing consumption of oils and fats in Malaysia, along with the high intake of soft drinks in the Philippines and Thailand, highlights a broader regional shift toward diets lacking in essential nutrients. 49 Therefore, the importance of nutrition in pregnancy cannot be overstated, as it directly impacts the health and development of the fetus. This poor diet is becoming a greater social issue that can lead to various health problems that negatively affect pregnancy and birth outcomes. Nutrition education and dietary guidance must be given emphasis during this period.
The effects of physical activity during pregnancy in the present study demonstrate that women who engage in routine physical activity have a higher weight gain than that of women who are not physically active. This result contradicts findings from studies conducted in China 50 and Vietnam, 51 which indicated that women who were more active during pregnancy experienced less weight gain. This discrepancy suggests that the relationship between physical activity and GWG may vary among different populations. Additionally, since GWG is influenced by various factors beyond physical activity, further research in this area is needed.
Maternal age during pregnancy was also a key factor in GWG. In the present study, younger women aged 15–18 years tended to gain more weight than those in the 19–34 and 35–49 age brackets. The relationship between these two factors agrees with the results of previous studies, which showed that younger women have a higher GWG than that of older women.52,53
With regard to parity, a highly significant result was obtained in this study. Filipino women who were having their first baby (primiparous) experienced greater tGWG than those who had given birth before (multiparous). Similar findings were reported by Abeysena and Jayawardana, 44 where being multiparous has almost twice the risk (OR 1.96 (95% CI 1.34–02.87)) of having less GWG. Kheirouri and Alizadeh 54 reported that, with increasing birth order, there is a significant reduction in the mothers’ GWG (p = 0.0001). Likewise, study findings from China 55 and Japan 56 aligned well with global findings, which indicate that each subsequent birth is associated with somewhat reduced GWG. In particular, multiparous mothers could have a threefold or more reduction in weight gain during pregnancy compared to primiparous mothers. Furthermore, the difference may be attributed to various physiological, socioeconomic, and health-related factors. For example, multiparous women might experience maternal depletion syndrome, which can lead to nutritional deficiencies and lower GWG, as they have less time to recover between pregnancies. According to the 2022 National Demographic and Health Survey, Filipino households have an average of 4.2 members. 57 Families with more children may face increased financial strain, potentially compromising access to adequate healthcare, nutritious food, and other essential needs. Additionally, women with high parity may have less time to seek proper prenatal care, resulting in suboptimal monitoring of pregnancy owing to the demands of caring for multiple children. All of these can negatively impact pregnancy outcomes.
Research shows a clear link between pre-pregnancy BMI and the type of delivery.11,58 In the present study, the risk of undergoing a CS increased nearly threefold among overweight and obese women (OR 2.85 (95% CI 1.14–7.13)), and this result was highly significant. This finding is consistent with those of other studies. In a cohort study among Asian women, a high pre-pregnancy BMI was found to have a significantly increased risk of CS (relative risk = 1.16 (95% CI 1.05–1.27)), along with other maternal and neonatal complications. 59 Furthermore, obese women, as well as those with greater weight gain, had a higher risk of several reported CS indications. 60
According to the Philippine Obstetrics and Gynecology Society (POGS), the rates of CS remained above 20% from 2019 to 2022, reaching a peak of 25.5% in 2021, which may be associated with the social, health, and economic impacts of the COVID-19 pandemic during that period. Various studies have also reported higher CS rates among different Asian countries particularly in China,61,62 which showed the highest CS rate of 45.2% in 2018. 63
For factors such as indications for CS, it was observed in the present study that the indications for CS may be related to various medical complications such as vaginal bleeding, gestational hypertension, infections, and gestational diabetes mellitus (GDM). GDM is particularly prevalent in the Asian population, with an overall rate of 11.7%. 64 Among South Asian women, a strong family history of type 2 diabetes has been observed, with rates of 38.7% compared to 19.0% in Caucasian women (p < 0.0001). 65 In Southeast Asia, the rising prevalence of GDM is associated with rapid socioeconomic changes and shifts in nutrition as discussed above. 66 It was found that women diagnosed with GDM are faced with increased risks of CS, gestational hypertension, preeclampsia, and type 2 diabetes.67,68
In India, according to Nirmala Chandrashekar, an obstetrics gynecology consultant at BGS Gleneagles Global Hospital in Bengaluru, 62 from a doctor’s perspective, factors that contribute to the increasing likelihood of cesarean delivery include malpresentation, gestational hypertension, and prolonged labor. In the present study, the top three reasons for CS include malpresentation, dry labor, and gestational hypertension. In the report of POGS, among the accredited training and service hospitals between January 2019 and December 2022, the three main reasons identified for performing a CS were dysfunctional labor (35.6%), fetal distress (31.2%), and malpresentation (22%). 69 The POGS guidelines 70 recommend that healthcare providers consider external cephalic version (ECV) for women with an uncomplicated breech presentation at 36 weeks of pregnancy. If ECV is unsuccessful, a CS is advised for term, singleton breech pregnancies, as it reduces the risk of perinatal mortality and complications for newborns.
The rising CS rates put a heavy strain on the healthcare system and increase the risk of health issues for both mothers and babies, as well as the financial burdens for families. Therefore, there should be a concerted effort toward evidence-based strategies to minimize health risks related to CS.
There was a highly significant association between GWG and CS. GWG below the IOM recommendations did not negatively affect the outcomes. In fact, Filipino women with lower tGWG had a decreased risk of CS, suggesting a protective effect. This indicates that study participants may need different GWG targets based on their race, culture, sociodemographics, and maternal characteristics.
Limitations
Finally, this study is not without limitations. The final sample comprised 176 participants, which falls short of the adjusted sample size of 219 necessary to adequately account for potential dropouts. This limitation in sample size is duly acknowledged. Given the observed effect sizes and sample distribution, a post hoc power analysis suggested that the study had a limited power (<80%) to detect differences in outcomes such as LBW or preterm birth. This underscores the need for larger sample sizes in future studies to validate the observed trends and strengthen the conclusions drawn from this study. Nevertheless, the collected data represent a diverse cohort of women of reproductive age from both urban and rural areas throughout the country. It is noteworthy that the majority of existing research studies on pregnant women have utilized cross-sectional designs and have been predominantly conducted within hospital settings. Furthermore, longitudinal studies examining weight trends among the Filipino population remain limited. Monitoring maternal weight prospectively throughout the pregnancy is essential for identifying women who may fall into unhealthy weight categories at the beginning of the pregnancy, thus enabling timely health and nutrition interventions. This study presents a significant opportunity to investigate critical outcomes among Filipino women in the first trimester, thereby contributing valuable insights for future meta-analyses.
Another limitation is that using early PPW instead of the preconception weight may lead to misclassification bias. However, many pregnancies in the local setting are unintended 71 ; hence, it is difficult to measure the PPW of Filipino women in large population studies, especially in primary care settings. Given the difficulty of obtaining an accurate PPW, the pragmatic approach in some studies utilized early PPW as the default since it is highly correlated with an identical classification of pre-pregnancy BMI and, thus, may be considered a valid proxy for preconception weight.25,72 Another limitation is that the study did not account for the potential bias in weight measurements between health centers. However, it is worth mentioning that the midwives in the health centers are competent in taking anthropometric measurements and maintaining their equipment, as they have formal school training and regularly update their competencies at work through continuing education, a requirement needed when renewing their professional license. The lack of ultrasound result is another limitation since only the LMP was used for dating pregnancies. Although healthcare providers in the health centers request for an ultrasound, the availability of prenatal ultrasonography, especially in rural areas, is limited. However, even if it is available, owing to financial constraints, many pregnant Filipino women fail to secure this procedure. Ultrasound is better than LMP and has become the standard of care in evaluating pregnant women. In the absence of an ultrasound, according to the study of Macaulay et al., 73 LMP can be used as an alternative tool for gestational age dating as it is highly reliable during early pregnancy, with a difference of only 0.2 days longer than ultrasound-based gestational age dating, and <7 days for estimating the day of delivery, according to another study. 74
Conclusions
In this study, tGWG varies by pre-pregnancy BMI, with underweight women gaining the most weight. Many Filipino women do not meet the 2009 IOM recommendations for GWG, yet have no negative outcomes. These findings indicate that lower GWG may be typical among Filipino women. From the outcomes studied, only the rate of CS and having a GWG below the 2009 IOM recommendations reached statistical significance. This highlights the need for further evaluation of the 2009 IOM recommendations for Filipino women through well-designed prospective studies.
Supplemental Material
sj-docx-1-whe-10.1177_17455057251379225 – Supplemental material for Assessment of maternal nutritional status in early pregnancy and gestational weight gain in selected areas in the Philippines: A pilot study
Supplemental material, sj-docx-1-whe-10.1177_17455057251379225 for Assessment of maternal nutritional status in early pregnancy and gestational weight gain in selected areas in the Philippines: A pilot study by Ruby D. Frane, Charmaine A. Duante, Eva A. Goyena, Marvin C. Delos Santos, Hazel T. Lat, David Kenneth C. Mendoza, Jason Paolo H. Labrador, Merlyn G. Tajan, Kristine Marie N. Benavidez-Fabi and Christia S. Padolina in Women's Health
Supplemental Material
sj-docx-2-whe-10.1177_17455057251379225 – Supplemental material for Assessment of maternal nutritional status in early pregnancy and gestational weight gain in selected areas in the Philippines: A pilot study
Supplemental material, sj-docx-2-whe-10.1177_17455057251379225 for Assessment of maternal nutritional status in early pregnancy and gestational weight gain in selected areas in the Philippines: A pilot study by Ruby D. Frane, Charmaine A. Duante, Eva A. Goyena, Marvin C. Delos Santos, Hazel T. Lat, David Kenneth C. Mendoza, Jason Paolo H. Labrador, Merlyn G. Tajan, Kristine Marie N. Benavidez-Fabi and Christia S. Padolina in Women's Health
Footnotes
Acknowledgements
We would like to thank the following for their unwavering support and assistance during the study’s data gathering and literature search and formatting of the article. Local government units (35 provinces and highly urbanized areas of the study). Municipal mayors, city and municipal health officers, nutrition action officers, and midwives. National Nutrition Council. Nutrition Assessment and Monitoring Division, Department of Science and Technology, Food and Nutrition Research Institute. Lifestage Nutrition Section Staff: Tracy Adelaide S. Sanchez, Joana Dorothy V. Amolo, Dayana K. Bernardo, Diana L. Domdom, Victor Ehman D. Monzon, Krsna Jessamyn M. Mercado, and Jenny Rose J. Desepeda.
ORCID iDs
Ethical considerations
The Food and Nutrition Research Institute Institutional Ethics and Review Committee (FIERC) approved the study with protocol code FIERC-2021-003 dated October 12, 2021. The submitted study protocol to the FIERC clearly outlined in the methodology that data collection would occur through phone interviews. The study conforms to the ethical principles of the Declaration of Helsinki, 2013.
Consent to participate
All study participants gave verbal consent before the start of the data collection from the study participants as well as from their parents or legally authorized representatives. Patient anonymity was preserved by providing a name code in the documents.
Consent for publication
In the informed consent form, the research team explained thoroughly to the study participants the sharing of research results as follows: The results will be in an aggregated format to ensure the anonymity and confidentiality of participants’ data. The findings will be presented during the Food and Nutrition Research Institute (FNRI) seminar series, published in a scientific journal, and presented to various fora.
Author contributions
Funding
The authors received no financial support for the research, authorship, and/or publication of this article.
Declaration of conflicting interests
The authors declared no potential conflicts of interest with respect to the research, authorship, and/or publication of this article.
Data availability statement
The data that support the findings of this study are available on request from the corresponding author, R.D.F. They are not publicly available because they contain information that could compromise the privacy of the study participants.
Supplemental material
Supplemental material for this article is available upon request.
References
Supplementary Material
Please find the following supplemental material available below.
For Open Access articles published under a Creative Commons License, all supplemental material carries the same license as the article it is associated with.
For non-Open Access articles published, all supplemental material carries a non-exclusive license, and permission requests for re-use of supplemental material or any part of supplemental material shall be sent directly to the copyright owner as specified in the copyright notice associated with the article.