
Abstract
Background:
Musculoskeletal changes occur during pregnancy; one-half of pregnant women experienced low back pain and/or pelvic pain during pregnancy. Prescription opioid use for Medicaid enrolled pregnant women has increased dramatically due to severe low back pain/pelvic pain.
Objectives:
This study aimed to explore the prevalence of low back pain/pelvic pain and related risk factors among a broader population.
Design:
This is a retrospective cohort study.
Methods:
This study utilized de-identified Medicaid claims data provided by the South Carolina Revenue and Fiscal Affairs Office, including individuals who gave birth between 2016 and 2021 during pregnancy. Low back pain/pelvic pain and a group of musculoskeletal risk factors were identified with International Classification of Diseases v10. Comparisons were made for the prevalence of low back pain and pelvic pain between those with pregnancy-related musculoskeletal risk and those without.
Results:
Among 167,396 pregnancies, 65.6% were affected by musculoskeletal risk factors. The overall prevalence of low back pain was 15.6%, and of pregnancy-related pelvic pain was 25.2%. The overall prevalence for either low back pain or pelvic pain was 33.3% (increased from 29.5% in 2016 to 35.3% in 2021), with 24.6% being pregnancy-induced. Pregnancies with musculoskeletal risk factors were more likely to be diagnosed with low back pain (20.7% versus 5.7%, p < 0.001) or pelvic pain (35.3% versus 6.0%, p < 0.001) than those without.
Conclusion:
This study found a very high prevalence of musculoskeletal risk and a high prevalence of low back pain or pelvic pain, with an increasing trend, among South Carolina pregnancies enrolled in Medicaid during the period 2016–2021. Most of the diagnosed low back pain or pelvic pain were pregnancy induced. Musculoskeletal risk factors were associated with low back pain or pelvic pain.
Introduction
Although the exact mechanisms remain unclear, musculoskeletal (MSK) and hormonal changes, neuromuscular adaptations, and lack of exercise may contribute to pregnancy-related lumbopelvic pain. 1 Three main MSK changes occur during pregnancy: weight gain and a subsequent shift of the center of gravity; stretched abdominal muscles; and ligamentous laxity (LL) and joint hypermobility. 2 While these changes are necessary for the growth of healthy fetus, they have direct and indirect health consequences on the pregnant woman through increased morbidities and mortalities.3,4
Among the many conditions that develop during pregnancy, low back pain and pelvic pain are the two most common. Almost half of pregnant3,5 women experienced low back pain (LBP) and/or pelvic pain (PP) during pregnancy. Furthermore, almost two-thirds of these pregnant women still report these conditions at 6~10 weeks postpartum.
Given the high prevalence of these two conditions, chronic pain management during pregnancy has raised concerns. 6 In addition to activity limitations and a reduced health-related quality of life, low back pain and pelvic pain during pregnancy can be severe and may require medication treatment.7,8 Evidence shows that prescription opioid use for Medicaid enrolled pregnant women has increased dramatically. 9 However, there was no adequate evidence to explain the possible birth outcomes due to the use of prescription opioids during pregnancy to treat these MSK issues. 10 Furthermore, geographic variation of opioid use during pregnancy has been reported.9,11 Therefore, an expanded knowledge of the prevalence of low back pain and pelvic pain during pregnancy can guide prevention and management of these two conditions.
Current available prevalence data were reported from studies where participants were recruited from a limited number of clinics, which limits the generalizability. Prevalence rates of these musculoskeletal conditions have not been assessed across larger populations using administrative data (e.g. Medicaid claims). Since Medicaid provides coverage for 41% of all births nationwide, 12 and 46.4% in South Carolina 13 in 2021, these data represent a broader population than traditional prevalence data currently use. This study explored the prevalence of pregnancy-related low back pain (PLBP) and PP and related risks using South Carolina Medicaid claims during the period 2016–2021.
Materials and methods
Data and sample
De-identified Medicaid claims data were provided by the South Carolina Revenue and Fiscal Affairs (SCRFA) Office covering the period 2015–2021. These data include all associated medical claims for mothers who gave birth between 2016 and 2021 during the gestational period leading up to delivery. The SCRFA office facilitated the identification of live births and established maternal and infant linkages through vital records. The study received exemption from the Institutional Review Board at the authors’ institute, as it involved secondary analysis of de-identified administrative data. This study followed the Strengthening the Reporting of Observational Studies in Epidemiology (STROBE) guidance for cohort studies.
This study identified 167,396 live births (from 134,823 unique individuals) during the 2016–2021 period. The full date of birth (DOB) of the infant was not released due to privacy concerns. However, as allowed by our data use agreement, and using previously published algorithms14,15 as guidance, DOB was estimated by using the dates of service and International Classification of Diseases (ICD) associated with the claims and appended to SCRFA-provided year of birth. A similar method for this estimation had been previously 16 applied.
For this study, a new variable, the number of days from initial claims to the delivery date, was approved and released by SCRFA to the study group. This variable provided a more reliable and valid estimate of DOB compared to previous methods. The last menstrual period was estimated based on the estimated DOB and gestational week information captured by ICD-10. Pregnancy with estimated gestational age shorter than 5 months were excluded, 15 leaving 156,294 pregnancies. All analyses were conducted at the pregnancy level.
Observed musculoskeletal risk factors/conditions
This study created a series of variables for identifying MSK risk factors using ICD-10 codes associated with the claims. These variables included body mass index (BMI), overweight/obesity, diagnosed excessive weight gain (EWG), diagnosed excessive fetal growth (EFG), diagnosed diastasis of rectus abdominis (DRA), and diagnosed LL. The ICD-10 codes utilized to identify LBP and PP are shown in Appendix Table 4. Two prevalence measures were utilized: the overall prevalence including all diagnoses, and the pregnancy-induced prevalence including diagnoses with a preceding MSK risk. Based on the date sequence of those diagnoses, pregnancy-induced LBP/PP was identified if the date of any MSK risk factor was before or the same date of diagnosis of LBP/pregnancy-related pelvic pain (PPP). Two additional variables were created to gauge the prevalence of LBP and PP: one variable determined whether a patient had been diagnosed with both LBP and PP, while the other assessed whether a patient had received a diagnosis of either LBP or PP.
BMI was classified into five levels: not overweight (BMI < 25), overweight (25 ⩽ BMI < 30), obesity I (30 ⩽ BMI < 35), obesity II (35 ⩽ BMI < 40), and obesity III (BMI ⩾ 40). While this static classification provides a foundation, it is essential to assess dynamic BMI changes for fetal growth during pregnancy. The methods employed in this study were guided by the Institute of Medicine recommendation 17 for weight gain during pregnancy. For a woman with normal weight, the recommended total weight gain is 4.4 lbs. in the first trimester and 13 lbs. in the second and third trimesters. Unfortunately, weight information is not available in the Medicaid claims data, and neither is height information. Therefore, BMI information and gestational week were used, along with an assumed average height of American women 18 of 63.5 inches, as a proxy. The number of fetuses was also considered in this dynamic evaluation, and the recommended BMI increase was estimated using the following algorithm

where
By incorporating both static and dynamic BMI information, this study categorized pregnancies into three groups with a high-risk weight profile: the first group consisted of those in the first trimester with BMI > 30 + 2; the second group comprised those in the second or third trimesters with a single fetus or missing fetus information (95% pregnancy with the fetus number were single fetus) and BMI > 30 + (gestational week × 0.38); and the third group included those in the second or third trimesters with multiple fetuses and BMI > 30 + (gestational week × (number of fetuses + 1) × 0.19).
A single dummy variable, named “pregnancy-related MSK risk,” was created to indicate whether there was an increased risk for LBP and PP. Pregnancies with high-risk weight, EWG, EFG, DRA, or LL were categorized as “yes” for MSK risk factors, while others were labeled as “no.”
Statistical analysis
Descriptive analyses were conducted for MSK risk factors, all specific risks, and LBP and PP. By using the chi-square test, comparisons were made for the prevalence of LBP and PP between those with MSK risk factors and those without. Prevalence was summarized for all Medicaid beneficiaries and those with full enrollment (Medicaid coverage throughout pregnancy), respectively. Statistical analyses were performed using SAS software version 9.4 (SAS Institute Inc., Cary, NC) with an alpha = 0.05.
Results
Table 1 summarized demographics, rates of pregnancy-related MSK risk factors, and the prevalence of LBP and PP for pregnancies included during the years 2016–2021. Approximately, one-fifth of the pregnancies were not the woman’s first pregnancy. The majority of pregnancies (90.8%) occurred in women aged 15–35. Most pregnancies (84.2%) had Medicaid coverage for at least three trimesters.
Demographics and rates of pregnancy-related musculoskeletal risk factors among South Carolina Medicaid beneficiaries with live births, 2016–2021.

MSK: musculoskeletal; BMI: body mass index.
Table 1 summarizes the MSK risk factors and specific pregnancy-related MSK risk factors. During the period 2016–2021, MSK risk factors affected 65.6% of the included pregnancies. Based on static and dynamic BMI criteria, 2.5% of pregnancies were classified as high-risk weight profiles. Using ICD-10 codes, 62.6% pregnancies were associated with EWG, 7.7% with EFG, 1.7% with DRA, and 51 (0.0%) pregnancies with LL.
Prevalence rates of LBP and PP during the period 2016–2021 are reported in Table 1. The overall prevalence of LBP was 15.6%, with 10.7% being pregnancy-induced LBP. The overall prevalence of PP was 25.2%, with 18.9% pregnancy-induced PP. The distribution of the first diagnosis by trimester for each condition showed that the number of LBP cases accumulated at an increasing rate (first trimester: 2.8%, second trimester: 5.7%, and third trimester: 7.1%), while the number of PP cases accumulated at a decreasing rate (first trimester: 9.6%, second trimester: 8.1%, and third trimester: 7.6%). When considering both LBP and PP, the overall prevalence was 7.5%, and 5.1% was pregnancy-induced. In addition, the overall prevalence for either LBP or PP was 33.3%, with 24.6% being pregnancy-induced.
Annual trends of pregnancy-related MSK risk factors are shown in Table 2. Risks of EWG and DRA increased over time, while the risk of EFG decreased in general. The rates of high-risk weight profiles increased from 2016 to 2018 and then decreased by 2021.
Annual rates of pregnancy-related musculoskeletal risk factors among South Carolina Medicaid beneficiaries with live births, 2016–2021.

BMI: body mass index.
The total sample size = 156,294.
Figure 1 displays the annual trends in the prevalences of individual LBP/PP. Although the difference in the increasing trends of overall prevalences of LBP (18%) and PP (23%) was small (5%), the difference in pregnancy-induced LBP (9%) and PP (40%) was substantial (31%) during the period 2016–2021. Annual prevalences and confidence intervals were reported at Appendix Table 4.

Annual trends of prevalences of individual pregnancy-related low back pain and pelvic pain, among South Carolina Medicaid beneficiaries with live births, 2016–2021.
Figure 2 summarizes the annual trends in the prevalences of combined LBP/PP. The prevalence of those diagnosed with both LBP and PP increased from 6.4% in 2016 to 8.1% in 2021 (26% increase). In addition, those diagnosed with either LBP or PP increased from 29.5% in 2016 to 35.3% in 2021 (20% increase; see Appendix Table 5)

Annual trends of prevalences of combined pregnancy-related low back pain and pelvic pain, among South Carolina Medicaid beneficiaries with live births, 2016–2021.
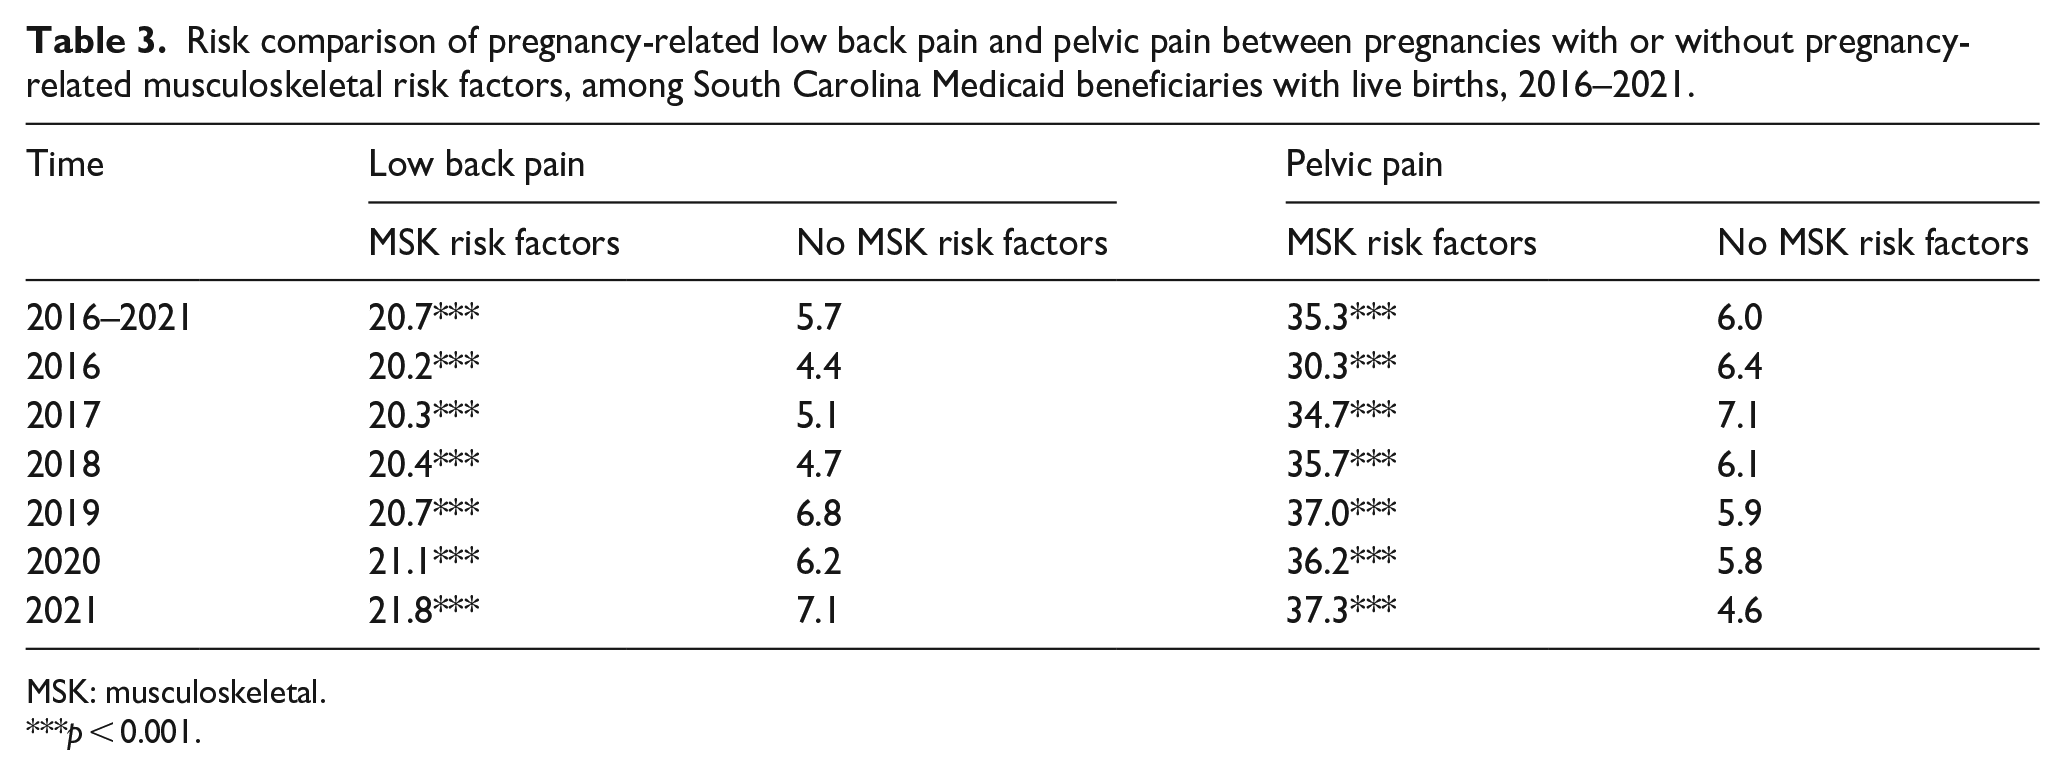
The LBP and PP prevalence among those with or without MSK risk factors is summarized in Table 3. Pregnancies with MSK risk factors were more likely to be diagnosed with LBP (20.7% versus 5.7%, p < 0.001) or PPP (35.3% versus 6.0%, p < 0.001) than those without.
Risk comparison of pregnancy-related low back pain and pelvic pain between pregnancies with or without pregnancy-related musculoskeletal risk factors, among South Carolina Medicaid beneficiaries with live births, 2016–2021.
MSK: musculoskeletal.
p < 0.001.
Figure 3 presents the annual trends of prevalences of individual LBP/PP for all Medicaid beneficiaries and those with full enrollment during pregnancy. Those with full enrollment during pregnancy had a higher prevalence of LBP/PP than other Medicaid beneficiaries.

Annual trends of prevalences of individual pregnancy-related low back pain and pelvic pain, among South Carolina Medicaid all beneficiaries and those with full enrollment during pregnancy, 2016–2021.
Discussion
This study found a very high prevalence of MSK risk factors (65.6%) and a high prevalence of LBP or PP (33.3%) among pregnant South Carolina persons enrolled in Medicaid from 2016 to 2021. Most of the diagnosed LBP or PP cases were pregnancy induced. Among the MSK risk factors contributing to LBP or PP, diagnosed EWG was predominant one. In addition, the study observed an increasing prevalence of LBP or PP during the study period.2,19 –21
As summarized in a previous review, 5 the prevalence of LBP/PP varied substantially, ranging from 3.9% to 89.9% with an average of 45.3%. The review also pointed out that diagnosis/self-report and exclusion/inclusion of high back pain significantly impact the estimated prevalence. Sample size also played an important role in prevalence estimation; among included studies with a sample size more than 1000 and excluded high back pain, doctor diagnosed PPP resulted in a prevalence range of 14.2% to 23.6%. In this study, clinical diagnosis was employed instead of self-reported pain. In addition, high back pain was automatically excluded from this study as ICD-10 codes associated with it were not included. This study also had a substantial sample size, with 156,294 individual cases; the smallest sample size for the prevalence of LBP/PP among pregnancies with full Medicaid enrollment in 2016 being 15,750. The prevalence of PP in this study was 25.2% during the study period and increased from 21.5% to 26.5%. Given that the review was published in 2004 and considering that EWG was identified as the most common risk factor and that the prevalence of overweight/obesity has increased in the past decade, 22 the estimated prevalence in this study aligns with that review.
Among all MSK risk factors, EWG is predominant in this study. A recent study reported high (48%–59%, for each race/ethnicity in 2019) and increasing prevalences (increased 14%–25% for each race/ethnicity) of overweight and obesity among nulliparous women in the United States by race/ethnicity from 2011 to 2019. 22 The proposed strategy to address this issue can be divided into two steps: conceiving at a normal BMI value and gaining weight appropriately during pregnancy. Specifically, raising the awareness of EWG risk for women, providing consultation on diet and nutrition, offering individualized nutrition services, and giving personalized assessment and suggestions for physical activity should be integrated into the cultural setting. All services should be flexible and adjustable to patients’ affordability. 4
Examining these conditions can be challenging for several reasons. The first is that even with a high prevalence for both conditions, diagnosis can be difficult since pain is subjective, and health care providers would need to exclude many other similar conditions. 2 The second is the shortage of rheumatologists and obstetricians/gynecologists in the United States, particularly in rural areas. The gap of supply and demand for rheumatologists is predicted to be at 4729 open provider positions by 2030.19,20 The gap for obstetricians/gynecologists was estimated to be nearly 5170 by 2030. 21 Therefore, there is an inadequate number of providers who can make an appropriate diagnosis.
Health insurance can also limit access to healthcare and lead to underestimation of the prevalence of LBP/PP. The prevalence of LBP among those with full Medicaid enrollment was higher during the entire study period and increased from 17.0% in 2016 to 19.2% in 2021 compared to that among all Medicaid beneficiaries (14.4%–16.9%). The prevalence of PP among those with full Medicaid enrollment was also higher during the entire study period and increased from 25.2% in 2016 to 30.6% in 2021 compared to that among all Medicaid beneficiaries (21.5%–26.5%).
These results can also be utilized to inform policy going forward. First, policies aimed at boosting workforce of rheumatologists and obstetricians/gynecologists can effectively address this high prevalence. Second, appropriate preventive strategies, such as screening for opioid use, can be targeted for pregnant women with severe chronic pain, including LBP/PP. Third, by closely working with health care providers, policymakers may encourage non-pharmaceutical treatment for LBP/PP under the guidelines, while not completely excluding opioid use from the treatment arsenal. 23
Among the three aforementioned physical changes during pregnancy, the rates of DRA and LL were far lower than the prevalence of LBP/PP. This could be due to the actual low rate among pregnancy or potential underdiagnosis. Future studies may keep screening but not rely on it in predicting LBP/PP. Scholars who have access to the Beighton scales or similar instruments can report a clearer picture about LL prevalence and severity.
Several methods can be improved in future studies. First, among all identified pregnancy-related MSK risk factors, EWG is the most commonly identified risk. Therefore, the definition of detectable MSK risk factors may need refinement in the future, and its association with LBP/PP could have been underestimated in this study. Second, diagnosed PLBP/PPP in successive pregnancies of the same pregnant women may be related. The prevalence of LBP/PP in this study was not estimated based on the number of pregnancies. Future studies could estimate the incidence and prevalence of LBP/PP for primigravida and multigravida. Third, the risks and conditions related to MSK in this study were identified from ICD-10 codes. While the study team conducted a literature review and screened all ICD-10 codes, having a certified coder review those codes would be optimal. Future studies may validate the methodology for identifying MSK-related risk factors and conditions during pregnancy. Finally, the pregnancy episode identified with claims data is subject to potential algorithm flaws. Correct identification of pregnancies can improve the validity of prevalence estimates.
Conclusion
This study found that the prevalence of LBP was 15.6% and that of PP was 25.2% among all South Carolina beneficiaries during the period 2016–2021. Both prevalence of LBP and PP increased from 2016 to 2021. One-third of pregnancies (33.3%) were diagnosed with either LBP or PP, and the prevalence was increasing. MSK risk factors were associated with LBP or PP. It is necessary to implement a systematic strategy to address the predominant EWG risk.
Footnotes
Appendix 1
Annual prevalences and 95% confidence interval of individual pregnancy-related low back pain and pelvic pain, among South Carolina Medicaid beneficiaries with live births, 2016–2021.

| Time | LBP | PILBP | PP | PIPP | LBP & PP | LBP or PP |
|---|---|---|---|---|---|---|
| 2016 | 14.4 (13.9, 14.8) | 10.4 (10.0, 10.8) | 21.5 (21.0, 22.0) | 15.2 (14.8, 15.6) | 6.4 (6.1, 6.7) | 29.5 (28.9, 30.0) |
| 2017 | 15.1 (14.7, 15.5) | 10.5 (10.1, 10.8) | 25.3 (24.8, 25.8) | 18.2 (17.7, 18.6) | 7.3 (7.0, 7.7) | 33.1 (32.5, 33.6) |
| 2018 | 15.1 (14.6, 15.5) | 10.7 (10.4, 11.1) | 25.6 (25.1, 26.1) | 19.3 (18.8, 19.7) | 7.5 (7.2, 7.8) | 33.2 (32.6, 33.7) |
| 2019 | 16.1 (15.7, 16.6) | 10.8 (10.4, 11.2) | 26.7 (26.2, 27.2) | 20.2 (19.7, 20.7) | 7.9 (7.6, 8.2) | 34.9 (34.3, 35.5) |
| 2020 | 15.8 (15.4, 16.3) | 10.8 (10.4, 11.2) | 25.5 (25.0, 26.1) | 19.4 (18.9, 19.9) | 7.6 (7.2, 7.9) | 33.8 (33.2, 34.4) |
| 2021 | 16.9 (16.5, 17.4) | 11.3 (10.9, 11.7) | 26.5 (25.9, 27.0) | 21.3 (20.8, 21.8) | 8.1 (7.8, 8.4) | 35.3 (34.7, 35.9) |
LBP: low back pain; PILBP: pregnancy-induced low back pain; PP: pelvic pain; PIPP: pregnancy-induced pelvic pain.
Acknowledgements
We would like to acknowledge support from the South Carolina Revenue and Fiscal Affairs Office by approving and providing us the free access to South Carolina Medicaid Claims data. That support made this study possible.