
Abstract
While achievement gaps have been well-established, much remains to be understood about the manner and extent to which school leadership either increases or decreases student access to opportunity to learn. The current study uses nationally representative samples of U.S. and Flemish students in Grade 4 from the 2011 Trends in International Mathematics and Science Study (TIMSS2011) to test a series of structural equation models. U.S. and Belgium have contrasting academic tracking (formal vs informal) systems and Gini Index scores (economic inequality). Flemish schools had no significant paths between student family resources, instructional leadership, and learning; however, for the U.S., we found a negative path across these measures. This current study extends the instructional leadership literature by demonstrating that school leaders can implement goals intended to close achievement gaps but instead might unintentionally exacerbate them.
Keywords
The ever-increasing income disparities between the upper and lower class are often reflected in opportunity gaps within schools (Putnam, 2016; Reardon, 2011). In fact, while the racial and ethnic histories of countries differ, their economic effects can be measured in the distance between those with access to prosperity and those without (e.g., the Gini index). Compared to other countries, the U.S. Gini index is high, ranked 41st in economic disparity out of the 156 countries included in the World Fact Book (U.S. CIA, 2018). Canada, a North American neighbor, ranks 117th, meaning that they have a lower income disparity compared to most other countries in the world (U.S. CIA, 2018). Further, these disparities in the U.S. are also represented in the international comparisons of academic achievement. Using the most recent PISA 2015 (Program for International Student Assessment) results, which tests students closest to graduation as compared to other large international assessments, the U.S. scored well below the international average in mathematics (OECD, 2016). Students performed lower on mathematics compared to the other content areas, both reading and science (OECD, 2016). By the time U.S. students reach high school, their learned mathematic skills are likely underperforming the international average, and, long term, these scores might predict fewer opportunities to increase their income level compared to their parents (Bowles and Gintis, 2002; Putnam, 2016).
This link between socioeconomic status and achievement scores has been well-established in the U.S. and internationally; however, these effects have been shown to vary by school characteristics (Chiu & Chow, 2014; Sirin, 2005). Scholars have argued that U.S. schooling is surreptitiously structured in response to the needs of a broader political and economic system predicated on inequality rather than the needs of individual student learning and social mobility (Bowles and Gintis, 1976). One important way this is structured in U.S. schools is through differential access to either special, vocational, or academic curricular tracks, sometimes hidden within course offerings and their delivery, which shape corresponding opportunity and access to college as well as high-paying or high-prestige jobs (Bottia et al., 2016; Giersch, 2016; Jones and Schneider, 2009; Oakes, 1982). These schooling structures have reinforced and, perhaps, exacerbated intergenerational economic inequality (Bowles and Gintis, 1976, 2002).
Belgium provides an interesting contrast to the case of U.S. schooling. Belgium ranks 149th out of 156 countries in the Gini index, one of the lowest in the world (U.S. CIA, 2018). In addition, on the 2015 PISA assessment, Belgium scored well above the international average (OECD, 2016). Interestingly, while the U.S. has less-identified or informal tracking or differential curricula which produces stratification, Belgium has a formalized system which explicitly sorts students into distinct tracks (Track A and B) to prepare for post-high school transitions (Boone and Van Houtte, 2013a). Flemish students, parents, and teachers collectively decide where to place each student within these tracks (Boone and Van Houtte, 2013a; 2013b). However, in the U.S., the differences in curricula received by students are much more implicit and complex; curricula vary by school resources and structures, course offerings, teacher delivery, and student perception and background (Bottia et al., 2016; Darling-Hammond, 1996; Giersch, 2016; Oakes, 1985, 2005; Porter, 2002). Thus, a comparison of these school and student paths to academic success across both contexts would provide insight into how U.S. schools, compared to Flemish schools, might be structuring inequitable opportunity.
Current study
Since the 1960s, U.S. researchers and policymakers have considered ‘opportunity to learn’ as a policy lever and research concept for assessing student access to equitable educational experiences (Schmidt and Maier, 2009). However, opportunity to learn has also been used in international/comparative research to inform the sequence and depth of curriculum (McDonnell, 1995; Schmidt and Houang, 2012; Schmidt and Maier, 2009) as well as to examine the extent to which access to appropriate and rigorous content might mediate the effects of economic disadvantage on achievement across countries (Schmidt et al., 2015). A student’s opportunity to learn is differentiated through various characteristics of schools and their personnel—for example, enactment of school curriculum, institutional tracking practices, resource distribution, quality of school facilities, and teacher experience and support (Darling-Hammond, 1996; McKnight et al., 1987; Oakes, 1985; O’Day and Smith, 1993). Thus, from a policy perspective, increasing the standards of performance for teaching and learning does not address problems of inadequate resources, instructional capacity, and the affordance of quality professional learning that contribute to the inequitable distribution of learning opportunities within the school or classroom (Darling-Hammond, 1996; O’Day and Smith, 1993; Springer et al., 2009).
Despite its relevance to other key schooling inputs and processes, one important factor whose role in addressing student opportunity to learn has remained elusive is that of school leadership (Elmore, 2000; Hallinger and Heck, 1996). The ability of school leadership to organize the teaching and learning processes of a school through their instructional leadership and capacity-building practices might, we argue, substantially influence patterns of opportunity to learn among students within a school (Elmore, 2000; Hallinger and Heck, 1996; Hallinger and Murphy, 1985; Marks and Louis, 1999; Ogawa and Bossert, 1995). To succeed in ameliorating opportunity to learn disparities, schools which adopt curriculum reform to help improve opportunity to learn will need to build teacher capacity through school supports, resources, and learning opportunities. Principals are in a unique position to direct these efforts through their leadership (Marks and Printy, 2003; Robinson et al., 2008). Both economic and leadership perspectives on educational opportunity have argued for a student-centered approach, like instructional leadership (see Robinson, 2011), to address individual needs to gain access to opportunity (Bowles and Gintis, 1976). While achievement gaps have been well-established, much remains to be understood about the manner and extent to which school leadership either increases or decreases student access to opportunity to learn.
The current study uses nationally representative samples of U.S. and Flemish students in Grade 4 from the 2011 Trends in International Mathematics and Science Study (TIMSS2011) to test a series of structural equation models. TIMSS is the only international survey which contains measures of leadership, resources, teachers, and students at a time early enough in students’ academic trajectories (Grade 4) when they are not too far along into either their formal or informal tracks. Therefore, this research is designed to address the following study aims:
Aim 1: To investigate the pathways through which instructional leadership influences math opportunity to learn.
Aim 2: Using these pathways, to examine the extent to which instructional leadership and math opportunity to learn mediate the influence of family academic resources on math learning.
Literature review
Opportunity to learn, socioeconomic status, and math learning
The study of opportunity to learn as a research construct is important because it has been found to possibly reduce the effects of socioeconomic status on student math learning (Schmidt et al., 2015). While the measurement of opportunity to learn has evolved over time—from how to measure student access to curricula to the inclusion of instructional processes and quality—much of the existing research has primarily defined OTL as content coverage and has examined its relationship to student achievement as measured by standardized tests. This focus on content in the operationalization of OTL is reflected in the work of Schmidt and colleagues, which includes analysis of curricular documents, such as curriculum standards, textbooks, course offerings, time allotted to content topics, and students’ familiarity with and frequency of exposure to content topics (see Cogan et al., 2001; Houang and Schmidt, 2008; Schmidt, 1993; Schmidt et al., 2015; Schmidt and Burstein, 1993; Schmidt, Cogan, Houang and McKnight, 2011a, 2011b; Schmidt and Maier, 2009; Schmidt and McKnight, 2012; Schmidt et al., 1993; Schmidt et al., 2013).
While other scholars have expanded this definition of OTL to include factors such as instructional practices and processes, teacher expertise and experience, and resources (see Aguirre-Muñoz and Boscardin, 2008; Andrews, 2003; Elliott, 1998, 2015; Goertz, 1994; Herman and Klein, 1996; Kurz et al., 2014; Muthén et al., 1995; Oakes, 1990; Wang, 1998), Schmidt et al. (2011a) have justified a more narrow focus on content by arguing that, “…the factors of production are relevant only if the actual content that serves as the focal point of instruction is truly equal” (Schmidt and Maier, 2009: p. 542). Schmidt and colleagues’ extensive body of work has demonstrated the relationship between math OTL (as defined by content coverage) and math achievement (Schmidt et al., 2001, 2011a, 2013) and has identified OTL as a path to possibly reduce the effects of SES on math achievement (Schmidt et al., 2015).
Extended measures: OTL as content and instruction, math learning as reasoning skills, and math efficacy
While content has an important place at the center of our understanding of OTL, there are several barriers to learning that would suggest exposure to content is insufficient as a sole indicator of OTL. According to Starratt (2003), OTL also includes dispositional developmental, linguistic, cultural, and disability measures to ensure access to learning. Thus, the equitable delivery of content through instruction is also a critical aspect of opportunity to learn, which calls attention to the teacher’s key role (Hattie, 2012). Teachers leverage available resources and instructional strategies to help ensure that content is not just presented, but is learned (Porter, 2002). Porter (2002) has discussed that it is through teachers’ instruction that students are presented with higher cognitive demand tasks, such as application and reasoning with the content, which is in contrast to knowledge of facts alone. Rather than compromise the empirical value of the construct, extending the definition of OTL to include instruction reflects a more nuanced approach to understanding differential educational experiences. These broader goals speak to the need to incorporate additional measures that help explain students’ differential experiences and outcomes in school. One such additional measure could be teacher instructional goals, which have proven to have implications for elementary students’ engagement in learning (Hughes et al., 2011).
Another such construct—student self-efficacy—can be enhanced through effective classroom structures (Usher, 2009) and has been found to be a strong predictor of several important outcomes, including academic achievement, course selection, and career decisions (Britner and Pajares, 2006). Self-efficacy refers to students’ beliefs about their academic capabilities (Usher, 2009). These beliefs influence students’ motivation, effort, and persistence (Bandura, 1977; Britner and Pajares, 2006). This would suggest that OTL, as an integral part of students’ experience in the classroom, would influence student efficacy, which in turn would help explain differential student outcomes. In particular, school segregation and tracking practices (see Dauber et al., 1996; Oakes, 1985, 1990; Tate, 1995) might be one way that students have differential access to OTL and, consequently, receive different messages about their academic capabilities that shape their sense of self-efficacy. In primary education, Agirdag et al. (2012) found empirical evidence for the effect of school ethnic composition on students’ self-esteem which is mediated through students’ experience of support by the teacher. For these reasons, when measuring achievement, it is important to capture higher cognitive demand (see Porter, 2002), such as math reasoning, the instructional strategies which promote it, as well as student self-efficacy about their learning experiences to gauge the rigor received in the classroom.
School leadership and structures as predictors of math OTL
Although teachers are instrumental to the provision of OTL because of their proximity to students, instructional practices are also shaped by many school factors such as school supports and instructional leadership. Thus, a thorough examination of the potential predictors of math OTL should address the teacher and school characteristics that influence classroom content and instruction. School leadership has been neglected in the OTL literature despite findings of principals’ indirect influence on school effectiveness and student achievement (Hallinger and Heck, 1996, 1998). In particular, principal instructional leadership is relevant to OTL because of its focus on the “core business of teaching and learning” (Robinson et al., 2008: p. 664) and its greater impact on student outcomes as compared to other leadership types (see also Hallinger and Heck, 1996; Marks and Louis, 1999; Marks and Printy, 2003). School leaders influence student learning through their work with teachers that results in changes in instructional practice (Supovitz et al. 2010). This involves garnering support for and commitment to a shared vision and goals for teaching and learning (Hallinger and Heck, 1998). Another important function of instructional leadership is providing feedback to support instructional improvement (Blase and Blase, 1999). Principals help shape and support broad school expectations for learning through, for example, goals, enforcement of academic standards, opportunities for teacher growth and development, and monitoring student progress (Hallinger and Murphy, 1985). In addition, it incorporates activities more directly related to individual teachers’ work in classrooms, such as supervision and evaluation (Hallinger and Murphy, 1985). More recent models of instructional leadership have included a more distributed or democratic conception (Gumus et al., 2018) that acknowledges other formal and informal leadership roles within the organization beyond the school principal (Lee et al., 2012; Marks and Printy, 2003; Neumerski, 2013).
In addition to setting direction through goals and expectations, providing meaningful feedback to teachers, and promoting teacher growth and development, more recent iterations of instructional leadership have also incorporated strategic resource allocation—including decisions about staffing and instructional materials—as another means of meeting student learning needs (Robinson, 2011). Furthermore, principal behaviors which support the cultivation of shared norms and expectations for teaching and learning, professional growth, school improvement, and collaboration assist in building school-wide teacher capacity (Blase and Blase, 1999; Hoy and Hannum, 1997; Leithwood and Mascall, 2008; Marks and Louis, 1999; Schmidt and McKnight, 2012). First, school leaders play a significant role in establishing a learning climate that reflects important goals and expectations for student achievement, including the establishment of academic press, as well as normative supports, like morale, which facilitate a positive student learning environment (Bryk et al., 2010; Hallinger et al., 1996; Hoy et al., 2006; Hoy and Hannum, 1997; Urick and Bowers, 2011, 2014). Teacher professional community is another important school support influenced by school leaders (Blase and Blase, 1999; Frank et al., 2004; Hallinger and Heck, 1998; Louis and Marks, 1998; Marks and Louis, 1999; Supovitz, Sirinides, & May 2009) and refers to the collective capacity of school staff to engage in professional learning and collaboration to improve their teaching (Bryk et al., 2010; NRC, 2011). School leaders also help ensure the availability of subject-specific resources (Darling-Hammond, 1996; Hoy and Hannum, 1997; O’Day and Smith, 1993; Spillane et al., 2003), a third school support that reflects an emphasis on teaching and learning and affects teachers’ abilities to provide equitable instruction (NRC, 2011; O’Day and Smith, 1993). School supports have important implications for OTL because of their influence on teacher preparedness, which includes their knowledge and confidence in content and instruction, as well as participation in professional development (Leithwood and Mascall, 2008; Marks and Louis, 1999; Marks and Printy, 2003).
Why compare the U.S. and Belgium?
Comparisons between the U.S. and Flemish educational context are useful because similar problems with tracking have been expressed for each of the two countries. Of primary concern in both the U.S. and Belgium is the disproportionate representation of low-income students in lower tracks (Boone and Van Houtte, 2013a), and these concerns also extend to race/ethnicity (Dauber et al., 1996; Oakes, 1985, 1990; Tate, 1995). Despite these similarities, the tracking systems in the U.S. and Belgium differ in important ways. In Belgium, the tracking system is similar to other European education systems in that it is more formalized and explicit. When students transition from primary to secondary school, Flemish families make an explicit choice to enroll in one of two different tracks—A-stream and B-stream—that channels students into even more specific tracks as they progress through the secondary grades (Boone and Van Houtte, 2013a). The A-stream channels students into general/academic, technical, and artistic tracks and the B-stream prepares for the vocational track (Boone and Van Houtte, 2013a). The selected tracks—general/academic, technical, artistic, and vocational—are transparent in that they clearly reflect students’ prospective careers and social class. In contrast, tracking in the U.S. is less explicitly acknowledged and enrollment in lower tracks does not involve families making a formal decision at a designated point in students’ academic career.
Despite these systematic differences in tracking between the U.S. and Belgium, in both systems it is difficult for students to change to a more advanced track at a later time due differences in coursework between tracks (Boone and Van Houtte, 2013a; Oakes and Guiton, 1995). Another similarity between the two countries is the influential role of school staff in student placement decisions. Because students in Flanders do not take a standardized test at the end of primary school and input from school staff is not binding in the selection of tracks, Boone and Van Houtte (2013a) have described the Flemish educational system as “very open to individual decision-making” (p. 555); however, they also found that student socioeconomic background influenced teachers’ track recommendations, an important source of information for parents (Boone and Van Houtte, 2013b). Similarly, Oakes and Guiton (1995) found that student background characteristics influenced teachers’ perceptions of student motivation and ability, and this informed student placement decisions, a finding that reinforced concerns that U.S. tracking systems are not as meritocratic as they might seem.
Beyond tracking, there are policy and contextual differences between the U.S. and Belgium that might influence the distribution of OTL. Schmidt et al. (2015) found that while there were larger between-school gaps in OTL for Flemish students, the U.S. exhibited particularly high within-school inequality in OTL. Further, according to Schmidt et al. (2015), “the relationship of OTL to achievement and of SES to OTL are among the strongest of the 32 other wealthiest nations” and “these two relationships lead to the United States having essentially half of the within-school relationship of SES to mathematics literacy due to the link between SES and OTL” (p. 381). These findings suggest that addressing differential student access to OTL is key to addressing inequities in educational outcomes, and this calls for closer examination of policies and practices that influence the content and instruction that students receive.
Furthermore, U.S. teacher preparation is extremely varied and highly decentralized with great variation in future teachers’ experiences with mathematics and mathematics pedagogy (Schmidt et al., 2012). Initial teacher education in Flanders is more centralized and highly regulated. Primary teachers in Flanders are prepared in a 3-year higher education college program (professional bachelor’s degree) involving pedagogy for the age range and subject content and school-based experience with sustained periods of supervised teaching in a number of schools. Access to teacher education programs is open to all who have successfully completed secondary education. Quite a large proportion of student teachers now come from the technical secondary education track and their pass rates are relatively low compared to students from the general/academic secondary track in secondary education. This raises questions in Flanders about how well prepared some students are for the challenges of teacher education and the teaching profession (McKenzie et al., 2004).
Similar concerns about the initial abilities of students enrolling in primary teacher education programs are present in the U.S. (Schmidt et al., 2012). Nevertheless, Flemish teachers and mathematics education are among the best performing worldwide. The mean score of mathematics in the 2015 TIMSS study in fourth grade, primary students places Flanders 11th (and the U.S. 14th) out of 49 countries and in the 2015 PISA study in 15 year olds for mathematics Flanders is ranked 8th (and the U.S. 34th) out of 61 countries (Mullis et al., 2015; OECD, 2016). These results are obtained despite the fact that Flanders has relatively low levels of academic bachelors or masters teaching in primary education (6% in Flanders, versus 79% internationally, OECD, 2014).
Study hypotheses
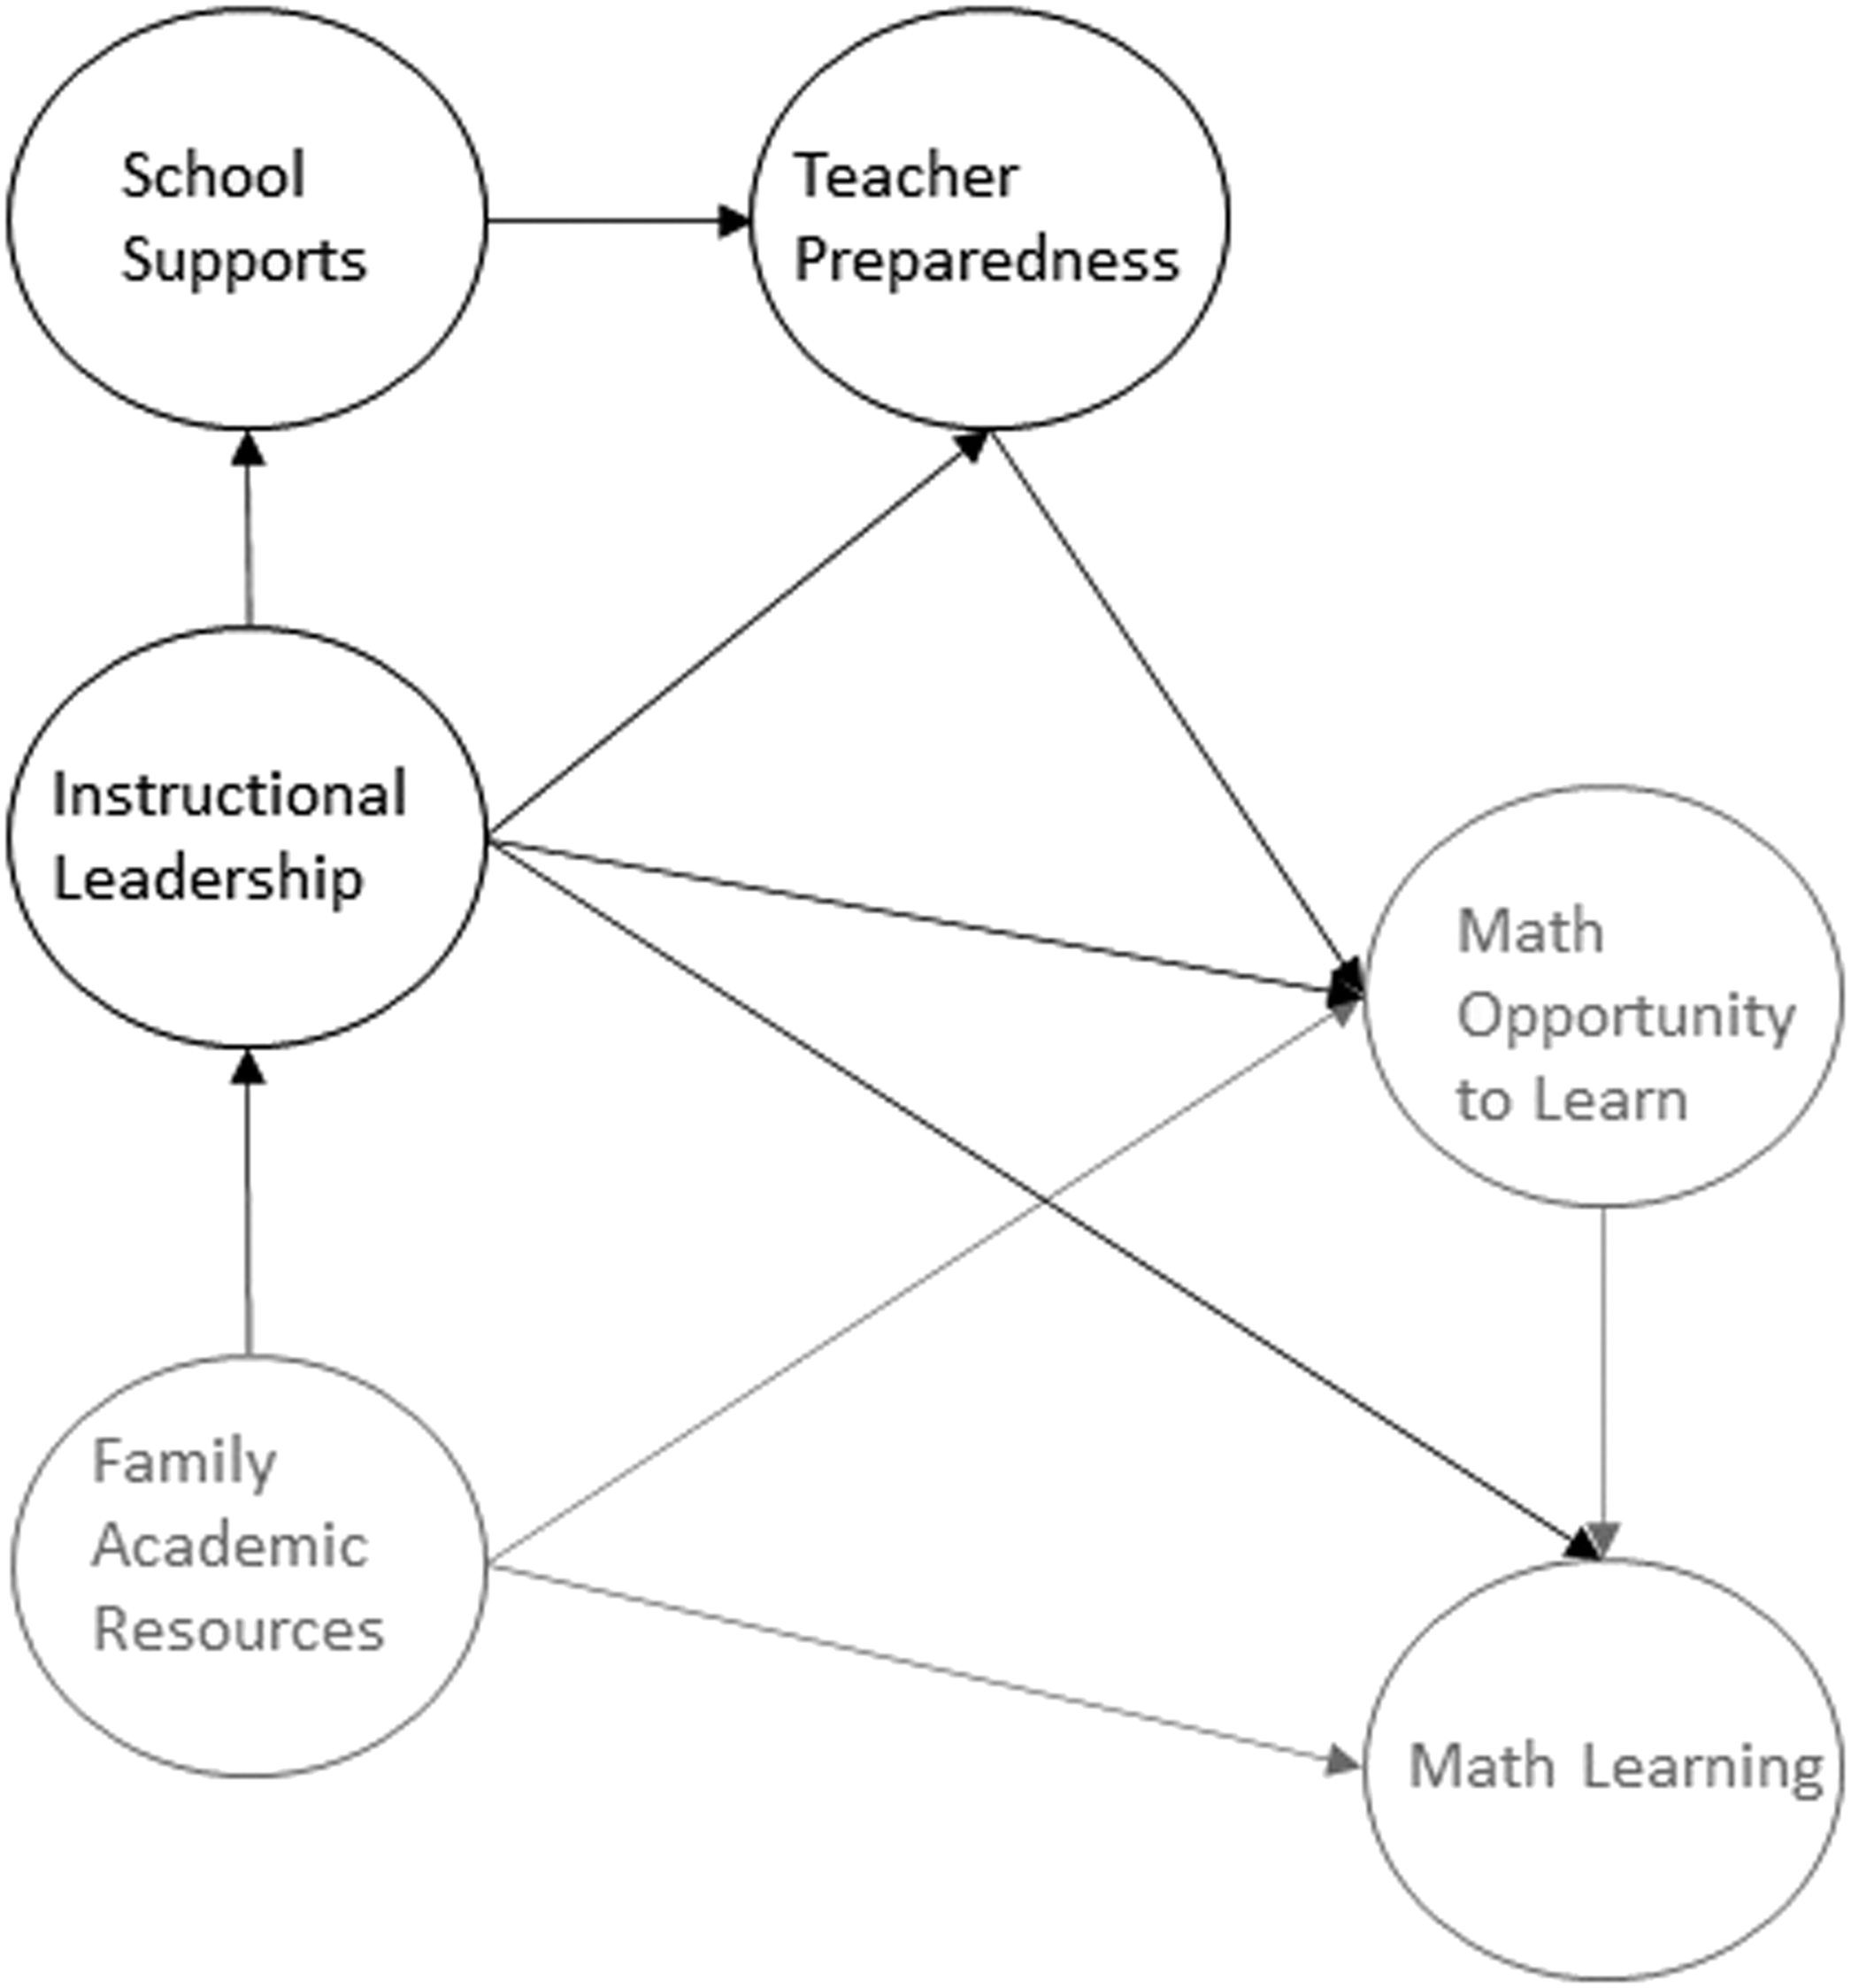
Our discussion of the literature around math OTL supported hypotheses aligned with our previously stated study aims. First, we argue that instructional leadership will positively influence math opportunity to learn as well as schools supports like climate, teacher professional community and resources, and teacher preparedness (see Appendix Figure A1, black circles and lines). Second, we suggest that the pathways between instructional leadership and math opportunity to learn will help increase math learning. Further, family academic resources will positively contribute to instructional leadership, math opportunity to learn and math learning (see Appendix Figure A1, gray circles and lines). In addition, our international comparison of U.S. and Belgium, because of their difference in curricular structuring, as well as the distribution of family income and mathematic outcomes, led us to hypothesize that U.S. students will have greater effects of family academic resources on instructional leadership, math opportunity to learn and math learning as compared to Flemish students. Finally, we predict that instructional leadership and math opportunity to learn will have indirect and direct effects on math learning regardless of country.
Method
This study is a secondary analysis of the 2011 Trends in International Mathematics and Science Study (TIMSS2011). Unlike other international data, such as TALIS (Teaching and Learning International Study) which only has school and teacher-level data, this administration of TIMSS presents a unique opportunity to study the connections between student family academic resources and math reasoning skills as well as school leadership, opportunity to learn, and higher cognitive demand tasks (Porter, 2002) in both U.S. and Belgium. A strength of this study and this dataset is the use of different data sources (i.e., principal, teacher, and student data) to triangulate the measurement of school structures, teaching, and learning. Further, this investigation of TIMSS2011 is targeted at the grade 4 population to model the paths of these opportunity to learn effects before students are sorted into more rigid academic tracks in later grades.
Sample
TIMSS follows a two-stage random sample design, with schools selected first, then one or more classrooms within the school (Joncas and Foy, 2012). An intact classroom sample within schools allows for a focus on curriculum and instructional experiences which are often organized by class or teacher (Joncas and Foy, 2012). The target population of 4th grade in TIMSS is defined by students enrolled in a grade that represents 4 years of formal learning of reading, writing, and math (see UNESCO, 1999; Joncas and Foy, 2012). These students must have an average age of at least 9.5 years when tested, although age might vary across countries; students when enrolled in the grade, regardless of age, are eligible participants (Joncas and Foy, 2012). Sampling weights were calculated based on the sampling frame and participation rates. This current study focuses on the math classrooms included in the sample. The weighting variable, MATWGT, was used at the student level as a total weight which accounts for math classroom clustering (Foy et al., 2013). The final sample for the two-level analysis of students in classrooms in this study included n = 8295 students and n = 465 math teachers in the U.S., and n = 4155 students and n = 241 math teachers in Belgium.
Measures
Instructional leadership
Instructional leadership items were specific to educational goals and providing teachers with feedback. For educational goals, the principal was asked how much time was spent in the last year promoting the school’s educational vision or goals, developing the school’s curricular and educational goals, monitoring teachers’ implementation of the school’s educational goals in their teaching, monitoring students’ learning progress to ensure that the school’s educational goals are reached (dichotomized, a lot of time = 1). Further, on the same scale, instructional leadership was measured by the frequency that a principal provides feedback to teachers. Administrators responded with the amount of time spent on initiating a discussion to help teachers who have problems in the classroom and advising teachers who have questions or problems with their teaching. These two constructs were narrowed to leadership activities which direct what and how learning is established in the classroom. Leadership beyond this focus has been found to overlap with other types of leadership (Marks and Printy, 2003; Urick, 2016; Urick and Bowers, 2014) and may complicate how to interpret principal effects. Both subscales of instructional leadership were represented by the summed totals of the dichotomous items for each scale (a maximum of 4 for educational goals and a maximum of 2 for teacher feedback).
School support measures
Learning climate, teacher professional community, and math resources were aligned with inputs identified by recent reports to advance efforts to improve and identify opportunities to learn STEM in schools (see NRC, 2011, 2013; Means et al., 2015) as well as past school improvement research (such as Bryk et al., 2010; Louis and Marks, 1998; MacNeil et al., 2009; Urick and Bowers, 2011, 2014). The learning climate and teacher professional community measures were based on items in the teacher survey, whereas the math resources measure was developed from items on the school questionnaire that addressed how much the school’s capacity was affected by the lack of math resources. Teacher learning climate was a composite of three items on an ordinal scale from very low = 0, to very high = 4: teachers’ understanding of the school’s curricular goals, teachers’ degree of success in implementing the school’s curriculum, teachers’ expectations for student achievement (averaged for a mean composite score with a maximum of 4). Teacher professional community was a construct based on four items on an ordinal scale from never = 0, to daily = 3, to measure how often teachers: discuss how to teach a particular topic, collaborate in planning and preparing instructional materials, share about teaching experiences, work together to try new ideas (averaged for a mean composite score with a maximum of 4). Principals’ responses about math resource shortages were on an ordinal scale from not at all = 3 to a lot = 0; for the following items: teachers with specialization in math, computer software, library materials, and audio-visual materials for math instruction (reverse coded and averaged for a mean composite score with a maximum of 4).
The teacher preparedness measures represented the degree of capacity to teach, which incorporates math specific professional development, and teachers’ capability to instruct for the subject matter and teach content (see NRC, 2011). Teachers were asked whether they have participated in these types of math professional development during the past 2 years (yes = 1): math content, math instruction, math curriculum, and math assessment (sum composite of dichotomous items for a maximum of 4). For preparedness of math instruction, teachers responded with their level of confidence in: showing students a variety of problem solving strategies, providing challenging tasks for capable students, and help students appreciate the value of learning math, which were selected as higher cognitive demand approaches (see Porter, 2002). The items were dichotomized into very confident = 1 and not confident = 0 and a sum was taken for the composite variable with a maximum of 3. For teacher responses to preparedness of math content, math topics included in the study were reduced to measure greater focus, rigor, and coherence in the enacted curriculum (see Schmidt and Houang, 2012; Schmidt et al., 2005; see Appendix B). Due to a lack of variability in the scale, items were dichotomized to very well prepared (1) and all else (0) and a sum composite was taken of all items, which had a maximum of 5.
Math opportunity to learn
For math OTL, we included the most mainstream operationalization, as content (Schmidt et al., 2011a), but also instructional strategies used (Kurz et al., 2014), which are both at the classroom level generated from teacher responses. Further, this study extends instruction OTL measures with student responses about the learning accessibility of their math lessons. For OTL content, math topics were reduced, in the same way as the teacher preparedness measure, for focus, rigor, and coherence by previous research on math curriculum sequences (see Schmidt and Houang, 2012; Schmidt et al., 2005; see Appendix B). Teachers responded with whether each topic was taught mainly this year (2), prior to this year (1), or not yet introduced (0). These items were summed to create a composite variable which had a maximum of 20. For OTL instruction, teachers replied with the frequency, that they ask students to explain their answers and relate what they are learning in math to their daily lives, which were selected as measures of higher cognitive demand (see Porter, 2002). This variable was dichotomized (every or almost every lesson = 1, half lessons/some lessons/never = 0), and a sum was taken for the composite variable with a maximum of 2. While 4th grade students were not asked about the coverage of content, they did respond to items about their math lessons and the degree that they understand their teacher, or accessibility. Students answered how much they agree that in their math lesson: I know what my teacher expects me to do, my teacher is easy to understand, I am interested in what my teacher says, my teacher gives me interesting things to do (disagree a lot = 0 to agree a lot = 3). These items were averaged to construct a mean composite score which had a maximum of 3. Student math learning was operationalized as two measures: a math reasoning test score, and their degree of efficacy in math learning. Both constructs reflect U.S. national STEM goals to measure student inclinations toward math and deeper understanding of content, which promote commitment and preparation for STEM in college and career (see NRC, 2011, 2013). The math reasoning test score was a subset of assessment items for which five plausible values were computed to adjust for the rotation of questions (see Martin and Mullis, 2012). Efficacy in math learning was operationalized by seven ordinal items from disagree a lot = 0 to agree a lot = 3 from which an average score was calculated that reported students’ beliefs in their ability to learn math (Fast et al., 2010).
Student and classroom controls
Background variables, for student and classroom, were used to control for context. Percent of students in the school from affluent homes was coded as dichotomous, over 50% = 1, under 50% = 0. School enrollment was divided into three categories for school size: large, >750, mid, 400–750, and small as the reference group (see Lee and Loeb, 2000). School location was dummy coded using the survey categories with suburban as the reference category. A school readiness composite was operationalized as the average score of items in which the principal selected a range of the percentage of students who began school with early reading and math skills. For students, gender and a rank for birth year were used. Of most interest, a composite was created for family academic resources, for use at the student level, and aggregated to the classroom level. Family academic resources followed past operationalizations which include number of books in the home and home possessions (Carnoy et al., 2015), but it was also extended to include forms of financial, social, and cultural capital, with possessions beyond those for academics, such as the extent parents discussed school with their child, and sometimes speaking another language at home (see Wilson and Urick, 2021). The number of books in home (1 item, scaled 0–4), parents ask about school (4 items, 0–3), home possessions (11 items, 0 or 1) and speaking another language (1 item, 0 or 1) were averaged into a single measure of family academic resources.
Analytic strategy
With the first research aim, we investigated the pathways through which instructional leadership influences math opportunity to learn. Composite and background variables were added into the model based on their theorized proximity to math opportunity to learn with the closest set entered first. Non-significant control variables or paths with a standardized coefficient of less than .1 were removed from the model for parsimony. Only results from the final full model are reported. In Mplus 7.4, a general type analysis was used with a robust weighted least squares estimator using a diagonal weight matrix (WLSMV) as an estimator and theta parameterization since categorical variables were both independent and dependent (Muthén & Muthén, 1998–2012). The results from the first research aim yielded a direct path from instructional leadership to math opportunity to learn which was used to address the second research aim.
With the second research aim, we examined the extent that instructional leadership and math opportunity to learn mediate effects of family academic resources on student math learning. The student level was tested in a preliminary step before adding the classroom level in the final two-level model. Student level variables, math reasoning score (plausible values), efficacy in math, and student perception of math lessons, were entered in as individual items on a latent factor rather than as composites. In Mplus, a two-level type analysis was used with a robust maximum likelihood estimator (Muthén & Muthén, 1998–2012).
Results
The purpose of these structural equation models was to test the regression paths among constructs from TIMSS 2011 which represent multiple pathways to opportunity to learn. While opportunity to learn as mediator of the relationship between student family academic resources and math learning has been well-established and studied to show differential opportunity in schools for students (e.g., Schmidt and Houang, 2012), less is known about how school and classroom structures influence it. Rather than focus on a measurement approach for survey development, which would place an emphasis on the factors of individual items, these analyses were intended to model the complexity of theorized inputs and outputs of opportunity to learn. Although structural equation models, as currently presented, are not causal, the results are needed for designing more rigorous experimental and quasi-experimental studies which must account for these paths (Bowen and Guo, 2012). Moreover, an international comparison to Belgium is important to provide a point of reference to begin to understand the degree of leverage in instructional leadership and opportunity to learn as mediators of economic disparities given country-specific policy and demographics.
Research aim 1: Investigate the pathways through which instructional leadership influences math opportunity to learn
This first analysis tested the possible paths between school and classroom variables on opportunity to learn, teacher perception of instruction and content in their math classroom for both the U.S. sample and the Flemish sample. For the U.S. (n = 8305 students), in Figure 1, several paths were found to explain OTL in classroom (model fit: χ2 (77) = 1469.38, RMSEA = .047, CFI = .697, TLI = .587; note: precursor model to final two-level model with good fit). The same model was tested for the Belgium sample (n = 3942 students) as a comparison (see Figure 2). For Belgium, there were also several paths which explained both OTL math content and instruction (model fit: χ2 (82) = 978.758, RMSEA = .053, CFI = .629, TLI = .480; note: precursor model to final two-level model with good fit). U.S. pathways to opportunity to learn. Belgium pathways to opportunity to learn.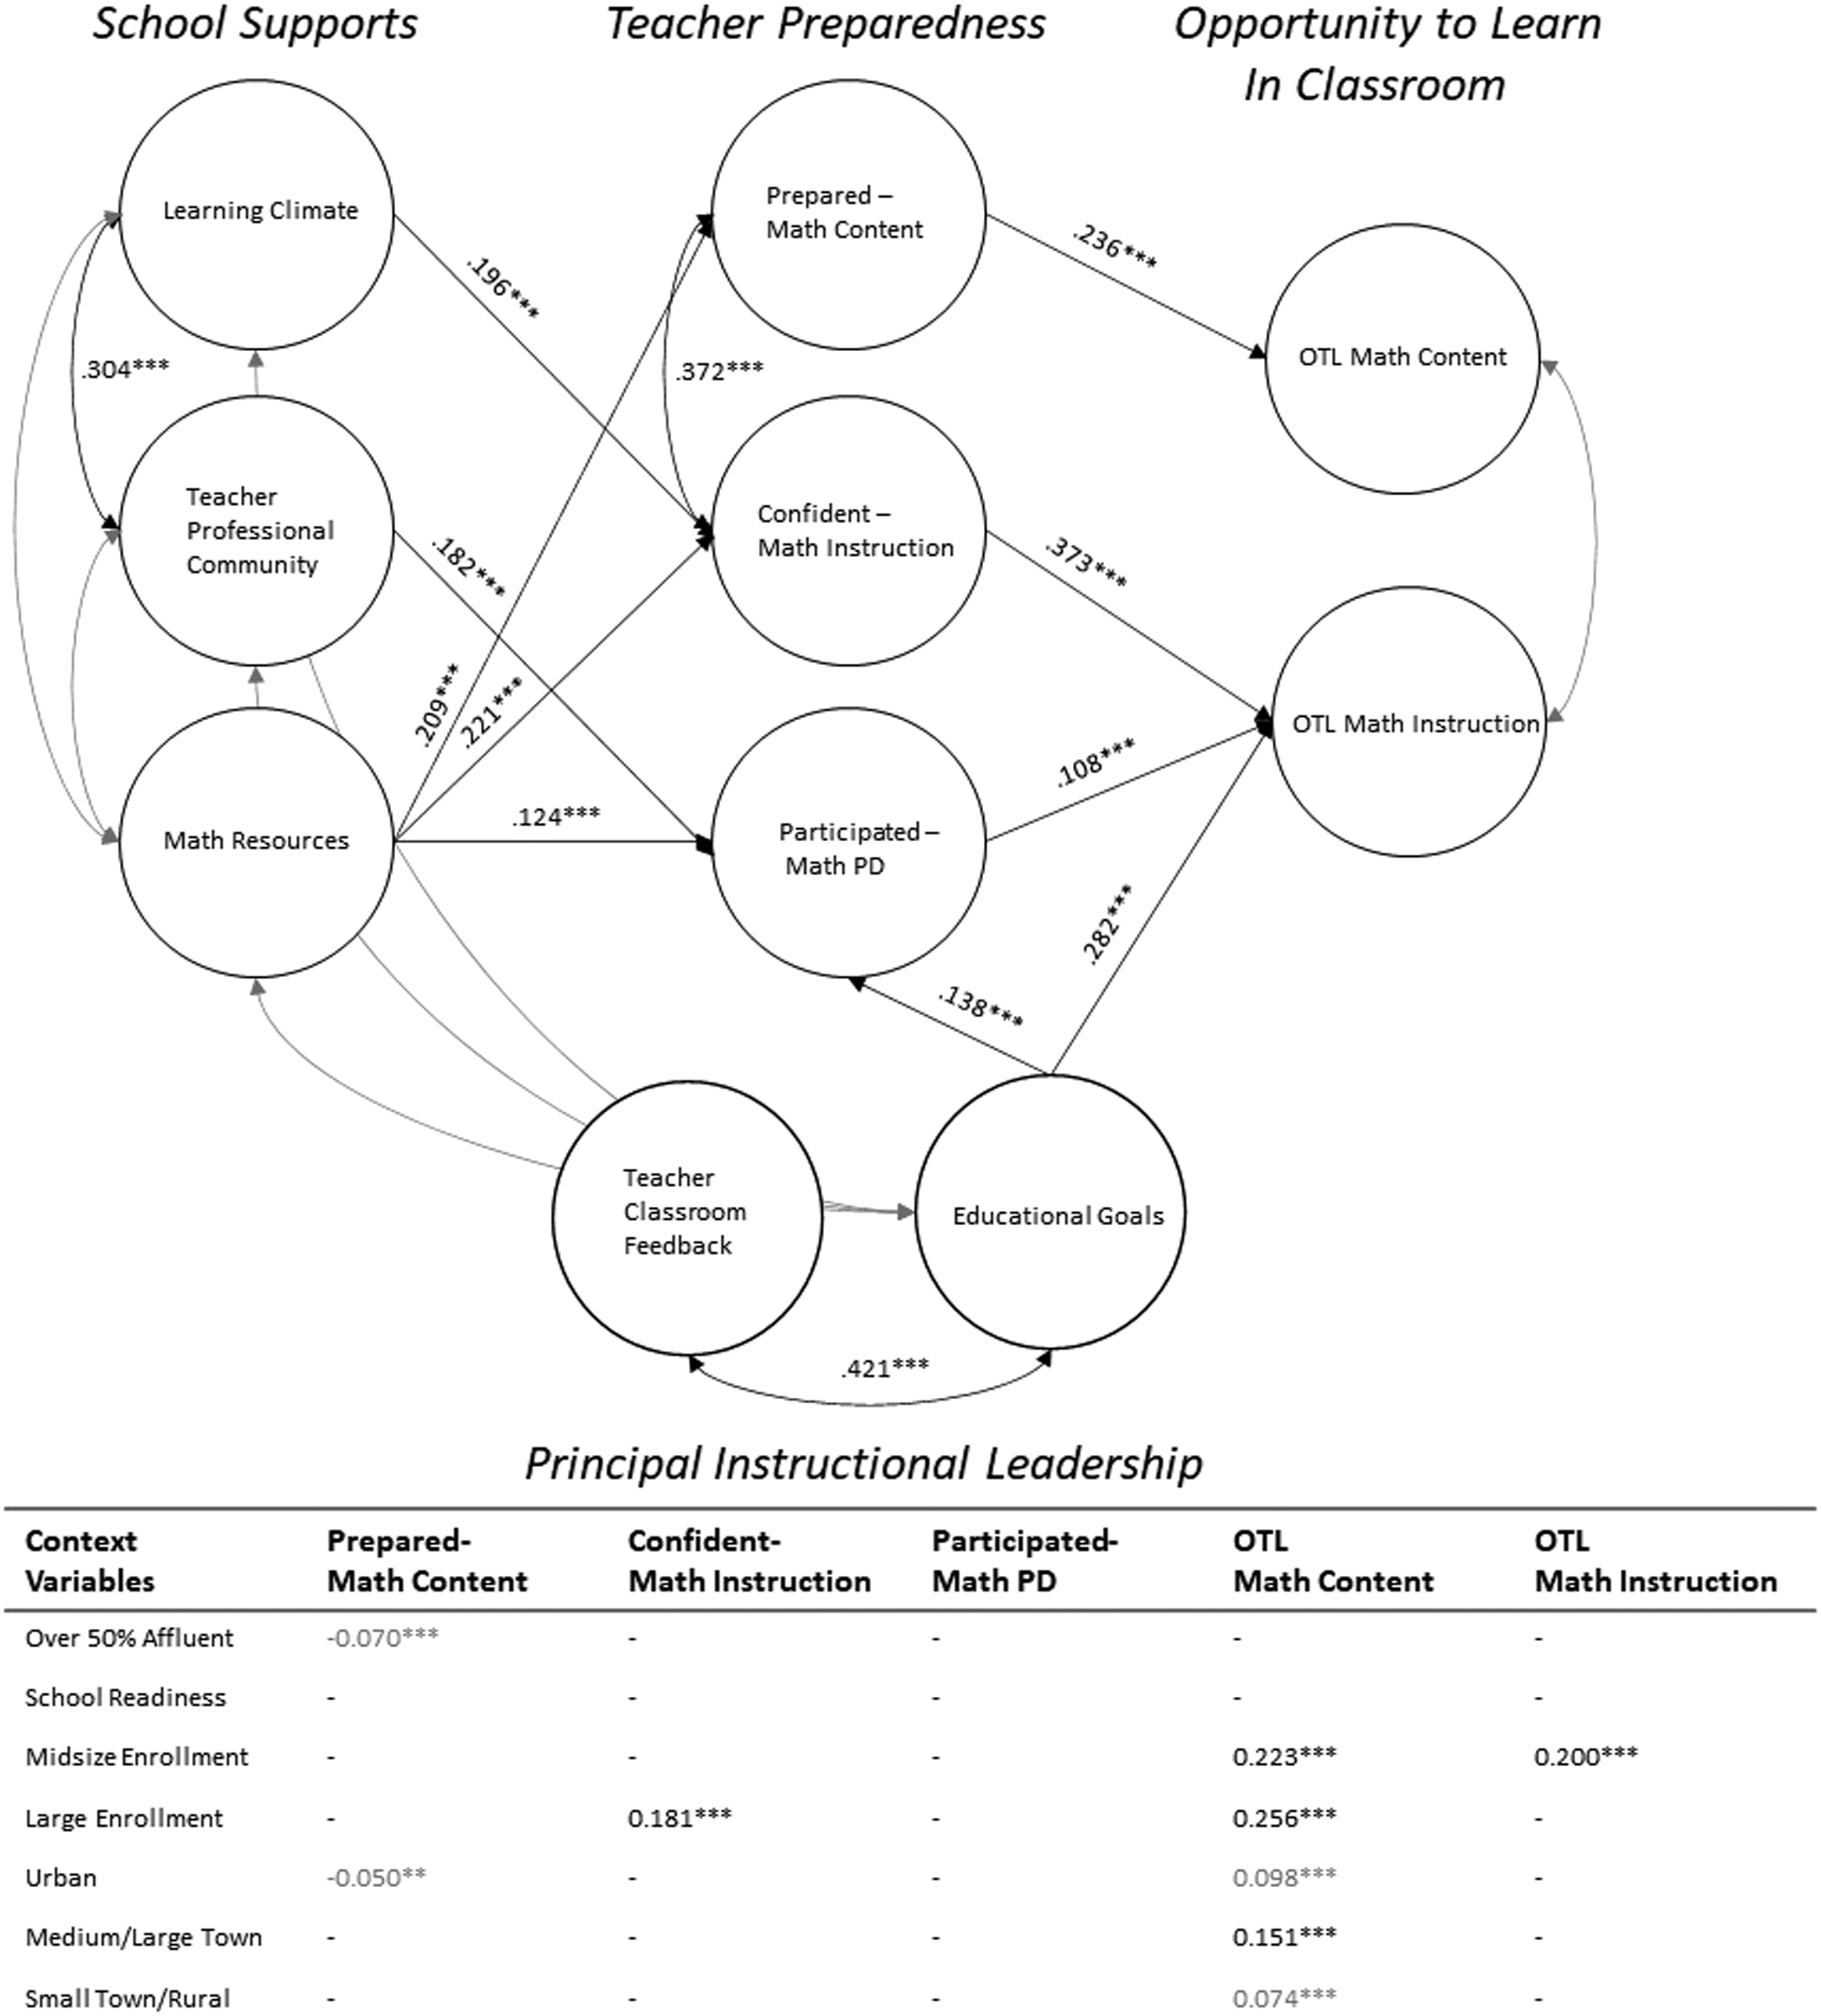
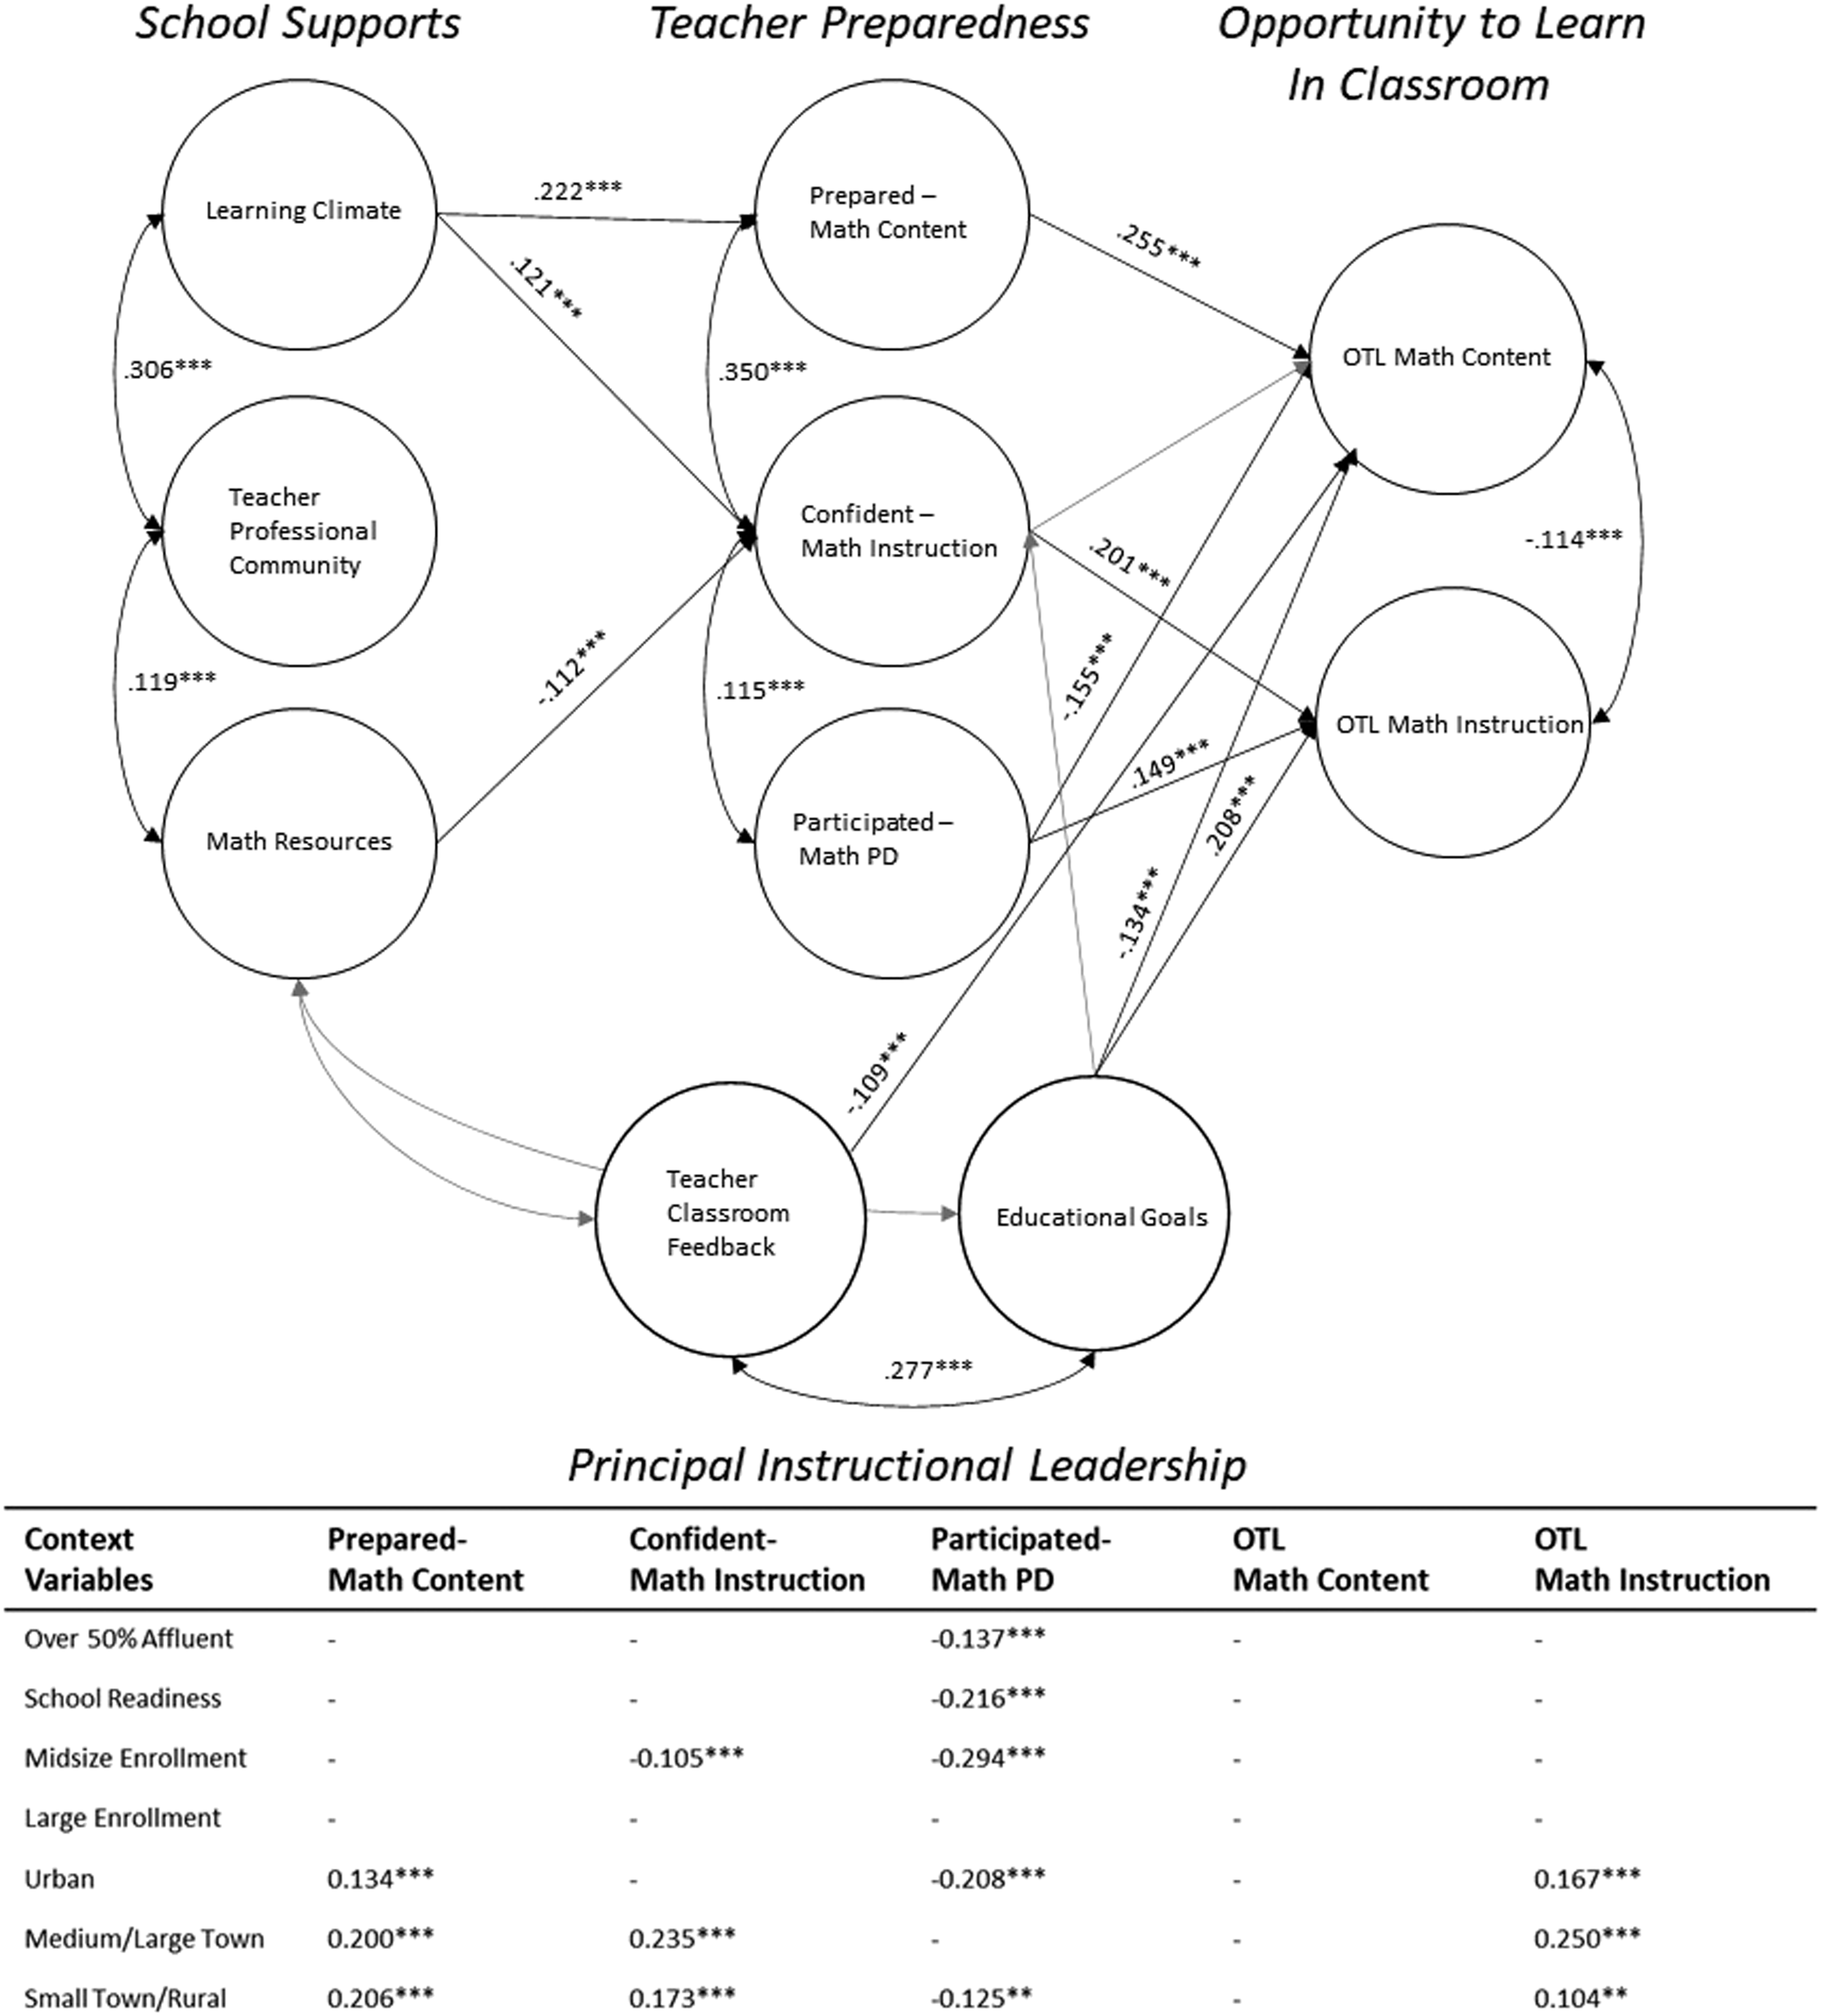
Overall, compared to the U.S., Belgium had a few more paths which influenced the math content delivered to students in the classroom. In Belgium, professional development, and instructional leadership, both had inverse effects on the sequence and timing of content provided to students. Further, unlike the U.S. with a positive relationship, Belgium also had an inverse relationship between the available math-specific resources at a school and the confidence of teachers in their instruction. While U.S. resources increased when teachers’ confidence in instruction increased, Flemish resources increased when teachers’ confidence decreased.
When comparing these two countries, some findings are less noticeable yet help to interpret the overall results summarized above. First, a link between the two OTL measures (content and instruction) existed in Belgium but was not found in the U.S. This relationship between the two measures was an inverse relationship in Belgium. The instruction OTL measure asked teachers the frequency in which they ask students to explain and relate what they are learning in math to daily life; whereas, the OTL content variable measures assesses what content is delivered when. The fewer topics taught in the year meant that teachers had more time to ask students to explain their answers and relate it to daily life. While U.S. schools mostly follow the scope and sequence of Common Core and the state, grade-level standards, which determine school ratings, Flemish schools might have more autonomy to develop their own curricula if it meets broader policy objectives which are tested. However, Flemish schools are evaluated through a framework of context, inputs, processes and output as well as self-evaluation reports (OECD, 2017). These policy differences may allow for Belgium to have a stronger relationship, or control, between instruction and content when compared to the U.S.
Second, in Belgium, there was a direct relationship from educational goals to both OTL content and instruction. In U.S., there was only a direct relationship between educational goals and OTL instruction. The path was tested between educational goals and OTL content in the US; however, it was not significant. The lack of the relationship between educational goals and OTL content might be the lack of control over the sequencing of math content either at a district or state level, and a difference in national values around freedom with curricula (see OECD, 2017). In the U.S., OTL content in math, since it is sequence-driven, might be more of a precursor to leadership and supports rather than an outcome. This hypothesis based on these findings would be an interesting redesign of these models for future study.
Third, we did test for the two-way relationship between teacher classroom feedback and educational goals, both of the instructional leadership measures. We viewed goals and feedback as synergistic processes within instructional leadership. The two-way relationship between both instructional leadership constructs was significant in both US and Belgium. The relationship between these constructs is slightly higher in the US compared to Belgium. In the Flemish community, only temporary teachers are evaluated in an interview-based system with a comprehensive set of products including portfolios (OECD, 2017). In the U.S., teacher feedback is a part of the evaluation system which is often tied to accountability goals and standardized approaches to instruction and curriculum. In both contexts, educational goals and teacher feedback were connected.
Fourth, in the U.S., there was not a connection between PD and OTL content. The PD measure was a sum of participation in development on math content, instruction, curriculum, and assessment during the last 2 years. This finding could exist because mathematics content and curriculum is less malleable in the U.S., or perhaps, U.S. educators and leaders choose not to create and participate in PD around mathematics content. However, there was a link between PD and OTL content in Belgium, yet it was an inverse. An increase in PD participation predicted fewer math topics presented within the school year. A significant finding in Flemish versus U.S. schools might exist because content and curriculum are more malleable in Belgium. In both countries, PD was a predictor of OTL instruction which supports a claim that PD might more often be directed towards practice of delivery rather than content.
Finally, teacher confidence in instruction was related to OTL instruction in both U.S. and Belgium. These measures were closely aligned since they both focused on instruction only rather than content. In extension, the teacher preparedness toward content was similarly related to only OTL content and not OTL instruction in both countries. Teachers’ views of their own approach to content and instruction directly related to what and how mathematics was delivered in the classroom.
While the school and classroom structures which lead to opportunity to learn are important to understand and focus improvement efforts, the next research aim uses this direct link between instructional leadership and opportunity to learn math instruction in both the U.S. and Belgium to test its use as a mediator of student academic resources at home on math learning.
Research aim 2: examine the extent that instructional leadership and math opportunity to learn mediate family academic resources on math learning
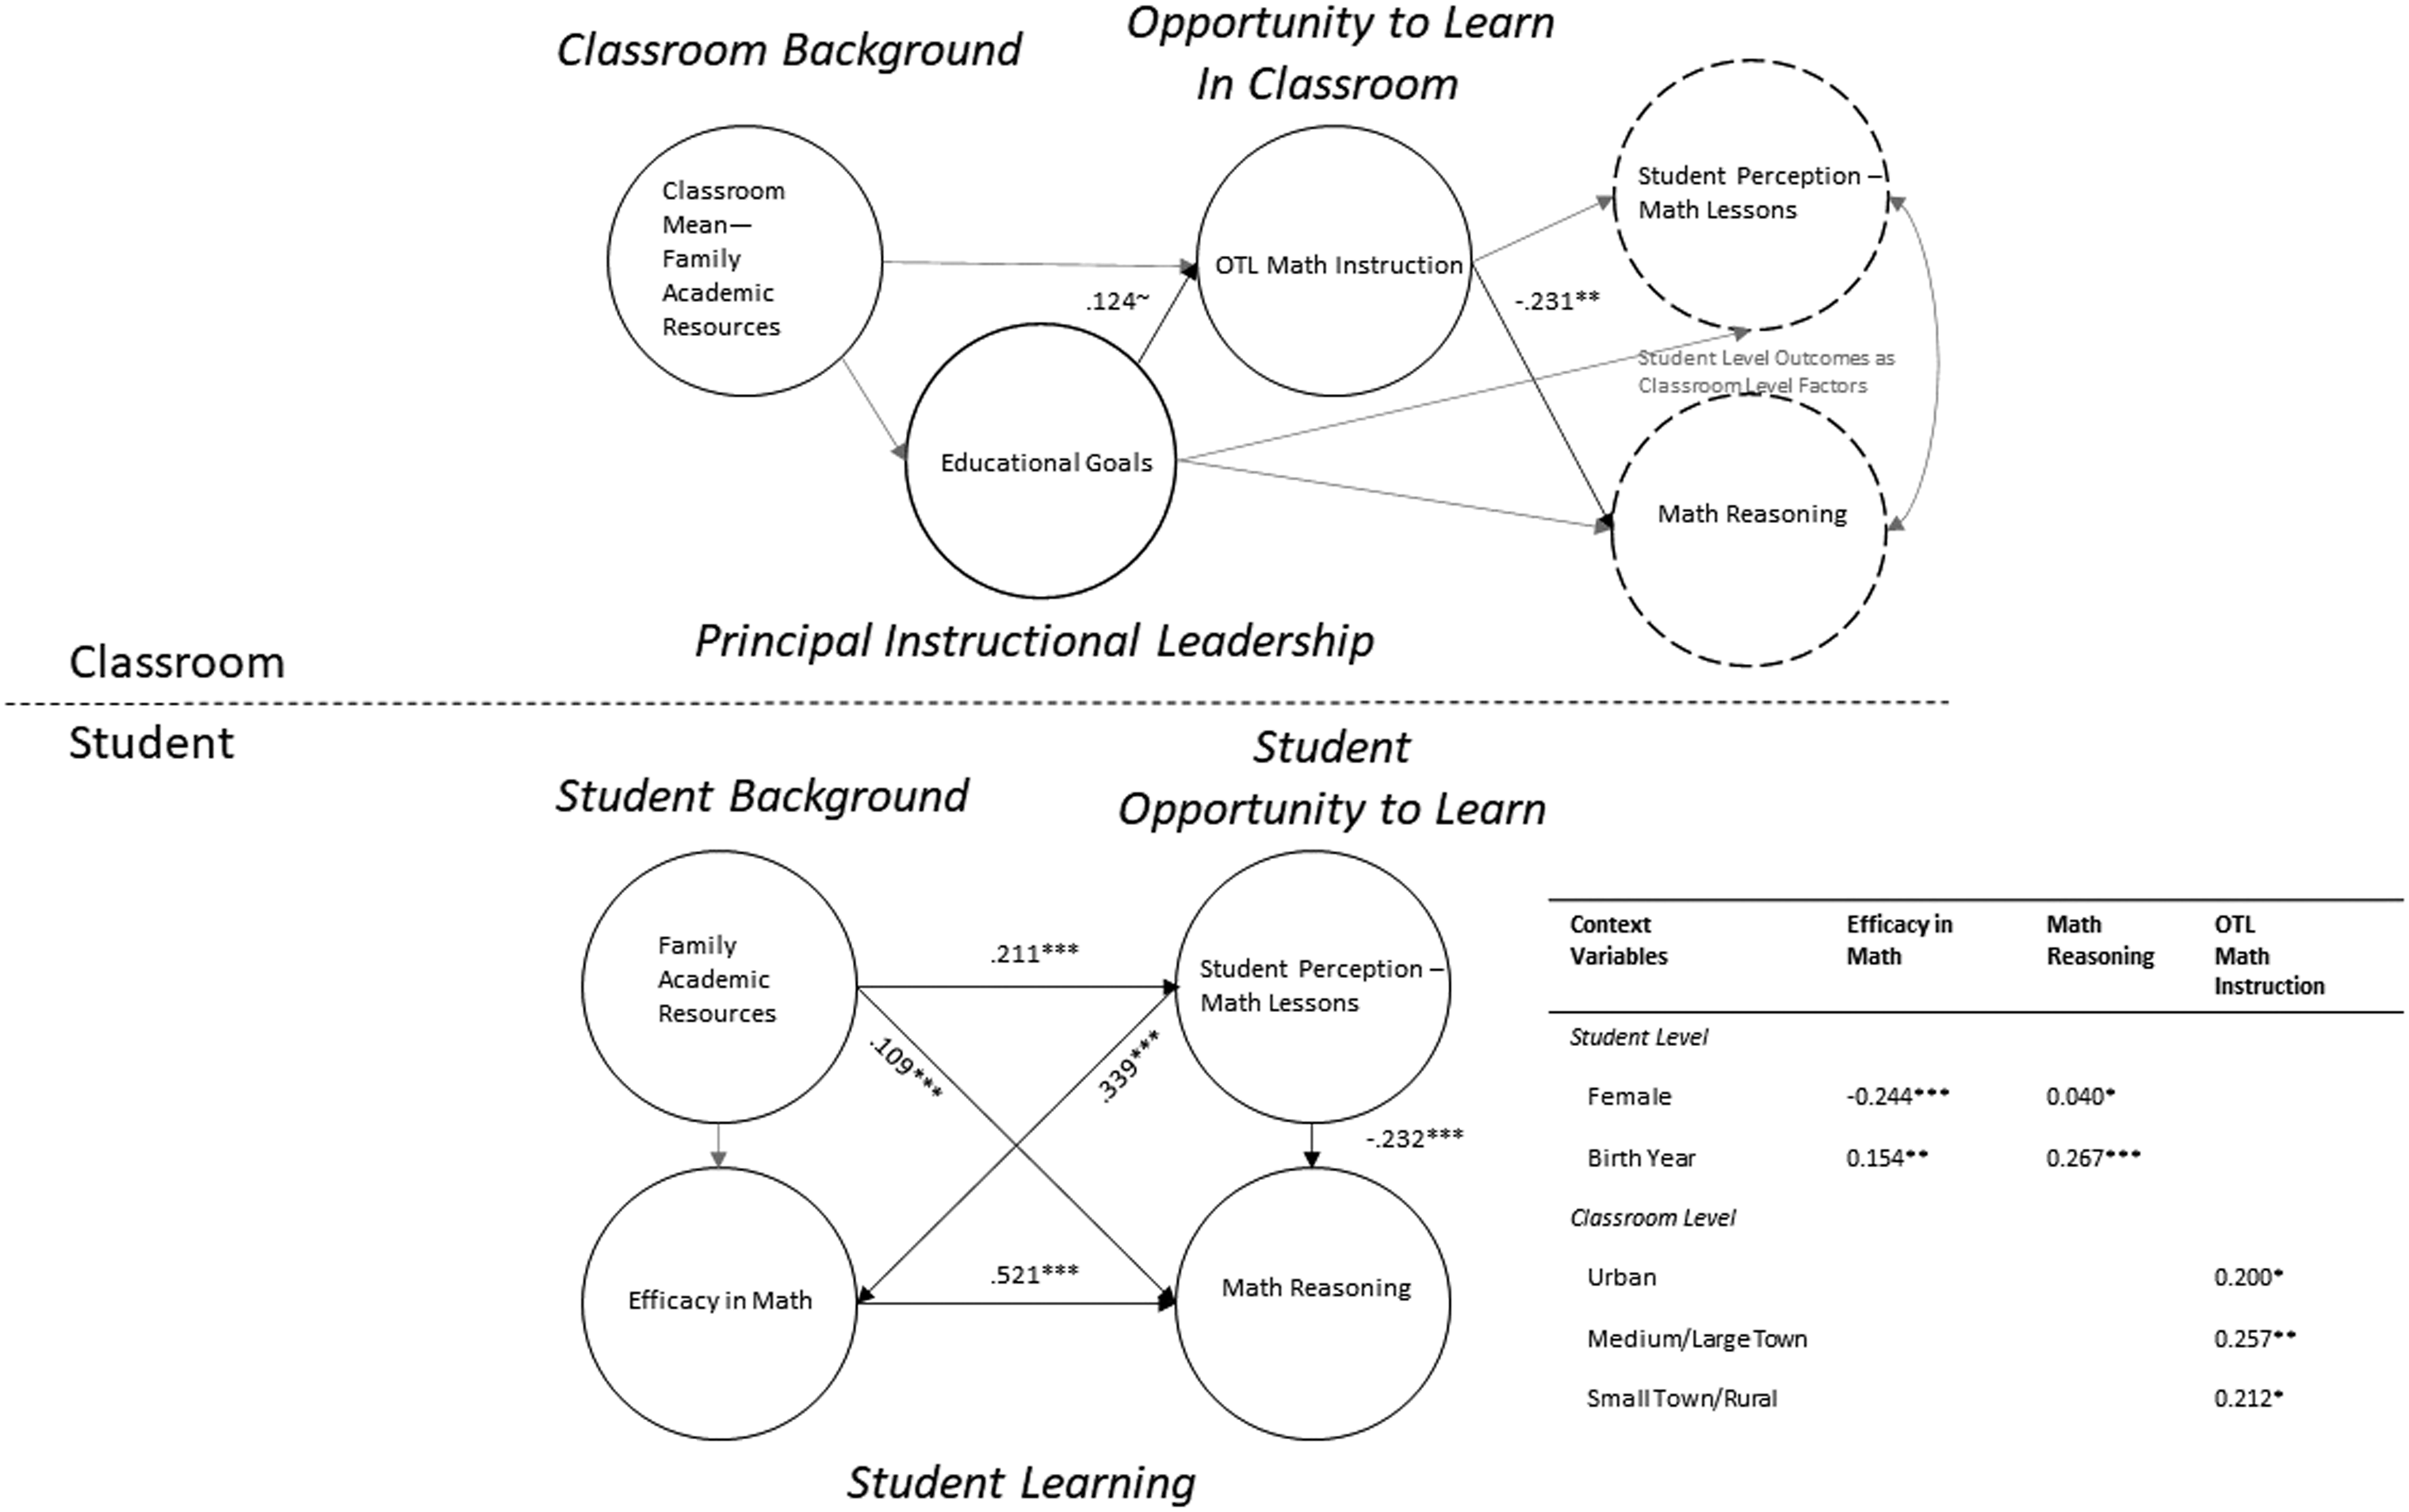
This second, and final, analysis tested a two-level model of instructional leadership and opportunity to learn as mediators of student family academic resources on math learning for U.S. and Belgium. Descriptive statistics for this final two-level model of math learning are included in Appendix C. The results for the student and classroom, two-level, model is presented in Figure 3 for U.S. (n = 8295 students, n = 465 math teachers) and Figure 4 for Belgium (n = 4155 students, n = 241 math teachers). An important note, OTL content was tested in previous models in Aim 1 but was removed for parsimony in Aim 2 because it was not significant. The model fit remained good for both U.S. (model fit: χ2 (201) = 4165.565, RMSEA = .049, CFI = .939, TLI = .926, SRMR within = .049, between = .165) and Belgium (model fit: χ2 (191) = 1550.869, RMSEA = .041, CFI = .955, TLI = .945, SRMR within = .040, between = .119). U.S. student and classroom level: Instructional leadership, family academic resources, opportunity to learn and math learning. Belgium student and classroom level: Instructional leadership, family academic resources, opportunity to learn and math learning. Conceptual framework pathways tested in current study.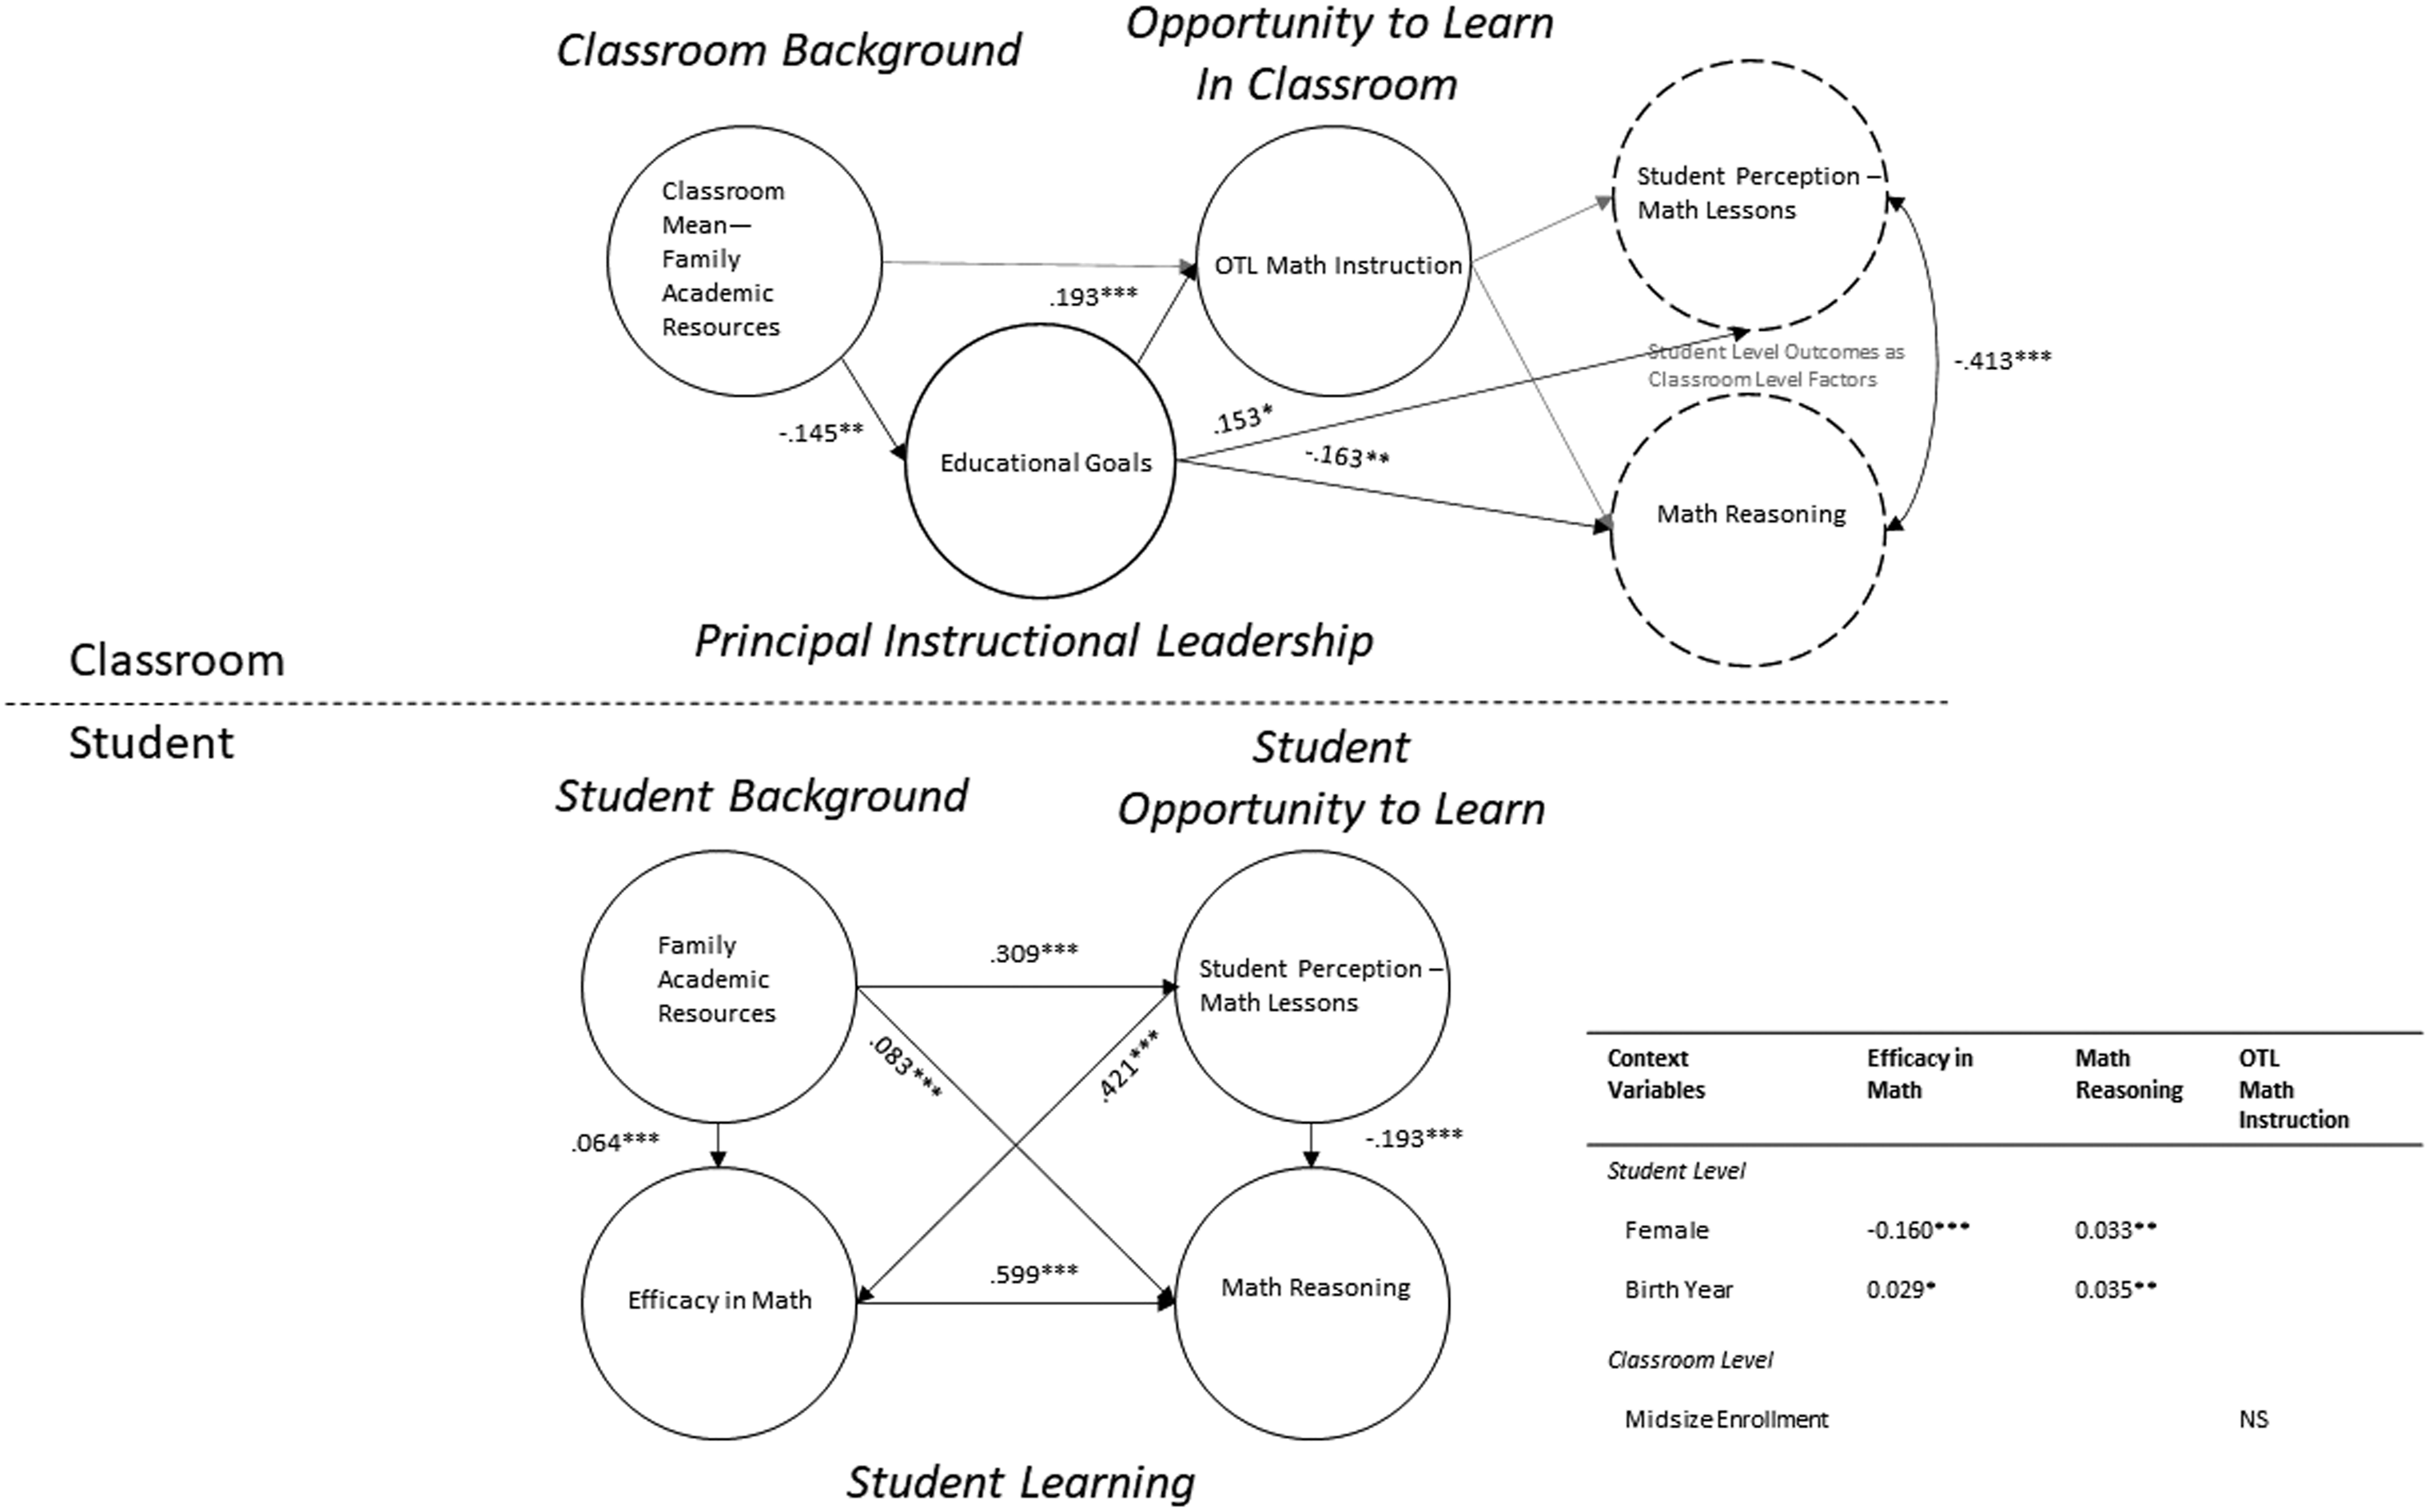
This two-level model is the first set of findings that include student level variables. To better understand OTL, the teachers’ view of their instruction in the classroom is included, like Aim 1, as well as student perception of their math lessons, new in Aim 2. Further, we conceptualized students’ self-efficacy as a measure of their learning alongside their math reasoning scores. If we had multiple years of data with a cohort sample, we would be able to test if previous performance builds self-efficacy. Since this model is cross-sectional, we conceptualized self-efficacy as a measure of their learning alongside math reasoning. For Aim 2, we tested the ways in which family resources are mediated by opportunity to learn and instructional leadership. Family resources was included at the student level as well as an average at the classroom level to test with these OTL and support variables on student outcomes.
First, we present the results at the student level. Overall, family resources had indirect and direct effects on student outcomes in both the U.S. and Belgium. In the U.S., family resources are mediated by both self-efficacy and student perceptions of lessons on math reasoning scores. Further, family resources have a direct effect on math reasoning scores. In Belgium, family resources also influenced student perceptions of lessons and math reasoning but not their self-efficacy. Family resources influenced student outcomes in both countries in similar ways except it did not influence student self-efficacy in Flemish schools.
In the student level outcomes, we found an interesting inverse relationship between student perceptions of math lessons and math reasoning scores in both countries. The items for student perception of math lessons asks students about their interest in lessons and if their teacher is easy to understand. This perception of “easy” might have demonstrate that these high-interest lessons may have an inverse effect for students when answering high cognitive reasoning math questions. This inverse or negative relationship between perception of lessons and math reasoning is consistent across U.S. and Belgium.
Also in Aim 2, we connected classroom variables to student level outcomes. Our findings demonstrate some differences between countries in the connections between academic resources at home (classroom average), educational goals and student outcomes. For the U.S., educational goals (instructional leadership measure) had an inverse relationship with both academic family resources (classroom average) and student math reasoning scores. However, educational goals positively predicted student perceptions of math lessons. This finding of the negative relationship across academic resources at home (an average at the classroom level) to educational goals to math reasoning can appear counterintuitive. Nevertheless, we know that schools with students who have fewer resources at home often score lower on standardized tests (Conwell, 2021), so it would make sense that principals would spend more time on these academic accountability goals. The interesting finding is the relationship between these educational goals and math reasoning scores (negative) compared to student perceptions of lessons (positive). The math reasoning scores represent only higher-order thinking questions on the math assessment. The student perceptions of lessons ask students if the teachers are easily understood and if they are interested in the lesson. Perhaps, the educational goals in the school reflect these high-interest, easy lessons, which are in opposition with student performance on more rigorous math questions.
In Belgium, the results across educational goals, classroom OTL instruction and student outcomes (perception of lessons and math reasoning) help to further interpret our understanding of these concepts. It is important to note, Flemish schools did not have a relationship between family academic resources (classroom average) and educational goals, and educational goals did not predict either student outcome. In Flemish schools, the educational goals are not influenced by family academic resources. In turn, these educational goals do not predict student perception of math lessons nor student scores on math reasoning. However, teacher perception of their instruction had an inverse relationship with student math reasoning scores. Teachers who perceived that they spent more time asking students to explain their answers and relate math to daily life had a negative influence on math reasoning. More research is needed to thoroughly examine the ways in which different approaches to instruction may positively or negatively influence student performance on high cognitive, formal math assessments.
Finally, in both countries, teacher perceptions of instruction did not predict student perceptions of lessons. This lack of relationship might exist because of measurement or the participants’ role. First, teachers and students have different vantage points and experiences to use to understand the lesson and instruction. Second, students were asked about ease and interest, and teachers were asked about levels of thinking (explanation and application). Third, the measures are not referring to a particular lesson and seek responses about very different approaches to the lesson, for example, student engagement versus approach to delivery, so the lack of relationship might be a conceptual measurement issue. While we conceptualize classroom OTL instruction as higher-order thinking, application and explanation, this measure was not predictive of student math reasoning scores in the U.S. and inverse in Belgium. In mathematics instruction and content, there is difference between formal and applied approaches. When teachers were asked about the frequency of relating math to daily life, this teacher perception item might be a better measure of applied math rather than depth of formal math. In addition, teachers might have viewed themselves as asking students to explain their answers but maybe these explanations were not as frequent or have the kind of depth necessary to influence students’ math reasoning.
Discussion
There are three important findings from the series of models tested above. First, as a result of Research Aim 1—which included several paths between school supports, principal leadership, and teacher preparedness and math OTL—we have shown that the U.S., as compared to Belgium, has little school or classroom-level influence on the math content that is delivered to students in the classroom. Further, unlike Belgium, school content-specific resources were related to every aspect of teacher preparedness tested in our U.S. models. Second, with respect to Research Aim 2 which added student level measures, we found a very weak but significant positive relationship between a student’s family academic resources and his/her efficacy in math, which only appeared in the U.S. Interestingly, consistent across U.S. and Belgium, our evidence suggests that while student perceptions of math lessons as easy and interesting positively influenced self-efficacy, it had a simultaneous negative effect on their math reasoning [higher cognitive demand] test scores. Third, within the school/classroom level paths on these student outcomes, the U.S., not Belgium, had a path with negative relationships from students’ family academic resources through instructional leadership to math reasoning scores. In the end, because of this international comparison with Belgium, these main findings have highlighted the ways in which U.S. schools may begin as early as in Grade 4 mathematics to differentiate curricula based on students’ family resources.
According to Aim 1 findings, U.S. and Flemish schools have differences in their approach to what content is delivered as well as in how supports influence the practice of teachers. The TIMSS 2011 data was collected at an important point in U.S. policymaking, marked by early implementation and adoption of the Common Core State Standards for Mathematics (CCSS-M). The OTL math content variable in this study was aligned with both the curriculum literature and international assessments which identified the sequencing of mathematic content across grade levels to select topics for Grade 4 (see Appendix B). While we internationally aligned this variable, the responses to each topic as “taught,” “not yet taught,” or “taught previously” is admittedly an imperfect measure and might have contributed to variation in findings surrounding associations to OTL content between the two countries, with few paths of influence in the U.S. but inverse paths of influence in Belgium. These issues notwithstanding, while measures of CCSS-M-aligned content might demonstrate little room for influence in the U.S. due to state standards and accountability testing tied to school ratings, Flemish professional development and instructional leadership demonstrated a shift in content coverage for when topics were taught (prior year or not yet taught). Two main national policy differences may contribute to this difference: a value of school autonomy in curricula and school evaluation procedures. Because of these policy differences, leaders might select professional development more often focused on practice rather than changes to the sequencing of content, especially for mathematics, which is cumulative knowledge. This finding helps us consider how mathematics professional development may be expanded in schools, but also about how we might measure the delivery of content to assess OTL. A traditional approach to OTL measures is when and if a topic was covered, but relevance of a topic, depth of coverage, and mastery of content are more complex measures at the heart of curriculum and sequencing. Likewise, the understanding of relevance, depth and mastery of topics would be a more comprehensive approach to teacher professional development around content. However, even professional development programs that offer content knowledge and assessment skills to math teachers have mixed results on instructional practice and student outcomes (e.g., Jacob et al., 2017). In the U.S., the preparation of teachers to deliver this content was predicted by a school’s available content-specific resources: math-specialized teachers, software, library, and audio-visual materials. Unless schools have these resources available, according to our current models, there is not another support path, that we found, available to influence what content is delivered in the classroom.
Also, within Aim 1, teachers’ views of their own confidence and preparation for instruction and content influenced OTL. The measures of teachers’ preparation for content and OTL content were well aligned as was teachers’ confidence towards instruction and OTL instruction. However, instructional leadership did not predict either one of these measures of teacher preparation or confidence. While this finding could be a measurement conceptualization issue, instructional leadership did directly influence OTL. More specifically, in both countries, educational goals influenced OTL instruction, but not OTL content in the U.S. While we could argue that policy differences across countries might make it more difficult for teachers and principals to influence content in the U.S., it is possible that U.S. educational leaders have not prioritized professional learning and adaptation of mathematics content, and instead have prioritized instruction. These findings from paths between teacher preparedness, instructional leadership and OTL led us to question how teacher evaluation systems might play a role. Flemish schools use an interview-based system with portfolios, which might not directly relate to specific content or instructional approaches. However, while the U.S. system is more observation-based often with general teaching standards to meet, again, the feedback and associated teaching goals are likely not mathematic-specific. Past literature on teacher evaluation systems has critique the overall purpose of these mechanisms as summative rather than formative, for accountability rather than improvement, and not adjusted for teacher expertise (see Lillejord and Børte, 2020). In the U.S. with a compliance approach to teacher feedback and goal setting, it is possible that teacher evaluation systems do not align with effective instructional leadership practices which should support teacher preparedness and confidence.
As studied in Aim 2, one of the main reasons for the comparison between U.S. and Belgium was due to the difference in the degree of disparity of income across families (i.e., the Gini index). This is an important measure because a large body of literature suggests that these economic disparities translate into similar gaps in academic outcomes (Chatterji, 2006; Reardon, 2011; Weiss, 2014). This narrative is present in our student level findings which demonstrated that family academic resources predicted math reasoning scores, but in the U.S., it also predicted a student’s self-efficacy in math, which our conceptual framework asserts is an important mediator of math performance. Both U.S. and Flemish lower income students have decreased performance in math, but lower income students in the U.S. have an additional reduced self-belief in their math ability. In part, U.S. students’ self-concept toward academics is determined by their access to resources at home. Explanations for this phenomenon can be found for example in economics within the intergenerational inequality literature (Bowles and Gintis, 2002; Filippin and Paccagnella, 2012), as well as in social psychology in theories like stereotype threat (Spencer and Castano, 2007; Steele and Aronson, 1995). As argued throughout the literature review on opportunity to learn, the way in which teachers deliver content to students varies and can structure inequities in performance (Giersch, 2016; Hattie, 2012; NRC, 2011; Oakes 1985, 2005; Porter, 2002; Starratt, 2003). Both rigorous teacher instruction and appropriate content provide equitable access to higher demand thinking and skills within topics (Giersch, 2016; Porter, 2002). Interestingly, across both U.S. and Belgium, when students perceived math lessons as clear, easy, and interesting, this perception increased self-efficacy while decreasing their performance on math reasoning [higher cognitive demand] test items. Future research should isolate these student perceptions of a lack of difficulty and increased interest to test for negative effects on higher cognitive demand skills.
Finally, our findings suggest that, based on how schools respond to student needs, instructional leadership might reinforce inequities in learning. In our study, Flemish schools had no significant paths between student family resources, instructional leadership, and learning; however, for the U.S., we found a negative path across these measures. In U.S. schools, the average amount of students’ family resources predicted how much time a principal spent developing, promoting, and monitoring school goals, and this leadership predicted a decrease in student performance on math reasoning [high-cognitive demand] tests. A principal’s focus on these educational goals, as a matter of mediating students’ access to academic resources at home, may be counterproductive for their performance on more rigorous math tests. U.S. scholars have continued to argue that accountability policy, which often drives goals for school leaders, has exacerbated gaps in achievement rather than closing them (Hursh, 2007; Lipman, 2004; McNeil, 2000; Watanabe, 2008). For example, to meet goals of growth in pass rates on state basic achievement tests, educators under pressure have watered down curriculum by narrowing the depth and widening the coverage of tested topics for students “at risk” of failure, which has further separated students into different academic tracks whether by student, class, or school. Interestingly, in the U.S., these educational goals positively predicted student perceptions of their math lessons, and in both countries, they predicted teachers’ views of their instruction. However, these teacher and student views of instruction [or lessons] did not positively translate to increases in math reasoning scores. Future research should seek to understand how educational goals and perceptions of instruction can better align with high cognitive, formal math reasoning. In addition, future studies might investigate the differences in teacher and student perceptions of instruction to better measure learning in the classroom, which promotes math reasoning.
Conclusion
The findings of this study highlight not only our continued struggle to provide equitable educational experiences to students from varied backgrounds, but also point to the persistent influence of the structuring of opportunity to learn in schools on student learning. To influence opportunity to learn in math in the U.S., instead of focusing on school goals to this end, a leader’s time might be better spent on providing access to the content-specific resources teachers need to provide rigorous math teaching and learning experiences in their classrooms. The availability of resources for U.S. math teachers’ content was the most important lever across the school supports tested. These teaching materials for mathematics directly support teachers in delivering content to students. In addition, if math reasoning is an important outcome for students, we need to assess the ways that high cognitive demand is met within goals, professional development, delivered content and instruction. For scholars, our findings suggest a need for increased discourse between scholarship occurring across fields of study which address the role of schooling in educational opportunity—such as educational leadership, curriculum studies, economics, and the sociology of education. We urge scholars that span these fields to gain insights into how the actions of educators may have paralleled broader social and economic issues.
Footnotes
Declaration of conflicting interests
The author(s) declared no potential conflicts of interest with respect to the research, authorship, and/or publication of this article.
Funding
The authors disclosed receipt of the following financial support for the research, authorship, and/or publication of this article: This article was supported by American Educational Research Association (grant no: NSF Grant #DRL-0941014 “AERA Grants Program”).
Appendix A
Math curriculum coherence for opportunity to learn content.
*Note: Compares TIMSS 2011 topics to prior math curriculum, (Common Core State Standards-Math) CCSSM and A+ top performing country research studies (see Schmidt & Houang, 2012)
TIMSS 2011
Broad Coding Topics
CCSSM Grades Covered*
A+ Countries Grades Covered*
Number
Concepts of whole numbers, including place value and ordering
Whole Number Meaning
1–5
1–5
Adding, subtracting, multiplying, and/or dividing with whole numbers
Whole Number Operations
1–5
1–5
Concepts of fractions (fractions as parts of a whole or of a collection, or as locatin on a number line; comparing and ordering of fractions)
Fractions
Adding and subtracting with fractions
Fractions
Concepts of decimals, including place value and ordering
Decimals
Adding and subtracting with fractions
Decimals
Number sentences (finding the missing number, modeling simple situations with number sentences)
Equations & Formulas
Number patterns (extending number patterns and finding missing terms)
Equations & Formulas
Geometric shapes and measures
Lines: measuring, estimating length of; parallel and perpendicular lines
Measurement Units, Estimating Quantity & Size, 2-D Geometry Basics
Comparing and drawing angles
2-D Geometry Basics
Using informal coordinate systems to locate points in a plane (e.g., in square B4)
2-D Geometry Basics
Elementary properties of common geometric shapes
2-D Geometry Basics
Reflections and rotations
2-D Geometry Basics
Relationships between two-dimensional and three-dimensional shapes
3-D Geometry
1–2 and 5–8
7–8
Finding and estimating areas, perimeters, and volumes
Perimeter, Area & Volume, Estimating Computations
Data display
Reading data from tables, pictographs, bar graphs, or pie charts
Data Representation & Analysis
1–8
3–6 and 8
Drawing conclusions from data displays
Data Representation & Analysis
1–8
3–6 and 8
Displaying data using tables, pictographs, and bar graphs
Data Representation & Analysis
1–8
3–6 and 8
Descriptive statistics for final two-level model of math learning.
aClassroom context variables were country/model specific and reduced for parsimony. bEstimates for descriptive statistics were pooled averages across items.
US
Belgium
Classroom Level
n = 465
n = 241
OTL Math Instruction
1.21
0.59
2.00
0.00
0.66
0.56
2.00
0.00
Educational Goals
2.98
1.53
4.00
0.00
1.14
1.93
4.00
0.00
Classroom—Family Academic Resources
1.30
0.01
1.64
0.76
1.21
0.01
1.37
0.90
Midsize Enrollment
a
0.59
0.24
1.00
0.00
-
-
-
-
Urban
a
-
-
-
-
0.12
0.11
1.00
0.00
Medium/Large Town
a
-
-
-
-
0.12
0.11
1.00
0.00
Small Town/Rural
a
-
-
-
-
0.65
0.23
1.00
0.00
Student Level
n = 8295
n = 4155
Family Academic Resources
1.31
0.07
3.00
0.07
1.21
0.04
1.65
0.29
Efficacy in Math
b
2.17
1.01
3.00
0
2.05
0.90
3.00
0.00
Student Perception—Math Lessons
b
2.53
0.57
3.00
0
2.33
0.49
3.00
0.00
Math Reasoning
b
531.42
5441.35
778.41
235.20
534.92
4866.74
766.62
279.39
Birth Year
2.63
0.27
4.00
0.00
2.86
0.19
5.00
0.00
Female
0.50
0.25
1.00
0.00
0.51
0.25
1.00
0.00