
Abstract
Given the expected advantages for individuals and societies, financial literacy is high on the policy agenda in many countries. This paper reports the results from a unique survey conducted on a sample of 13–16-year-old students in five European countries, aimed at measuring and comparing their level of financial literacy skills. The results indicate significant differences in the level of financial literacy across countries that are interpreted in the light of the differences in the countries’ educational policies and experiences with financial education. The findings suggest that supra-national coordinated action is needed to guarantee better financial knowledge and safeguard economic stability in future crises.
Introduction
Financial literacy is perceived as an essential competence in societies depending on individual responsibility and self-sufficiency (Amagir et al., 2020; De Beckker et al., 2020) and is considered a key requisite for participation in an increasingly complex financial and labour market (Walstad et al., 2017). At the individual level, being financially literate means handling actual and future money in a conscious way, for instance (i) by planning the future, such as retirement, or (ii) by forecasting possible unexpected expenses. At the societal level, financial illiteracy may negatively affect financial markets, with people investing in non-remunerative stocks or having low trust in financial institutions. The levels of financial literacy assessed through international surveys highlight how there is still a long way to go to reach satisfying results, with around one third of respondents typically having no basic financial knowledge (OECD, 2012, 2015, 2020b).
Impactful interventions to improve financial literacy should be organized at school level when students start managing their own money and making financial decisions (Iterbeke et al., 2020). 1 In addition, an early exposure helps in obtaining positive and lasting effects in the future (Bernheim et al., 2001). A meta-analysis by Kaiser and Menkhoff (2020) shows that early exposure to financial education significantly affects children’s and adolescents’ financial behaviour (+0.07 SD) and, to an even larger extent, financial knowledge (+0.33 SD). However, De Beckker, De Witte and Van Campenhout (2021) show that increased financial literacy does not necessarily result in improved consumer choices. Nevertheless, the need to increase awareness about financial literacy is emphasized by the relatively poor results of students in PISA (Programme of International Survey Assessment), a study designed to assess the competence of 15 years old students in several domains (OECD, 2012). Therefore, governments started financing and promoting schemes related to this subject in schools, which represent the preferable channel to reach all the population brackets with minimum effort.
This paper contributes to the understanding of channels leading to better financial knowledge by reviewing specific schemes in five European countries. Using the same survey, it provides a novel comparative analysis of financial literacy levels among young people in the selected countries. In particular, it assesses the levels of financial literacy (knowledge, attitudes and behaviour) of a sample of high-school students from Flanders (Belgium), Estonia, Italy, Netherlands and Slovakia. The opportunity of assessing these five countries in depth came from the joint participation in a European project aiming at designing, developing and evaluating instructional materials for students. This study also aims to assess financial literacy levels both in a country-specific, dimensions-specific and cross-country perspective. Specifically, the paper answers the following two research questions: (i) What factors are related to students’ financial literacy levels? (ii) What are the cross-country differences in factors associated with financial literacy?
The paper is organized as follows. The context: school curricula of participating countries Section 2 provides an overview of the financial literacy policy and curricula actions in schools in Flanders (Belgium), Estonia, Italy, Netherlands and Slovakia. This overview is particularly important given the key assumption that differences observed in the test scores might be related to the existing policies in the area. Data and Methods Section 3 describes the data and adopted methodology. The results are shown in Results: comparing financial literacy with pooled and cross-country models Section 4 while its implications are discussed in Conclusions Section 5.
The context: school curricula of participating countries
Synthetic information about financial literacy in the five European countries: PISA scores and ranking position and the magnitude of differences in PISA scores among subgroups of students.
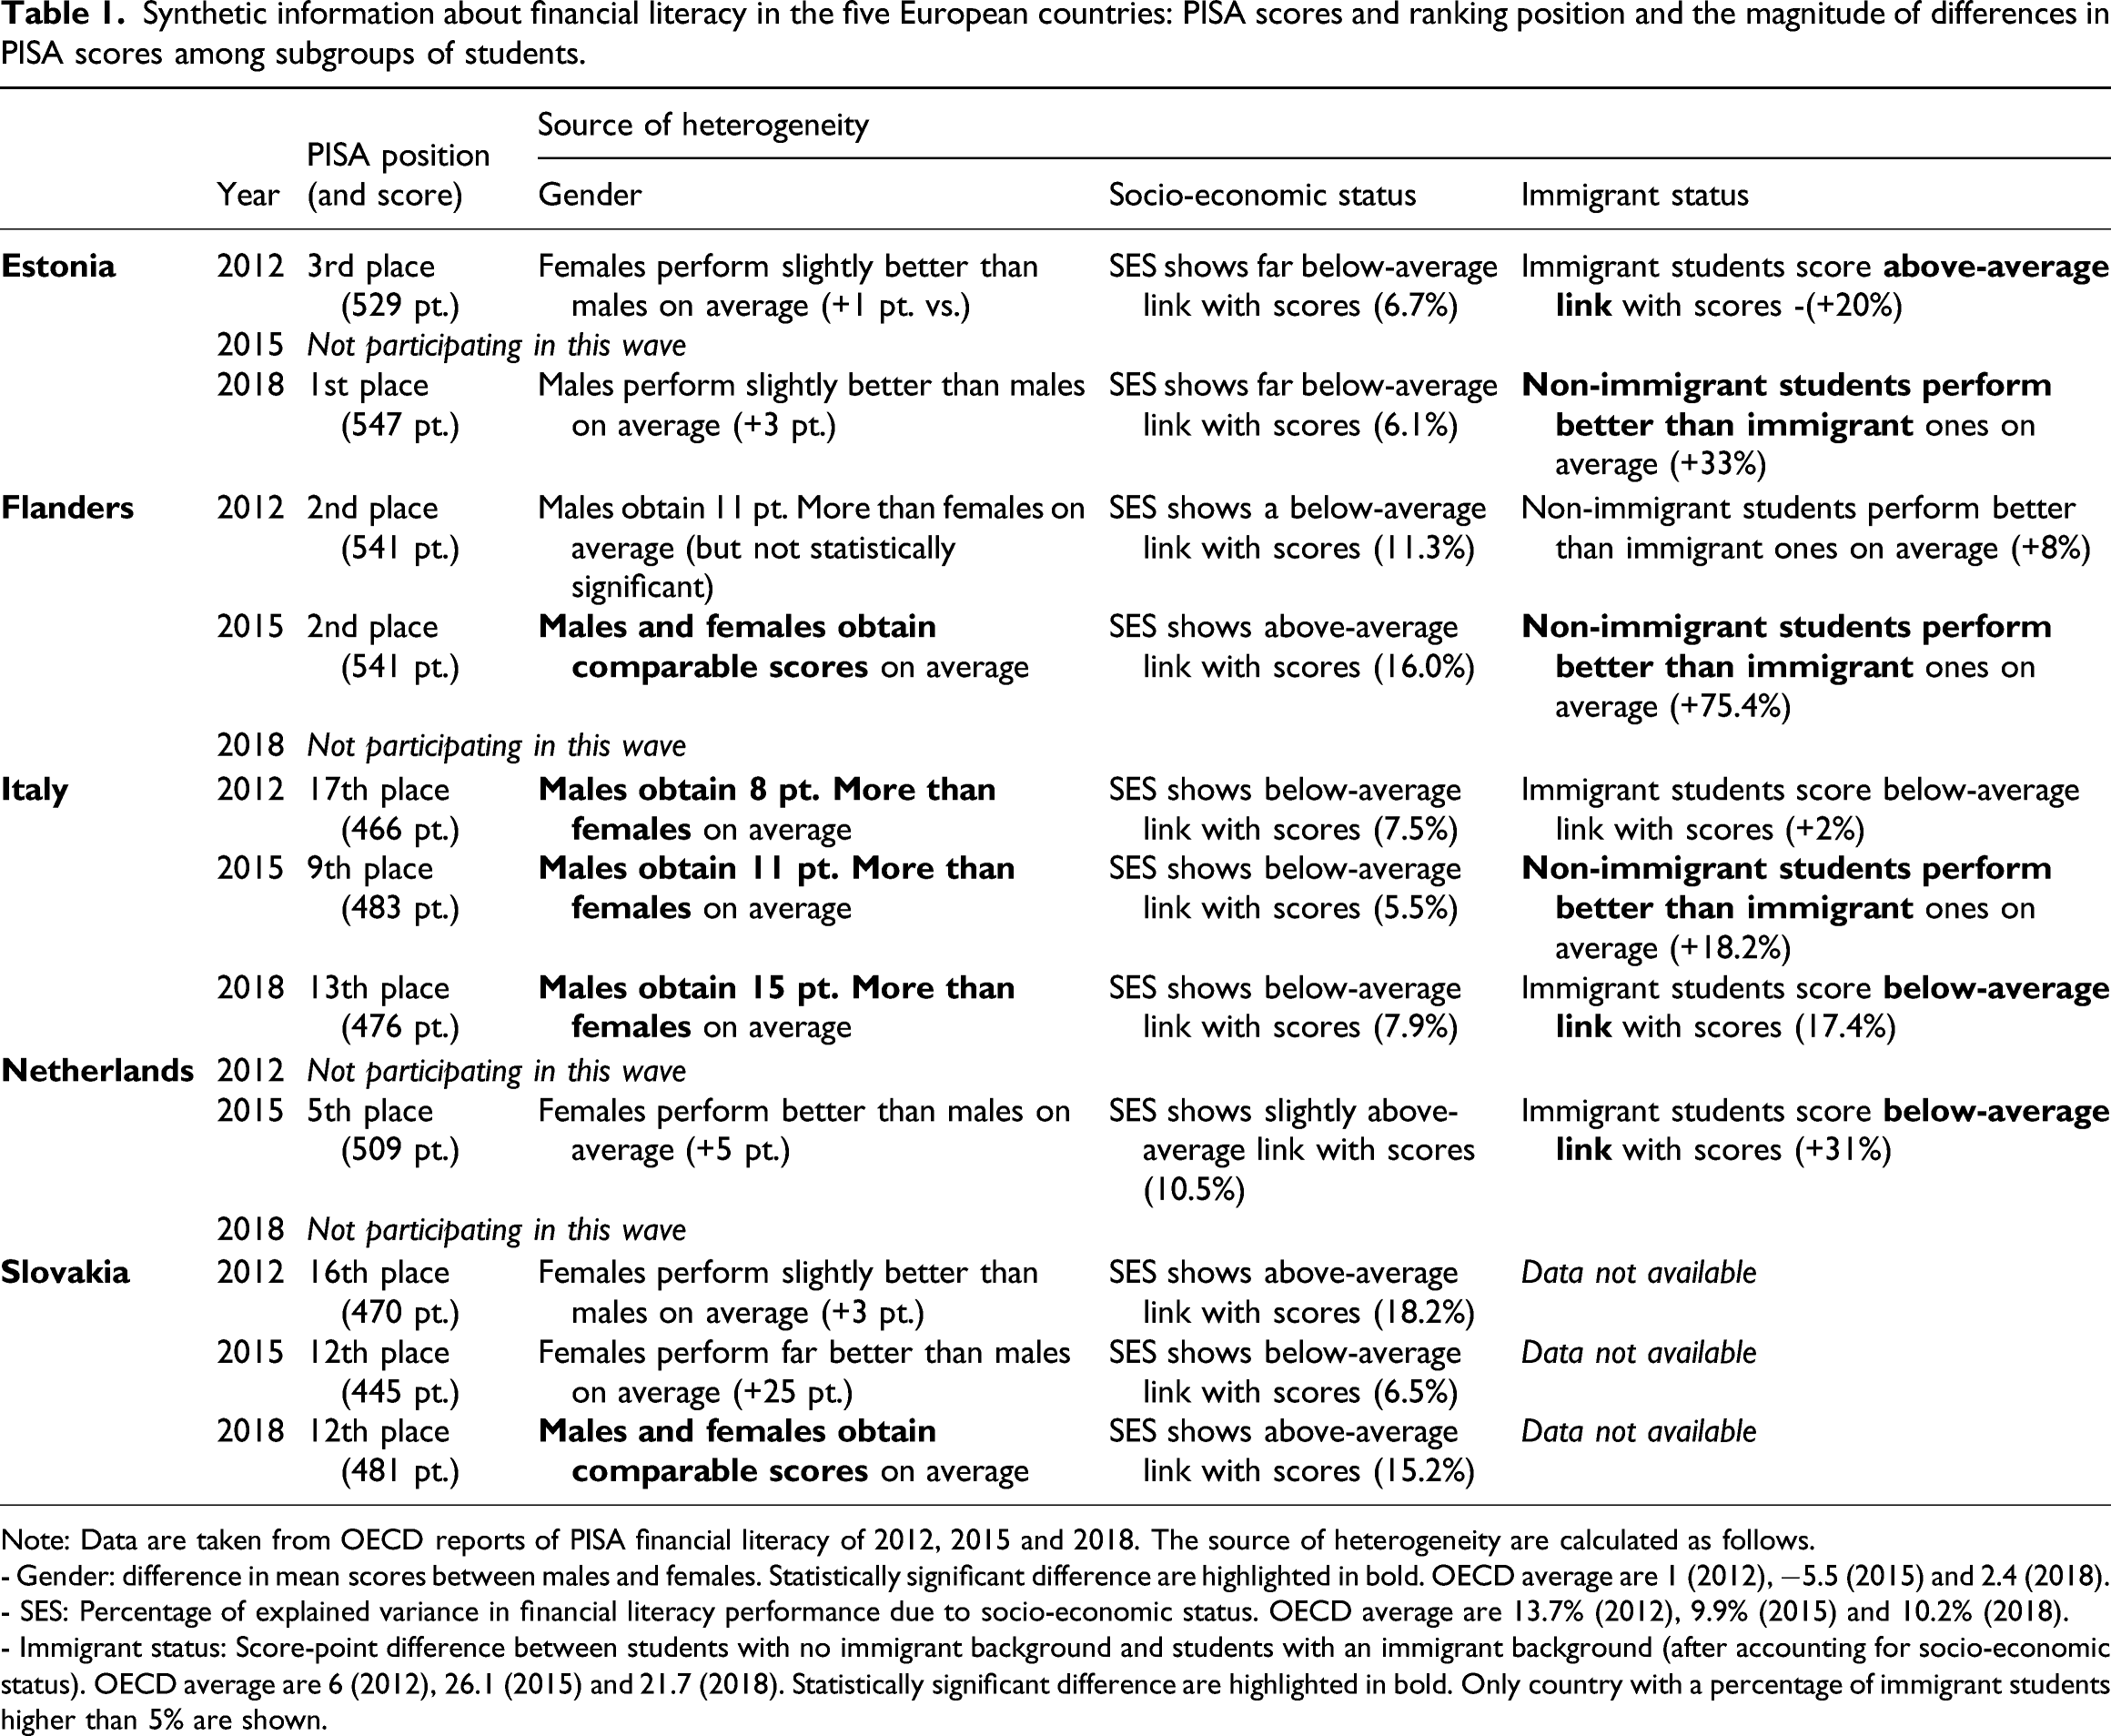
Note: Data are taken from OECD reports of PISA financial literacy of 2012, 2015 and 2018. The source of heterogeneity are calculated as follows.
- Gender: difference in mean scores between males and females. Statistically significant difference are highlighted in bold. OECD average are 1 (2012), −5.5 (2015) and 2.4 (2018).
- SES: Percentage of explained variance in financial literacy performance due to socio-economic status. OECD average are 13.7% (2012), 9.9% (2015) and 10.2% (2018).
- Immigrant status: Score-point difference between students with no immigrant background and students with an immigrant background (after accounting for socio-economic status). OECD average are 6 (2012), 26.1 (2015) and 21.7 (2018). Statistically significant difference are highlighted in bold. Only country with a percentage of immigrant students higher than 5% are shown.
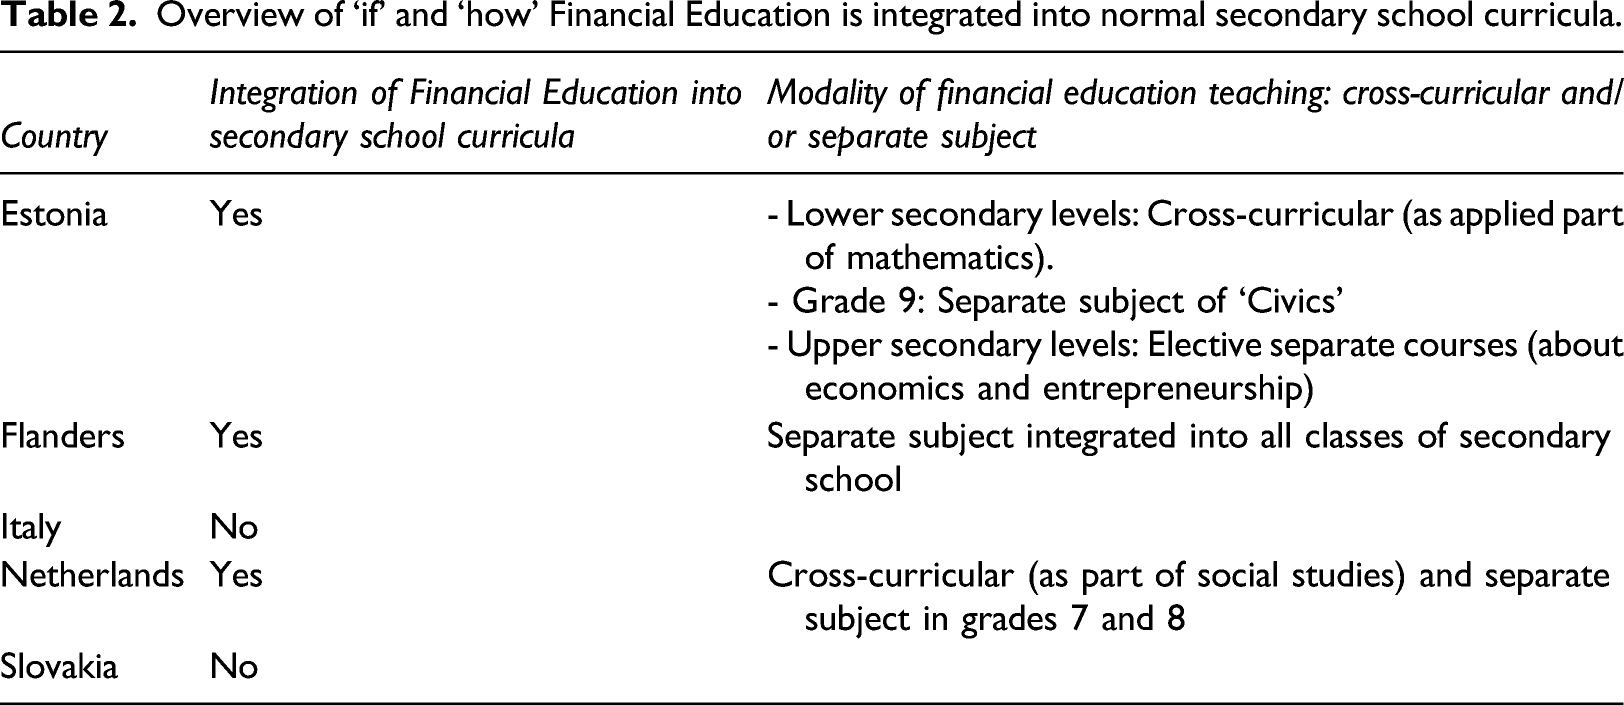
Overview of ‘if’ and ‘how’ Financial Education is integrated into normal secondary school curricula.
Before moving to the discussion of each country’s financial literacy in schools, it is worth to briefly describe the educational system in the five participating countries, according to the International Standard of Classification of Education (ISCED, 2011). Indeed, UNESCO (UNESCO Institute for Statistics, 2012) defined ISCED levels as criteria for classifying formal education programmes. In particular, the focus is on levels 1, 2 and 3 of ISCED, corresponding to primary, lower and upper secondary education. Estonian children enrol to compulsory full-time education from 7 to 16 years old (ISCED 1 and 2), after which ISCED 3 starts until 19. In Flanders, compulsory education is from 5 to 18 years old. ISCED 1 (primary school) comprises 6 to 12, then ISCED 2 ends when students are 14 years old, lastly ISCED 3 concludes at 18. In Italy, compulsory education starts when students are 6 years old and ends at their 16. ISCED 1 finished at 11 years old, ISCED 2 at 14 and ISCED 3 at 19. In Netherlands, compulsory education ranges from 5 to 16 years old. ISCED 1 brings students until their 12 years old, ISCED 2 to 15 and ISCED 3 to 18 2 . Slovaks must enrol to schools from 5 to 16 years old, during which ISCED 1 comprises ages from 6 to 10 and ISCED 2 from 11 to 15. Then, upper secondary school (ISCED 3) lasts until students’ 19 years old.
Financial Education is differently shaped in the different school systems. For instance, the educational curricula of Italy and Slovakia do not have any financial education courses, unlike the other countries, even if with a distinct proposal. Notably, students from Italy and Slovakia usually score below the OECD average in financial literacy, with substantial sources of heterogeneity related to gender, socio-economic status and citizenship. On the other hand, overviews of Estonia, Flanders and the Netherlands highlight a strong and increasing focus on financial literacy taught in schools, although with different approaches. Estonian secondary schools provide financial literacy as an application of mathematical concepts for children, while higher level students can follow optional courses of economics and entrepreneurship. In Flanders, financial literacy is a new subject in secondary school; it was introduced in 2019 among compulsory curricula. Lastly, the Netherlands has an even different approach in introducing financial topics into school curricula; they can be part of social studies or as an independent course, allowing schools to decide on how to settle the question of curricula. A more detailed overview on how financial literacy is shaped in the different countries is the subject of the following paragraphs.
In PISA 2012, on average across OECD countries and economies, non-immigrant students perform slightly better in financial literacy than immigrant students with similar socio-economic status, language spoken at home and performance in mathematics and reading. The gap in financial literacy performance between immigrant and non-immigrant students is larger than the OECD average in the Flemish Community of Belgium, Estonia, France, Slovenia and Spain. The following paragraphs will resume the key aspects related to schools’ curricula about financial education, together with the results of PISA 2012, 2015 and 2018. An overview of these concepts is showed in Tables 1 and 2.
Estonia
In 2012, Estonia took part in the financial literacy PISA assessments, skipped it in 2015 and re-joined in 2018. According to the 2012 results, Estonian 15-year-old students took third place after Shanghai-China and the Flemish part of Flanders, then in 2018 Estonian students triumphed at the top of the ranking, followed closely by Finland and Canada. Various aspects are worth highlighting. Firstly, a high PISA financial literacy score average and statistically relevant positive changes during the last six years (by 18 points) were the most glaring results from the 2018 assessment. There was a small proportion of students (compared to OECD average) who performed in the lowest level and many who positioned themselves in the highest level of financial knowledge. Secondly, although many countries recognized gender effects in financial literacy scores – males perform better than girls – there were no such statistically significant gender differences in Estonia (Riitsalu, 2020). Thirdly, the variance in scores was low compared to the OECD average, indicating that differences in financial knowledge of students were relatively small. Fourthly, the family background effect was much smaller in Estonia than the OECD average and around 10% of the variance in the scores were explained by the socio-economic background index in OECD average while only 6% of the variance in Estonia (see Table 1). Finally, the most significant source of heterogeneity is due to the difference in scores among immigrant and non-immigrant students. On average, immigrant students scored lower by around 20% in 2012 and 33% in 2018, against an OECD average of 20%.
The Estonian educational system has comprehensive schooling with a marginal share of private schools. One cornerstone of the comprehensive system, in addition to horizontal equity granted by similar per capita financing of schools, is the national curriculum, which all schools follow. The path-dependent particularity of the Estonian comprehensive school system is language streaming. There have been Russian and Estonian language schools operating in parallel inherited from soviet times. The problem of the achievement gap between the minority (Russian) and majority (Estonian) schools is slowly gaining recognition (Riitsalu and Põder 2016; Lauri and Põder 2021), but no similar results emerge in financial knowledge between Estonian and Russian school students. Furthermore, it is acknowledged (OECD, 2016; Santiago et al., 2016) that Estonian schools are among the most autonomous in OECD regarding school operation, but it is often misinterpreted as teacher autonomy. Erss (2015) argues that teacher autonomy in Estonia is hindered by an increase in electronic ‘paperwork’, performance pressure from centralized final exams and accountability pressure by parents and schools. There are some particularities of it related to teaching financial literacy, but most of all there is a national curriculum that defines objectives and time spent on studies. In the lower secondary level, the ‘Civics’ course is provided in the 6th grade (14 year olds) once per week and in the 9th grade (17 year olds) twice a week. In the 6th grade, there are no topics related to financial literacy, while in the 9th grade, there are personal finance-related topics such as loans and borrowing, risks associated with loans, investing, stocks and shares and pension funds (see also Põder et al., 2020). At the upper secondary level, there are no mandatory courses in financial literacy; however, optional courses of economics and entrepreneurship can be taught by schools.
As the Education Ministry and national curriculum promotes integrative teaching and learning, we observe that financial literacy in lower secondary level is taught in mathematics classes. We also see that PISA scores in financial education are highly correlated (0.87) with PISA mathematics scores in Estonia. Also, 68.3% of students claim that their main source of financial literacy is the mathematics lessons. Moreover, students who learn about financial matters from math lessons score the highest in the PISA financial literacy test (Riitsalu, 2020).
Flanders
According to the OECD PISA tests, Flemish students scored relatively well on financial literacy. With an average score of 541, Flemish 15-year-old students were placed second in the PISA 2015 ranking (i.e. the latest Pisa wave in which Flanders participates). However, this high average masked a significant share of low performing students. About 12% of the youngsters did not reach the basic level, while 24% of the respondents were qualified as top performers. Comparing the 2012 and 2015 PISA waves, the performance of 15-year-old Flemish students slightly decreased over time. This was in line with the other domains such as maths and reading.
The significant heterogeneity in these results was also evident from analysing the PISA assessments by socio-economic status (SES) group. The difference between the average financial literacy scores of the highest and lowest SES groups amounts to 140 PISA points. Also, this difference corresponds to 11% and 16% of explained variance in financial literacy performance due to socio-economic status (see Table 1 for further details).
The weak financial literacy performance of a group of youngsters was also visible among adults. Using the INFED data, De Beckker, De Witte and Van Campenhout (2019) showed that about 5% of the Belgian adult population is financially illiterate, that is, they do not reach the basic competence level on knowledge, attitudes and skills. The majority of Belgian adults (58%) underperformed on one of these three dimensions. Another important source of difference among Flemish students was due to the immigration status of participants. Especially in PISA 2015, Flanders stood out with a significant heterogeneity in scores obtained by immigrant and non-immigrant students (with the former showing poorer performance).
Despite the high average of financial literacy performance, the strong heterogeneity in test scores urged Flemish policy makers to include financial literacy in the compulsory education curriculum. Since 2019, financial literacy has been introduced gradually in secondary education, after having already introduced it in primary education. In the first years of the secondary education curriculum, financial literacy is taught on a rather basic level, which mainly aims to protect students against misuse from phishing or lending. Gradually, the learning line elaborates on the concepts so that students are introduced to concepts such as insurance types, social security or lending. Although the curriculum demands mainly conceptual knowledge of the students and little analytical financial literacy knowledge, it is designed in such a way that graduating students possess all knowledge, skills and attitudes to successfully participate in society. Even if it is too soon to see the effects of this reform in PISA results, it is likely that this curriculum will close the financial literacy attainment gap as it avoids self-selection. The compulsory education curriculum reaches all students, irrespective of migration status, SES or earlier financial inclusion. The main challenge for the Flemish curriculum will be to provide professional development initiatives to the teachers (Compen et al., 2021).
Italy
Italian adults, on average, reported low levels of financial literacy and this was confirmed by various studies (Fornero and Monticone, 2011; Jappelli, 2010; Klapper et al., 2015; Russo, 2018). Italy is more in line with the performance in financial education of developing countries rather than developed ones, with only 37% financially literate adults (Klapper et al., 2015). Baglioni, Colombo and Piccirilli (2018) also confirm this worrying result, observing that Italy is lagging behind other high-income countries where it exhibits an average level of financial literacy in line with medium-income countries. Furthermore, Italy is the country where the gender gap stands out most evidently; men answered 25% more correctly than women (Allianz, 2017). A comparable situation emerges if we analyse results in financial literacy assessment for the young population from PISA (Programme for International Student Assessment) in 2012, 2015 and 2018.
In PISA 2012, Italian levels of financial literacy among 15-year-old students were far below those of the other OECD members; only 2% of students score the highest level, against almost 10% for the OECD. Results slightly improved in 2015 and 2018, although still largely unsatisfactorily, since the Italian ranking position was always below OECD average.
In every PISA assessment, some heterogeneity in scores emerged, confirming previous research; in Italy, boys performed better than girls, and there were more boys than girls among the top performers. Different sources confirmed this gender gap (Di Chiacchio and Greco, 2017), which seemed to be a peculiarity of the Italian population. This significant difference between genders is particularly worrying since it was highlighted in all three PISA waves in which Italy participated. As detailed in Table 1, Italian male students scored 8, 11 and 15 points significantly higher than females in 2012, 2015 and 2018, respectively. Another source of heterogeneity concerned the students’ origins, where immigrant students scored on average lower than native students in line with the OECD average but significant. Finally, the students experience and behaviour with money, and their performance in financial literacy, such as holding a bank account, was associated with higher scores. It is worth noting that the differences in scores among students with different socio-economic status were not significant (even though students from wealthier families perform better, on average).
The Italian educational system does not include any mandatory programme on financial education in schools, except for those streams focused on Economic Studies (the Italian Istituto Tecnico and Liceo Economico Sociale), which are however chosen by a minority of students (around 11%). In all the other school streams, the projects on financial education are voluntary.
The increasing international attention to the topic and its related benefits convinced the national government to develop a plan to raise awareness about financial education. The efforts in this direction might be summarized with three main phases. In 2007, the Italian Education Ministry signed the ‘Memorandum d’Intesa’ (i.e. Memorandum of Understanding) with different actors, such as the Bank of Italy, for the promotion of financial education matters in schools. In 2015, the government approved the ‘Buona Scuola’ (i.e. Good School) law, promoting an intent agreement document. Then, the institution of a Committee in 2017, together with the setting of a National Strategy concerning the financial, insurance and social security education, represents the highest moment of political attention to this theme. Consequently, an increasing number of related initiatives over the Italian territory started spreading out, especially in schools, even when not forecasted by school curricula. A recent analysis carried out by ONEEF, a national observatory on Financial Education, documented that around 300 experiences of financial education were developed in 2018 (Rinaldi, 2020).
The Netherlands
In the Netherlands, Amagir et al. (2020) found considerable differences between the financial knowledge levels of 15-year-old students in the lowest Dutch secondary school track (VMBO) and those in the highest track (VWO). These large differences were consistent with the findings of the PISA 2015 among 15-year-olds (OECD, 2017), showing that the widest gaps of knowledge exist between the lowest and highest performing students in the Netherlands and in Beijing-Shanghai-Jiangsu-Guangdong (China). Moreover, Dutch students in the lowest secondary school stream tended to behave less responsibly with their finances and gave little importance to thinking about a purchase before deciding (Amagir et al., 2020; OECD, 2017). Dutch students with a low socio-economic status (SES) and students whose mothers did not have a university degree have less financial knowledge (Amagir et al., 2020; OECD, 2017). Furthermore, there was a gap in financial knowledge scores between immigrant and non-immigrant students in the Netherlands (Amagir et al., 2020; OECD, 2017), see also Table 2, as well as some cultural differences with respect to attitudes towards money (Amagir et al., 2020). Interestingly, the results of PISA 2015 (the only wave Netherlands joined), show no statistically significant differences in performance between males and females (Table 1).
Dutch secondary education is divided into three main tracks, namely, a four-year pre-vocational track (VMBO), a five-year general secondary track (HAVO) and a six-year pre-university track (VWO). The lowest level four-year track, VMBO, is subdivided into a basic (VMBO-BK) and a more advanced level (VMBO-GT) (Nuffic, 2019). The core part of the curriculum in the seventh, eighth and ninth grades, as described by the Ministry of Education, is intended for all students and targets 58 globally formulated core objectives (Rijksoverheid Government of the Netherlands, 2010). Each school determines its own concrete elaboration of the core objectives in subjects, projects, learning areas or a combination of these. In the Netherlands, economics is scheduled either as a separate subject or as part of social studies and is a mandatory part of the curriculum for all students in the seventh, eighth or ninth grade (Amagir, 2020b). Although economics is mandatory, financial education is not currently a prescribed part of it (Amagir et al., 2020). Financial education is only provided sporadically in secondary schools as part of existing subjects such as economics or social studies (Amagir, 2020a). Limited attention is given to such financial education topics as budgeting or buying goods and services. Teaching priorities with respect to financial education are determined by the school or individual teachers (Money Wise in Geldzaken, 2014).
Slovakia
Financial literacy in Slovakia was tested regularly by several institutions including the Slovak Banking Association, the financial intermediating company Partners Group SK, different research agencies such as Focus and GfK, and the National Bank of Slovakia which uses PISA assessment results.
First, the average 2012 PISA score of Slovak students in financial literacy was 470 points (compared to the 500 of the OECD average), ranking in 16th place among the 18 countries tested. Results of Slovak students were comparable with Croatia, Italy and Israel. Again in PISA 2015, many Slovak 15-year-old students struggled to understand money matters, showing a significant deterioration by 25 points on average performance and also an increase in the share of students who scored below Level 2 by 12%. A promising improvement in average score was obtained in PISA 2018, with 481 points and ranking in 12th place. If financial knowledge decreases from 2012 to 2015, is not the same for financial behaviour; indeed, the number of Slovak students reporting that they hold a bank account increases considerably from 30% to 42%, but the number of those who own a prepaid debit card stayed at 20% (OECD, 2012; Zvarikova and Majerova, 2013; NBS, 2019a). Comparing 2012 and 2015, in 2015, Slovak students received money from more sources (OECD, 2015; Rentkova et al., 2018; NBS, 2019a). As reported in Table 1, interestingly, if considering gender and socio-economic status differences, no statistically significant gaps emerge from the international assessment.
In reaction to 2015 PISA assessment, the Ministry of Education, Science, Research and Sport of the Slovak Republic decided that financial literacy must be implemented in the curriculum of primary and secondary schools (Balazova, 2015). The National Bank of Slovakia also reacted to the 2015 PISA assessment and organized an event called ‘Financial Consumer Days’ which took place from 12 to 14 October 2016, consisting of a series of workshops and presentations about pensions, investing, insurance, banking, financial education and financial ethics (NBS, 2016; Corejova et al., 2016; Katuscakova and Jaseckova, 2016). More than 10,000 students from primary and secondary schools participated in presentations and workshops (NBS, 2019b).
The Ministry of Finance of the Slovak Republic have presented a project aimed primarily at elementary school teachers and pupils regarding terms such as loan, credit, mortgage, mortgage repayment and interest. The main objective of the project is to increase financial literacy. The pilot event named ‘Day for Schools’ took place in September 2019, where 300 pupils from 15 primary schools in Bratislava engaged in activities about what money is and how it is used (TASR, 2019). According to PISA 2018, the performance of Slovak boys and girls in the field of financial literacy was at the same level (the difference is not statistically significant). The real difference in results appeared in the comparison of regular and disadvantaged pupils, with a statistically significant deviation of 101. A negligible statistical deviation appeared when comparing the results of residents and immigrants (National Institute for Certified Educational Measurements, 2020).
Data and methods
Data
The process for collecting the literacy questionnaires was part of a broader project, called EUFin, which involved five countries (Estonia, Flanders, Italy, Netherlands and Slovakia) represented by universities, high-schools and third parties such as banks, chambers of commerce or non-profit organizations dealing with financial literacy. In particular, the surveys represented the first step of a scheme to evaluate didactical materials developed by the Flemish team and tested in the five countries. 3 To collect data for the comparative analysis, each country opened a call to involve teachers and school principals with a target student population aged between 13 and 16 years old. The open call was attractive in order to maximize response rates, but it came at the cost of losing a representative sample. The survey consisted of a background section, a financial knowledge test and a survey designed to assess attitudes and behaviour towards money. The survey was administrated in the local language of the participating countries. Because students could not skip any questions in the online survey no missing values are present in the dataset. The collection process started in November 2020 and concluded in January 2021, gathering around 4000 responses.
Measurements
Descriptive statistics and definition of regressor – pooled.
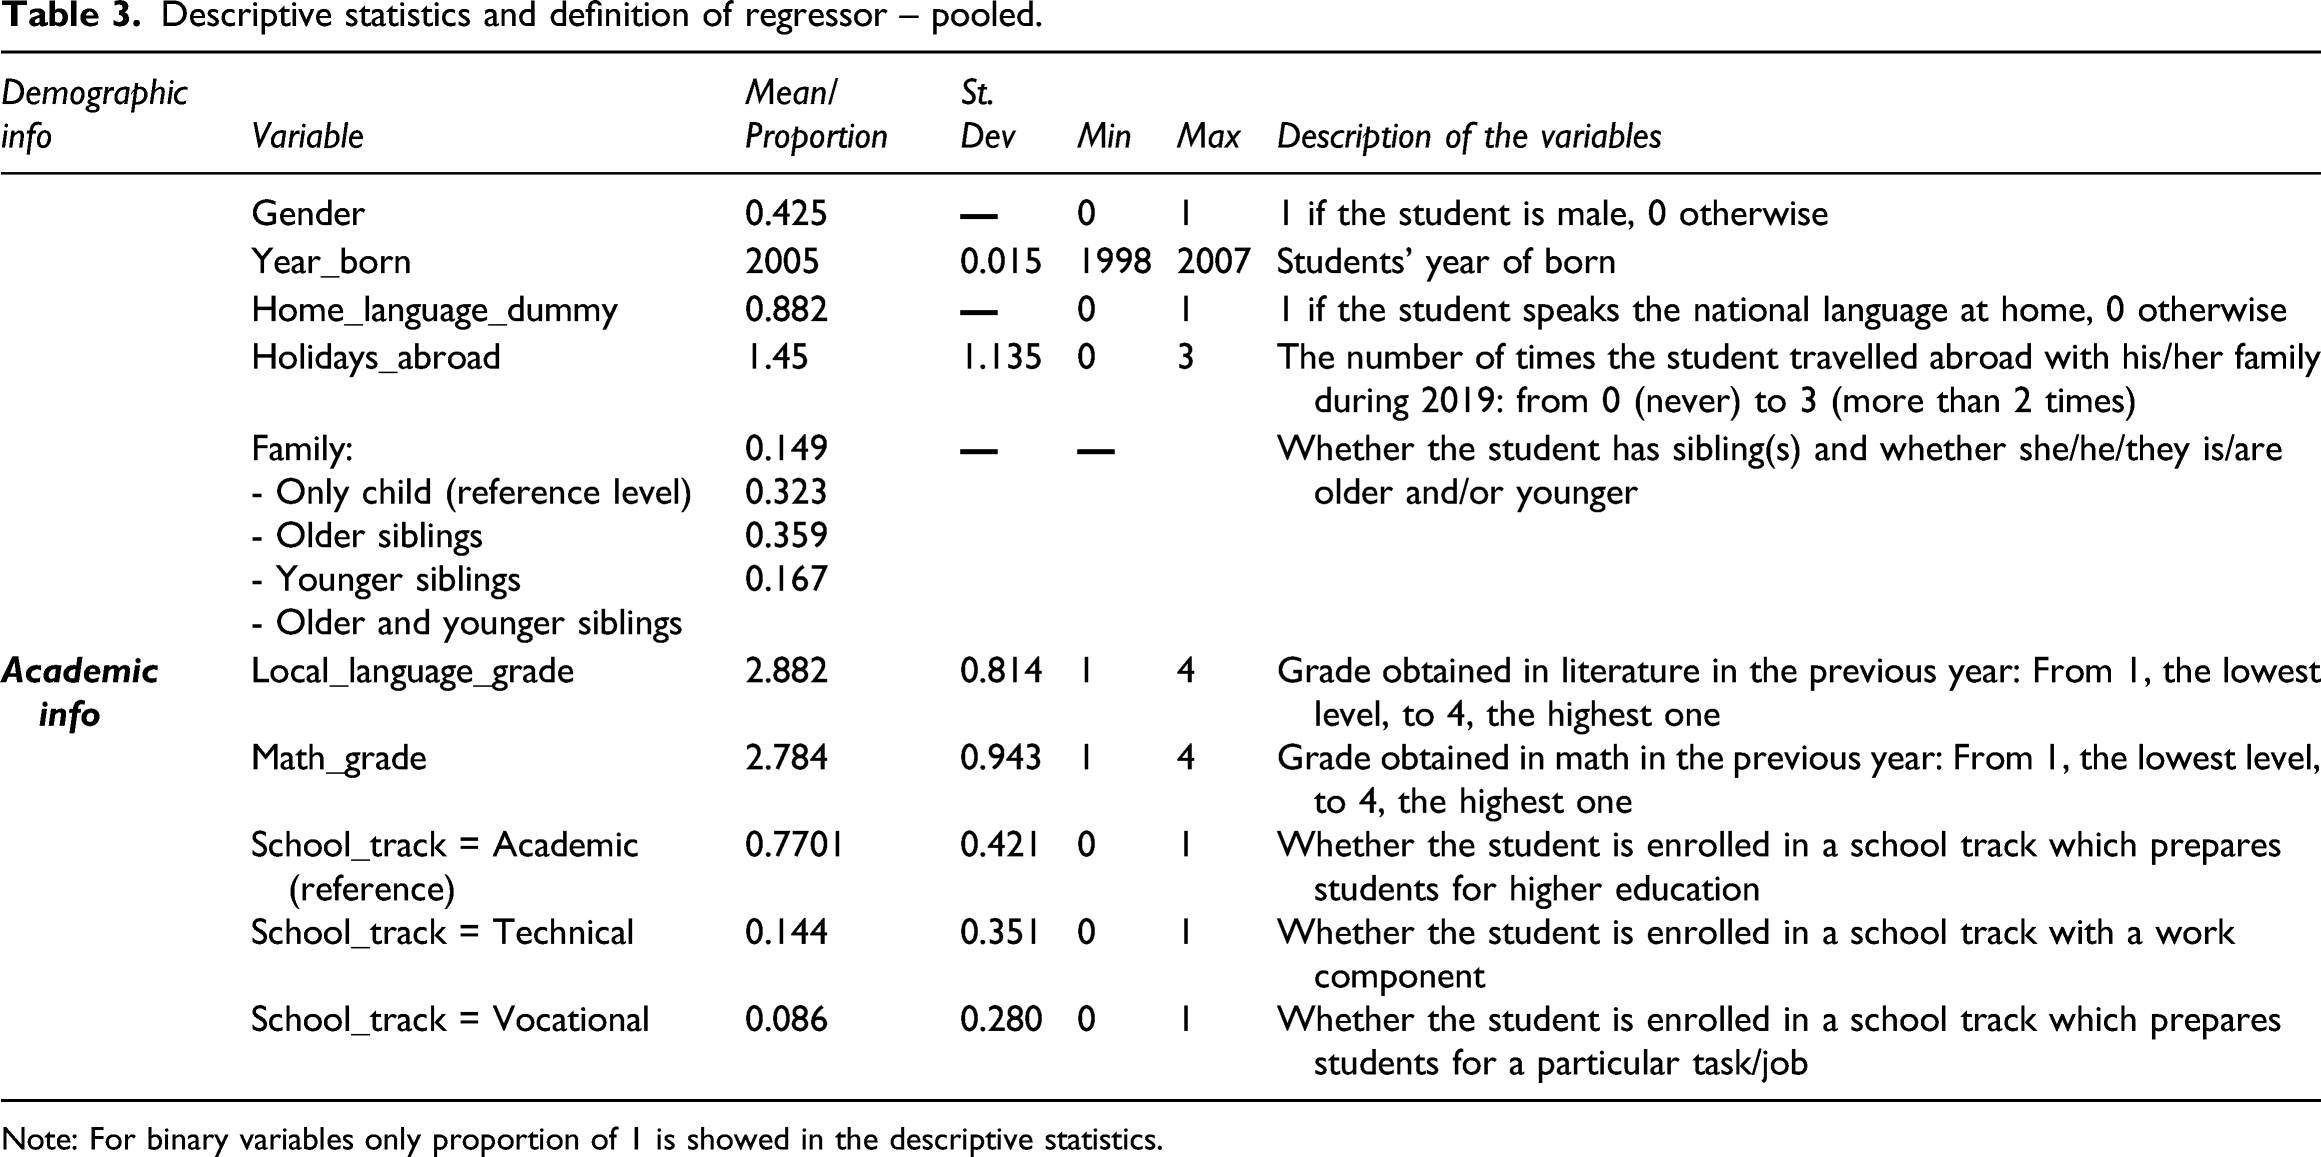
Note: For binary variables only proportion of 1 is showed in the descriptive statistics.
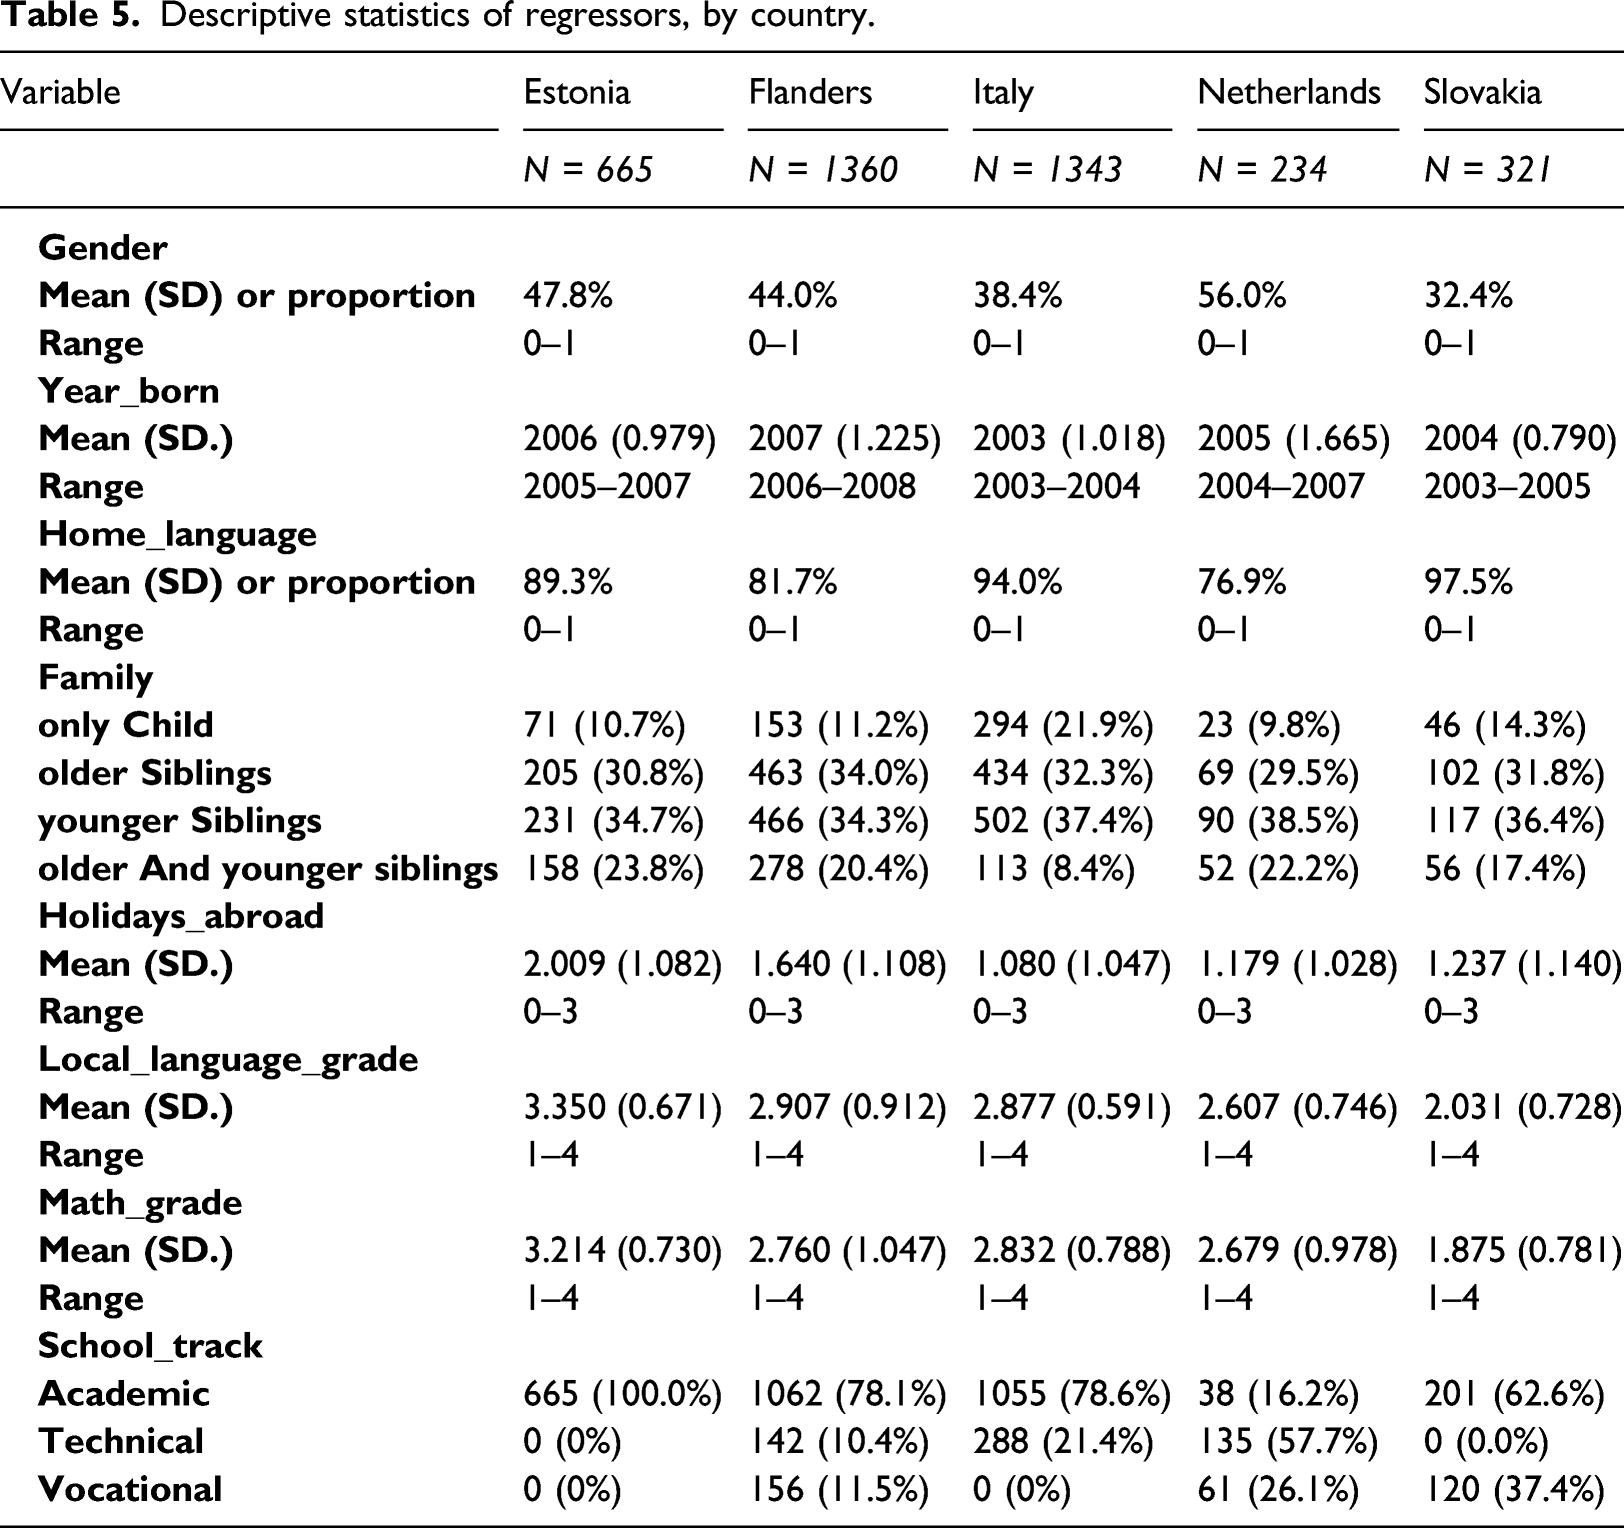
The educational information mainly comprises performance and school track. Students self-estimated their math and local language level, assigning a grade from 1 (the worst) to 4 (the best). To handle data as comparable as possible, in the subsequent analysis grades were standardized within countries. Along the same line, school tracks were homogenized, grouping them into three main categories: (i) academic tracks, specifically for preparing students for Higher Education, (ii) technical tracks, similar to academic ones but with an applied component embedded into the curriculum, such as work experience and (iii) vocational tracks, set up to prepare students for a specific job or task.
The second part of the test was divided into the three dimensions of financial literacy, namely, knowledge, attitudes and behaviour (see Table 4 for details). Here it is worth going deeper into this three-fold concept. As stated by Vitt (2004), financial literacy plays an essential role in the process of making financial decisions, as it represents a systematic effort aimed at the development of positive knowledge, behaviour and attitudes. This is further confirmed by the definition given by Remund (2010), stating that ‘Financial literacy is a measure of the degree to which one understands key financial concepts and possesses the ability and confidence to manage personal finances through appropriate, short-term decision-making and sound, long-range financial planning, while mindful of life events and changing economic conditions’. Remund (2010) clarifies that the three dimensions may be seen as consecutive; knowledge drives attitudes, which, in turn, change behaviours, in particular the ability to manage one’s own money. Although the intersection of these three concepts and capturing their complexity is still an object of debate among scholars, the purpose of the survey is to evaluate the three items of financial literacy. In particular, financial knowledge was assessed with six multiple choice questions about compound interest, inflation and the correct use of credit and debit cards (see Supplemental Appendix A for the items). The main theoretical topics touched on in this part of the questionnaire regard the understanding of inflation and interest and their interrelation (as also adopted by Fornero and Monticone, 2011; Oggero and Rossi, 2016).
Attitudes towards money were assessed on the basis of three items for investigating their beliefs and interest in finance and the approach in handling money, as also expressed by Rinaldi and Todesco (2012). It must be noted here that attitudes are likely to be affected by the families’ socio-economic backgrounds. Lastly, following Hilgert et al.’s (2003) Financial Practices Index, financial behaviour was assessed through three items concerning students’ savings and purchasing behaviours. In particular, this survey assesses cash-flow management and savings aspects, which represent daily practices of secondary school students. In this case, it must be stressed that financial behaviours are self-reported, as participants are only required to self-assess their own behaviour in managing their money. By averaging the students’ answers related to financial attitudes and self-reported behaviour, the indicators Financial Attitudes and self-reported Financial Behaviour are built. To measure financial knowledge, we adopted the score obtained by students in the related six questions and calculated the percentage of correctly answered questions.
Descriptive statistics of financial literacy’s dimensions by item – pooled.
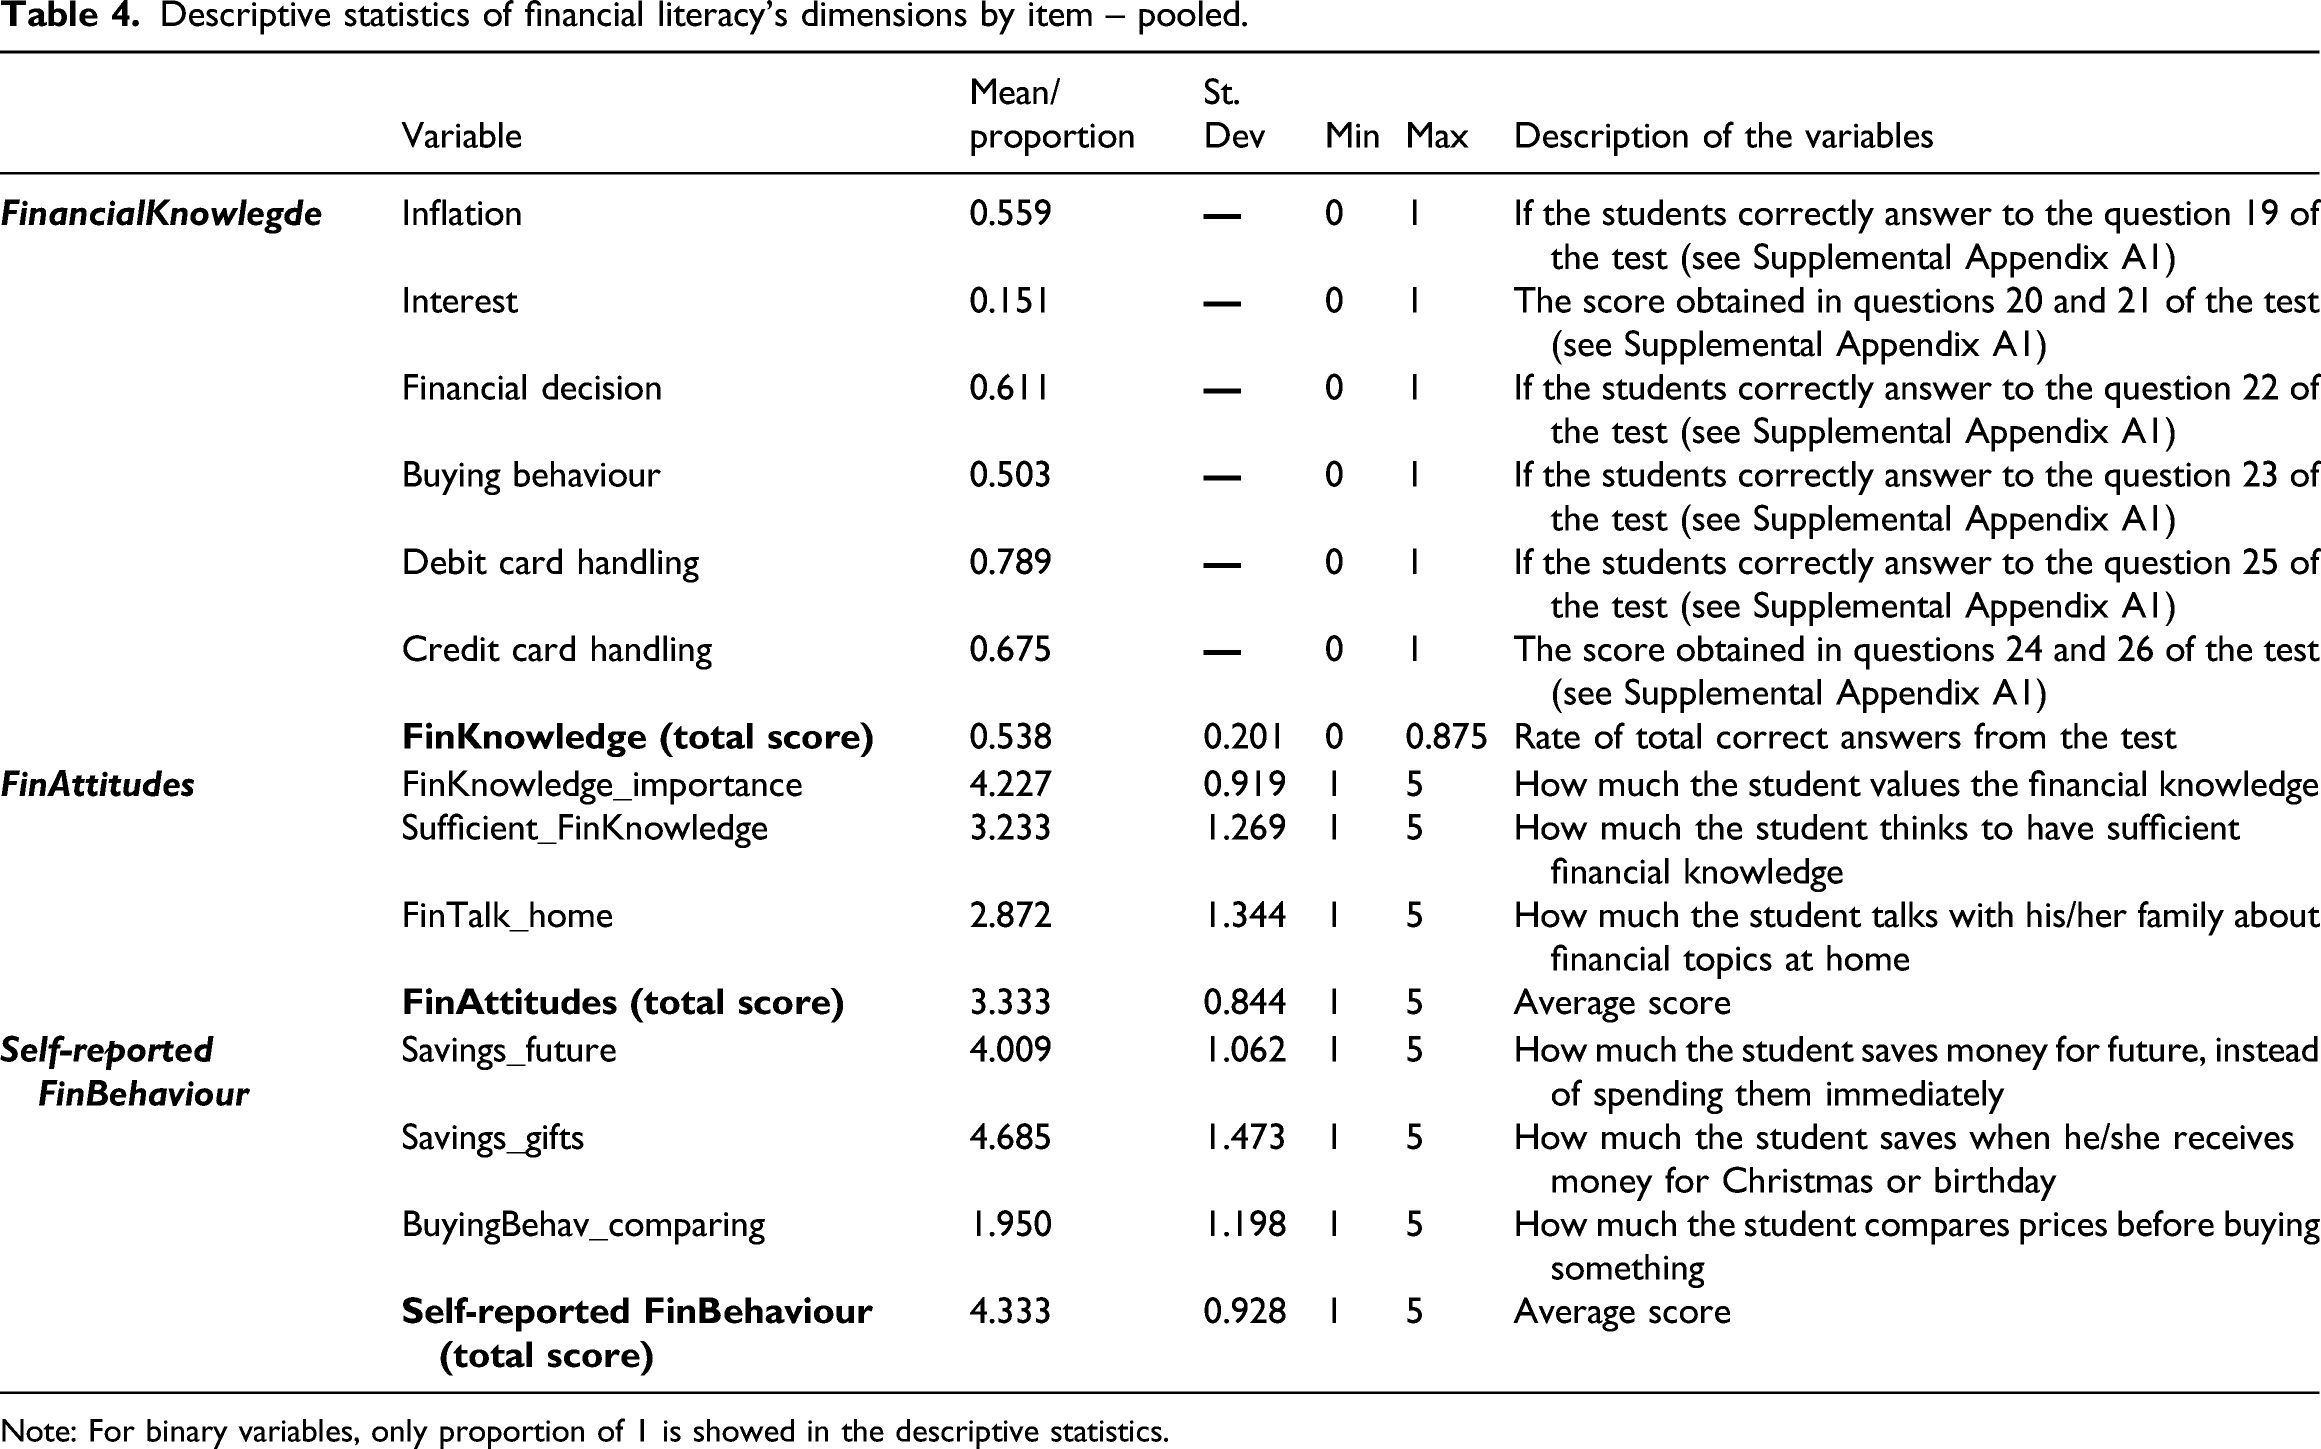
Note: For binary variables, only proportion of 1 is showed in the descriptive statistics.
Sample descriptive statistics
Descriptive statistics of regressors, by country.
Descriptive statistics of financial literacy’s dimensions by item by country.
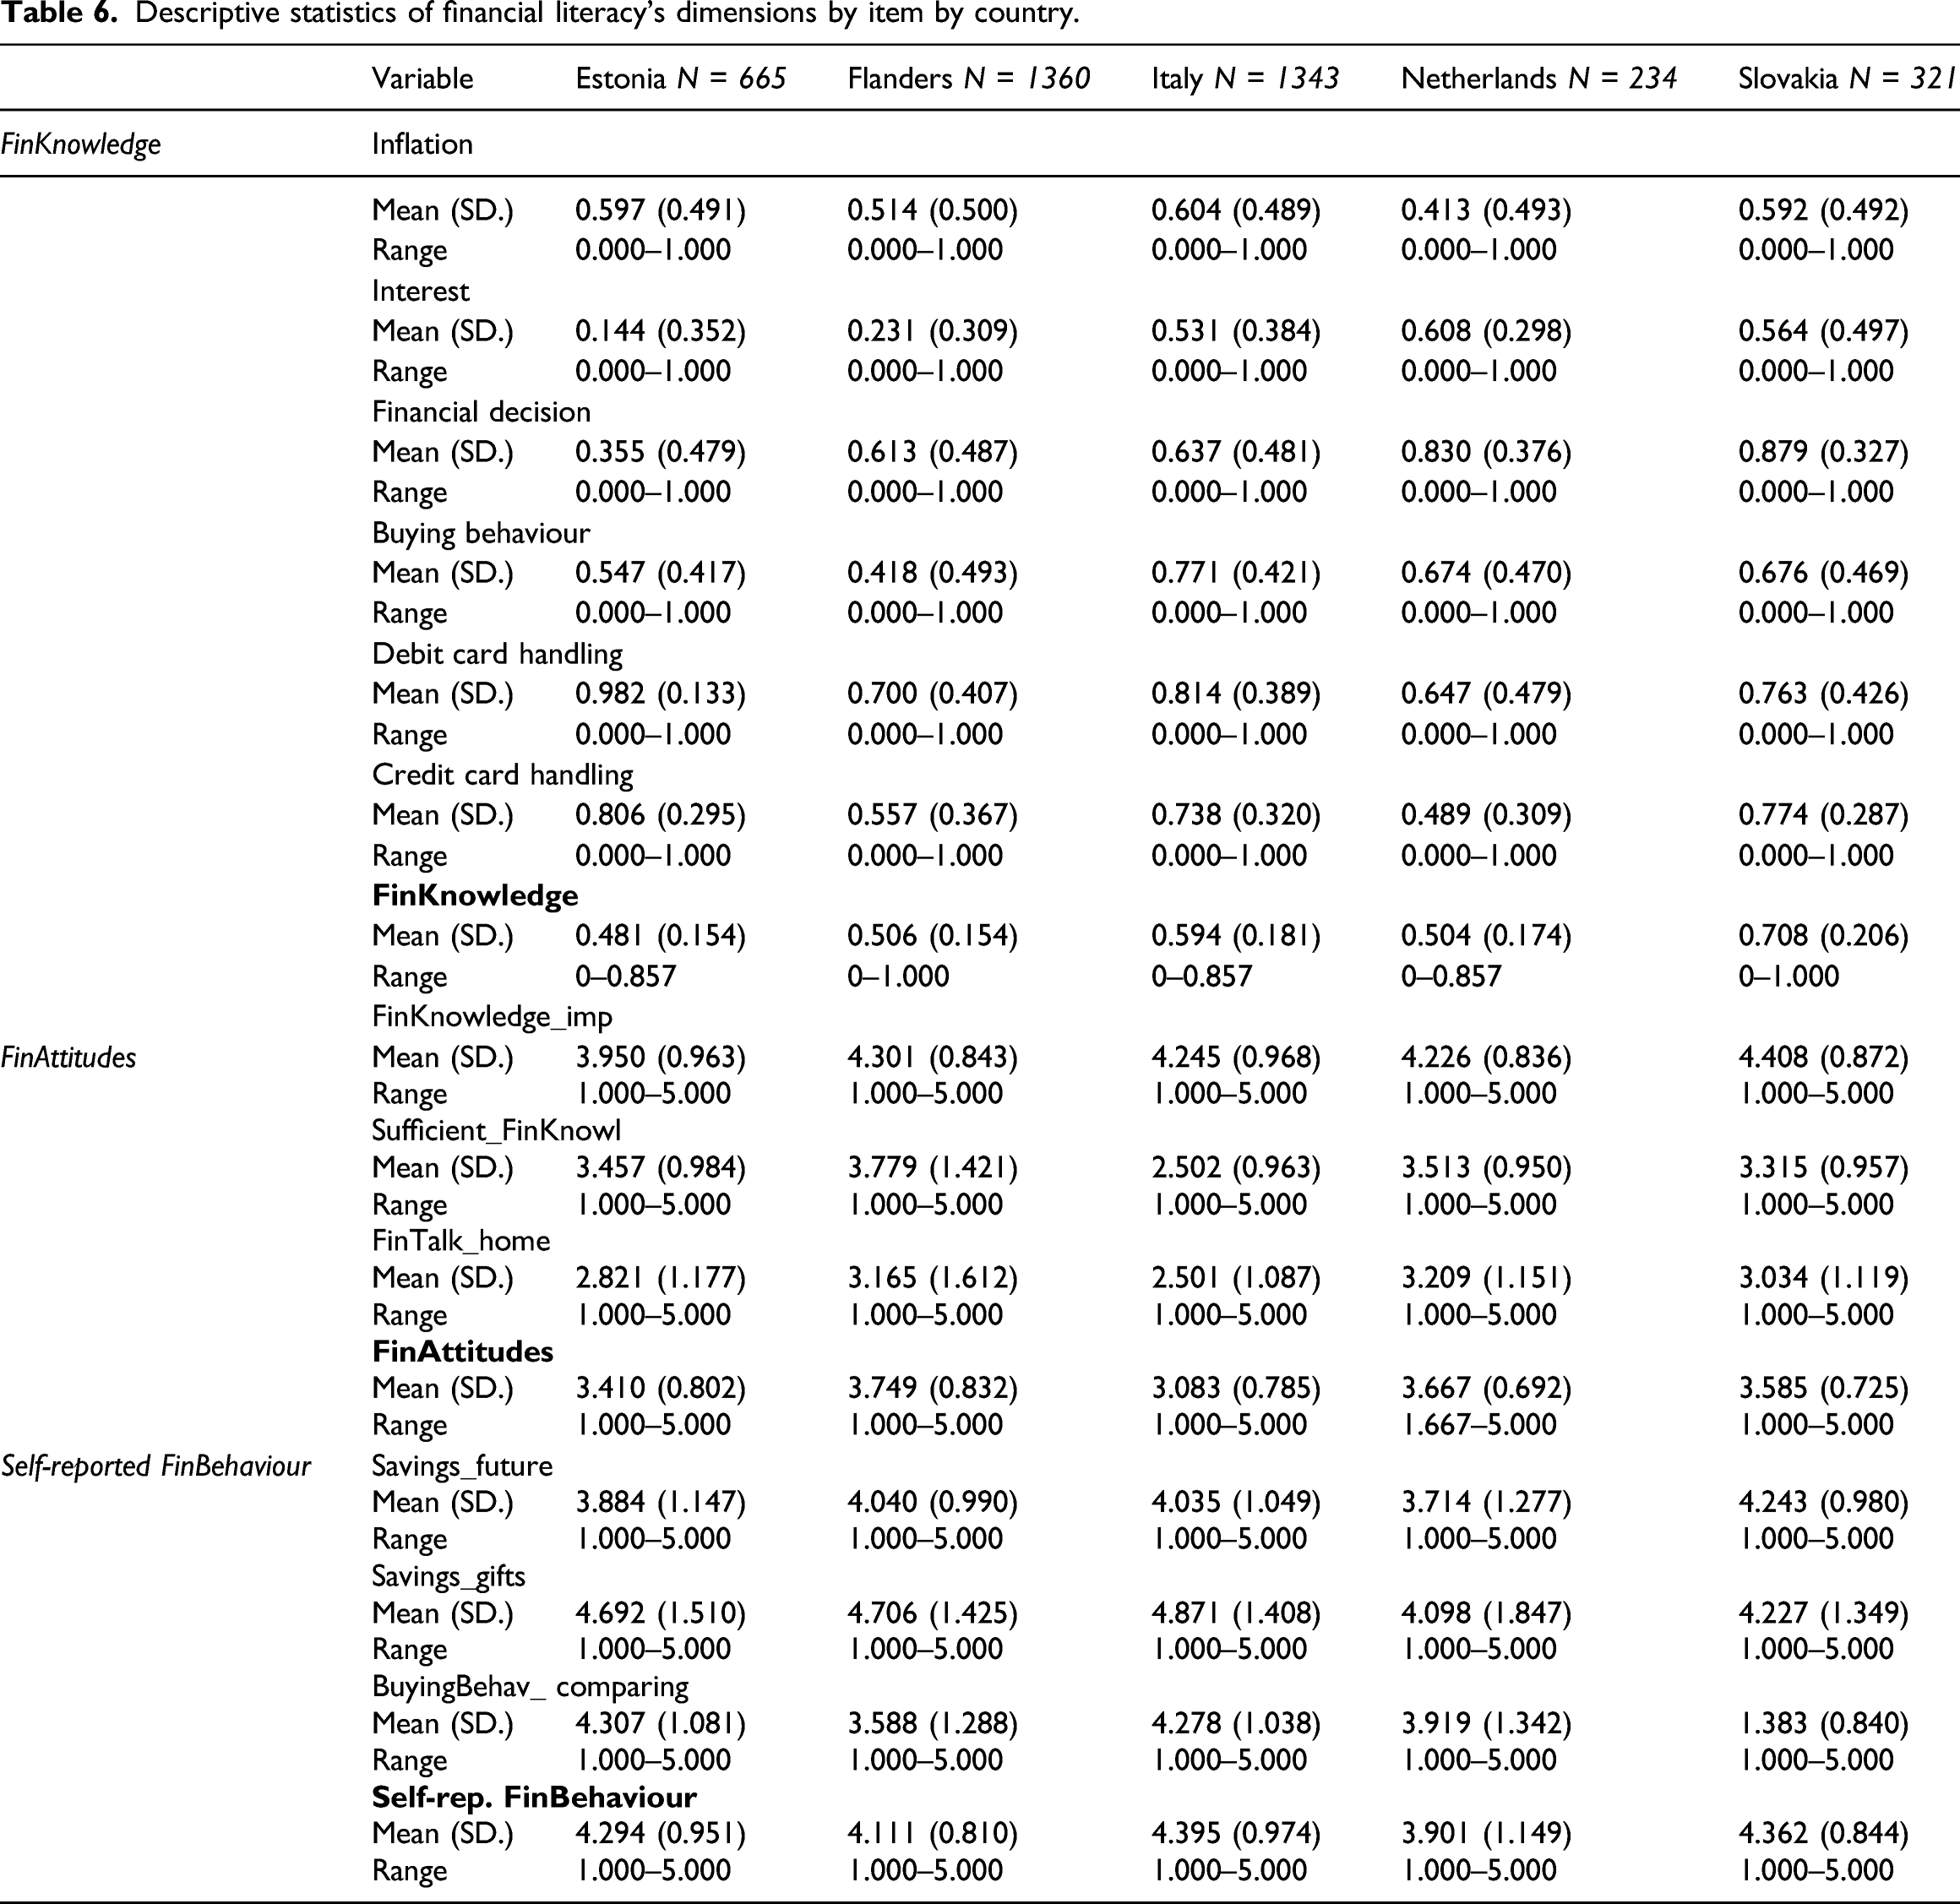
The mean of the indicators FinKnowledge_importance, Sufficient_FinKnowl and FinTalk_home represents students’ financial attitudes. This indicator is a measurement of the weight that the individual gives to the importance of knowing basic financial concepts in order to carry out financial operations. From Table 6, it emerges that respondents in Italy and Slovakia did not assign high rates to these aspects, showing poor financial attitudes compared to students from other countries. By considering the single items of the financial attitudes’ indicator, Table 6 shows that Italian students did not believe they possessed enough financial knowledge for dealing with money (Sufficient_FinKnowl), neither did they report speaking about financial matters at home with their family, compared to other countries. This latter aspect is confirmed by Estonian students, negatively contributing to the poor results in overall financial attitudes. Flemish students, on the contrary, self-estimated having sufficient financial competence to handle their money, also appreciating financial knowledge as a means to handle their money correctly.
Moving on to the self-reported financial behaviour, this is defined by averaging Savings_future, Savings_gifts and BuyingBehav_comparing, which expresses how students manage their money, in particular their saving and purchasing behaviours. In this dimension, Italian and Slovakian students obtain the highest scores (4.395 and 4.362, respectively), followed by Estonians (4.294), while the Netherlands (3.901) comes last. Again, by splitting financial behaviour into its three items some interesting details emerge. For instance, the low contribution to the final score for Dutch students is due to the reported low propensity for saving their money for the future (3.714), compared to Slovaks (with 4.243). Furthermore, the students stating that they save a substantial part of the money they receive come from Flanders and Italy (with 4.706 and 4.871 over 5, respectively).
Figure 1 also presents the distributions of the three components of financial literacy by country. Financial knowledge (Figure 1(a)) has a more dispersed distribution, while considering self-reported financial behaviour distributions (Figure 1(c)), scores are more concentrated around 3 out of 5. Financial attitude distributions position themselves half way between knowledge and behaviour on average. In any case, the most skewed distributions are those from Italian and Flemish respondents, with lowest and highest peaks, respectively, the opposite of the distributions of financial knowledge in Figure 1(a). Distribution of Financial knowledge (a), attitudes (b) and behaviour (c) by countries. Note: Financial knowledge distribution shows the percentage of correctly answered questions, while Financial Attitudes and Behaviours are standardized indicators (0 mean and 1 standard deviation).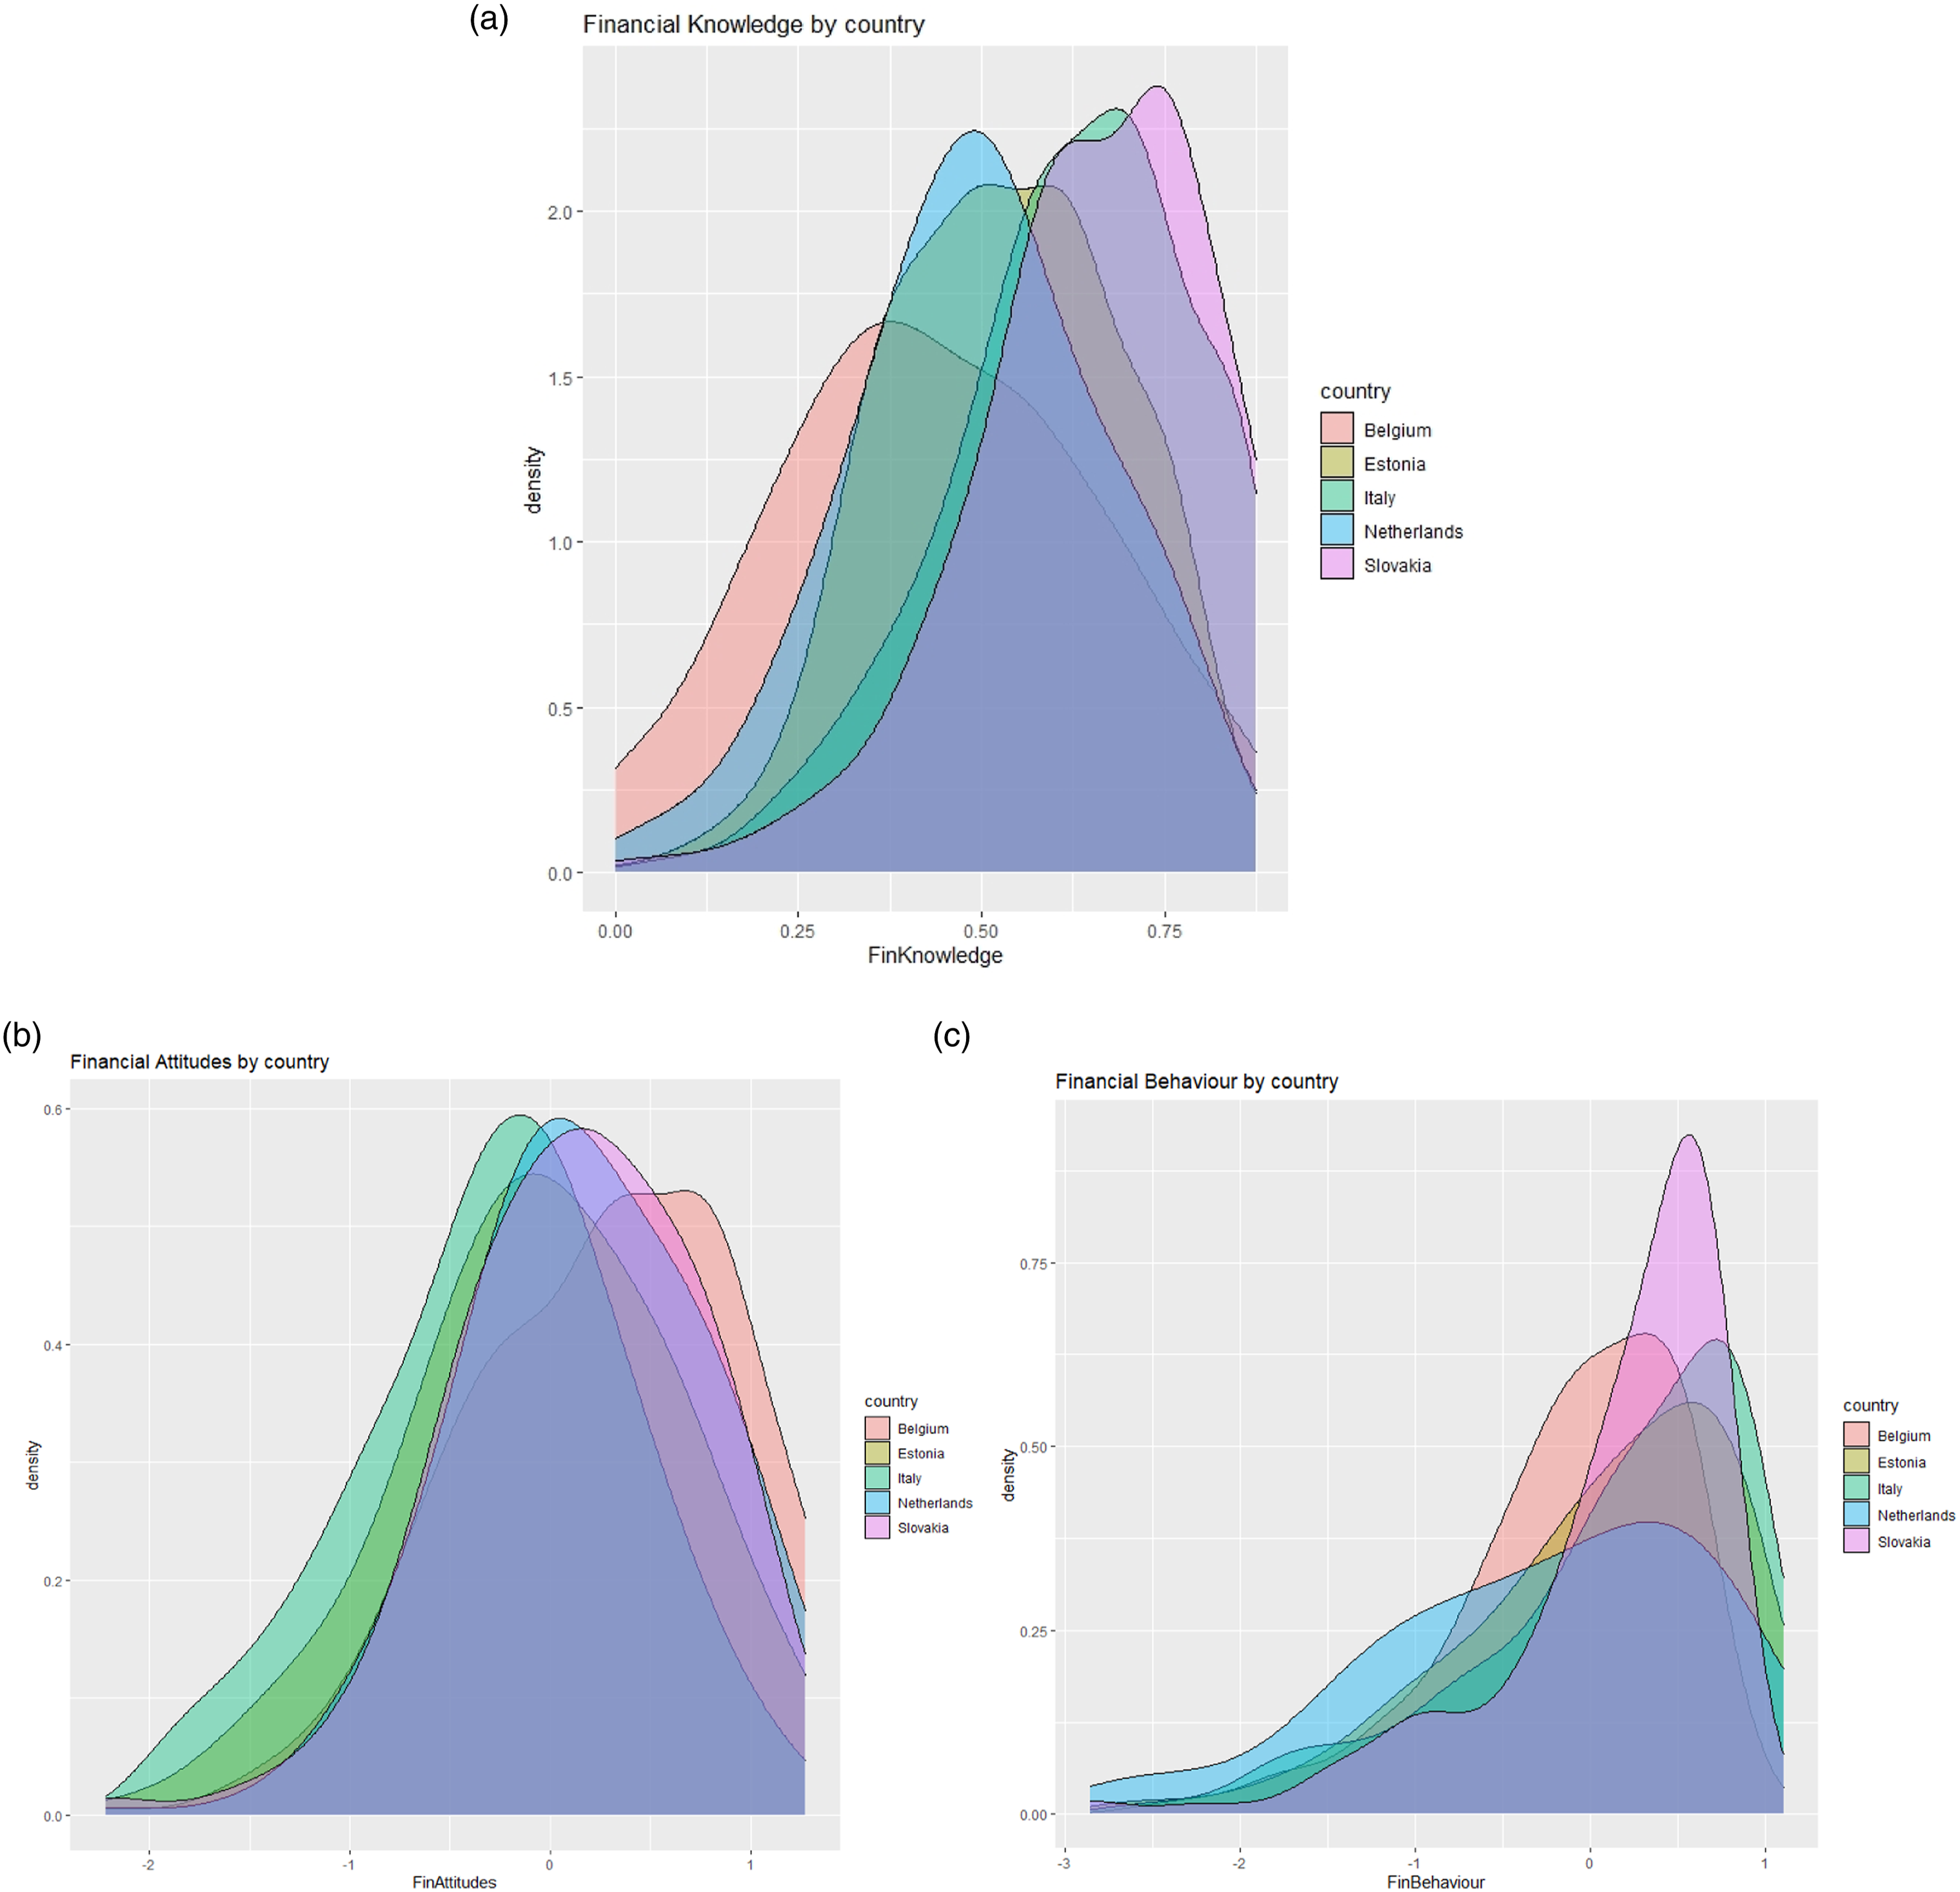
Studying the relations among financial literacy dimensions represents an interesting opportunity given the available data. Figure 2 shows the distribution of these variables, their bivariate scatter plots and the associated correlation values. Interestingly, the correlations are all positive and statistically significant (even if not sharp), at least with a p-value of 0.001. This emerges in the scatter plots, where the tendency lines all have a positive trend, meaning that at an increase in one dimension of financial literacy corresponds to an increase in another dimension. The scatter plot of financial attitudes and behaviours presents a different shape; when both values are below their average (i.e. 0 since they are standardized), the trend seems to be perfectly linear. Then, their tendency line flattens; an increase in financial attitudes does not correspond to an increase in financial behaviours. Correlation matrix among financial literacy determinants. Note: The distribution of each variable is shown on the diagonal. On the bottom of the diagonal, the bivariate scatter plots with a fitted line are displayed. On the top of the diagonal, the value of the correlation plus the significance level as stars. Each significance level is associated to an asterisk: ‘***’, ‘**’, ‘*’, ‘.’ and ‘’ are associated with p-values equal to 0, 0.001, 0.01, 0.05, 0.1 and 1, respectively.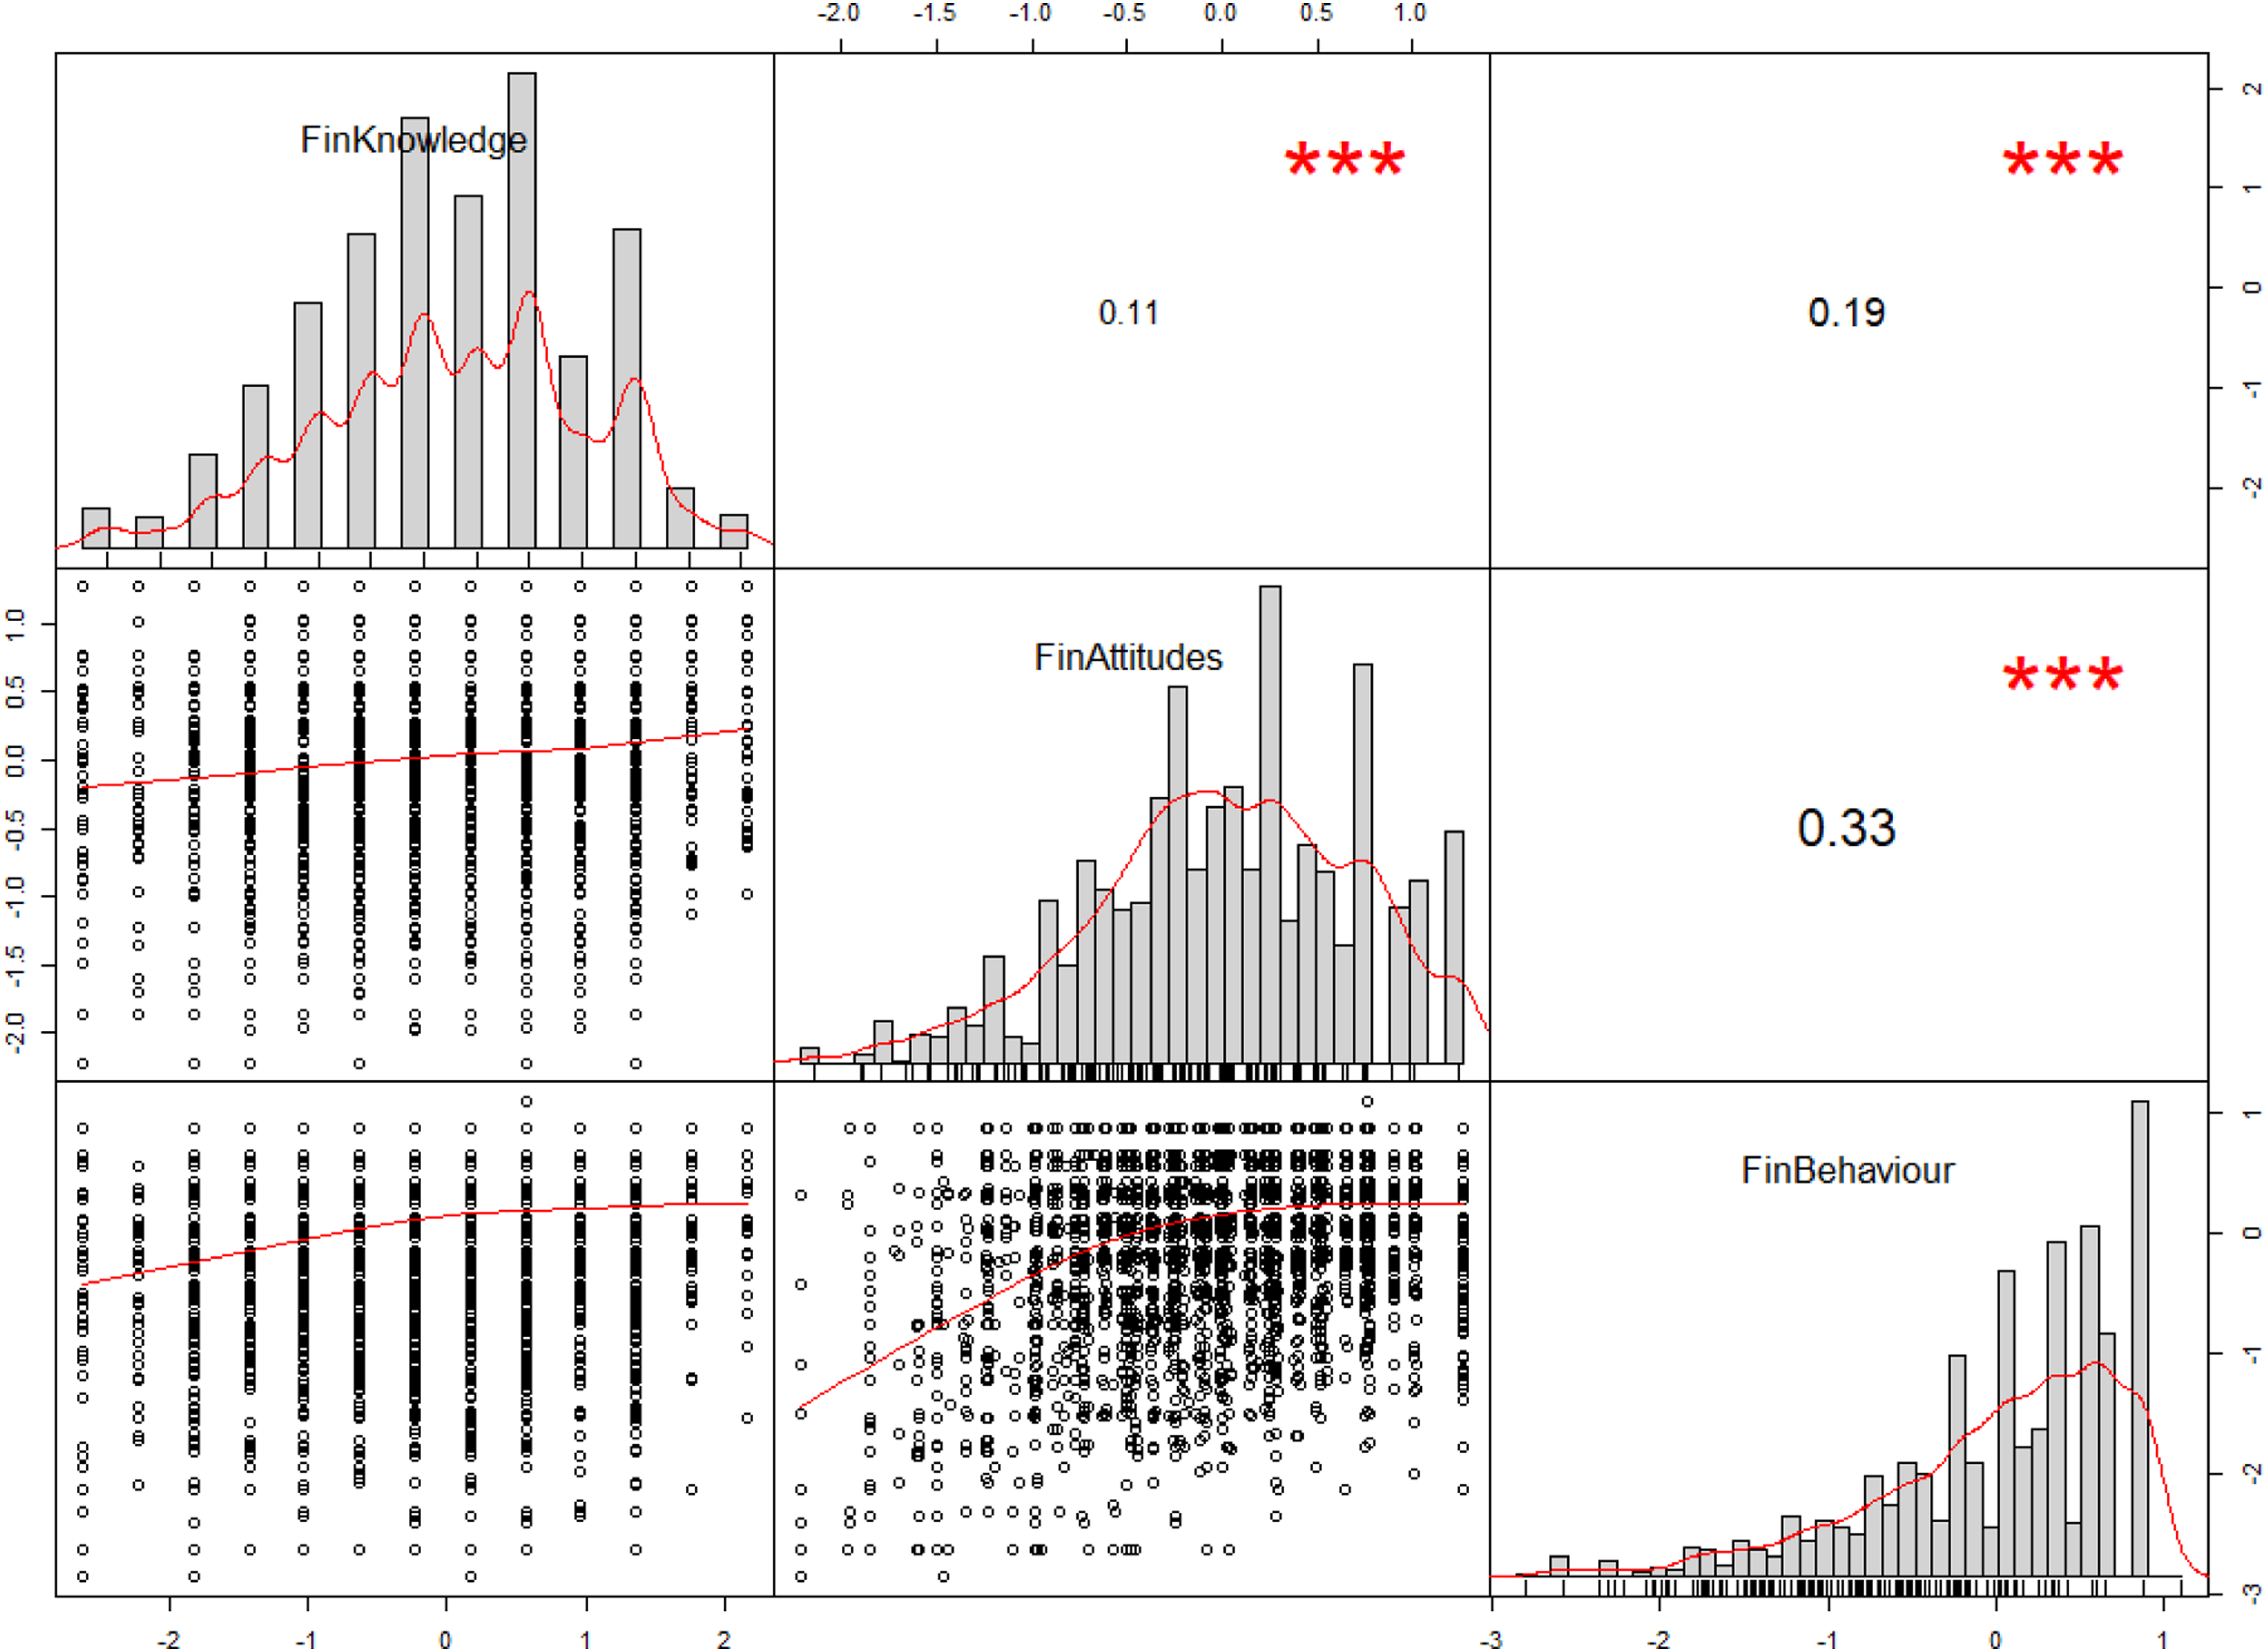
Methodology
This comparative analysis examines financial literacy in both pooled and cross-country perspectives. The model specifications use three different outcome variables, namely, financial literacy and its decomposition into knowledge, attitudes and behaviour. To study the components and features of financial literacy among the participating countries, we adopt a linear regression model, estimated as follows
A second regression model assesses whether significant differences exist across countries in students’ financial literacy. Compared to the first equation, we do not check for country-specific dummy variables, but five different models are computed
One of the main problems when developing and analysing surveys is the selection bias. It arises when a rule other than simple random sampling is used causing a distorted representation of a true population (Heckman, 1990). To partially solve this issue, weights can be used to test and protect against disproportionality with the target population (Pfeffermann, 1993). In our case, post-stratification sampling weights are assigned to each observation in the dataset to compensate for that fact that persons with certain characteristics are not as likely to respond to the survey. Post-stratification sampling weights require the parameters of the target population to be known, in our case from the five different countries. To improve the reliability of the questionnaire, sampling weights are applied to gender and school track parameters and calculated as follows:
Sampling weights represent a common approach to increase the representativeness of the participants. This approach is adopted since sampling units do not have the same chances of being selected and if the population parameters are estimated without taking into account these varying probabilities, then results may be biased. To see the contribution given by weights to the subsequent analysis, Table A2 in the Annex shows the financial knowledge regression (both cross- and polled countries) without sampling correction.
Results: comparing financial literacy with pooled and cross-country models
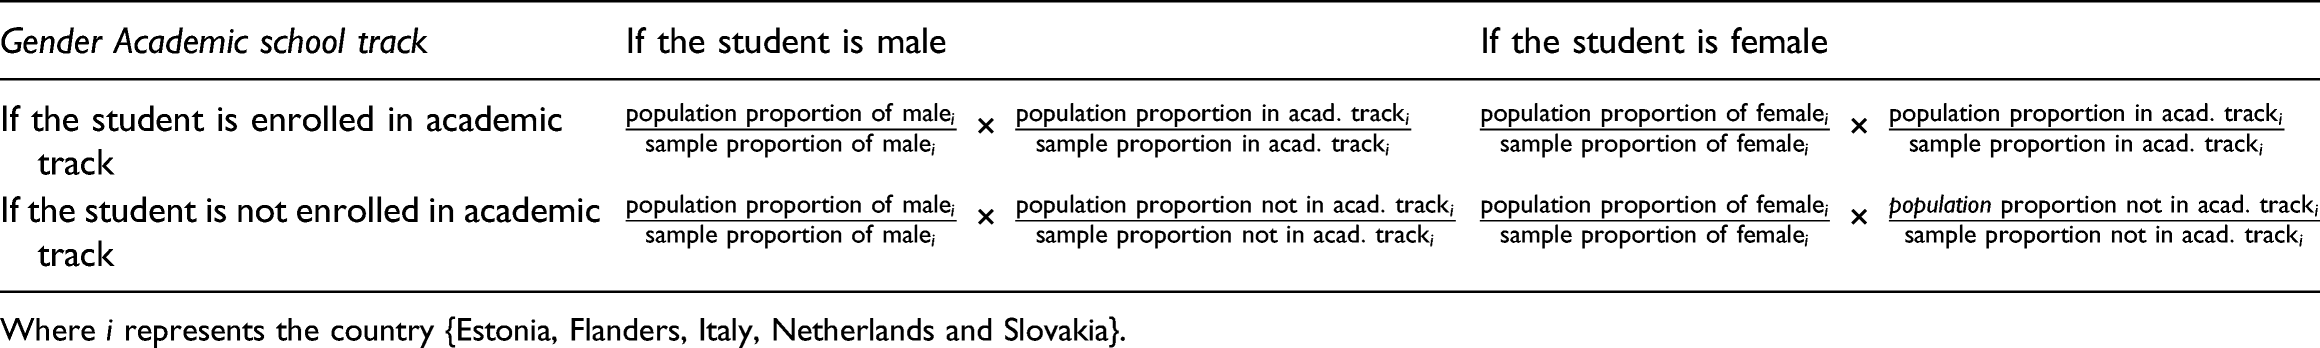
Where i represents the country {Estonia, Flanders, Italy, Netherlands and Slovakia}.
Determinants of Financial Knowledge, with cross-country and pooled perspectives.
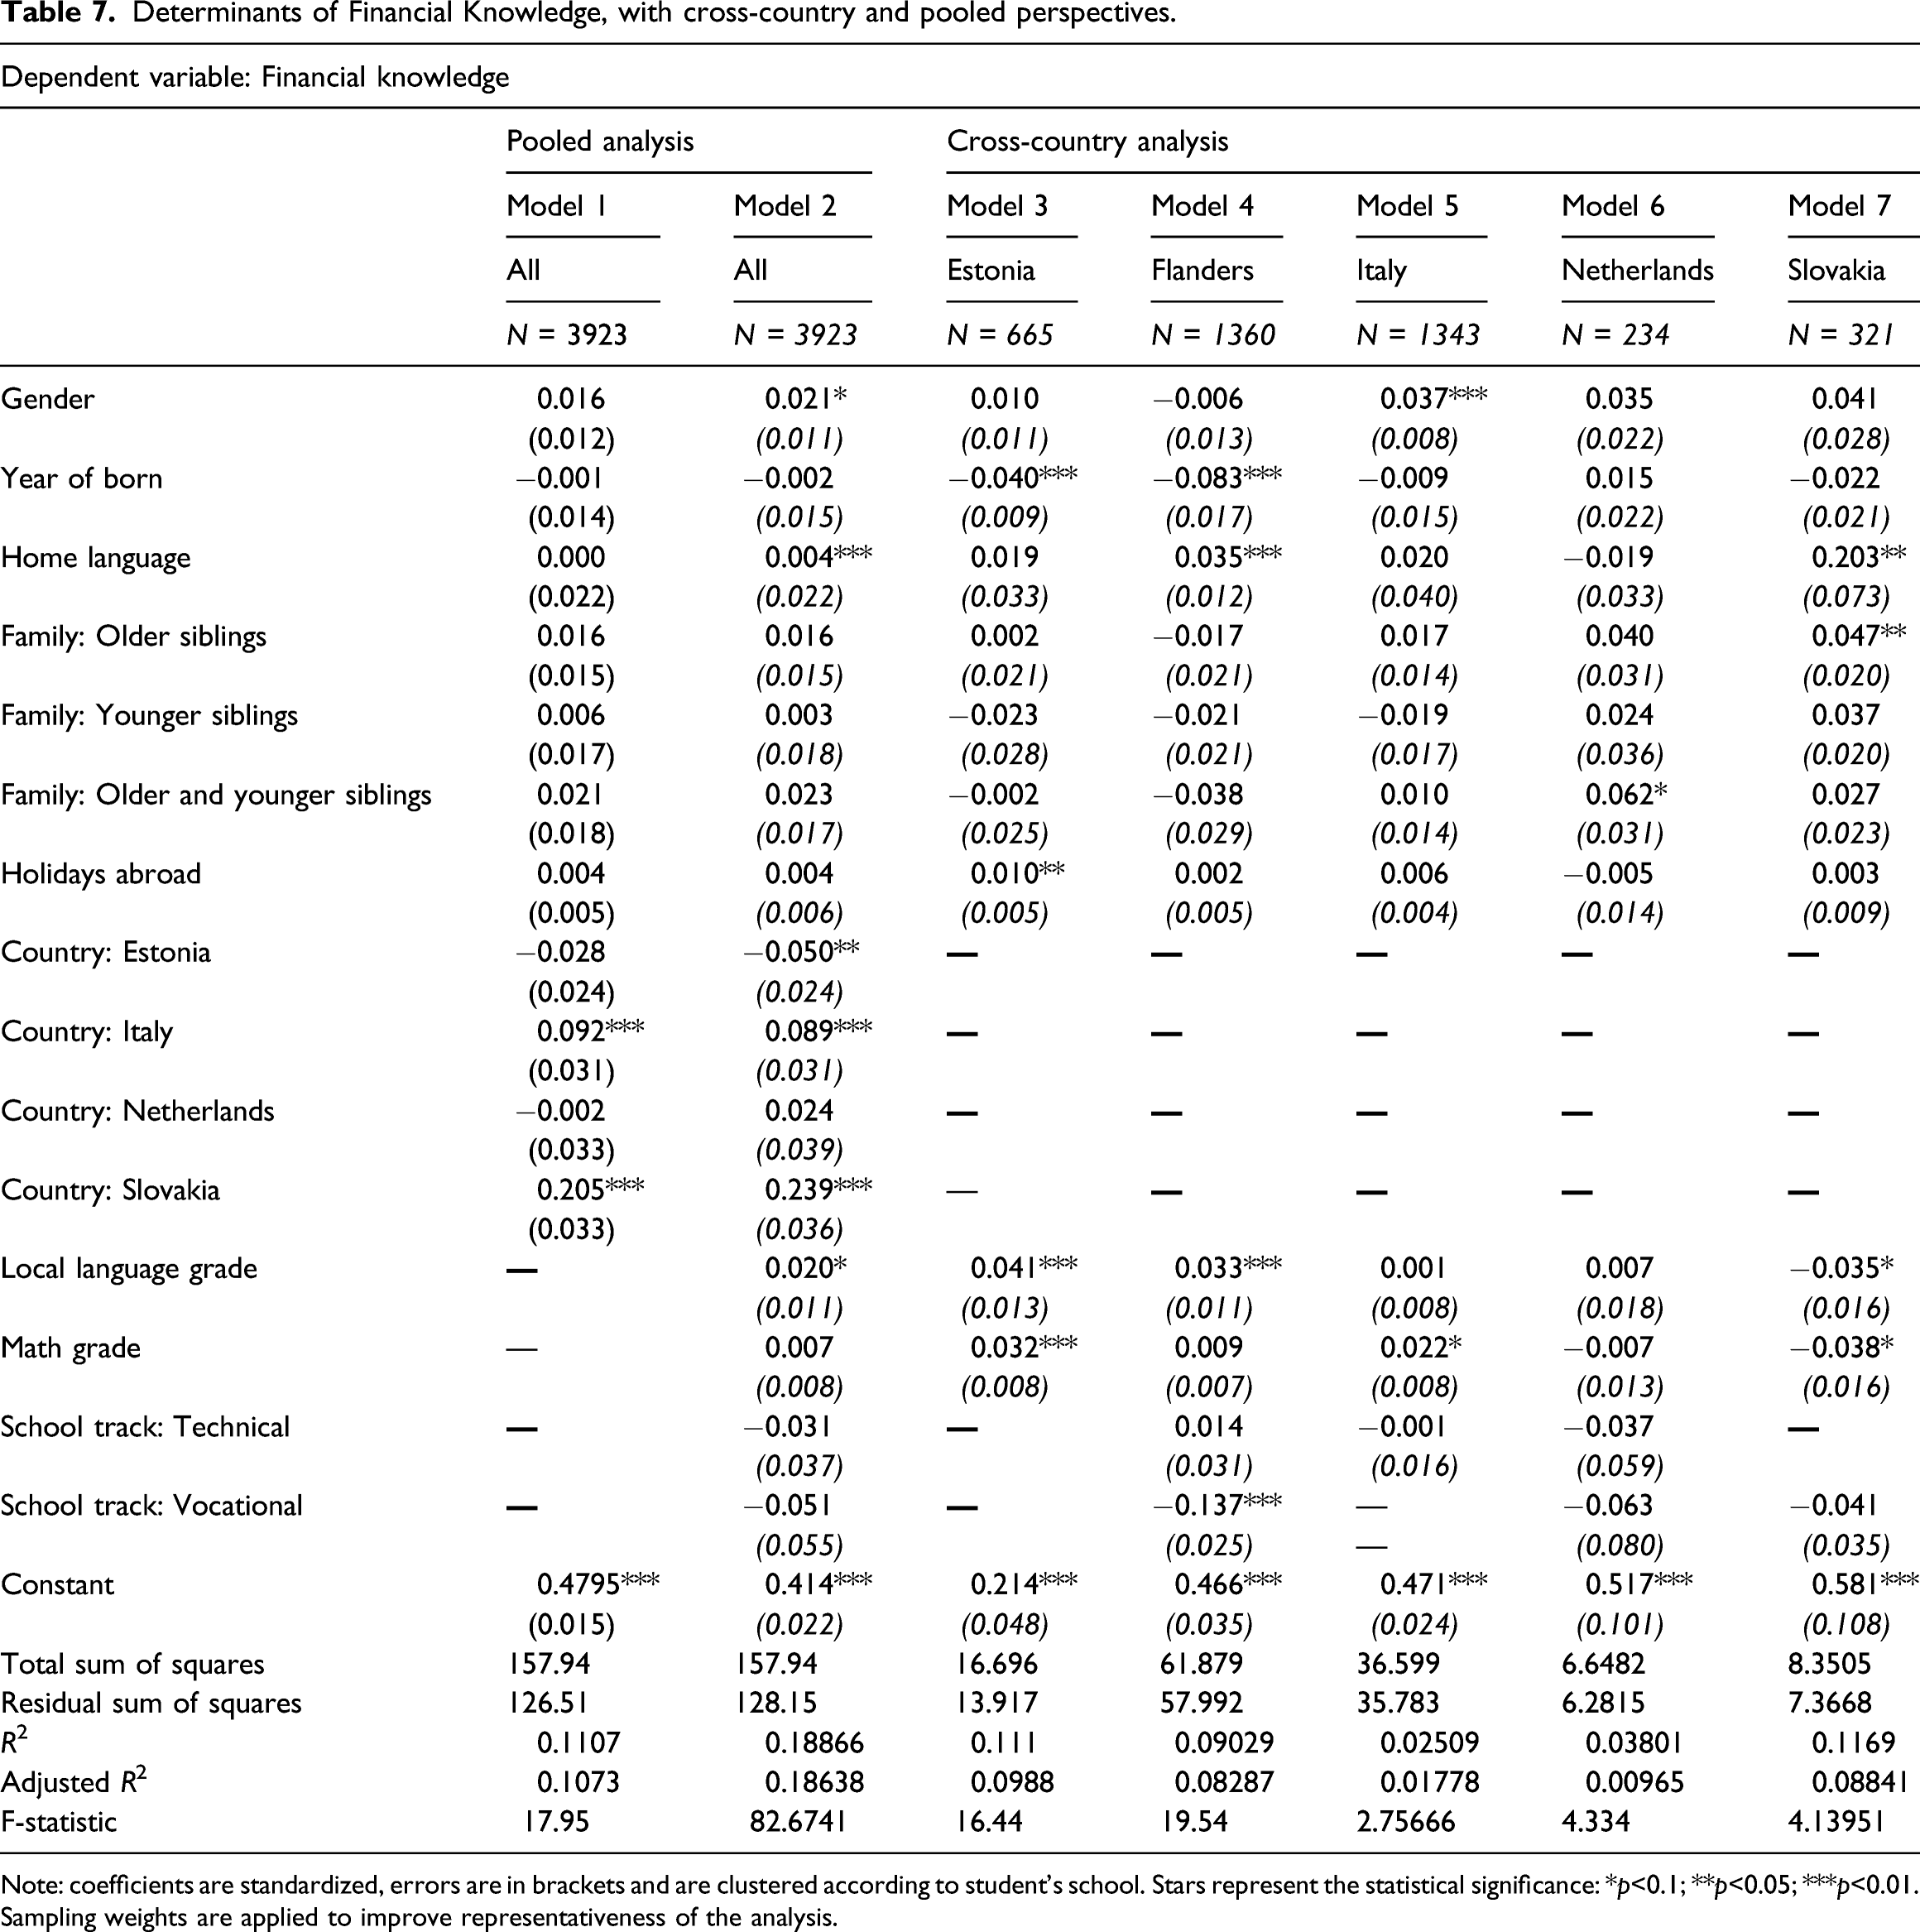
Note: coefficients are standardized, errors are in brackets and are clustered according to student’s school. Stars represent the statistical significance: *p<0.1; **p<0.05; ***p<0.01. Sampling weights are applied to improve representativeness of the analysis.
Determinants of Financial Attitudes, with cross-country and pooled perspectives.
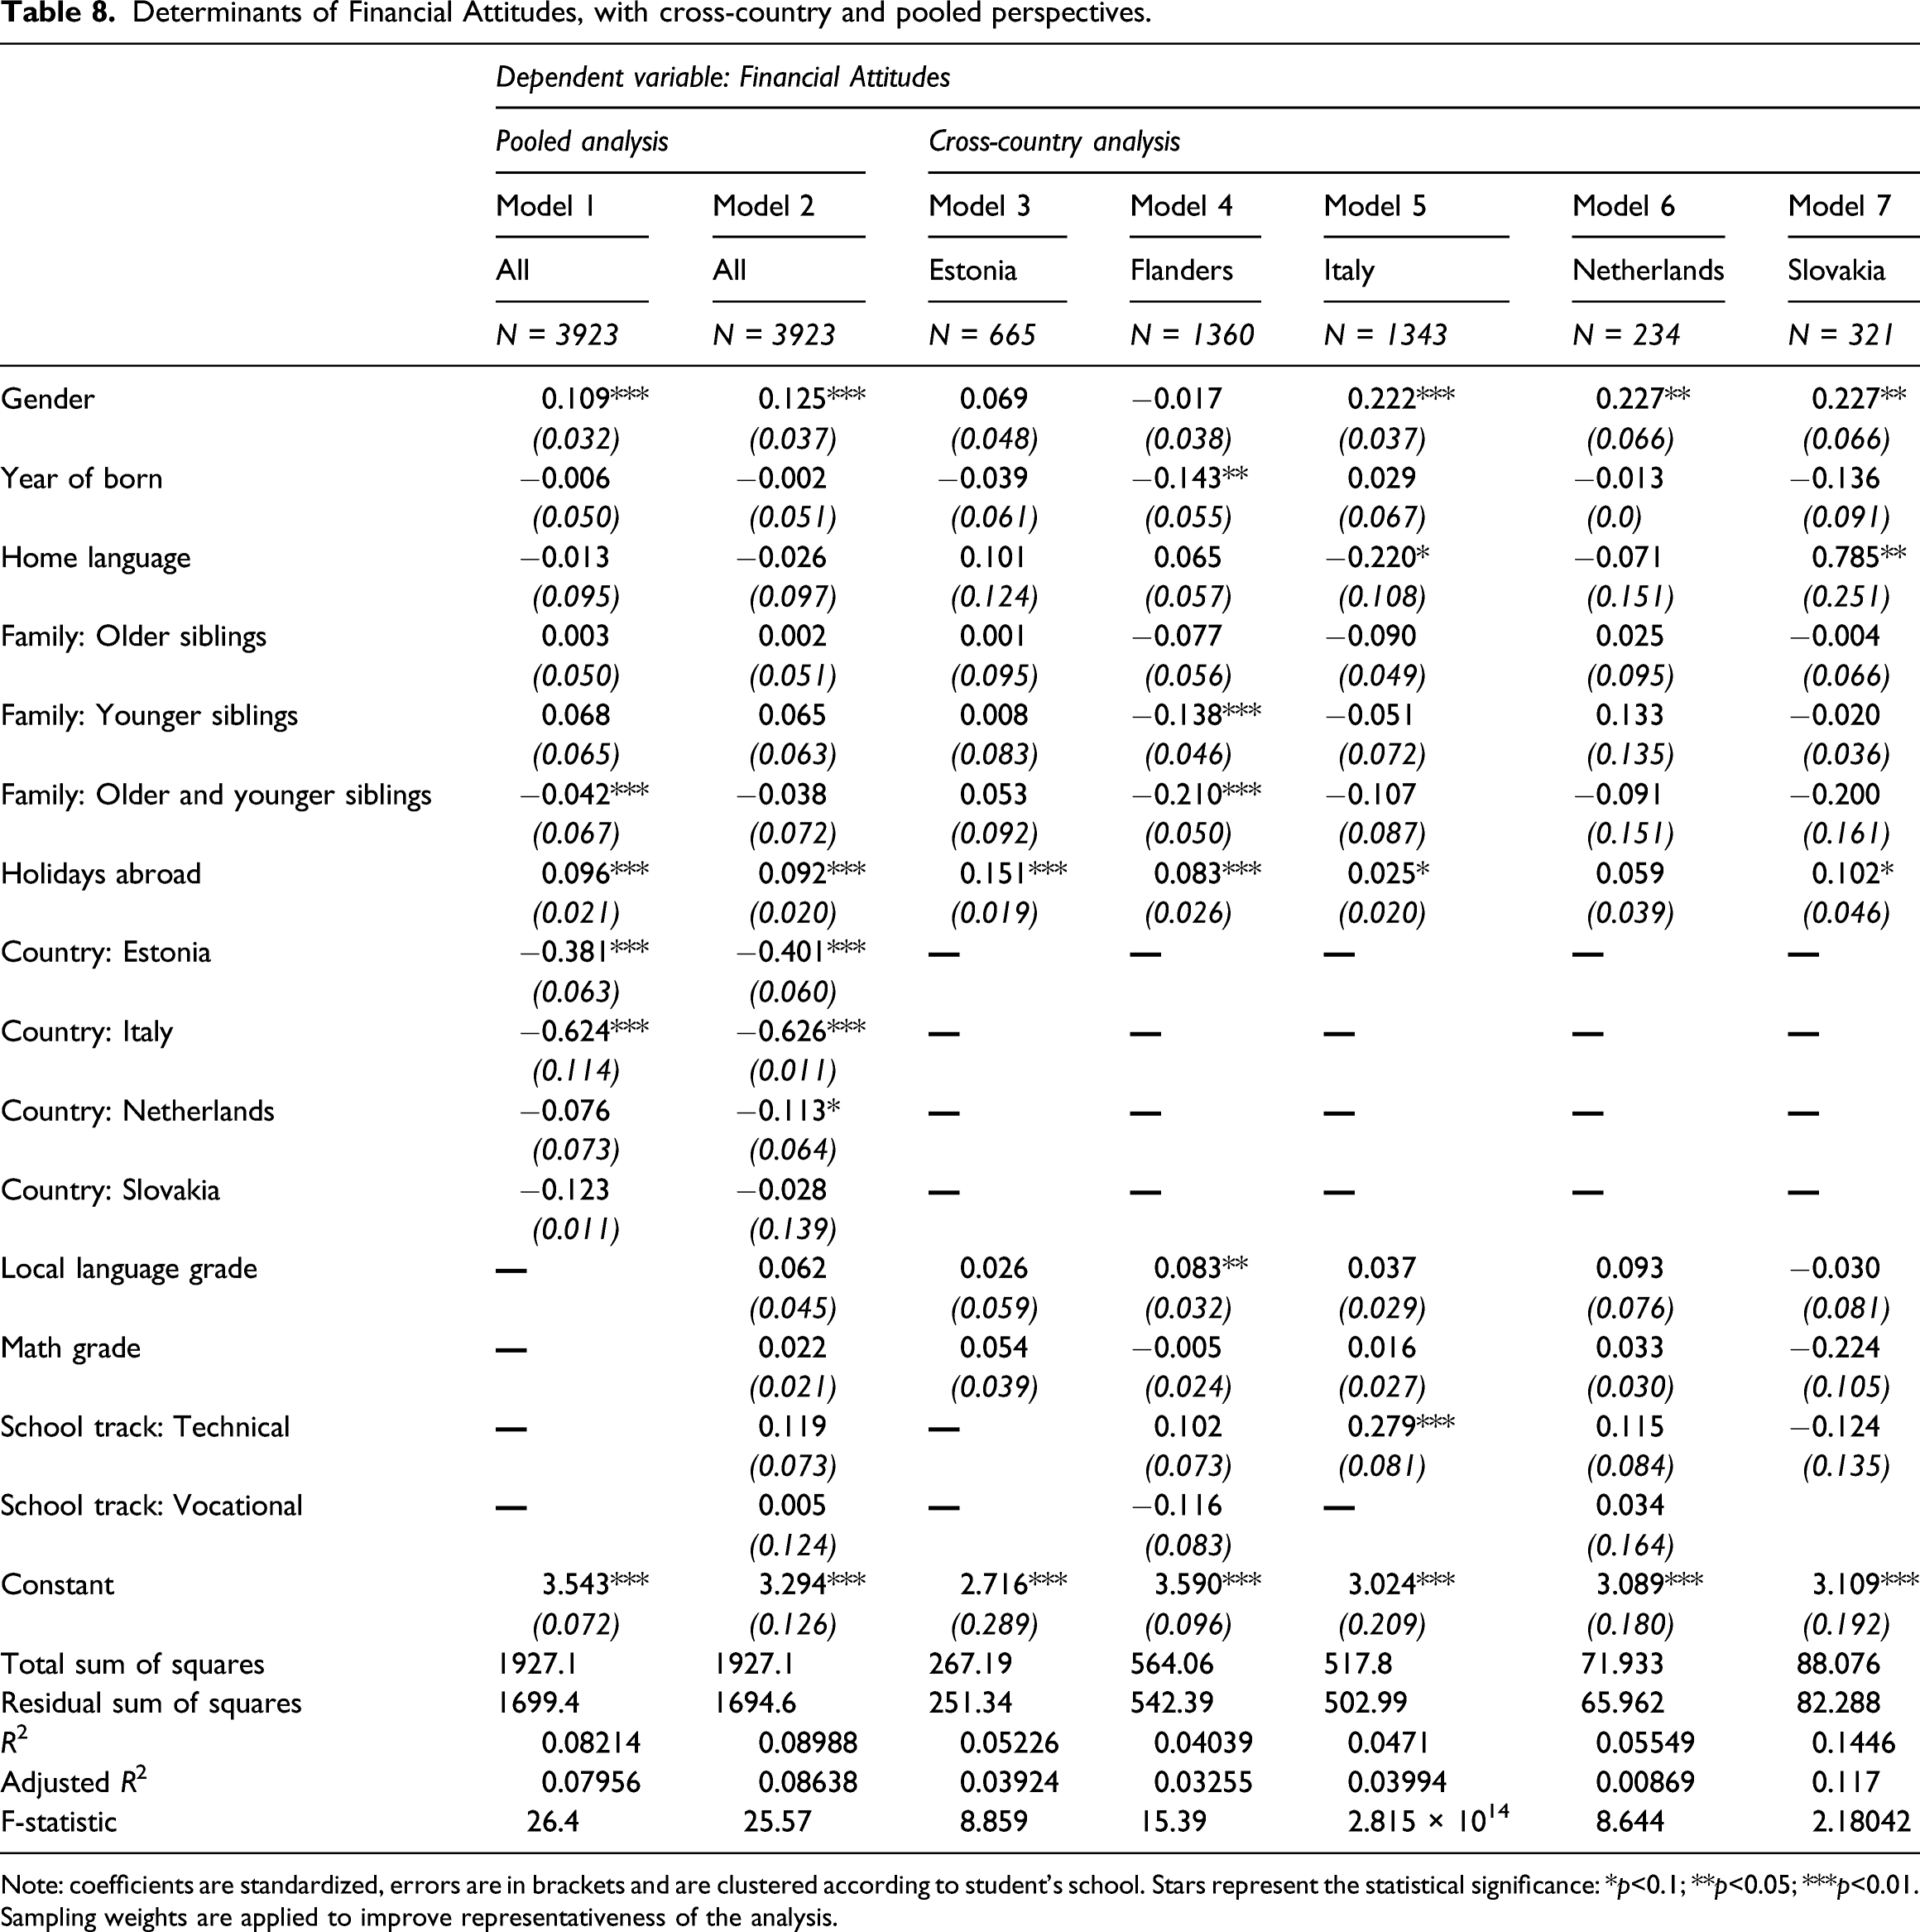
Note: coefficients are standardized, errors are in brackets and are clustered according to student’s school. Stars represent the statistical significance: *p<0.1; **p<0.05; ***p<0.01. Sampling weights are applied to improve representativeness of the analysis.
Determinants of self-reported financial behaviour, b, with cross-country and pooled perspectives.
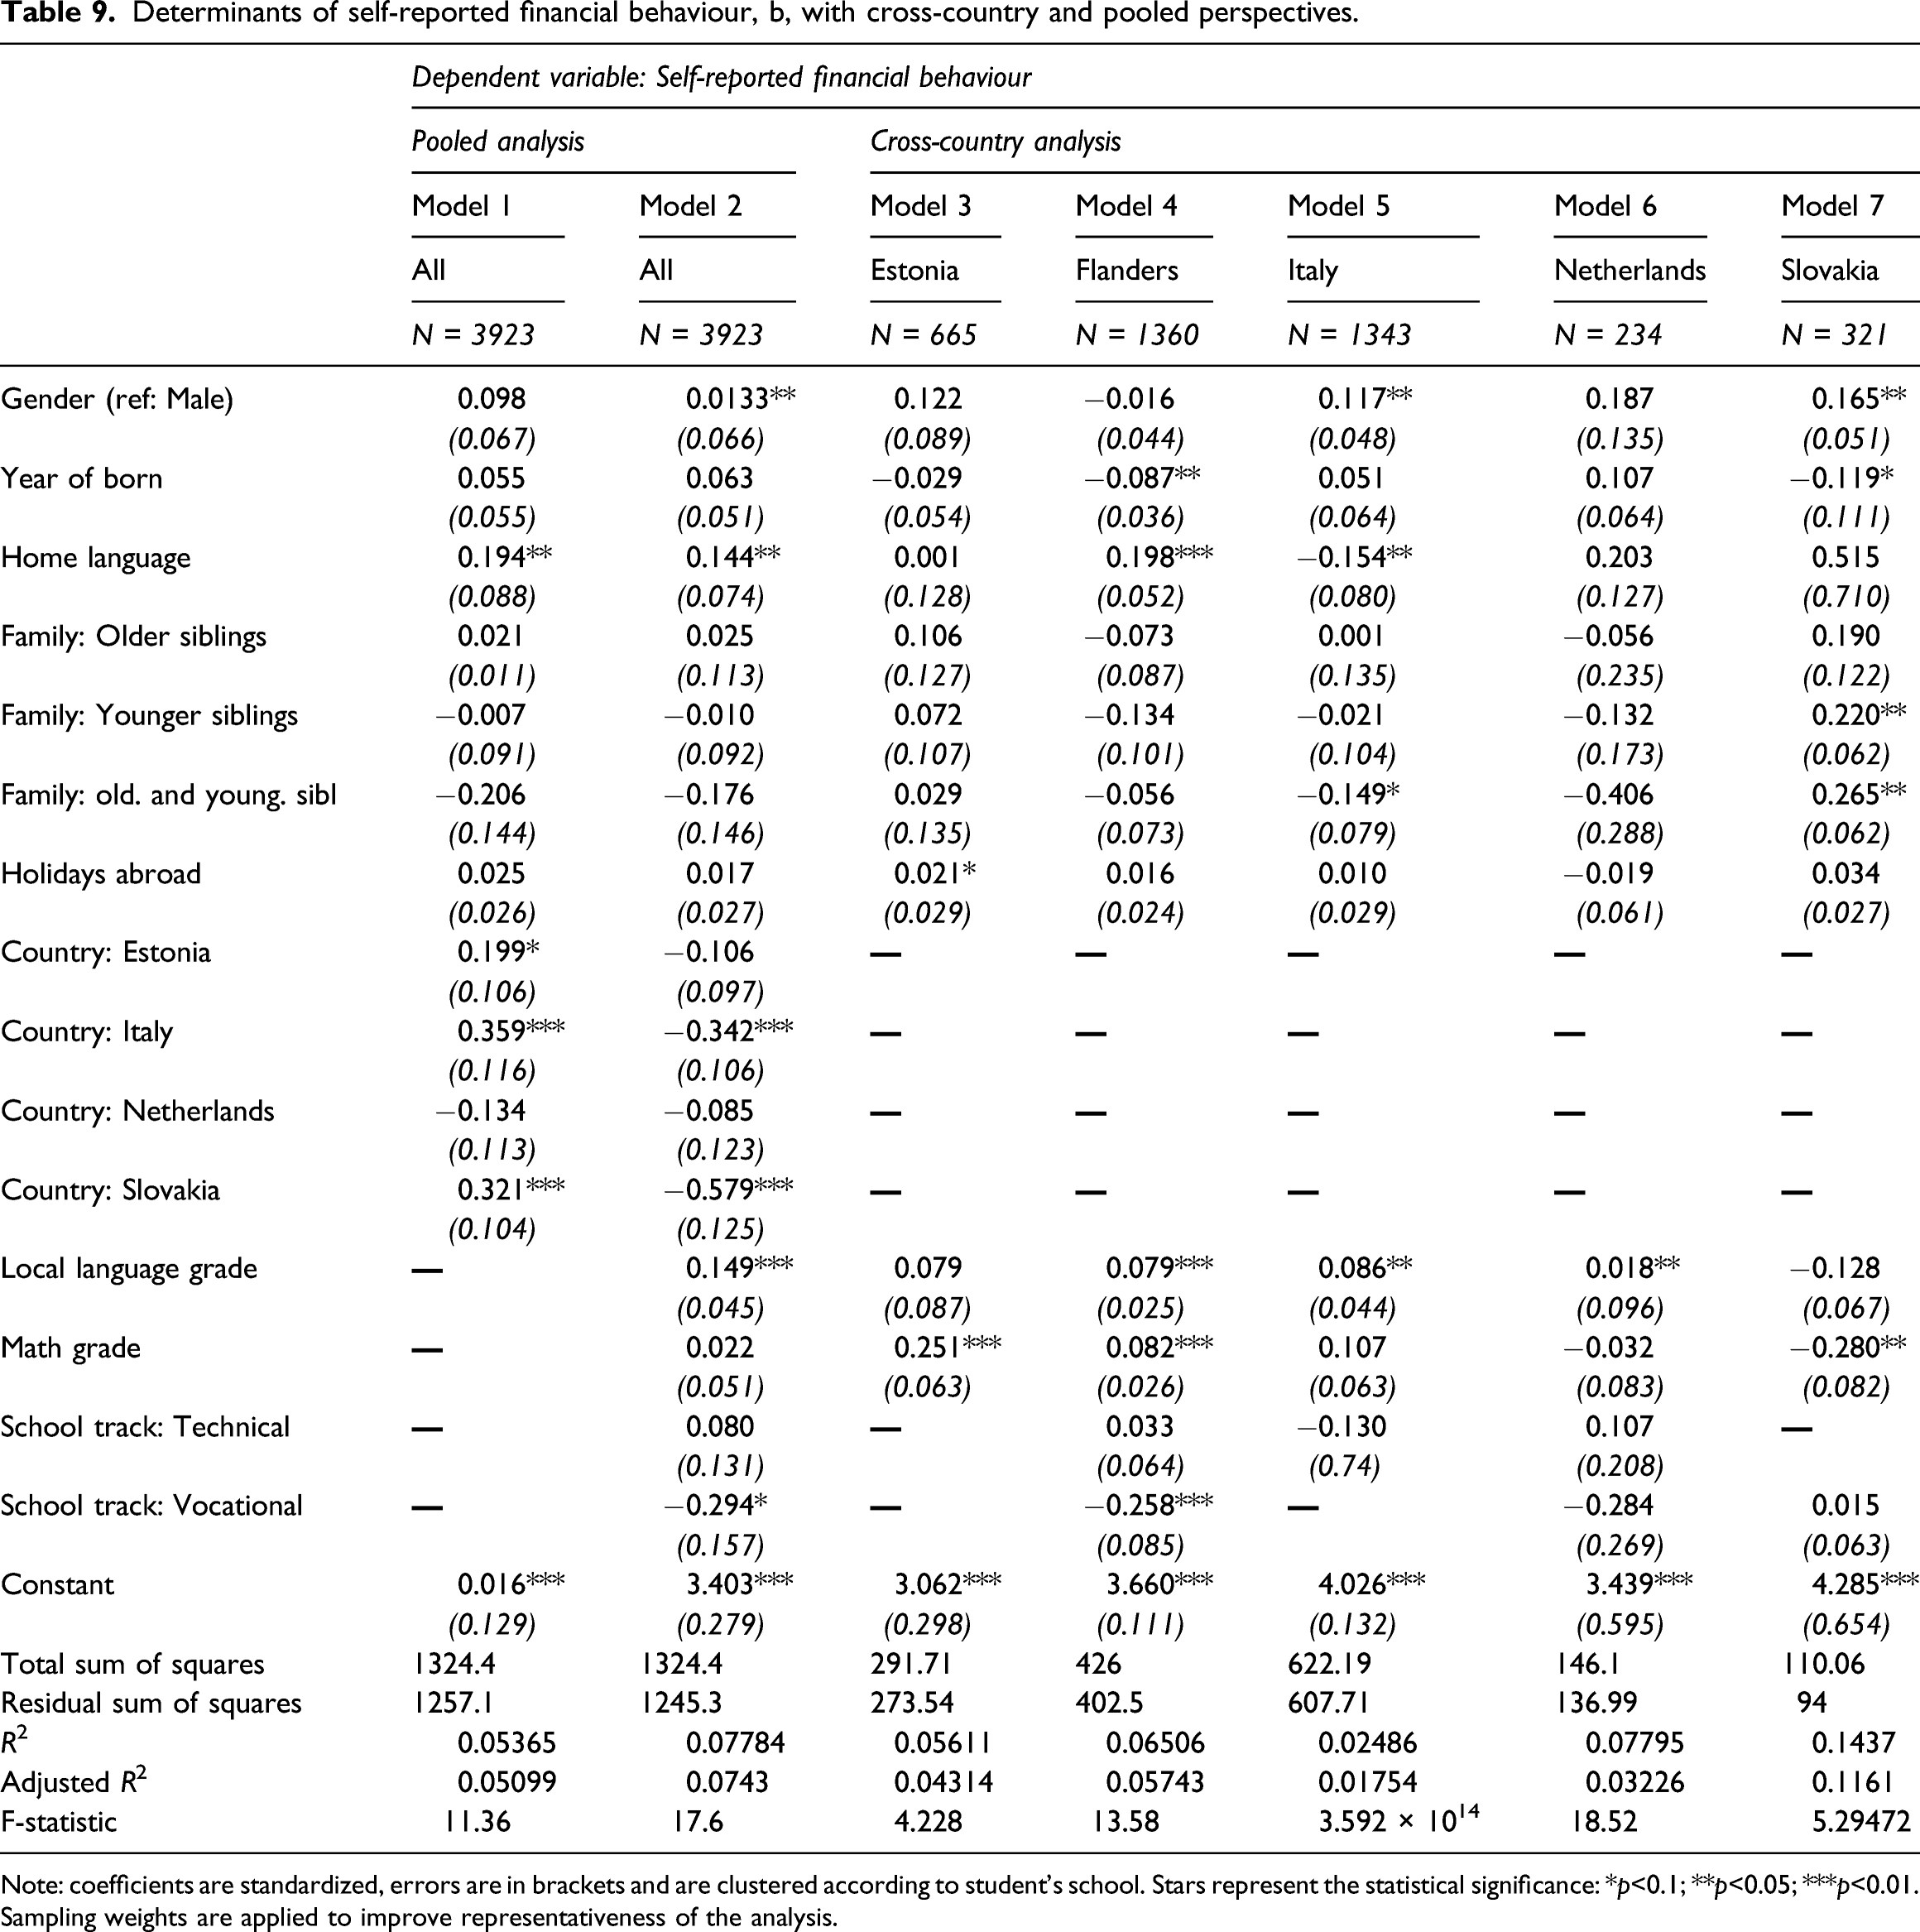
Note: coefficients are standardized, errors are in brackets and are clustered according to student’s school. Stars represent the statistical significance: *p<0.1; **p<0.05; ***p<0.01. Sampling weights are applied to improve representativeness of the analysis.
Financial knowledge
The results presented in Table 7 are first discussed from the covariate perspective. Across all countries, we observe that what emerges from the baseline model’s (Model 1) results is the importance of gender, confirmed also by international assessments where males usually perform better than females (OECD, 2012, 2015, 2018). This insight is confirmed by the cross-country analysis, where the gender gap among the (weighted) respondents seems to be (almost) totally explained by respondents in Italy (Model 5). This result is in line with the previous assessment of PISA 2012, 2015 and 2018 where Italy exhibited a substantial gender gap (see Table 1). The proxy of the students’ nationality (e.g. Home language) is a second demographic information item statistically significant in the financial knowledge model. As shown in Models 4 and 7, its significance emerges especially among respondents in Flanders and Slovakia. Especially for Flanders, this source of heterogeneity is encountered in PISA 2015, where non-immigrant students performed better than immigrant ones in the 2012 and 2015 waves (reported in Table 1). Lastly, even if on the overall models the number of holidays spent abroad is not significant, in Estonian modelling this is positively correlated with financial knowledge. These findings corroborate the association between the socio-economic condition of students and their level of financial literacy, as mentioned in Section 2.1 and shown in Table 1.
The structural differences among countries are clearly underlined by the significance given to the related dummy coefficients in Models 1 and 2. When considering Flemish students as reference level, respondents in Italy and Slovakia perform better, while respondents in Estonia perform worse. This result, not aligned with international assessments, is probably due to selection bias in the student sample. In fact, only schools interested in the project and having connections with organizing universities join in this assessment. On the other hand, this finding shows that despite the typically high scoring in PISA for Flemish and Estonian students, some subgroups and students lag behind. These findings are a wake-up call for these groups.
Concerning the school information, from the pooled analysis only the grade in literature (e.g. local language) is slightly positively correlated with financial knowledge. Nevertheless, if we focus attention on the cross-country regressions (Model 3–7), interesting sources of heterogeneity arise. For instance, the grades have an important correlation with financial knowledge for respondents in Estonia and Flanders mainly, where more performing students obtain higher scores in this assessment, a finding that has been previously confirmed by studies using PISA assessments (OECD, 2012; OECD, 2015; OECD, 2020b). Lastly, if we look at the school track where students are enrolled, only the Flanders model highlights a negative correlation for those in a vocational track. As mentioned in the methodological approach (Section 3.5.), Supplemental Table A2 in Appendix shows the same analysis without sampling weights, to check whether the applied correction works. A comparison of Supplemental Table A2 with Table 7 gives a glaring example of how sampling corrects the pooled analysis, while the cross-country ones remain quite stable. The same conclusions can be drawn for financial attitudes and the behaviour regressions.
Financial attitudes
Considering the models in Table 7, when adopting students’ financial attitudes (FinAttitudes) as the variable of interest, the previous results are partially confirmed. In particular, the gender issue is again highlighted, together with the holidays spent abroad; both are student features which emerge as strongly related to their financial attitudes. Interestingly, the language spoken at home is not statistically significant, which may imply that financial attitudes are not related to immigrant background and perhaps suggesting that schooling could be an active factor in shaping attitudes more than knowledge. Moving our attention to the cross-country analysis, the gender gap is (again) explained by respondents in Italy, Netherlands and Slovakia, where the coefficients are positive and statistically correlated with student’s financial attitudes. The socio-economic status (e.g. Holidays abroad) is relevant for almost all countries, but especially in Estonia and Flanders where higher p-values suggest a stronger correlation. Interestingly, the Flemish regression model suggests a correlation of the family composition to the financial attitudes. In particular, the significant and negative coefficients showed in Family regressor, suggest that having siblings is associated with lower financial attitudes compared to those students who are the only child. This means that the Family indicator is also a proxy for SES, in that larger families are typically lower SES-families in the Flemish region.
When observing the effects of countries in Models 1 and 2, some interesting observations can be made, especially if we compare them with the previous result about knowledge. Here, Estonia, Italy and slightly Slovakia register lower scores compared to Flemish students. The case of respondents in Italy is of particular interest; probably the selection bias emerges as relevant when assessing financial knowledge, where scores are not aligned with international testing, but looking at attitudes, students are less convinced about the importance of knowing financial concepts, even if they are older than the Flemish sample. One of the possible interpretations of this phenomenon is the absence of structured school curricula about financial literacy, not only to transfer knowledge, but also attitudes towards this discipline.
When considering school information in modelling financial attitudes, this seems not to influence the dependent variable in the cross-country analysis. Something more emerges in the regressions by country; the grade in literature for Flemish respondents is positively associated with financial attitudes, as happens for being enrolled in a technical track (compared to an academic one) for respondents in Italy, being the only track with a mandatory economic subject in the curriculum.
Self-reported financial behaviour
Models in Table 9 concern students’ self-reported financial behaviour. We find various similarities between financial knowledge and attitudes. Considering demographic information, the gender gap emerges both in the cross and within countries analysis, especially in Italy and Slovakia. For this latter country, this is the first time it has been statistically significant when assessing a financial literacy component. The language spoken at home, proxy of immigrant status of student’s family, is surprisingly positively associated with the dependent variable for the cross-country and Flemish regressions. In Italy, on the contrary, it has a marked negative effect, which is confirmed by the difference in international assessments on financial literacy. When evaluating the correlation between socio-economic status (e.g. Holidays abroad) and financial knowledge, it is positively and statistically significant in the Estonian model (3), confirming the previous insights from PISA 2018. What emerges checking the respondent students’ country is the result for Estonia, Italy and Slovakia compared to Flanders; if controlling only for demographic information, the correlation with self-reported financial behaviour is positive, while if adding school information, it is negative. This can be interpreted by the important contribution of grades and school track in defining students’ saving and purchasing behaviours.
This is confirmed by analysing the cross-country perspective where grades play an important role in shaping students’ self-reported financial behaviour. Both grades in mathematics and reading are strongly related to the self-reported financial behaviour for almost all the countries. This specific result is in line with previous evidence based on PISA data. Even though OECD analyses knowledge, it highlights the strong relation between financial and math literacy (OECD, 2012; OECD, 2015; OECD, 2020b). However, the contribution of this paper relies on the possibility of exploring the different aspects of financial literacy, considering that performance in the local language (e.g. literature) plays a significant role in shaping students’ self-reported behaviour.
Financial literacy: cross-dimensional reflection
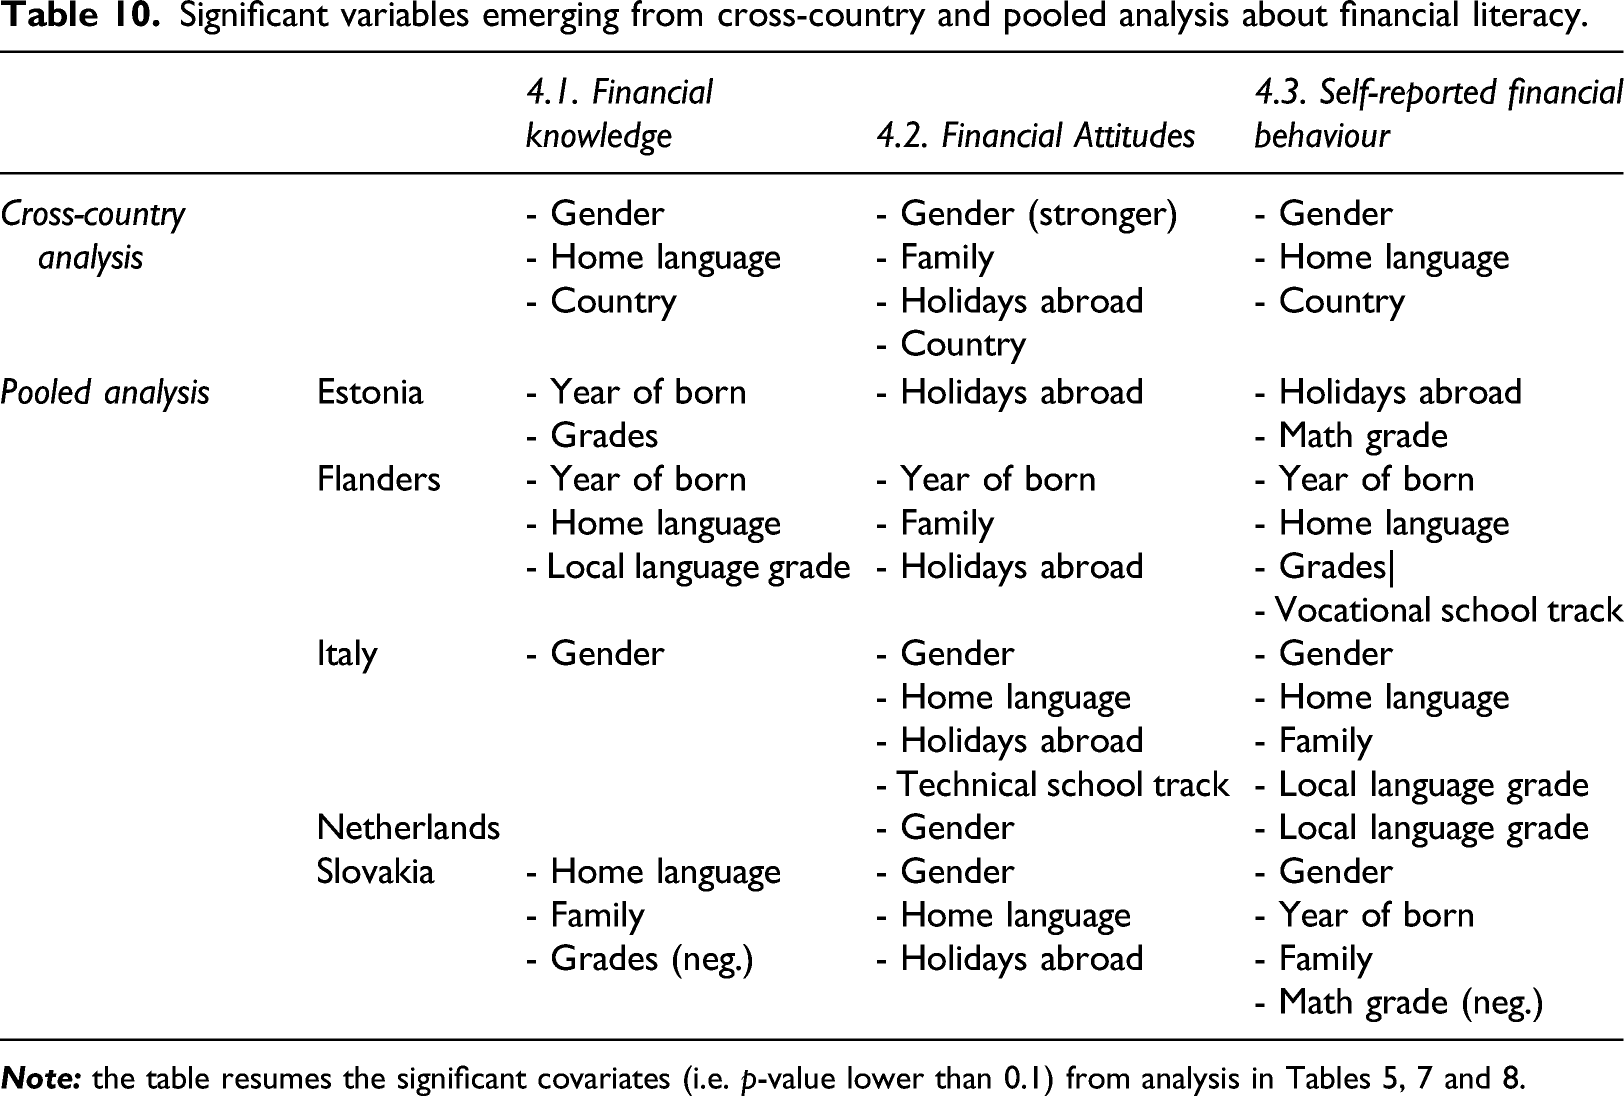
Significant variables emerging from cross-country and pooled analysis about financial literacy.
Conclusions
Concluding remarks about the analysis
The main contribution of this research relies on two aspects, namely, the comparison between cross and pooled country analysis, and the decomposition of financial literacy dimensions. This double approach allows a better interpretation of country-specific differences and compares them with international assessments. The main generalizable results of this study generally confirm PISA concerning financial literacy. The expected sources of heterogeneity in explaining financial literacy were gender, socio-economic status and immigrant family. Disadvantaged students encounter more difficulties in being financial literate than their classmates. Interestingly, being a student from an immigrant family is correlated to a lower performance in knowledge and behaviour, but not in attitudes. On a cross-country perspective, financial knowledge is mainly shaped by a student’s country, while in attitudes and behaviours analysis, there is an additional strong gender and family component, respectively. A marked gender gap emerges for Italy in all dimensions, but this is not the only country for attitudes and behaviours (as it is for knowledge), where also the Netherlands and Slovakia give better results for male students. This finding, except for Italy, does not match with PISA results, where Estonian and Dutch male and female students obtain comparable results (see Table 1). Then, socio-economic differences appear relevant for financial literacy for respondents in Flanders and Estonia in particular, again not confirming PISA findings. Students responding from these countries score higher if they belong to a more advantage family.
It is worth noting that the main limitation of this study is represented by sample selection of both students and countries. Despite the application of sample weights which correct the balance of categories according to the underlining population, some groups are completely missing in the dataset. For instance, the Estonian sample comprises only students from the academic school track. Hence possible improvements of this work can be achieved by extension of the survey to other student brackets and possibly to other countries. Secondly, like other studies in this field, financial behaviours are self-reported by respondents somehow distorting the reality. This aspect is an open issue in studies about financial education and researchers are proposing experimental settings for observing real financial behaviours.
Policy implications
The main insight from these analyses represents the first step towards a deeper understanding of financial literacy among European students. Not only from a concept perspective, but also considering as equally important the attitudes and behaviour of young generations towards finance. This aspect is particularly interesting from a policy perspective since it takes into consideration different aspects of the same phenomenon, which are strongly interrelated to each other (Remund, 2010). In fact, knowing financial concepts is not enough to actively deal with and manage money and, consequently, operate in financial markets. For this reason, the main contribution in this sense is to suggest that policy makers consider the importance of the all three dimensions of financial literacy when setting up interventions in this field.
A specific reflection on the main findings of this work, especially compared to PISA, represents an important contribution to policy-making, both at European and country levels. Generally, some results enforce what had already emerged from previous assessments, while others set new arguments for discussion. Among the already-known sources of heterogeneity in financial literacy there certainty is the gender gap, especially evident in Italy. This recurrent issue represents a rooted aspect, calling the Italian government to close this gap in the near future. In this sense, having a mandatory curriculum on financial education in schools represents the first move in solving it. A second aspect worth mentioning regards the performance obtained by Flemish and Estonian students in this survey. Although they are usually in first position in international rankings of financial literacy, this study paints a different picture. This finding is a wake-up call for policy makers, showing that some subgroups and students lag behind. Moving our attention to Slovakia, the main insight from the analysis concerns the possibility of exploring (and comparing) the correlation between immigrant status and financial literacy. Indeed, since the level of immigrant students in Slovakia is low, they are rarely considered as subgroup in international assessments. The last country-specific policy implication relates to the Netherlands; its poor participation in international assessments makes the interpretation of the results difficult. For this reason, a more international assessment about financial literacy represents the key direction suggested by this work.
In conclusion, a general policy implication relates to the importance of having financial education as mandatory in school curriculums in all countries. Only through a common and shared effort towards this direction can the differences among and with countries be smoothed out. This represents the first step to give European students equal education and possibly reduce disparities.
Supplemental Material
sj-pdf-1-rci-10.1177_17454999211066183 – Supplemental Material for A comparative analysis of financial literacy levels and initiatives among students in five European countries
Supplemental Material, sj-pdf-1-rci-10.1177_17454999211066183 for A comparative analysis of financial literacy levels and initiatives among students in five European countries by Marta Cannistrà, Tommaso Agasisti, Aisa Amagir, Kaire Poder, Oliver Holz, Lukas Vartiak and Kristof De Witte in Journal of Vibration and Control
Footnotes
Declaration of conflicting interests
The author(s) declared no potential conflicts of interest with respect to the research, authorship, and/or publication of this article.
Funding
The author(s) disclosed receipt of the following financial support for the research, authorship, and/or publication of this article: The work was supported by the European Commission through the Erasmus+ project Eufin (2018-1-BE02-KA203-046843).
Supplemental-Material
Supplemental material for this article is available online.
Notes
References
Supplementary Material
Please find the following supplemental material available below.
For Open Access articles published under a Creative Commons License, all supplemental material carries the same license as the article it is associated with.
For non-Open Access articles published, all supplemental material carries a non-exclusive license, and permission requests for re-use of supplemental material or any part of supplemental material shall be sent directly to the copyright owner as specified in the copyright notice associated with the article.