
Abstract
With the strengthening of the global economy, contemporary societies have come to view the educational achievements of their young people as a major component of national competiveness. But there are substantial variations in the strategies employed by different nations. To maximize educational achievements, some nations believe that the provision of a stratified system of schooling is effective, at least for the minority who are able to gain entry to the elite academic stream. In contrast, other nations prefer a more egalitarian strategy to education where all students attend a common school devoid of ability streams until well into their secondary level studies. The egalitarian strategy is believed to be just and fair. But does it enhance educational achievement? Several other strategies are also being advanced, and the same questions can be asked about them.
There are a number of studies that explore the academic consequences of different strategies within particular national systems, but there are relatively few studies that explore these questions across several national systems. The Organisation for Economic Co-operation and Development-supported Programme for International Student Assessment (PISA) studies enable a cross-national analysis; but the official reports from the Organisation for Economic Co-operation and Development primarily provide bivariate analyses of these relations whereas a multivariate strategy taking into account several system level variables is preferred. In this paper we examine the historical origins of six contemporary strategies, and draw on the PISA studies to compare the relative efficacy of these strategies relying on path modeling.
Introduction
In contemporary societies quality education is regarded as essential for national prosperity and progress (Hanushek and Woessmann, 2008; Wagner, 2010). It is believed that quality education enhances economic competitiveness, political vitality, and cultural creativity (Devroye and Freeman, 2001). Thus nations strive for high quality education. While all levels of contemporary education are under review, secondary education can be identified as the fulcrum of reform where the differences between nations begin to become most apparent.
International organizations such as the United Nations Educational, Scientific and Cultural Organization (UNESCO) and the Organisation for Economic Co-operation and Development (OECD) are asked to provide information and technical assistance to help nations gauge their success in achieving quality education. While there are diverse views on what constitutes quality, the academic performance of young people on achievement tests in such subjects as reading, mathematics, and science is currently accepted as one important indicator. What then are the strategies of modern education that enhance academic achievement?
Resources
The seemingly most obvious strategy is the provision of fiscal support for schools and teachers. The more a nation spends on education, surely the more its young people will achieve. But among the different aspects of education, what should receive the most funding? There is extensive debate on this question and little consensus (Hanushek, 1989).
Inclusiveness of modern education
The first modern schools were for a select group, primarily the children of the landed aristocrats and the urban middle class (Mitch, 1992). The curriculum stressed religious texts, classical literature and rhetoric with some attention to arithmetic and science. With the spread of the reformation, the doors of these schools gradually opened to children of more common homes. Trow (1961) suggests that the push for universal secondary education emerged during the Great Depression of the 1930s, first in the US, then in Europe and Asia, and later worldwide. Does the massification of modern education dilute its quality or does it stimulate a more determined engagement by a broader cross-section of the adolescent population?
Mass education with diversification
As the modern education movement spread, some elites became fearful that mass education might undermine their authority and social position (Cummings, 2003). So they came to support either a horizontal segmentation of educational opportunities based on social class and/or a vertical differentiation based (at least formally) on academic ability. The former principle of structuration (Archer 1979) is sometimes referred to as tracking and is most prevalent in Western Europe whereas the latter is often called academic streaming and is most evident in Anglophone countries. Some nations believe that the provision of a highly stratified system enhances quality, at least for the minority who are able to gain entry to the elite academic stream (Leschinsky and Mayer, 1999). Oakes (2005) has argued that the academic streaming that is found in many US school districts erodes quality. Gamoran (1992) has considered the impact of tracking.
Egalitarian education
In contrast to these stratifying tendencies is the preference for an egalitarian or undifferentiated provision of educational opportunity. Proponents of egalitarian education believe that a school culture can be created wherein those children who develop a better understanding of a particular concept can assist their teacher in helping their peers to master the material. This tendency of relying on peers to strengthen the educational process is most evident in socialist societies, and countries such as Japan (Amano 1990) where the teaching force is influenced by socialist pedagogy. Some nations prefer a more egalitarian strategy for education where all students attend a common school devoid of ability streams until well into their secondary level studies (Levin, 1978). The egalitarian strategy is believed to be just and fair. But does it enhance quality? (Bunar, 2001).
There are a number of single nation studies that explore the relation of egalitarian education and quality (Entwisle et al., 1997). OECD (2010d) has highlighted Poland’s recent commitment to equality and the corresponding improvement in student performance. Cummings (1980, 1982) argued that Japan after WWII adopted the egalitarian structural direction, and that it had positive “consequences” for the quality of Japan’s educational outcomes. Equality was portrayed as enhancing rather than eroding quality. Moreover, the post World War II increase in educational quality and equality was portrayed as fostering greater equality in the economic, social, and political relations of Japan’s adult society. Others have sharply contested these claims (Okano and Tsuchiya, 1999).
School autonomy
Arguments have been advanced both for the quality advantages of centralization and decentralization, but the research findings are inconclusive. Decentralization may shift educational decisions to lower levels of the educational bureaucracy such as local school districts, but it may not notably empower principals, teachers, or parents. But distinct from decentralization is the reform model that places the authority for these decisions at the school level, usually in the hands of the teachers themselves (Fullan, 2010). This strategy has much potential when teachers are well educated and well trained and a sound curriculum has been developed that teachers can draw on in preparing their lesson plans. Finland is often cited as an example (Sahlberg, 2011).
Assessment
Sound curricula specify learning goals or outcomes. A prominent recent reform movement proposes the development of indicators to measure the relative mastery of these learning outcomes with individual students being allowed to advance through the system only if they can demonstrate mastery of the specified outcomes. An additional component of this strategy is to use the indicators to determine the relative effectiveness of teachers in enabling children to master the outcomes and to tie teacher rewards and job security to their pedagogical effectiveness. Hargreaves and Shirley (2009) refer to this as the third wave of education reform, and they find it to be especially prevalent in Anglophone countries.
What works best?
This study seeks to understand which of these strategies has the greatest impact on educational quality. The study primarily involves a re-analysis of some of the information reported by OECD for the PISA 2009 Reading study. PISA 2009 covered 65 countries (34 OECD countries and 31 partner countries). 1 PISA 2009 is one out of several related youth performance studies conducted by OECD. There is considerable consistency over time and by subject area in the differential performance of national systems across these various surveys so drawing on one (e.g. Reading 2009 instead of Math or Science 2009) is reasonable. 2
PISA specifies three levels of analysis—the individual level, the school level, and the system level. Some analyses are at all three levels whereas others are only at the individual or school or system level. The analysis of this study focuses on the system level.
In addition to the information on academic performance, PISA 2009 reported on a wide variety of other indicators drawn from questions addressed to students, school principals, and national experts. These other indicators tend to fall into four groups: egalitarian treatment, autonomy of school management, reliance on outcome assessments, and level of resources. A major thrust of the official OECD report was the linking of each of these groups of variables with average national achievement. OECD reported significant links between average educational achievement and the variables in the first two groups, so they will be highlighted below. Some of the variables associated with resources had modest links, and hence are also included. The variables associated with the use of assessments had no clear links with educational achievement so they will not be included in the analysis below. 3
While there are many studies that explore the academic consequences of these strategies within particular national systems, there are relatively few studies that explore this question across several national systems (Bain, 2013). The recent OECD-supported PISA studies (OECD 2010a, OECDb, OECDc, and OECDd) enable a cross-national analysis; but the official reports from OECD primarily provide bivariate analyses of these relations whereas a multivariate strategy taking into account several system level variables is preferred.
Two research questions are considered:
Which strategies are most associated with educational quality?
What are the interrelations between these strategies?
Measuring quality and the leading strategies for its improvement
Quality
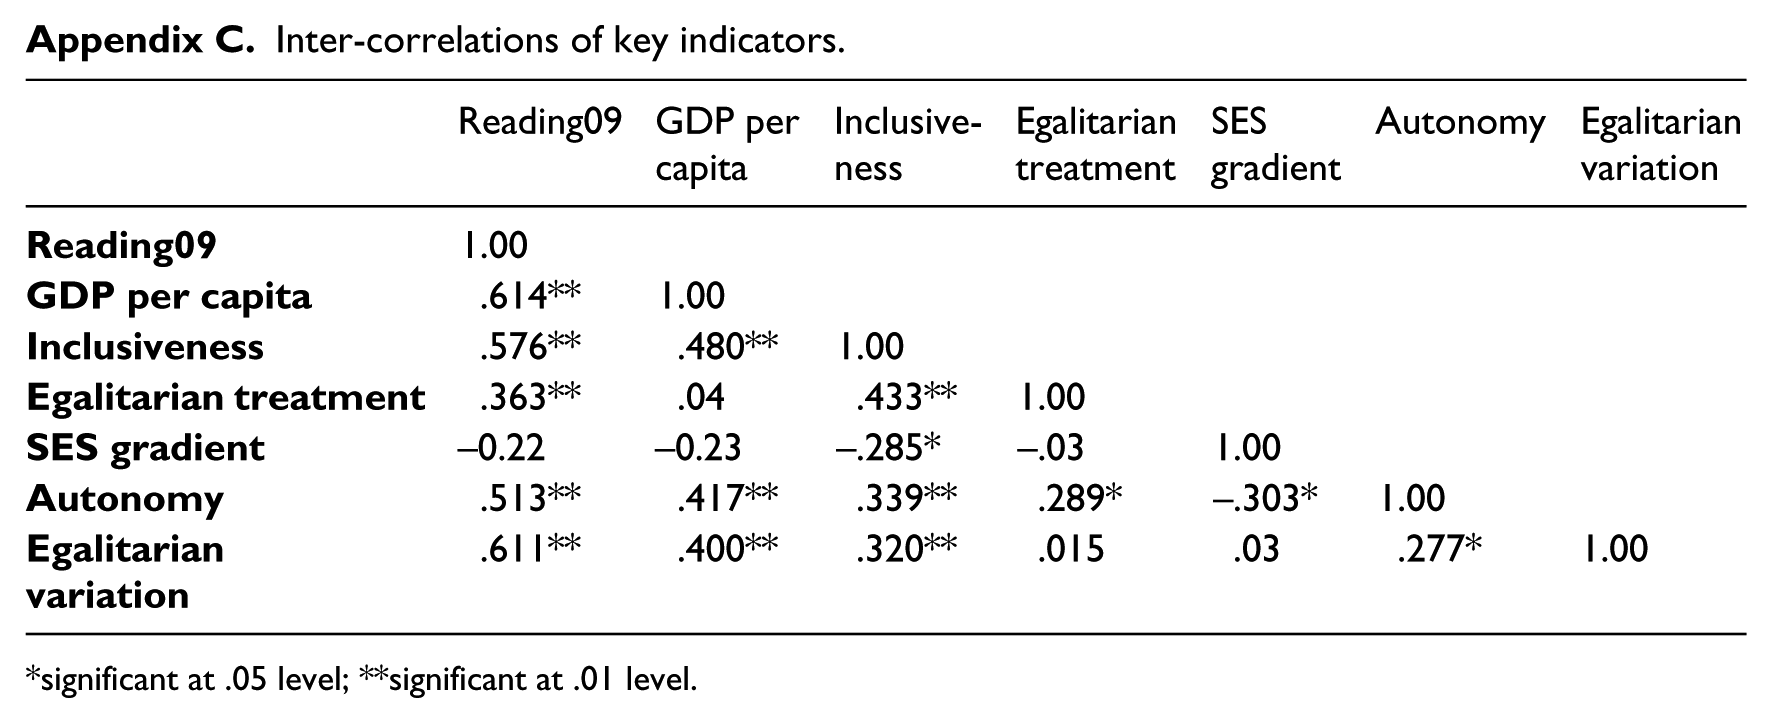
The most widely recognized measurement of quality is the average country scores on the 2009 Reading survey. The scores range from 556 for Shanghai-China to 271 for Panama. This quality measure will be the dependent variable for this study. Following OECD, the average country score can also be considered an indicator of equality in the sense that a high average score implies that a high proportion of students in the country are capable readers. Appendix A provides further details on the several measures used in this study; Appendix B presents the scores by country for the included variables, and Appendix C presents the inter-correlations.
Variation in quality
An important concern of educators is to achieve as uniform a learning outcome as possible for all students. To the extent the common learning outcome is achieved, the variation in the reading scores of all of the children in a particular national population will be modest. The standard deviation in reading scores is a familiar measure of variation. However, the standard deviation of particular countries is influenced by the position of these countries relative to others; higher mean scores enable the achievement of higher standard deviations. The coefficient of variation (the mean divided by the standard deviation) is sometimes used to neutralize the influence of the average score on the degree of variation. But higher scores on the coefficient of variation mean a less equal spread. With this study’s attention on equality, we sought a measure that gave a higher value to a more equal outcome; hence for our measure of equality of variation, we subtracted the coefficient of variation for each country from 1. Thus a higher value in our measure means greater equality of variation.
Impact of SES
PISA 2009 looks at several measures of equitable process, primarily related to “overcoming social background” as reported in Appendix A of Volume II. We have examined these measures and settled on the slope of the Socio Economic Status (SES) gradient to indicate egalitarian process. For each country, the SES gradient is the regression coefficient for the bivariate regression equation of SES on Reading 2009. According to OECD, “Within a single construct, the socioeconomic gradient summarizes many of the aspects of educational equity that can be analyzed by PISA” (II: 52). However with the OECD measure, the lower the value of the slope, the greater is the equality of process. We wanted a statistic where a higher value implied greater equality. Accordingly we subtracted the published values of the slope from 100. Thus, in this study a higher value implies greater equality of process (less influence of SES). The country scores on these indicators are presented in Appendix Table B and the inter-correlations in Appendix C. The inter-correlations are weak but most are in the expected direction.
Egalitarian treatment
PISA 2009 presents four indicators: The percentage of students in the system that have ever repeated; the number of tracks at the upper secondary level (range from 1 to 6); the percentage of students who are likely to be transferred from one school to another because of low or high achievement behavioral problems, special learning needs, or a parent’s request; and the percentage of schools that group students by ability in all subjects. A low value on each of these indicators suggests a more egalitarian treatment. The inter-correlations of the four indicators are modest to strong and all are in the expected direction. Given the strength of these relations, we decided to combine these four indicators in a composite variable that we will label as Egalitarian Treatment. (And for the sake of greater ease in reading results, we subtracted the values for the composite variable from 100 so that a higher score indicates greater equality of treatment.) 4 It is notable that the Scandinavian countries tend to have the most egalitarian treatments followed by the East Asian countries of Japan and Korea. Several East European countries also have high scores. In general, the OECD countries have higher scores than the Partner countries.
Autonomy
Next, we considered the relative autonomy of schools. PISA 2009 (OECD 2010d: 48) highlighted four indicators of autonomy: The percentage of principals in each national system that asserted that their schools establish their own student assessment policies, the percentage that choose which textbooks are used, the percentage that determine course content, and the percentage that decide which courses are offered. OECD computed the average of these scores to create a composite School Autonomy variable, and we will follow that procedure. Again the country scores are presented in Appendix B.
The inter-correlations of School Autonomy with the other variables in the analysis are again presented in Appendix C (IV: 53). School Autonomy has a strong positive relation with Quality, a weak positive relation with the Equal Process variables, and a modest positive relation with Equal Treatment.
Inclusiveness
Perhaps the most fundamental difference between traditional and modern education is the extent to which young people are included in the schooling process, first at the basic education level and then at the upper secondary level and the tertiary level. As the PISA research focused on 15-year-olds, we defined inclusiveness as the Gross Enrollment Ratio for upper secondary education; the statistics reported by OECD provided the actual measure. Our working hypothesis proposes a negative relation between inclusiveness and quality.
Per capita gross domestic product (GDP)
The educational systems of more economically advanced societies tend to do better on measures of educational quality than do those of less advanced societies. To both recognize this fact and to neutralize its impact on our interpretation of findings, we have included a measure of per capita gross domestic product (GDP) for the year 2007. Per capita GDP alternately could be interpreted as an indicator of the level of resources (available for allocation) to education. As reported in Appendix C, the inter-correlations of per capita GDP with the variables noted above are modest to strong.
Other areas of structure
As reported by OECD, the assessment measures had no relation to our measure of quality so we dropped them. Concerning the resources area, there was a relatively strong relation between average teacher salaries and quality; however, there were many missing values so we dropped that as well.
Handling missing data
The OECD Reading 2009 survey collected data from 65 “countries.” For a comparative study of this kind, that is an impressive number. But for multivariate statistical analysis, it is small. Statistical coefficients can be significantly influenced by the inclusion/exclusion of a single case.
For the measures discussed above, there were only a few missing values. While one approach would have been to drop all countries that had missing values, we chose to limit our selection of variables to those with relatively few missing values, and in the instances where there were missing values we introduced estimates for the small number of missing values. For example, we lacked values for France on four indicators; recognizing the similarity in the Belgian and French systems, we assigned the values for Belgian to the missing cells of the French system. The Swedish value was assigned to the missing cell of Norway. And so on. Altogether we made 11 estimates.
OECD’s analysis of PISA 2009
OECD’s analysis of PISA 2009 is reported in five volumes. Each volume provides extensive information related to the focal topic including, in some instances, reports on bivariate correlations between indicators of interest and the outcome variable of country average reading scores. In one of the volumes, a correlation matrix of the inter-relations of several variables is presented. But the PISA 2009 report does not get into multivariate analyses.
Multivariate analysis is essential in order, for example, to determine whether egalitarian treatment has an impact on educational quality independent of other factors such as national wealth, socioeconomic background, school autonomy, and performance assessment. The unique contribution of this paper is to initiate an exploration of the multivariate analysis of the PISA 2009 data set.
Limitations of the PISA data set
A limitation of all of the PISA studies is that they only focus on 15-year-olds. Thus they do not consider earlier ages/grades or the impact of differential experiences at the earlier grades? Some systems are impressively egalitarian at the primary and lower secondary levels, but they begin serious differentiation at the upper secondary level, which is the time many youth turn 15. Others begin horizontal differentiation at earlier grades. But PISA does not take account of these differences in the educational history of the 15-year-old pupils. (In the Japanese case, PISA actually sampled students in the first year of senior high school that is the beginning of horizontal differentiation in Japan, rather than 15-year-olds as such.)
The prospects of the respective reform strategies
Our principal interest is to determine which among the several strategies has a significant impact on Educational Quality, once the other variables discussed above are included in the analysis. For this purpose we have utilized ordinary least squares regression analysis.
The regression results for the prediction of Reading 2009 are presented in Table 1. The equation explains an impressive 63% of the variance (adjusted R2) in average quality.
Explaining educational quality with an ordinary least squares regression analysis.
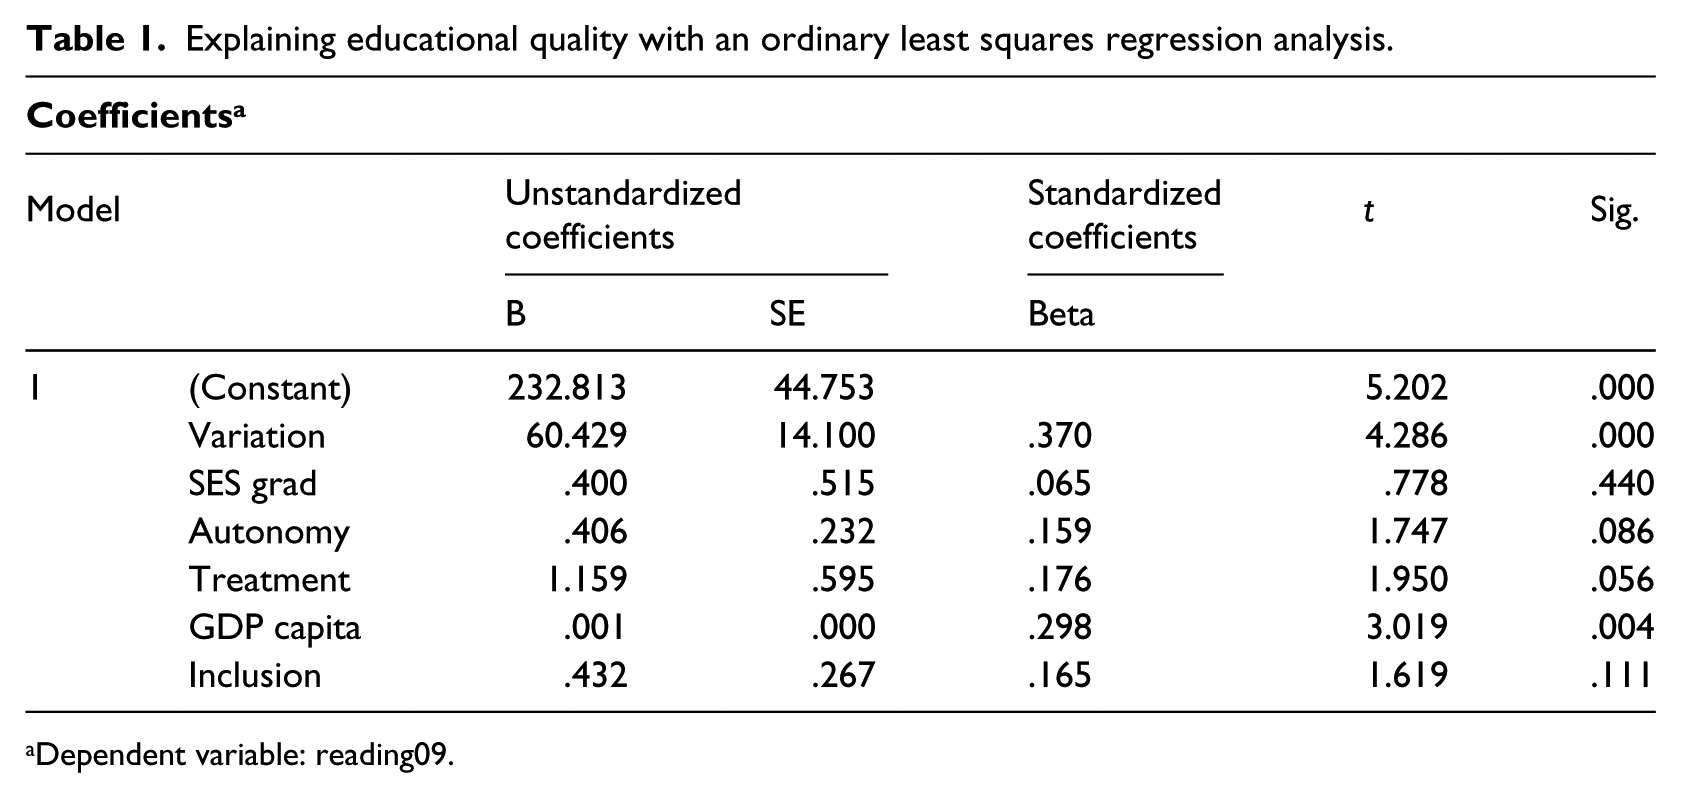
Dependent variable: reading09.
Egalitarian Variation in Reading and GDP per capita are the main predictors of Reading 2009 followed by Egalitarian Treatment; all are statistically significant at the .01 level.
School Autonomy has a more modest impact. Inclusiveness, while not statistically significant, interestingly has a positive relation with Quality. Finally, the indicator for the SES gradient does not have a significant impact.
Path analysis of system strategies
Path Analysis is a technique used for the development of an analytic description of the relations between variables of interest. Path Analysis is based on several assumptions that are not fully met in this case, particularly the assumption that source variables should temporally precede output variables. We have overruled that assumption, and proceeded to carry out a series of sequential regressions to highlight the inter-relations between the variables representing the several system strategies. The schematic findings from this path analysis are presented in Figure 1 (rather than present the actual coefficients for the respective paths, we have included only the significant paths with the arrows indicating their directionality: blue for positive and green for negative).
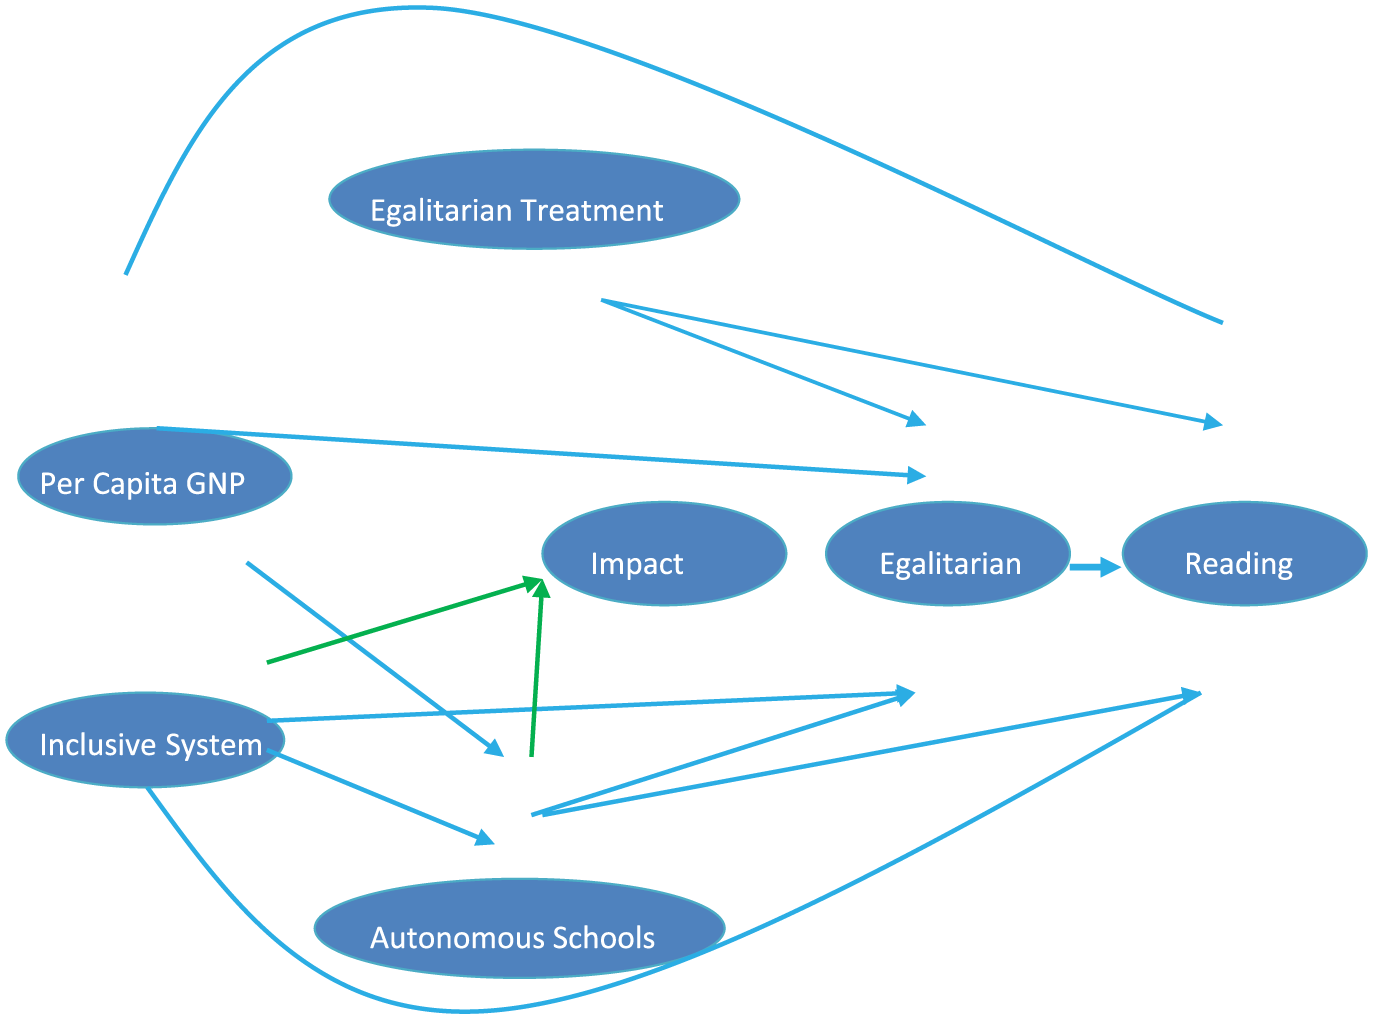
The role of current strategies in accounting for national level of reading achievement.
Per capita gross national product (GNP), which can be considered an indicator of the availability of resources, achieves its impact both directly and indirectly through its positive association with autonomous schools and egalitarian variation. All of these paths are positive so it can be surmised that the availability of resources is an important component in educational quality.
Inclusiveness achieves its impact both through a direct path to quality and through the indirect path of autonomous schools. The implication is that inclusive systems are most successful when the schools are autonomous.
Egalitarian Treatment appears to be a distinctive reform strategy achieving its impact on Quality both directly and indirectly through Egalitarian Variation. On the other hand, there is no link between Egalitarian Treatment and all of the other strategies. These results provide a strong affirmation of Egalitarian Treatment as one of the most important factors for enhancing educational quality.
Autonomous Schools has both a direct link with Quality and an indirect link through Egalitarian Variation. Additionally to the extent schools are autonomous, there is a strong association with Reducing Impact of SES, but as will be discussed below this SES indicator has no consistent association with Quality.
In sum, our path model points to the salience of four more or less independent system strategies: 1. To the extent systems are inclusive, quality is higher; 2. To the extent a society has greater economic resources, quality is higher; 3. To the extent a system de-emphasizes sorting (e.g. the reliance on tracking and streaming), quality is higher; and 4. To the extent the schools in a system enjoy autonomy, the quality is higher.
What about SES?
As noted in the section on methods, OECD analysts have devoted considerable effort to developing new indicators of educational process, and in their report they have especially highlighted two such indicators: The percentage of within school variance explained by SES and the slope of the gradient of SES. These variables seek to capture the extent to which the socioeconomic background of students influences their educational performance. Lower scores on these variables would signify the lower influence of SES.
These two variables are highly correlated with each other, yet neither has a significant relation to Reading 2009. Countries with a higher degree of influence of SES on student performance do not have lower scores on Reading 2009. Moreover, neither of these SES background variables has a significant relation to the relative presence of egalitarian treatments. What is going on?
In the development of the SES variables, OECD presents a number of graphs. One of these presents the distribution by SES gradient with the distribution by Reading 2009 (see Figure II.3.4 on page 59 OECD 2010b). OECD argues that the countries should fall either in the top right quadrant (low slope, high performance) or the bottom left quadrant (high slope, low performance). Several important countries do fall in the top right quadrant, but the bottom left quadrant is virtually empty. The fact is that the majority of countries fall into the two remaining quadrants. Clearly OECD has encountered difficulty in depicting the role of SES background in educational performance as well as in accounting for the actual variability in SES background. This is an important area for further exploration.
Hybrid strategies
These five strategies comprise most of the major variations in the strategies for improving quality of contemporary educational systems. They are not mutually exclusive; particular nations are likely to combine two or more of these strategies. For example, the US emphasizes horizontal differentiation, decentralization, and assessment. Germany emphasizes vertical differentiation and decentralization. Japan emphasizes equality and centralization. Finland stresses equality and autonomy.
So can anything be said about the added value deriving from different combinations of these strategies? Two prominent techniques for addressing this question are: (a) the consideration of statistical interactions; and (b) the consideration of regional types as represented by dummy variables.
Concerning interactions, we computed values for all of the two-way combinations. Recognizing the small number of cases in the analysis and hence the concern for the distortion of statistical findings as new variables are added, we entered each of these interaction variables one at a time into the equation developed for Table 1. None of the interaction terms had a significance level below p < .05, so we dropped this strategy.
In contrast, the variation between “regions” was more suggestive. We created several regional dummy variables to reflect prominent regional differences in educational strategies: Asia reflecting the intense educational competition of this region, Scandinavia reflecting the strong egalitarian commitments in this region, East Europe reflecting the drive in several post-socialist nations to launch new educational directions, the Anglophone model reflecting the neo-liberal tendencies of several Anglophone countries, the Francophone model shared by several French-speaking countries, and finally the Latin American model shared at least in some degree by most Latin American countries.
Each of these dummy variables was introduced into separate regression equations, yielding some interesting patterns: The Asia variable (Cummings 1997) yielded a strong positive impact up and above that of the basic equation discussed earlier—suggesting the competitive interaction in the Asian region has stimulated quality. In contrast, the Latin American variable had a negative impact suggesting there are serious deficiencies in the quality of education in Latin America, in excess of what might be expected just through a consideration of Latin American strategies for quality improvement. The Anglophone dummy also had a negative impact, but it was not statistically significant. The Scandinavian dummy had little impact. Similarly neither the East European nor the Francophone dummy variables added much to the basic equation reflecting the fact that there is considerable internal variation in these regions.
So up and above the impact of particular strategies is the impact of being part of regional sub-cultures. Put differently, while global forces are frequently stressed in discussions of the incidence and impact of reforms, we find that regional forces are also important—strongly positive for Asia and moderately negative for Latin America.
Conclusion
OECD is conducting influential studies on the quality of contemporary education. The official reports present basic data and simple analysis. But they do not indicate which among several important reform strategies might have the greatest impact on quality. This study briefly reviews recent educational reform activity and then highlights six key reform strategies: Financial Resources (as indicated by economic level), Inclusiveness of modern education, impact of Egalitarian Process (SES), School Autonomy, Egalitarian Treatment, and Egalitarian Variation. It finds that resources and egalitarian treatment have the strongest link with average student achievement.
The positive association between economic level and average educational achievement is not surprising; more affluent societies can provide schools with more resources including instructional materials and well-trained teachers. But it should be noted that this link is moderate; some affluent societies devote considerable resources to education whereas other affluent societies place greater emphasis on other policy areas. Also even when a society allocates generous funds for education, it may not be channeling these funds to the most opportune areas; for example egalitarian treatment of students is often underemphasized. Additionally just as the economic level of a society enables the deployment of more resources for education, more resources for education contributes to the long-term enhancement of the wealth of nations. In this regard, it is noteworthy that Inclusiveness has a positive relation to economic level as well as to average educational achievement.
The measure of egalitarian treatment developed for this study has four component indicators. Three of the four when taking separately have a strong relation to the PISA 2009 indicator of reading quality. Most notable are the absence of streaming and the minimal reliance on transferring students to alternate schools due to low performance or behavioral issues.
The prevalence of autonomous schools (a function of the recent reform movements promoting school choice and school-based management) tends to be greater in more affluent systems as well as in more inclusive systems. Autonomy is positively associated with egalitarian variation and with reading quality; however, the latter links are relatively modest when compared to egalitarian treatment.
The path model developed for this study is suggestive of the links between the different strategies to reform. One surprising finding is the lack of association between the assessment theme and the other reform strategies. Also of interest is the limited impact of SES, once other features are considered.
Up and above the link of the several reform strategies with quality is the apparent impact of regional culture. In the case of Asia the regional culture has a strong positive impact; this is a region where education has tended to be revered and where in recent years several nations have been very explicit regarding the quality of national education systems as instrumental for national development. In contrast, education particularly at the secondary level has been somewhat neglected in Latin America (Ferranti and Perry, 2005), and hence there appears to be an excessively negative tendency for educational quality in this part of the world. In other parts of the world, there is not a clear or consistent regional effect. Instead particular countries stand out as seeming to get it right—e.g. Finland, Canada, New Zealand.
Footnotes
Appendix
Inter-correlations of key indicators.
| Reading09 | GDP per capita | Inclusive-ness | Egalitarian treatment | SES gradient | Autonomy | Egalitarian |
|
|---|---|---|---|---|---|---|---|
|
|
1.00 | ||||||
|
|
.614 ** | 1.00 | |||||
|
|
.576 ** | .480 ** | 1.00 | ||||
|
|
.363 ** | .04 | .433 ** | 1.00 | |||
|
|
–0.22 | –0.23 | –.285 * | –.03 | 1.00 | ||
|
|
.513 ** | .417 ** | .339 ** | .289 * | –.303 * | 1.00 | |
|
|
.611 ** | .400 ** | .320 ** | .015 | .03 | .277 * | 1.00 |
significant at .05 level; **significant at .01 level.
Funding
This research received no specific grant from any funding agency in the public, commercial, or not-for-profit sectors.