
Abstract
Background:
Acute postoperative pain (APP) are key factors in the recovery of surgical patients after surgery. This study used the machine learning eXtreme Gradient Boosting (XGBoost) algorithm for the prediction of acute postoperative pain after major noncardiac surgery in older patients.
Methods:
This was a secondary analysis of data from a randomized controlled trial containing 1720 older patients undergoing general anesthesia. The training and test sets were divided according to the timeline. The Boruta function was made to screen for relevant characteristic variables. The XGBoost model was built on the training set using 10-fold cross-validation and hyperparameter optimization, and the tuned optimal model plotted the importance ranking diagram of feature variables, partial dependence profile (PDP) and Break down profile (BDP). The optimal model was used to calculate the confusion matrices and their parameters for the training and validation sets, and to plot the receiver operating characteristic curve (ROC), precision recall curve (PRC), calibration curve and Clinical decision curve (CDC) on the validation set.
Results:
The Boruta function was used to screen the relevant characteristic variables, and the screened postoperative acute pain characteristic variables were CHARLSON score, Mini-Mental State Examination (MMSE), duration of surgery, preoperative depression score, smoking or not, duration of anesthesia, intraoperative mean heart rate, lidocaine dosage, age, intraoperative morphine dosage, grouping, preoperative anxiety score, loperamide dosage, intraoperative colloid amount, APACHE -II score, postoperative ICU or not, surgical site and postoperative tracheal intubation or not. Test set and validation set accuracy (ACC) for acute postoperative pain: 0.921 and 0.871; AUC-ROC: 0.964 and 0.920; AUC-PRC: 0.983 and 0.959; Brier: 0.067 and 0.098; Matthews Correlation Coefficient (MCC): 0.847 and 0.746.
Conclusions:
A high-performance algorithm was developed and validated to predict the degree of change in postoperative pain; controlling important characterizing variables may be helpful for postoperative analgesia.
Background
Prevention and treatment of acute postoperative pain (APP) are key factors in the recovery of surgical patients after surgery and in reducing hospitalization and health care costs. 1 Despite advances in medications and technology, 30% to 75% of surgical patients experience moderate to severe pain, 2 which is associated with higher risk of morbidity, cost of care, 3 and increased risk of chronic pain. 4 A review of the American Pain Society Clinical Practice Guidelines 5 revealed that up to now only low-quality insufficient evidence has been identified and used to guide clinical work, especially in postoperative pain management, and that disparities continue to exist between healthcare organizations as well as between different countries.
However, APP is a clinical problem that encompasses multiple factors,6–8 and clinical practitioners need to strive to eliminate all factors that have the potential to cause postoperative pain in patients. Effective postoperative pain management is a key component of perioperative care and, in conjunction with factors such as early mobilization and nutrition, can directly reduce the incidence of postoperative complications and length of hospital stay. 9 And APP management needs to be tailored to patients undergoing different surgeries to promote early mobilization and rapid postoperative recovery and to minimize the long-term use of opioid analgesics.10–12
Previously, Fang et al. presented a dataset for large-scale clinical bouts of pain in children and developed machine learning to make it effective in assessing pain in children. 13 Omar et al. conducted a Meta-analysis of prolonged postoperative use of bouts of medication and found that machine learning algorithms can be used as a decision-support tool in the context of opioid use. 14 The potential for machine learning applications in medicine is huge. Machine learning algorithms are more accurate in predicting outcomes than traditional prognostic scores and statistics. 15 With the advancement of computer technology, new machine learning techniques have emerged as a promising method for predicting outcomes in various areas of medical research, including anesthesiology.16–20 XGBoost is an optimized distributed gradient boosting tree designed for efficiency, flexibility, and portability. It is a powerful algorithm in machine learning, demonstrating exceptional performance in terms of predictive accuracy, speed, model robustness, and scalability. The core algorithm is based on Gradient Boosting Decision Trees (GBDT), with the fundamental idea of iteratively training decision trees to minimize the loss function. XGBoost is widely popular in global data science and machine learning, finding extensive applications across various research fields. Previously, Gayeon et al. 21 used the XGBoost model to assess pain metrics in patients before skin incision, after incision, and intraoperatively, and the results demonstrated good sensitivity and specificity. Chen et al. 22 also used the XGBoost model to predict postoperative pain for rupture of the abdomen surgery to enhance pain management in women after planter birth. However, as of now there are fewer studies on the prediction of acute postoperative pain in elderly patients, so this study used XGBoost in conjunction with clinical disciplines to assess the risk factors for acute postoperative pain in perioperative elderly patients.
Methods
Data collection
The data in this study are derived from the trial “Delirium in Older Patients after Combined Epidural-General Anesthesia or General Anesthesia for Major Surgery: A Randomized Trial,” which involved a secondary analysis of a previously established database. The study protocol was approved by the Institutional Review Board of Peking University (Approval No. 00001052-11048) and the ethics committees of five participating centers. It is registered with the Chinese Clinical Trial Registry (www.chictr.org.cn; Identifier: chictr-TRC-90000543) and ClinicalTrials.gov (Identifier: NCT01661907). All patients included in this retrospective study signed an informed consent form.
Inclusion criteria were (1) included patients between 60 and 90 years of age (2) underwent elective noncardiac thoracic and abdominal surgery of at least 2 h duration and (3) used a self-controlled analgesic pump after the procedure.
Exclusion criteria: patients with severe neurological disease, acute myocardial infarction or stroke, severe cardiac insufficiency, severe hepatic insufficiency or renal failure or contraindications to epidural anesthesia within 3 months.
Postoperative pain assessment
Pain was assessed using the Visual Analog Scale (VAS) and Numeric Rating Scale (NRS) during rest and coughing, conducted daily from days 1 to 3 between 8–10 AM and 6–8 PM. VAS was primarily used, while NRS was utilized for patients with visual impairments. Previous research has shown that both VAS and NRS demonstrate good consistency and sensitivity in assessing postoperative pain, 23 with NRS being applicable for visually impaired patients. 23 All patients received a single dose of 50 mg morphine postoperatively. For those dissatisfied with the effectiveness of postoperative epidural analgesia, adjustments to the pain pump settings (such as increasing background dosage or single bolus, shortening the dosing interval) or adding other analgesics (morphine 50 mg) were made. Similarly, for patients receiving intravenous patient-controlled analgesia, adjustments and additional opioid analgesics were provided as needed.
Observation indicators
Predictive variables
The study includes 59 potentially useful features as predictive variables, which are:
Demographics: Age, gender, years of education, Body Mass Index (BMI), American Society of Anesthesiologists (ASA) score, grouping (general anesthesia + Patient Controlled Intravenous Analgesia, or combined epidural-general anesthesia + Peridural Continuous Epidural Analgesia). Cognitive and Psychological Assessments: MMSE score, depression score, anxiety score, Charlson comorbidity score. Preoperative Laboratory Tests: Hematocrit (HCT), albumin (ALB), blood glucose, serum sodium, serum potassium, creatinine (CREA), blood urea nitrogen (BUN), BUN/CREA ratio. Preoperative Comorbidities: Stroke, transient ischemic attack (TIA), chronic obstructive pulmonary disease (COPD), chronic bronchitis, asthma, coronary artery disease, hypertension, arrhythmia, diabetes, thyroid disease, liver failure, renal failure, hyperlipidemia.
Cardiovascular Health: New York Heart Association (NYHA) classification. Lifestyle Factors: Smoking history, alcohol consumption. Intraoperative Anesthesia: Use of nitrous oxide, sevoflurane, midazolam, atropine, antiemetics, NSAIDs, lidocaine, ropivacaine, total morphine dose. Intraoperative Fluids and Monitoring: Crystalloid and colloid fluids, red blood cells, plasma, blood loss, urine output, mean arterial pressure (MAP), mean heart rate (MHR), surgery duration, anesthesia duration, surgery site (abdomen or chest), use of laparoscopy, intraoperative hypotension, APACHE-II score, postoperative ICU admission, and postoperative intubation.
Outcome variables
Acute Postoperative Pain Group (APP): Median resting pain score of 4 or higher based on the Visual Analog Scale (VAS) across six assessments over the first 3 days post-surgery; median movement pain score of 4 or higher over the same period; total morphine consumption greater than 50 mg. Non-Acute Postoperative Pain Group (NAPP): Median resting pain score of less than 4 based on the VAS across 6 assessments over the first 3 days post-surgery; median movement pain score of less than 4; total morphine consumption of 50 mg. The outcome variable is a binary classification between APP and NAPP.
Statistical analysis and sample size
RStudio (version 2023.06.0+421) were used for statistical analysis. Normality of continuous variables was tested using the Shapiro-Wilk test. Normally distributed continuous variables are presented as mean ± standard deviation, while non-normally distributed variables are expressed as median (interquartile range). Categorical data are presented as frequency (percentage).
In this study, 10-fold cross-validation is the most commonly used method to deal with unequal number sets by repeatedly using randomly generated sub-samples for training and validation, validating the results one at a time. The dataset was split into training and testing sets based on time. Missing data were imputed using the missForest package. Independent factors influencing postoperative pain were identified through the Boruta feature selection method on the training set. We used random grids for joint tuning of hyperparameters, including eta (lower = 0.01, upper = 1),max_depth =to_tune(lower = 1, upper = 30),nrounds =to_tune(lower = 1, upper = 30), the optimization goal is 10 fold cross-validation weighted accuracy. When max_depth is large (5 in this article), a higher gamma or min_child_weight is required to prevent overfitting. The mlr3verse package was used to implement 10-fold cross-validation and hyperparameter tuning to build the XGBoost model on the training set. The optimized model's performance was evaluated by plotting the feature importance ranking, partial dependence plots, and decomposition plots of the predictions. The confusion matrix and related metrics for both the training and validation sets were calculated, and the receiver operating characteristic (ROC) curve, precision-recall curve, calibration curve, and decision curve analysis (DCA) were plotted for the validation set.
For the binary classification model, the pmsampsize function in RStudio was used to calculate the sample size. With a given c-statistic of 0.9, 30 predictor variables, a shrinkage factor of 0.9, and an incidence rate of acute postoperative pain of 0.4, the final sample size requirement was 601, which is smaller than the 1207 samples available in the training set for this study.
Results
Baseline clinical data and flowchart
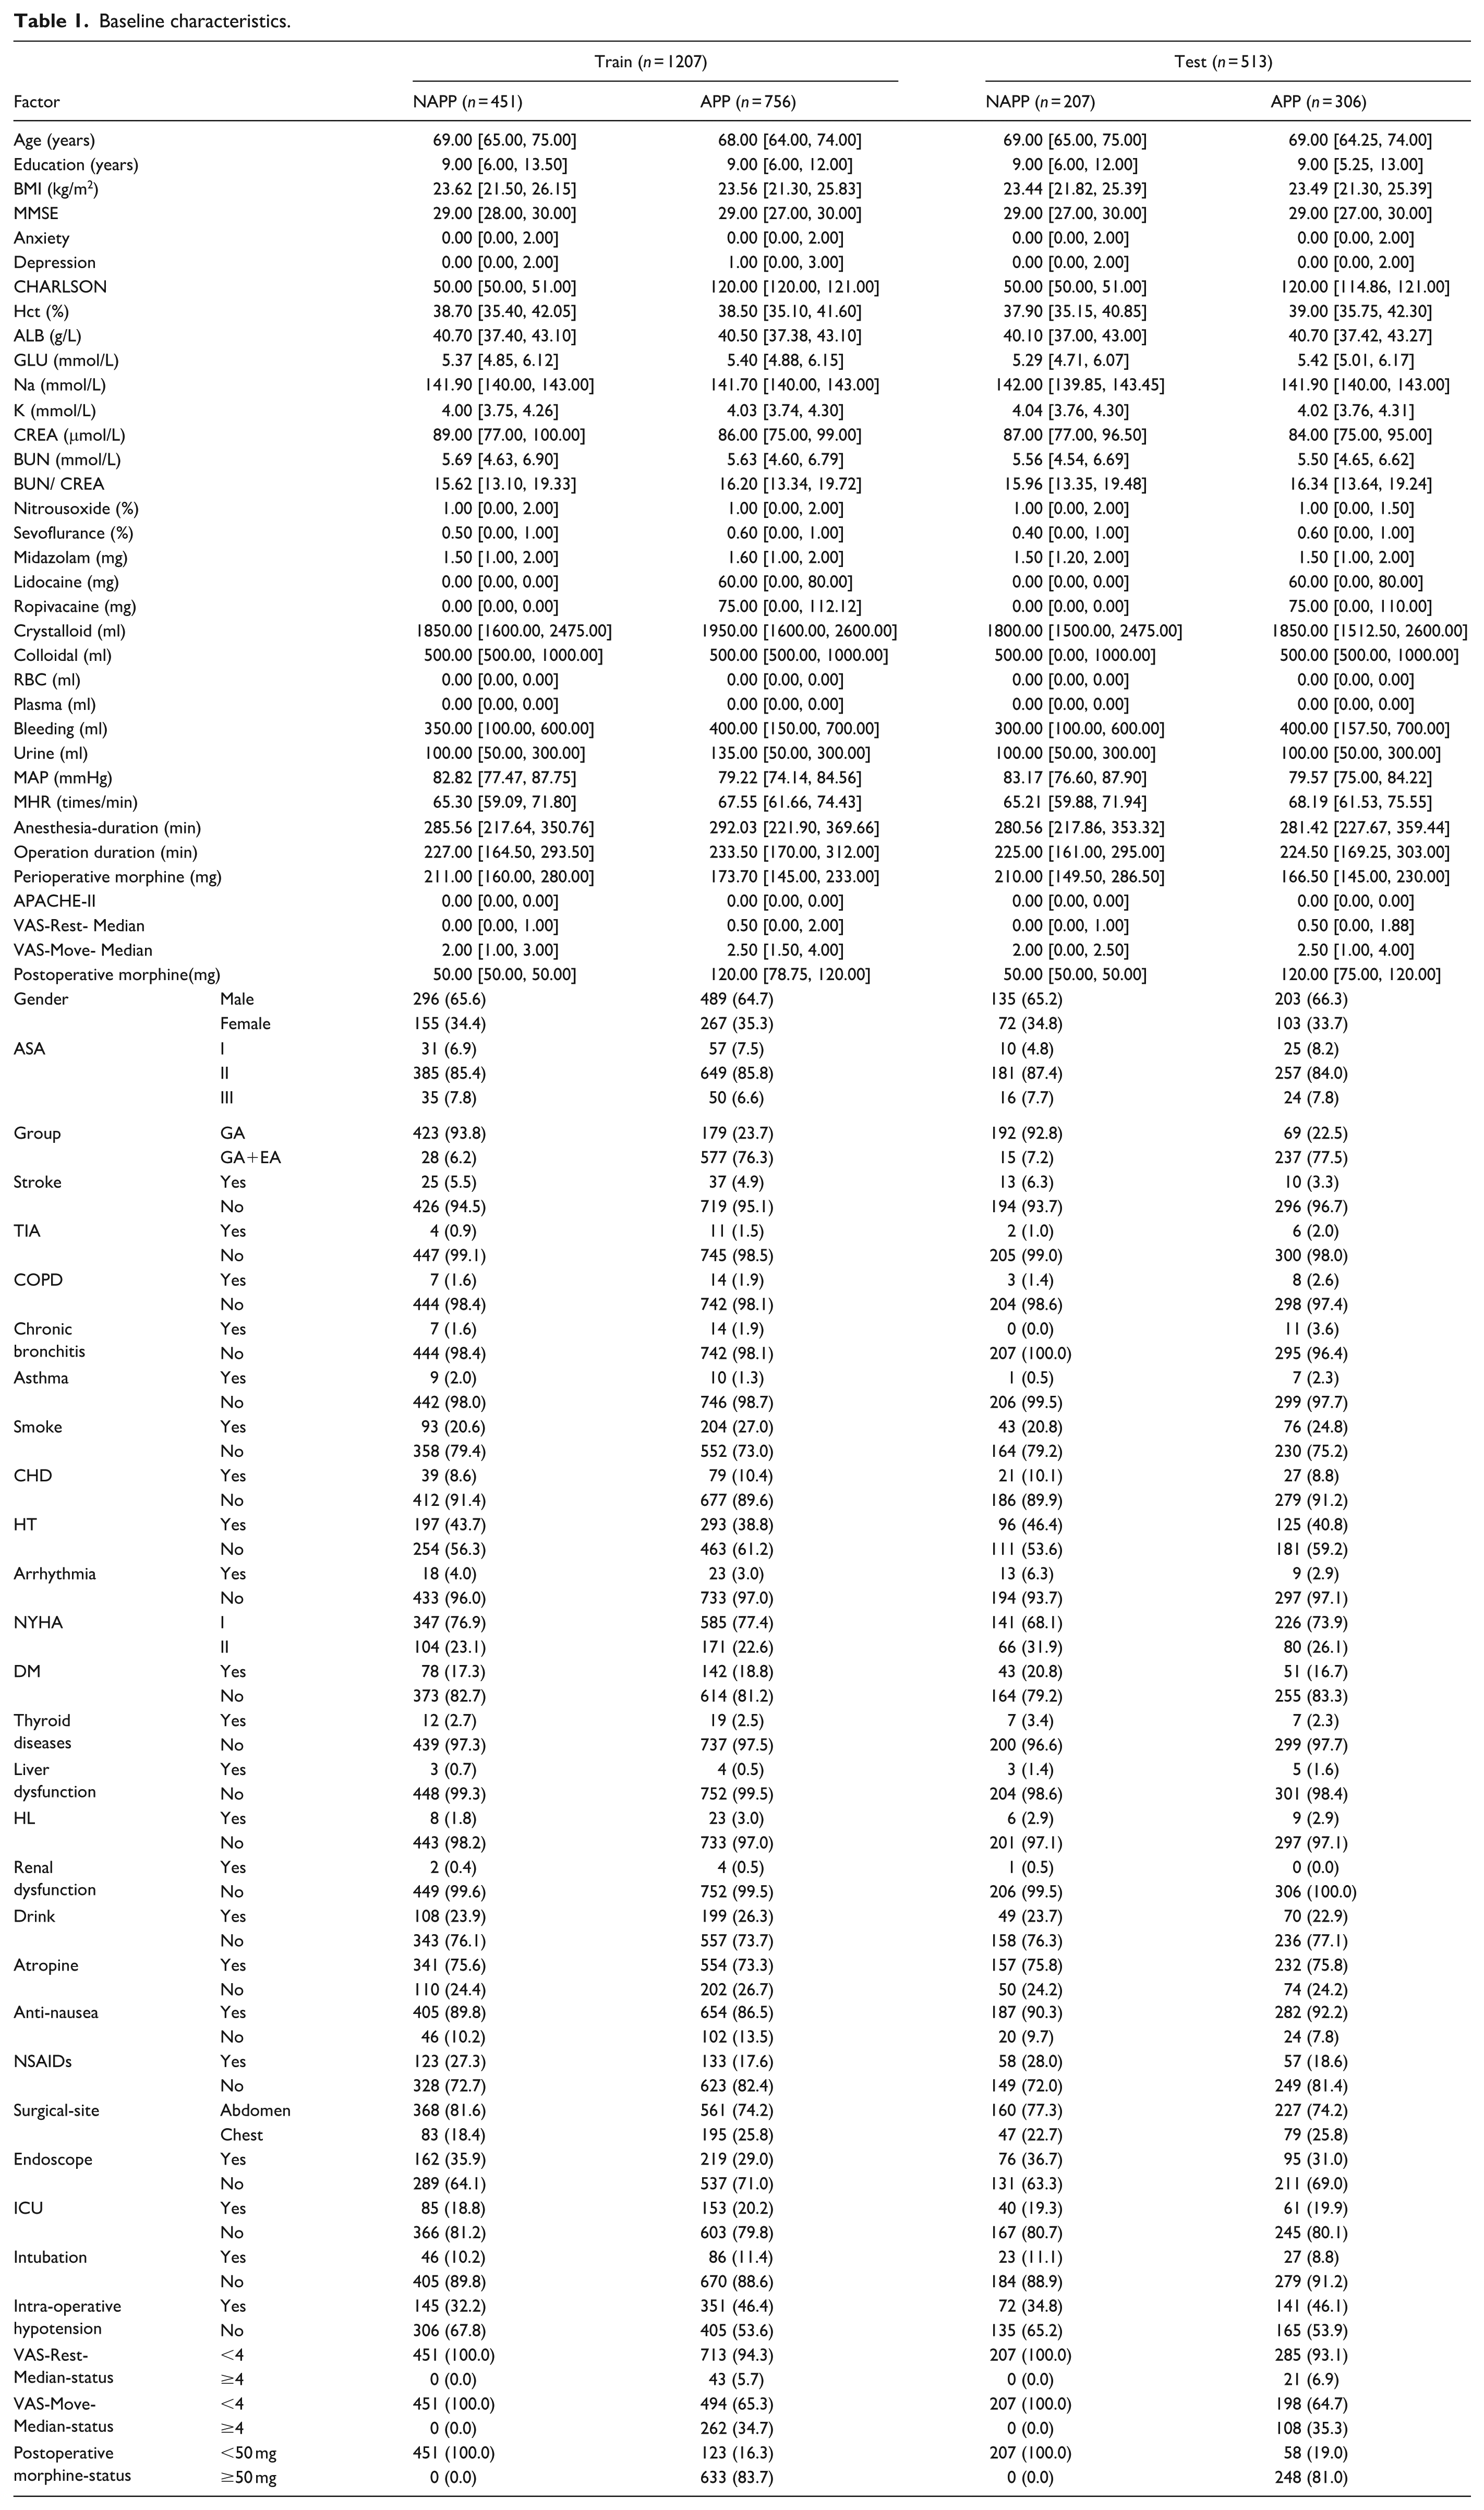
The total dataset comprised clinical data from 1,720 patients. The training (n = 1027; APP = 756, NAPP = 451; 2015.01-2017.02) and test sets (dataset n = 513; APP = 306; NAPP = 207; 2017.03-2018.06) were divided according to the timeline. The incidence of acute postoperative pain in the training set was 62.63% (756/1207), while in the testing set, it was 59.65% (306/513). There were no statistically significant differences in clinical data between the training and testing sets (p > 0.05), as shown in Table 1. The process of data collection, standardization, splitting, model development, validation, and interpretation is illustrated in Figure 1.
Baseline characteristics.
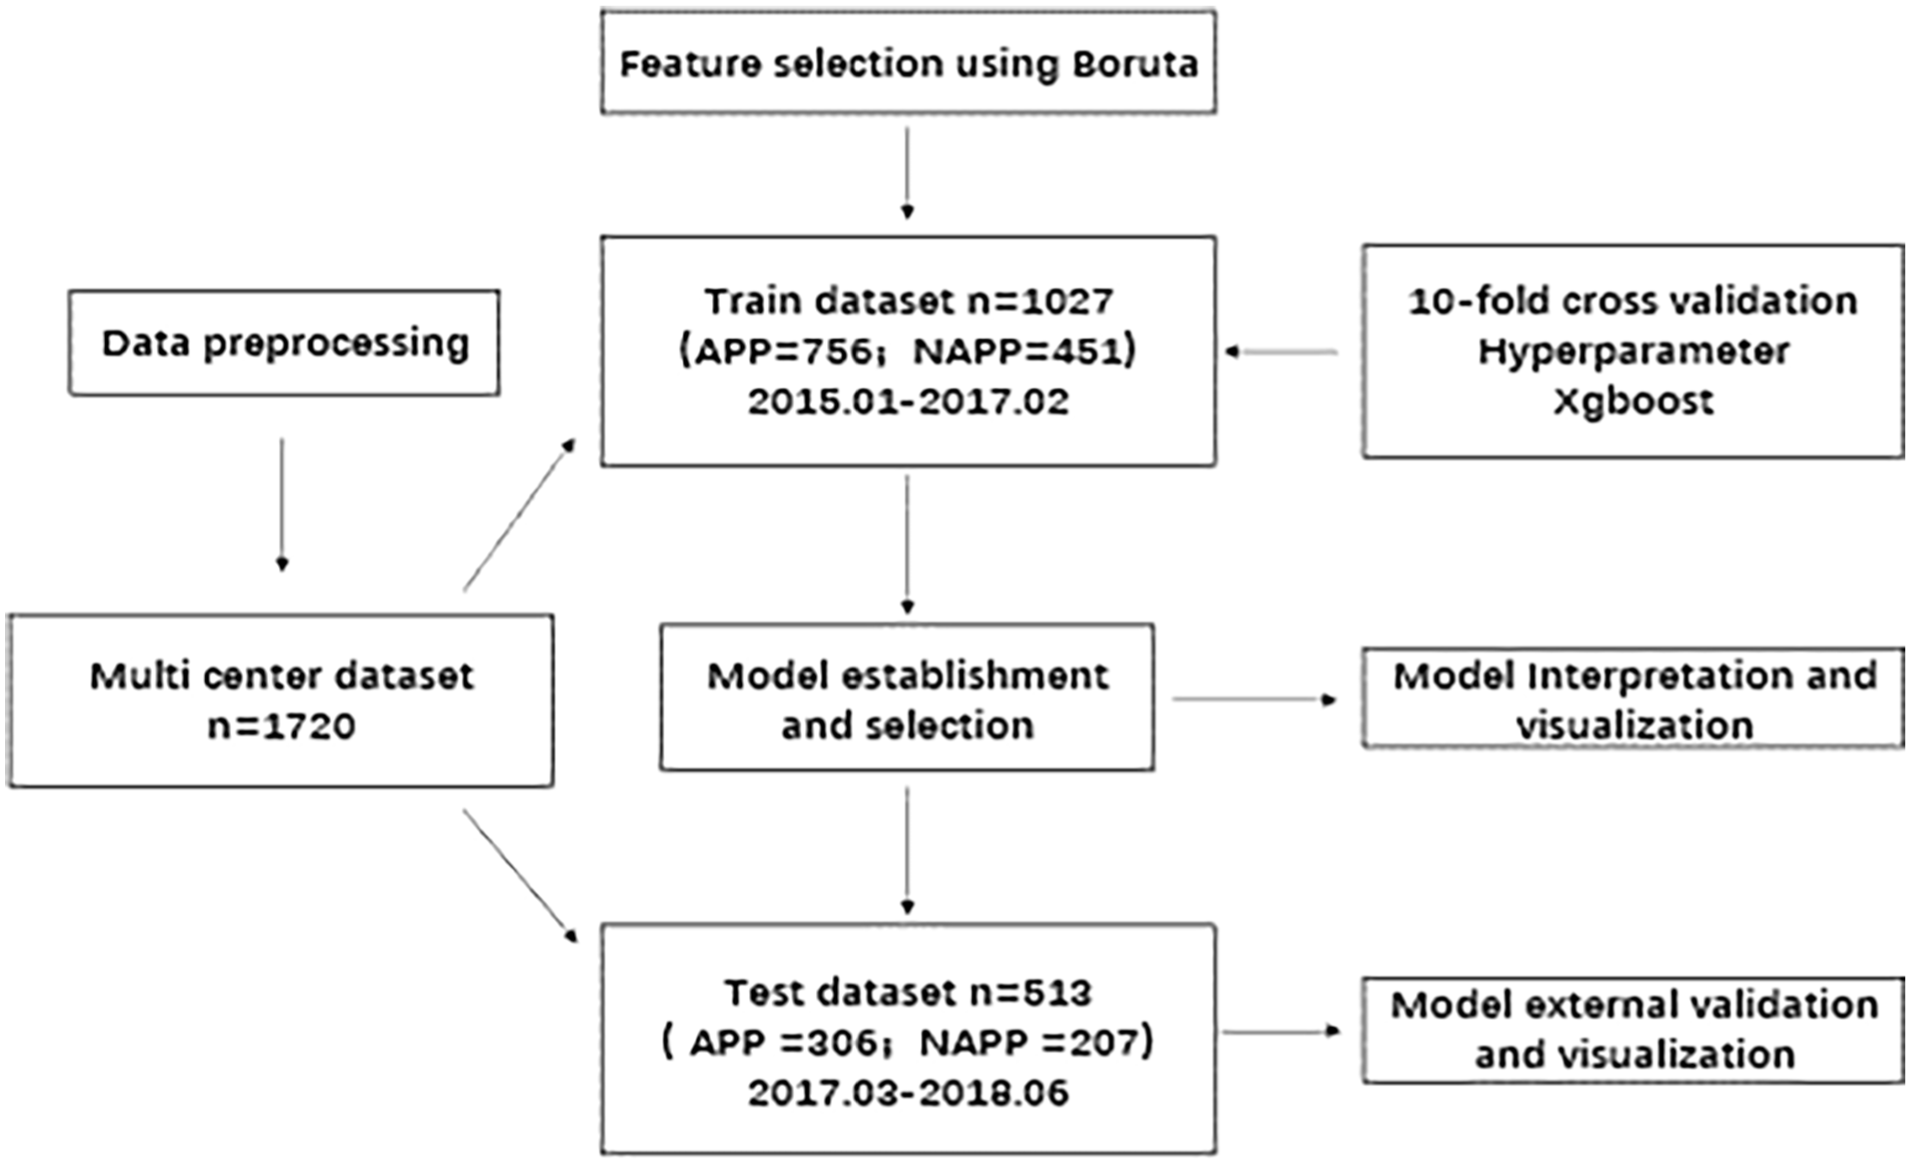
Flowchart.
Feature selection
Using the Boruta function, the key variables associated with acute postoperative pain were identified. These features include Charlson comorbidity score, MMSE, surgery duration, preoperative depression score, smoking status, anesthesia duration, intraoperative average heart rate, lidocaine dose, age, intraoperative morphine dose, grouping, preoperative anxiety score, ropivacaine dose, intraoperative colloid volume, APACHE-II score, postoperative ICU admission, surgical site, and postoperative intubation status (Figure 2).
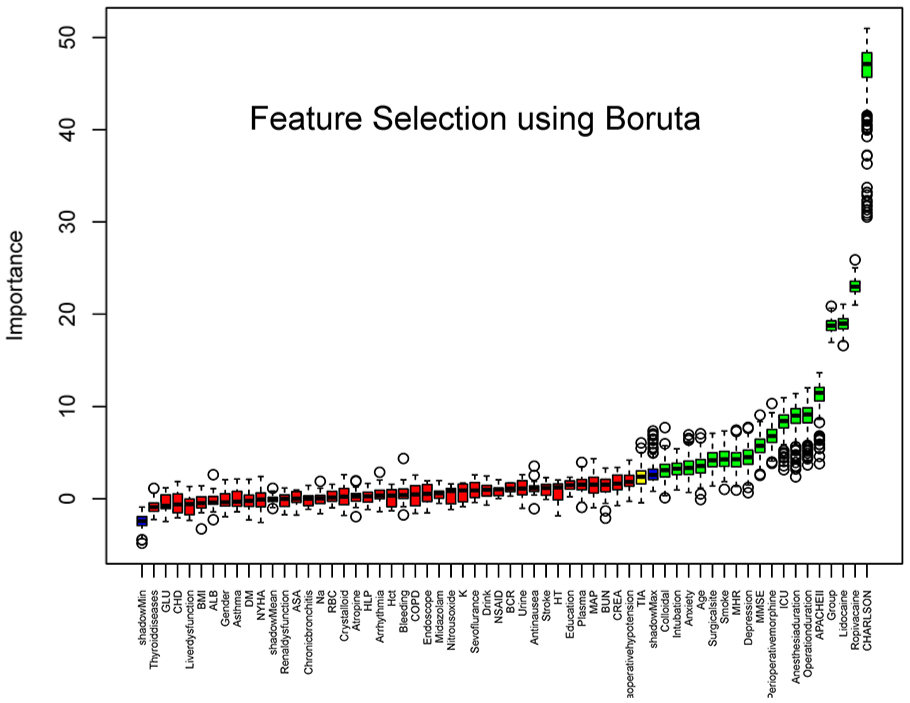
Boruta screening diagram. This figure shows the results after feature selection using Boruta's algorithm, with each feature variable on the horizontal axis and its importance score on the vertical axis. The green boxes indicate the selected important feature variables, the red boxes indicate unimportant features, and the blue boxes are random controls.
Hyperparameter Tuning
The optimal parameters for XGBoost were determined as follows: nrounds = 5, eta = 0.508793, and max_depth = 5. The hyperparameter tuning process is shown in Figure 3.
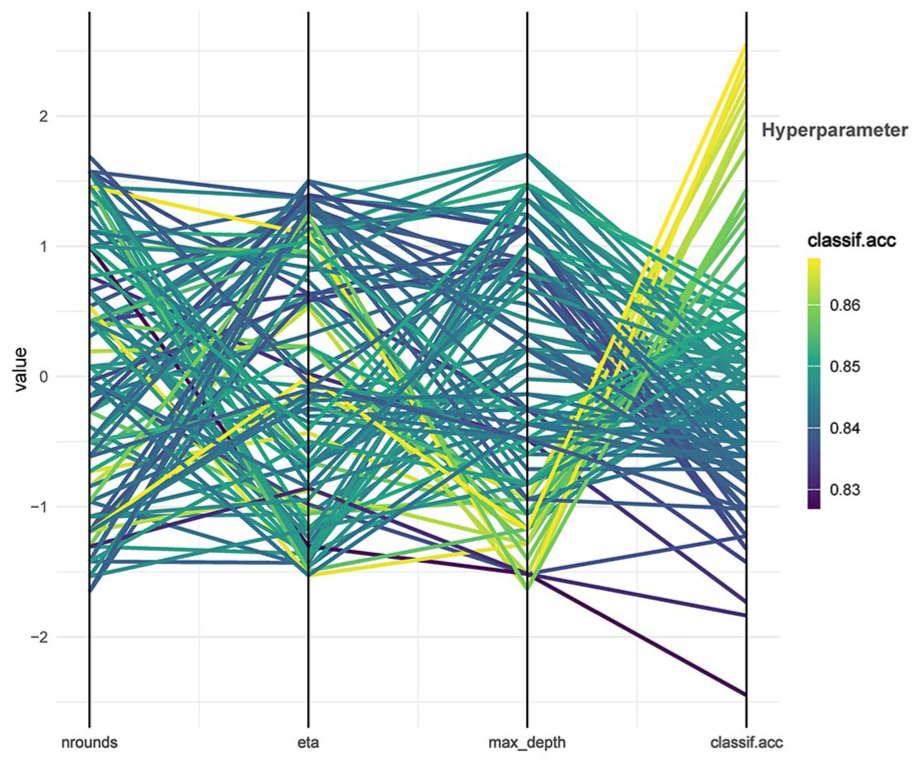
Hyperparameter tuning graph.
Confusion matrix parameters for the test and validation sets
The confusion matrix parameters for acute postoperative pain in both the test and validation sets were as follows: Accuracy (ACC): 0.921 (test set) and 0.871 (validation set). AUC-ROC: 0.964 (test set) and 0.920 (validation set). AUC-PRC: 0.983 (test set) and 0.959 (validation set). Brier score: 0.067 (test set) and 0.098 (validation set). Matthews Correlation Coefficient (MCC): 0.847 (test set) and 0.746 (validation set).
ROC, PRC, calibration curve, and DCA for the test set
The ability of the model to discriminate between categories is shown using the receiver operating characteristic (ROC) curve (Figure 4(a)), with an AUC-ROC score of 0.9198. the precision-recall curve (PRC) reflects the trade-off between precision and recall (Figure 4(b)). The AUC-PRC score is 0.9585. The calibration curve shows that the predicted probabilities calibrate well with the actual results (Figure 4(c)). The DCA plot shows that the XGBoost model delivers high net benefits in the 20%–70% threshold range, which is suitable for decision making on whether to intervene in this range (Figure 4(d)).

ROC, PRC, calibration curve and DCA for the test set: Figure (a) shows the ROC curve, demonstrating the relationship between sensitivity and specificity of the model. Figure (b) shows the PRC curve, demonstrating the trade-off between precision and recall of the model. Figure (c) is the calibration curve showing the fit between the model's predicted probability and the actual incidence. Figure (d) shows the Decision Curve Analysis (DCA), which evaluates the net gain of the model for different threshold probabilities.
Feature importance and partial dependence plots
Feature importance rankings for acute postoperative pain were created using the XGBoost model (Figure 5), along with partial dependence plots (Figure 6). The importance rankings provide a clear visualization of each feature’s contribution to the prediction of acute postoperative pain. The partial dependence plots illustrate the relationship between individual features and the risk of acute postoperative pain, showing how the likelihood of pain changes with different feature values.

Characterization variable ranking chart.
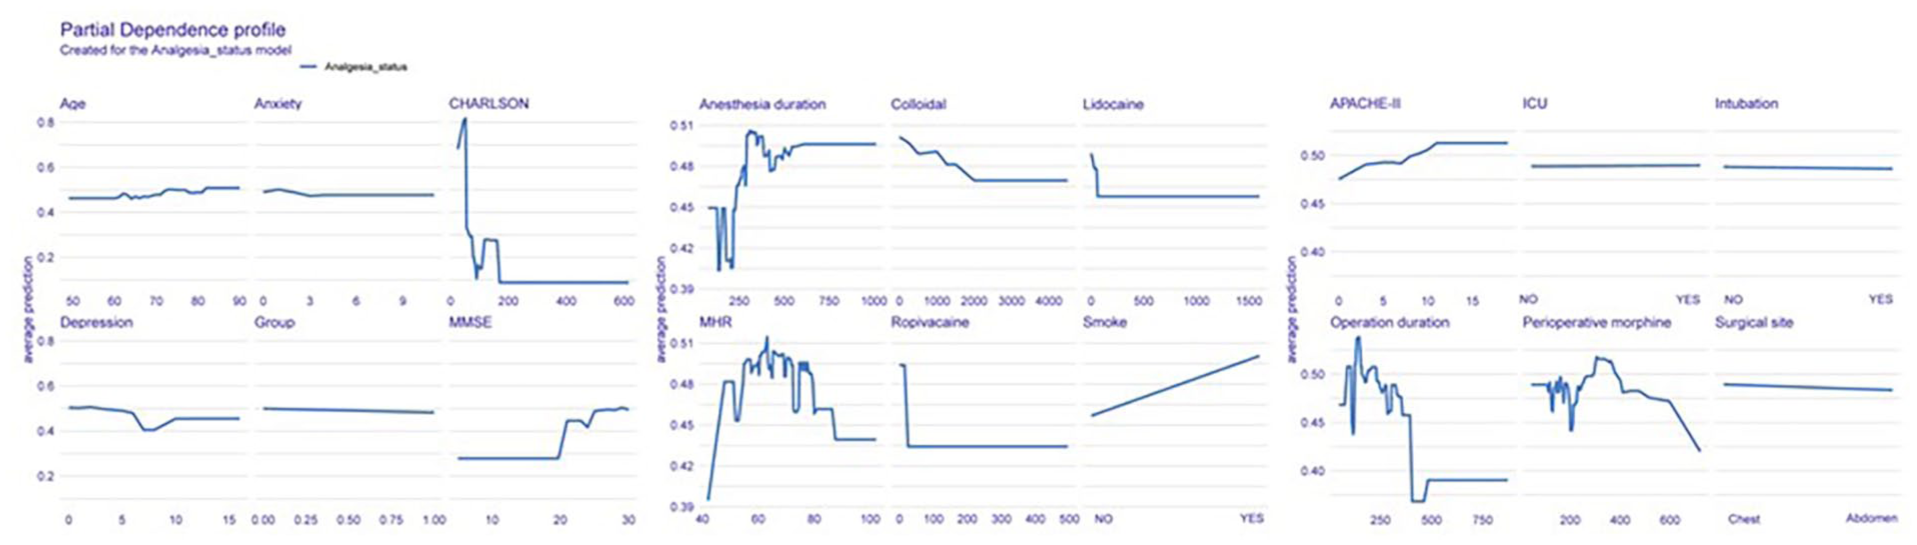
Univariate partial dependence plot.
Feature importance and bias plots
Feature importance rankings (Figure 5) as well as partial dependency plots (Figure 6) were created for acute postoperative pain using the XGBoost model. The importance rankings clearly show the contribution of each feature to predicting acute postoperative pain. The partial dependency plot illustrates the relationship between each feature and the risk of acute postoperative pain, showing how the likelihood of pain varies with different feature values.
Decomposition prediction plot
The decomposition prediction plot shows how each feature contributed to the prediction for a single sample. For this sample, the XGBoost model predicted an acute postoperative pain probability of 0.994, which was higher than the decision threshold of 0.487. The model correctly predicted that the patient would experience acute postoperative pain, which was confirmed (Figure 7). The red and blue bars represent the positive and negative contributions of each variable to the prediction, with the final prediction value being the sum of all feature contributions.

Decomposition prediction map.
Discussion
In this study, we counted baseline population characteristics, laboratory data, intraoperative and postoperative data to develop a model and screened 18 characteristic variables by Boruta function to identify risk factors for postoperative acute pain in elderly noncardiac surgery patients. These key variables may help clinical practitioners to provide personalized surgical plans and anesthetic preparations in the perioperative period to minimize the probability of patients experiencing acute postoperative pain. The ROC curves, and calibration curves obtained for these variables in the test set turned out to be better.
Ranking these variables in the XGBoost model revealed that the CHARLSON score contributed more to acute postoperative pain in both the ranked and decomposed prediction plots of the characteristic variables. The Charlson Comorbidity Index scoring criteria involves a comprehensive assessment of the patient's 19 disorders. In one study, the highest quartile of Charlson scores (5–11) was found to result in patients using more postoperative opioid analgesics, and higher Charlson scores have also been reported to be associated with postoperative pain. 24 In a study by et al. it was confirmed that Charlson scores were associated with continued opioid use for 90 days after minor and major surgery. 12 These reports are consistent with our study, and it is worth noting that we excluded patients suffering from severe cardiac insufficiency, severe hepatic insufficiency, or renal failure at the beginning of the study, which may have some impact on the Charlson score.
MMSE score is another important predictor of postoperative delirium, which was mentioned in a previous study that postoperative delirium was associated with patients’ pain,25,26 which is consistent with our findings. In the report by Liu et al. 27 suggests that for every 1-point increase in pain score, the risk of developing postoperative delirium is elevated by 2.421 times. It is worth mentioning that CHARLSON score was independently associated with postoperative delirium,28,29 and in our study, both scale scores were significant predictors of postoperative pain, which implies that further studies can be conducted to more accurately predict the incidence and severity of postoperative pain that may occur in patients before surgery by weighting the two scales.
This study uses the mlr3 ecosystem and its extension package, which provides a unified interface to access various learning algorithms, data preprocessing steps, and performance evaluation methods. The goal of designing this package is to simplify the process of training, predicting, and evaluating machine learning models while maintaining a high degree of flexibility and scalability. In machine learning, feature selection is a crucial step that aims to select the most representative and informative features from the original dataset to improve the performance of the model and reduce computational costs. The Boruta algorithm is a Random Forest-based feature selection method that features automated feature selection without the need to manually tweak the parameters or select a specific subset of features, which helps to reduce the need for manual intervention; it can identify features that are fully correlated with the target variable, which may contribute significantly to the predictive model and help to provide a more comprehensive understanding of the important information in the feature set; compared with traditional feature selection methods, Boruta algorithm can effectively handle large-scale datasets by using random forests and self-service resampling techniques and maintains the ability to generalize, thus avoiding the overfitting problem.
The use of cross-validation and hyper-parameter tuning in the process of model building can significantly improve the stability and predictive ability of the model, e.g., cross-validation can provide a more reliable assessment of the model performance, reduce overfitting, and effectively utilize the data. Meanwhile hyperparameter tuning also has outstanding contributions in improving model performance, accelerating convergence, and enhancing generalization ability. In the external validation process, the confusion matrix of the classification model and its parameters are validated and computed using time periods to verify the robustness and extrapolation of the model. Visualization and interpretation of machine learning models is an important tool for understanding and evaluating model performance. Visualization provides an intuitive understanding of the structure, performance, and feature importance of the model; interpretation provides insight into the internal working mechanism of the model and provides strong support for model optimization and decision making. The performance index of the predictive model is visualized using confusion matrix parameters, while the feature importance of the predictive model is visualized through feature variable ordering diagrams, biased dependency diagrams and decomposition prediction diagrams, and the internal operating mechanism of machine learning is explained by applying both mathematics and visualization.
Limitations
Limitations of this study may have influenced the results. Firstly, this study was only aimed at establishing a risk prediction model for postoperative pain in elderly patients undergoing non-cardiac thoracic and abdominal surgery and the model is not generalizable. Secondly, this study used time series segmentation to achieve external validation, and an independent dataset is needed to test the extrapolation of the model in the future. Finally, we did not perform a comparison of multimodal bouts and different bouts in this paper because these were not counted, which may be a limitation of our study.
Conclusion
This study used machine learning algorithms to predict the probability of occurrence of acute postoperative pain in 1720 elderly patients undergoing non-cardiac thoracic and abdominal surgery under general anesthesia, identified important characteristic variables, and developed a predictive model for the occurrence of acute postoperative pain with acceptable generalization ability.
Footnotes
Declaration of conflicting interests
The authors declared no potential conflicts of interest with respect to the research, authorship, and/or publication of this article.
Funding
The authors received no financial support for the research, authorship, and/or publication of this article.