
Abstract
It has been widely recognized that electroacupuncture (EA) inducing the release of β-endorphin represents a crucial mechanism of EA analgesia. The arcuate nucleus (ARC) in the hypothalamus is a vital component of the endogenous opioid peptide system. Serving as an integration center, the periaqueductal gray (PAG) receives neural fiber projections from the frontal cortex, insular cortex, and ARC. However, the specific mechanisms how EA facilitates the release of β-endorphin within the ARC, eliciting analgesic effects are yet to be elucidated. In this study, we conducted in vivo and in vitro experiments by transcriptomics, microdialysis, photogenetics, chemical genetics, and calcium imaging, combined with transgenic animals. Firstly, we detected 2 Hz EA at the Zusanli (ST36) increased the level of β-endorphin and transcriptional level of proopiomelanocortin (POMC). Our transcriptomics profiling demonstrated that 2 Hz EA at the ST36 modulates the expression of c-Fos and Jun B in ARC brain nuclear cluster, and the transcriptional regulation of 2 Hz EA mainly occur in POMC neurons by Immunofluorescence staining verification. Meaning while, 2 Hz EA specifically activated the cAMP-PKA-CREB signaling pathway in ARC which mediating the c-Fos and Jun B transcription, and 2 Hz EA analgesia is dependent on the activation of cAMP-PKA-CREB signaling pathway in ARC. In order to investigate how the β-endorphin produced in ARC transfer to integration center PAG, transneuronal tracing technology was used to observe the 2 Hz EA promoted the neural projection from ARC to PAG compared to 100 Hz EA and sham mice. Inhibited PAGGABA neurons, the transfer of β-endorphin from the ARC nucleus to the PAG nucleus through the ARCPOMC-PAGGABA neural circuit. Furthermore, by manipulating the excitability of POMC neurons from ARCPOMC to PAGGABA using inhibitory chemogenetics and optogenetics, we found that this inhibition significantly reduced transfer of β-endorphin from the ARC nucleus to the PAG nucleus and the effectiveness of 2 Hz EA analgesia in neurological POMC cyclization recombination enzyme (Cre) mice and C57BL/6J mice, which indicates that the transfer of β-endorphin depends on the activation of POMC neurons prefect from ARCPOMC to PAGGABA. These findings contribute to our understanding of the neural circuitry underlying the EA pain-relieving effects and maybe provide valuable insights for optimizing EA stimulation parameters in clinical pain treatment using the in vivo dynamic visual investigating the central analgesic mechanism.
Introduction
A substantial body of research on EA has demonstrated its distinct ability to alleviate acute and chronic pain in various scenarios,1,2 encompassing localized neuropathic pain. 3 Acupuncture at the Zusanli (ST36) is commonly used as a therapeutic technique to alleviate pain.4,5 Based on the basic theory of Chinese Medicine, the ST36 is widely used to treat issues related to the spleen and stomach, as well as to regulate the Qi and Blood, and alleviate phlegm and promote resuscitation. 6 Extensive research has demonstrated that the application of acupuncture on ST36 is effective in alleviating pain through the regulation of neurotransmitters within the central nervous system.7,8
Various brain regions are associated with pain information processing. 9 However, the mechanisms of neural circuit formation and the specific contribution of these nuclei to EA analgesia are still unclear.
The release of β-endorphin, which is the most abundant endogenous opioid in the brain and widely distributed in the hypothalamus, is primarily promoted by low-frequency EA at ST36 to exert its antinociceptive effect. 10 β-endorphin is the most abundant endogenous opioid in the brain and is widely distributed in many brain regions such as hypothalamus, thalamus, etc. The bodies and fibers of neurons containing β-endorphin mainly exist in the ARC, and only a small amount β-endorphin neurons are available in nucleus tractus solitarius (NTS). 11 The PAG serves as an analgesia integration center, receives neural fiber projections from the frontal cortex, insular cortex, and olfactory cortex of the brain, and establishes extensive neural connections with other nucleus such as the dorsal hypothalamic nucleus, ventral nucleus, and prethalamic nucleus. The β-endorphin pro-peptide is synthesized by cleaving the pro-opiomelanocortin (POMC) mRNA, which is expressed in the ARC nucleus, including the paraventricular and prethalamic nuclei. 12
The effect of exogenous opioids on inflammatory pain relief is attributed to the activation of μ-opioid receptors specifically in Vglut2 + glutamatergic neurons rather than GABAergic neurons, according to a report. In contrast, the analgesic effects of endogenous opioids are primarily mediated by μ opioid receptors (MOR) in GABAergic neurons, rather than Vglut2 + glutamatergic neurons, according to a study. 13 MORs are the primary GPCRs associated with analgesia and can be activated by β-endorphin to relieve pain. Furthermore, when MOR is activated, phosphorylation of extracellular signal-regulated kinase (ERK) increases, which causes neuronal excitability to be inhibited as it hyperpolarizes the neurons and inhibits their firing. 14
The mechanism through which EA modulates the transfer of β-endorphin from the ARC to the PAG, thereby exerting its antinociceptive effects, remains elusive and requires further investigation. Moreover, chronic constriction injury (CCI) is a severe type of chronic pain, which are often used animal model in fundamental research, with the pain response enduring for approximately 2 months.15,16 In some studies, the antinociceptive effect of EA has also been explored in CCI, and ST36 is one of most commonly used acupoints in acupuncture treatment. 17 This study aims to explore how 2 Hz EA treatment at ST36 influences the activity of the ARCPOMC-PAGGABA neural circuit and what it is underlying mechanisms increasing the transfer of β-endorphin from the ARC to the PAG, an important mechanism in the body and that β-endorphin inhibits PAGGABA neurons by binding to opioid receptor to increase the pain threshold.
Materials and methods
Animals
Male C57BL/6J mice were obtained from Charles River Co.China Beijing Co., Ltd. A genetically modified strain of mice, known as POMC-Cre mice, were acquired from Saiye Biotechnology Co.Suzhou Co., Ltd, China. The mice used in the experiments were provided with food and water and were within the age range of 8 weeks, weighing between 18 and 22 g. All experiments were conducted during daylight hours. All experimental procedures have been granted approval animal ethics by the Animal Ethics Committee of Nanjing University of Traditional Chinese Medicine (Number: 201911A023).
Surgery
Sodium pentobarbital (40-50 mg/kg, i.p.) was administered to anesthetize the mice, after which they were secured in a stereotaxic frame for neurosurgical procedures. The skin of the right lower limb was cut open, the muscle was carefully cut through, and the common sciatic nerve was revealed. Then, three secure knots were tied using a 6-0 wire at intervals of around 1 mm. After disinfecting the wound using a saline solution, the medical professional administered erythromycin ointment and then proceeded to close the incision with sutures. After 3 days of the surgical procedure, penicillin shots of 40,000 units were administered to each mouse on a daily basis as a preventive measure against infection.
Electroacupuncture (EA)
EA is a form of acupuncture that involves passing a small electric current through acupuncture needles to stimulate specific points on the body. In this study, these experimental mice, were put under anesthesia using 3% isoflurane (RWD, Shenzhen) Making inductors, and the anesthesia was sustained throughout EA stimulation using 1.5% isoflurane. An acupuncture needle with a dimension of 0.1 × 13 mm was gently inserted at a depth of 3-4 mm into ST36, which is situated 4-mm down from the knee joint and about 2-mm lateral to the anterior tubercle of the tibia. Electrical currents, with frequencies of either 2 Hz or 100 Hz and an intensity of 2.0 mA. The participants were given with Han’s Acupoint Nerve Stimulator (HANS-200A, Beijing), a device that stimulates the nerves of specific acupoints. EA conducted a 30 min stimulation period, encompassing both real and sham procedures. However, an acupuncture needle was substituted for a non-electrical wooden toothpick as a cotntrol.
Behavioral tests
Tail-flick test
Used for tail flip testing noxious radiant heat was administered to the tail of an animal that was gently held in place with the use of a thermal stimulator (Kaiji Biotechnology Co. LTD, Nanjing). The temperature of the heat stimulus rose steadily from the initial temperature to the maximum temperature. The power of the light was 30W, in accordance with the thermal stimulus.The latency to the tail withdrawal was measured. To prevent harm to the tissue, tail-flick response limits within 10s. The experiment involves determining the latency, or delay, in the tail withdrawal response of the mice. This latency is calculated by finding the average latency from three separate trials. Prior to the application of EA, the mean latency to tail withdrawal of each mouse was determined by calculating the average latency from three consecutive trials in the event that a tail-flick response did not happen within a 10s timeframe. The baseline pain thresholds of the mice were measured, and to account for individual variances, the tail-flick latencies were converted into a percentage of the maximum possible effect (%MPE), which can be calculated as: %MPE = 100× (latencyafter EA−latencybaseline)/(10sec–latencybaseline).
Hot-plate test
Pain thresholds were also assessed by using a hot plate device (Kaiji Biotechnology Co. LTD, Nanjing). The instrument temperature was regulated to precisely 55°C with a tolerance of 0.5°. Once the apparatus had achieved a consistent temperature, the experiment commenced. The researchers placed the mice in an enclosed transparent container with a completely flat base and measured the time taken by each individual mouse to respond by retracting or licking its hind paw. The paw withdrawal latency (PWL) is an experimental measurement. To prevent harm to the biological tissue, the maximum duration for PWL was set at 60 s. Prior to performing EA experiment, the mice were given time to adapt to the test chamber. The pain threshold of each mouse was measured at baseline, and the calculation of nociception at different time points was done using the equation: %MPE = 100×(latencyafter EA−latencybaseline)/(60sec–latencybaseline).
Drug injection
β-funaltrexamine (β-FNA) injection
β-FNA (Cat. No. 0926, Tocris) was prepared by dissolving it in sterile 0.9% NaCl solution (Normal Saline, NS) with a concentration of 7.5 mg/mL18,19 and was administered through injections into specific points in the body, including the Zusanli point (ST36), the spinal cord, and the ventricle. This was done prior to subjecting the participants to a treatment called 2 Hz EA. For the control group, an equivalent amount of saline solution was injected.
Forskolin and H-89 injection
The mice were sedated using isoflurane and positioned in a stereotactic head frame. A surgical procedure was conducted to create openings above the ARC region of the brain, and then a specific instrument (RWD, Shenzhen) was inserted into the ARC of each mouse (coordinates relative to bregma: AP, −1.4 mm; ML, ±0.3 mm; DV, −5.8 mm). Following the procedure, the mice were given a week to recuperate before further experiments were carried out. The mice in the control group were given a sham injection to minimize the impact of mechanical stimulation caused by the injection and to familiarize them with the microinjection process. Forskolin (S1612, Beyotime, Nanjing) and H-89 (HY-15,979A, MCE) were delivered via an injection cannula using a syringe that extended 2 mm past the tip of the guide cannula. The guide cannula was inserted with a syringe, but no medication was given. Medications were injected in a small amount and at a slow rate while the mouse was gently held. The injection tube was left in for an extra 30 s to prevent the drug from flowing back. To serve as a comparison, saline was injected using the same procedure. Following the injection, EA was promptly started.
siRNA injection
siRNA was injected into the ARC as described above. The sequences of the full-length Fos and Jun B genes were obtained from GenBank. Six recombinant adenovirus plasmids expressing siRNAs targeting c-Fos or Jun B were designed (Table S1) and synthesized (Tuoran Biotech, Shanghai). It was confirmed that the sequences did not have homology to any other mouse genes, as determined with BLAST tool on the NCBI website. The most suitable siRNA was determined. EA and behavioral tests were performed 1 day after c-Fos and Jun B genes were knockdown after the administration of siRNA.
FITC-β-endorphin injection
FITC-β-endorphin (FITC-YGG FMT SEK SQT PLV TLF KNA IIK NVH KKG Q, Dangang Biotech, Nanjing), a fluorescently labeled peptide, was administered into the ARC using a cannula, 5 min before applying EA. As a control, only FITC without the β-endorphin peptide was injected into the ARC in a similar manner. After 60 min of EA, the entire brain was extracted, and the fluorescence signals of FITC were quantified specifically in the PAG region.
Microdialysis
The mice were put under anesthesia using isoflurane and a microdialysis probe with a CMA/11 membrane diameter (Stockholm, Sweden) of 240 μm. CMA/11. The CMA was implanted perpendicularly into the ARC and the ventral PAG at the AP (−4.8 mm) and ML (±0.4 mm) using cyanoacrylate adhesive (TONSAN 1454). The mice were kept in separate housing for a period of 5 days. The probe was then linked to a microdialysis syringe pump (CMA 402), and artificial cerebral spinal fluid (ACSF) was used as the medium. The pH of the perfusion solution was adjusted to 7.4 and it was delivered at a flow rate of 1 μL/min for 60 min to achieve stabilization. The artificial cerebrospinal fluid (ACSF) used in the perfusion solution including 0.2% bovine serum albumin, 2.5 mM KCl, 125 mM NaCl, 1.26 mM CaCl2, and 1.18 mM MgCl2. Subsequently, samples of mouse cerebral spinal fluid were collected every 30 min for a total of 180 min at a flow rate of 1 μL/min using a refrigerated fraction collector. These samples were stored at −80°C for following analysis.
Virus injection and optical fiber implantation
The mice were made unconscious using isoflurane and their heads were secured in a mouse stereotaxic apparatus (RWD, Shenzhen). A surgical cut was performed on the central area of the body, the layer beneath the skin was pulled back, and the bony structure enclosing the brain was cleared of any debris or impurities. A surgical procedure was done above certain brain areas, namely the ARC and the PAG. The mice were given a specific dose of a virus using a glass pipette at a controlled injection speed. After the injection, a 2 mm diameter object was kept in position for 5–15 min to reduce the reverse flow. The virus was included in supplemental materials (Table S3). After the administration of the virus, optical fiber implantation was promptly conducted for optogenetic stimulation and fiber photometry experiments. A specific type of optical fiber (FT200UMT, Thorlabs) was securely placed inside a ferrule made of ceramic material measuring 230 mm in outer diameter (0.37NA, Fiblaser, Shanghai). The optical fiber was inserted into specific regions of the brain, with the tip positioned at a distance of 0 from the target area.6,20 In order to ensure the optical fiber’s safety, the dental cement was utilized to secure it, while a sleeve served the purpose of protecting it. The mice stayed on the warming mat until they completely regained consciousness and were administered Baytril (10 mg/kg, s.c.) twice a day for 5 days. 21 After a minimum of 3 weeks from the virus injection, all further experiments were conducted to ensure ample time for both transgene expression and animal recuperation.
Fiber photometry
The fluorescence signals are generated by an excitation laser beam of wavelength 488 nm coming from a laser system (OBIS 488LS, Coherent). The dichroic mirror (MD498, Thorlabs) demonstrated coherence through reflection. A lens with a numerical aperture of 0.3 focused light from Thorlabs using a 10x objective lens. The Olympus microscope was connected to a rotary joint using an optical fiber with a diameter (200 mm O.D., NA = 0.37). The fluorescence signals from the excited GCaMP6s were filtered using a bandpass filter (MF525-39, Thorlabs). To prevent the undesirable fading of GCaMP6s probes, the laser power at the tip of the optical fiber was carefully set between 20 and 40 mW. The emitted fluorescence signals from the stimulated GCaMP6s were filtered to only allow signals within a specified frequency range, using a suitable bandpass filter MF525-39 and then amplified into electrical signals (R3896, Thorlabs, Hamamatsu) is used as a booster (C7319, Hamamatsu). After being subjected to a low-pass filter with a cutoff frequency of 40 Hz, the signals underwent additional filtration. To convert analog voltage signals into digital format, a Power 1401 digitizer and Spike2 software (CED, Brownlee 440) were employed, capturing the data at a frequency of 100 Hz. To capture the activities of ARCPOMC and PAGGABA neurons, injecting AAV-hSyn-DIO-GCaMP6s into the ARC of POMC-Cre mice and AAV-MDLX-GCaMP6s into the PAG of C57BL/6J mice allowed us to observe the activity of ARCPOMC neurons activity during EA. Additionally, we recorded PAGGABA neuron activity at 30 min after EA while the mice were exposed to acute thermal pain. As indicated above, we employed the hot plate test.
The MATLAB mat files containing photometry data exported from Spike2 were collected while segmenting every different behavioral data. The calculation for fluorescence change (ΔF/F) was performed using the formula (F-F0)/F0. The fluorescence median value of the baseline is denoted as F0. Permutation tests were employed to determine the statistical significance of the fluorescence changes related to the events.19,22
Chemogenetic manipulation
The POMC-Cre mice underwent a cannula implantation procedure targeting the PAG area. After 3-4 weeks of receiving virus injections, mice were given an intraperitoneal injection of either clozapine N-oxide (CNO, Sigma) or saline through a cannula 30 min prior to undergoing 2 Hz EA. Repressing ARCPOMC neurons that extend to the PAG is being pursued through hM4Di blockade. Baseline thermal sensitivity measurements were taken prior to the administration of CNO or saline, and pain thresholds were recorded before and after the application of 2 Hz EA. The data was collected three times for every individual mouse.
Optogenetic manipulation
Optogenetic manipulation for sensory pain analysis was performed within the timeframe of 3 to 4 weeks following the administration of a viral substance.A fiberoptic cannula (Thorlabs, FT200UMT) was inserted at a depth of 0.1 mm above PAG. After exposing mice to 2 Hz EA, they were placed in individual plexiglass chambers, and given time to acclimate.After the passage of 30 min, mice were subjected to a continuous stimulation of yellow light at a frequency of 589 nm and rates of 2/10/20 Hz, starting 30 s prior to the evaluation of pain and continuing until the conclusion of the testing period. The measurement of thermal latencies was performed on multiple occasions for every individual mouse. Thermal response times were recorded thrice for every single mouse during the experiment. DPSS lasers from Laserglow Technologies, with a power range of 5–15 mW at the fiber tip as measured using the power sensor (S130 C, Thorlabs) were employed in the behavioral tests. 23
Slice electrophysiology
The use of slice electrophysiology in studying the electrical properties of cardiac tissue provides valuable insights into the mechanisms underlying various heart conditions. In this study, cellular recordings were collected from two specific types of neurons, ARCPOMC neurons and PAGGABA neurons, in freshly prepared brain slices from POMC-Cre mice. These mice were previously injected with two distinct types of viral vectors, AAV-EF1a-DIO-ChR2-mCherry in the ARC region and AAV-MDLX-EYFP in the PAG region. Based on previous studies,24,25 established techniques were employed for conducting electrophysiological recordings in the PAG region. The fluorescence and other electrophysiological characteristics were used to identify the ARCPOMC neurons and PAGGABA neurons.PAGGABA neurons were recorded using a MultiClamp 700B amplifier and Digidata 1440A interface (Molecular Devices) with whole-cell voltage-clamp techniques.Throughout the experiments, the monitoring of series resistance was conducted.
Blue light was supplied to each slice for optogenetic activation through a 200 mm optical fiber connected to a 470 nm LED light source (Thorlabs, USA). The effectiveness of the ChR2-expressing virus was confirmed by quantifying the quantity of action potentials generated in ARCPOMC neurons through blue light stimulation (2 ms, 20 Hz, 2.The ChR2 in PAG slices mediates both the outward photocurrents (7 mW) and the inward photocurrents (2 ms pulse). All the information was filtered at a frequency of 2 Hz, digitally recorded at a frequency of 10 Hz, and gathered utilizing pClamp10 software, which is developed by Molecular Devices. Clampfit 10 was utilized for the analysis.
High-performance liquid chromatography (HPLC)
In this experiment, 10 μL microdialysate volume contains 5 μL of o-phthaldialdehyde (OPA) solution. The OPA solution contained 20 mg of OPA, 0.5 mL of 1M Na2O3S, and 10 mL of 0.2 M Na2B4O7. This mixture underwent precolumn derivation for 30 min at a temperature of 25°C. The isocratic elution mobile phase (with a pH of 5.3) was composed of 100 mM NaH2PO4, 20% methanol, 3% acetonitrile, and 0.1 mM Na2EDTA. It was then passed through an HR-80, 3 μm HPLC analytical column from ESA (Chelmsford, MA). The mobile phase was pumped using a 510 Pump. The sample was analyzed with 0.6 mL/min. Detection of all substances was done using a Coulochem II detector (ESA), which consisted of a 5020-guard cell and a 5011 analytic cell (ESA). The guard cell had a working potential of 720 mV, while the analytic cell had working potentials of 220 mV (E1) and 590 mV (E2). To confirm the identity of peaks, samples were concurrently analyzed alongside known standards.
Sample preparation, RNA library construction, and mRNA sequencing
30 min after EA, amice ARC samples were lollected and stored at −80°C until they were extracted RNA using TRIzol (invitrogen, Carlsbad). Ribosomal RNA from each total RNA sample was eliminated using an rRNA remover kit (Illumina, San Diego). RNA sequencing library preparation was performed using the Illumina platform. After generating the clusters, the sequencing of the libraries was performed using an Illumina HiSeq platform. The generation of paired-end reads occurred. In genomics, paired-end sequencing is a technique used to sequence both ends of DNA fragments, providing valuable information on genome structure and variations.
Quantitative polymerase chain reaction (qPCR)
The RNA extraction process was performed, and subsequently, cDNA was synthesized following the guidelines (Toyobo, Japan), employing a reverse transcription kit (SuperScript IV, Thermo Fisher Scientific). qPCR kits (Takara, Japan) were employed to measure the expression levels of mRNAs. The experiment involved a reaction volume of 20 μL. The reaction process consisted of an initial step of heating at 95°C for 10 min, followed by 40 cycles of a 5 s heating period at 95°C. At 60°C for 30 s, the primers’ sense and antisense details can be found in the supplemental materials (Table S2), and G3PDH was used as a control. The relative expression level was determined using the 2−ΔΔCt method after incubating for 30 s at 72°C.
Western blot (WB) analysis
Tissues were homogenized in lysis buffer (50 mM Tris-HCl.PH7.4, 150 mM NaCl, Sodium deoxycholate 1%, 0.1% SDS, 1 mM PMSF, 1 mM NaVO3, 1 mM NaF, 1 mM EDTA). After homogenization, a protease inhibitor cocktail (1×) and a phosphatase inhibitor (1×) was added in samples. The lysates were subjected to centrifugation at a speed of 10,000 revolutions per minute for a duration of 10 min. Using BCA methods test the protein concentrations. A sample containing 30 µg of protein was loaded onto a 10% SDS-polyacrylamide gel for electrophoresis. Afterward, the samples were transferred to PVDF membranes and then blocked with a 5% BSA solution in TBST, which is a 10 mM Tris-HCl solution, 150 mM NaCl and 1% Tween-20. Then the membranes incubated at room temperature for 1 h. Finally, the membranes were left overnight at 4°C with primary antibodies. The specific primary antibodies used in this study were rabbit phospho-PKA antibody (1:1000, #5661), rabbit PKA antibody (1:1000, #5842), rabbit phospho-CREB antibody (1:1000, #9198), rabbit CREB antibody (1:1000, #9197), rabbit phospho-ERK antibody (1:1000, #4370), rabbit ERK antibody (1:1000, #4695). The sample membranes were cleansed three times in TBST solution for a duration of 10 min per wash, followed by exposure to an HRP-conjugated antibody specific to rabbit IgG (1:10,000, #7074). Above all antibody were purchased from Cell Signaling Technology. Following three washes with TBST, the ECL kit (HY-K1005, MCE) was employed to detect the bands.The density of each band was quantified using ImageJ software (NIH), a program commonly used for analyzing images.
Enzyme-linked immunosorbent assay (ELISA)
The concentration of cAMP (MM-0544M1) and β-endorphin (RQ-P-M0065) in the ARC and PAG regions was assessed using ELISA kits specific to mice. Two kits were purchased from Meilian Biotech (Nanjing, China). The measurement of concentration relied on the absorbance reading at 450 nm.
Histology and fluorescent immunostaining
Mice were administered isoflurane for anesthesia and subjected to transcranial cold perfusion using 0.1 M phosphate buffer. Mice brains were fixed, and then cryoprotected in ice cold 4% paraformaldehyde and 30% sucrose. Frozen brains were embedded in OCT and sliced into 40 μM sections using a cryostat (CM3050, Leica). After being rinsed three times in TBS, the unattached segments of the entire brain were then treated with a 1% BSA solution in Triton-TBS (TBS containing 0.25% Triton X-100) for 1 hour. The primary antibodies, including rabbit c-Fos antibody (1:100, #2250), rabbit Jun B antibody (1:100, 10,486-1-AP), and mouse POMC antibody (1:100, 66,358-1-Ig), were incubated overnight at 4°C in the respective sections. c-Fos antibody was purchased from Cell Signaling Technology. Jun B antibody and POMC antibody were bought from Proteintech. Following this, the sections were washed in 1% BSA in TTBS and treated with suitable secondary antibodies. Finally, the sections were mounted using DAPI Fluoromount-G (Southern Biotech).
Imaging and quantification
Confocal microscopy imaging of the samples was conducted with the LSM780 system manufactured by Zeiss. Subsequently, the acquired images were subjected to processing and analysis through the utilization of ImageJ software, which is developed by the National Institutes of Health. This comprehensive procedure encompassed the quantification of c-Fos and Jun B level, as well as the analysis of viral expression.The images had their background subtracted. Averages were obtained from 3 to 5 brain slices in each mouse. Colocalization analysis was conducted to determine the count of cells coexpressing Retrobead, DAPI, c-Fos, and POMC. The ‘analyze particles’ feature in each channel was utilized for quantifying Jun B and POMC. The ‘analyze particles’ feature in each channel was utilized for quantifying Jun B and POMC. After tallying the number of particles in each area of focus, compute the overlap among them. Before conducting behavior testing, we ensured photometry validation by verifying that the levels of the GCaMP6s signal in all animals changed independently of the autofluorescence channel. After conducting behavioral experiments on mice, transcranial perfusion was performed on mice that had completed the testing. The collected slices were then analyzed to determine the spread of virally infected cells in the anterior-posterior axis. The EVOS FL Imaging System (Thermo Fisher Scientific) was utilized for the acquisition of images. By utilizing the GIMP software, templates were employed to outline regions displaying fluorescent signals. Mice that could not have their viral expression validated or were subjected to equipment failure during behavioral testing were not taken into account during the analysis.
Statistics
The data underwent analysis using GraphPad Instat v.3.0, GraphPad Prism Version 7.0, Synaptosoft, utilizes the capabilities of the Axon pClamp software v.10.3 for data analysis and processing. The mean ± SEM values were determined using ImageJ and MATLAB software. To analyze the action potential data, the Mini Analysis Program (Synaptosoft) and Clampfit software (Molecular Devices) were utilized. Statistical analysis was performed using either paired or unpaired Studentst test or one-way analysis of variance (ANOVA). Employing the Newman-Keuls multiple comparison test afterwards, which is a statistical method, was employed for analyzing the electrophysiological data. The statistical tests employed included one-way or two-way ANOVA with Bonferroni’s post-hoc correction or Tukey’s multiple comparison test, as well as two-tailed paired t-tests. Paired or unpaired, Studentst test is used for immunofluorescence analysis. Statistics was performed by utilizing either one-way ANOVA with Bonferroni’s post-hoc correction or unpaired Student's t-tests, with statistical significance considered at p < .05.
Results
2 Hz EA significantly increased the pain threshold of mice
Firstly, we observed changes in pain threshold within 3 h after EA using three clinical different frequencies stimulation by the tail-flick and hot plate tests (Figure 1(a)). We found that the antinociceptive effect of 2 Hz EA was better than 100 Hz EA and sham stimulation at 30 and 60min, as indicated by a substantial increase in withdrawal latency to heat (Figure 1(c)). According to previous studies, an increase of β-endorphin was involved in the primary mechanism of the pain threshold increase induced by low-frequency EA stimulation,
10
but it was unclear where β-endorphin exerts its antinociceptive effect mainly. We injected β-FNA into the “Zusanli point” (ST36) (Figure 1(f)), spinal cord (Figure 1(h)), and ventricle (Figure 1(d)) individually before 2 Hz EA stimulation. Compared to saline injection, injection of β-FNA into the ventricle reduced the antinociceptive effects of 2 Hz EA at 30 and 60min (Figure 1(e)); however, there was no significant difference in withdrawal latency to heat after 2 Hz EA stimulation after injection of β-FNA and saline into the ST36 (Figure 1(g)) or spinal cord (Figure 1(i)). These observations indicate that 2 Hz EA perform the analgesic effect based on β-endorphin mainly via brain central nucleus, rather than spinal cord and periphery tissue. The ARC is the main brain neural nucleus producing β-endorphin. 2 Hz EA produced a better antinociceptive effect than 100 Hz EA via β-endorphin in the brain. (a) Schematic of the pain threshold tests after EA. (b) The location of EA at Zusanli point (ST36) in mice. (c) The % MPE of EA at different frequencies in tail-flick test (left) and hotplate test (right). (**p < .01 and ***p < .001, two‐way ANOVA, Tukey test compared to the sham group at the corresponding time point; #p < .05, two‐way ANOVA, Tukey test compared to the 2 Hz EA group at the corresponding time point; n = 6-8). (d) β-FNA or saline was injected into the ventricle of each mouse 15 min before 2 Hz EA. (e) The % MPE of 2 Hz EA that received β-FNA and saline injection into the ventricle. (*p < .05, **p < .01 and ***p < .001, two‐way ANOVA, Bonferroni test compared to the saline injection group at the corresponding time point; n = 8). (f) β-FNA or saline was injected into the Zusanli point (ST36) of each mouse 30 min before 2 Hz EA. (g) There was no significant difference in the % MPE of 2 Hz EA that received β-FNA and saline injection into the ST36. (h) β-FNA or saline was injected into the spinal cord of each mouse 30min before 2 Hz EA. (i) There was no significant difference in the % MPE of 2 Hz EA that received β-FNA and saline injection into the spinal cord. The data in the graphs are the mean ± SEM.
2 Hz EA upregulated c-Fos and Jun B expression and activated cAMP-PKA-CREB signaling pathway in the ARC likely contribute to the activation of ARCPOMC neurons
Then we tested the concentration of β-endorphin in the ARC after EA at different frequencies, the data presents that the β-endorphin level in the ARC was obviously increased at 30 and 60min after 2 Hz EA, and the concentration of β-endorphin in the mice ARC had no significant difference between 100 Hz EA and sham stimulation (Figure 2(a)). However, the concentrations of Gly and Glu in the PAG after EA at different frequencies did not alter (Figure S2(a) and (b)). These results were consistent with EA antinociceptive effect above mentioned. We also found that POMC transcriptional level in the ARC was significantly upregulated at 30min after 2 Hz EA (Figure 2(b)). These results indicated that 2 Hz EA performed a much better antinociceptive effect than 100 Hz EA and sham stimulation by increasing the concentration of β-endorphin in the ARC and upregulating the POMC mRNA level. 2 Hz EA maybe upregulate the cAMP-PKA-CREB pathway and c-Fos and Jun B expression to activate ARC POMC neurons. (a) Changes in the concentration of β-endorphin in the ARC after EA at different frequencies. (**p < .01, ***p < .001, two‐way ANOVA, Tukey test compared to the sham group at the corresponding time point; n = 4). (b) The expression level of POMC in the ARC 30min after EA at different frequencies. (**p < .01, one‐way ANOVA, Tukey test compared to the sham group; n = 4). The data in the graphs are the mean ± SEM. (c) Heatmap of genes regulated by 2 Hz EA in the ARC, especially c-Fos and Jun (b) (d) qPCR analysis of the mRNA levels of c-Fos and Jun B after 2 Hz EA (n = 5) compared to sham treatment (n = 4). (***p < .001,t test compared to the sham stimulation group). (e) An example coronal section for the ARC area. (f) Representative images of POMC (red), c-Fos (green) and Jun B (green) immunoreactivity in the ARC after EA stimulation at different frequencies (Scale bars: 200 μm). (g) The % percentage of POMC neurons expressing c-Fos and Jun B in the ARC after EA at different frequencies. (***p < .001 and ****p < .0001, one‐way ANOVA, Tukey test compared to the sham group; ###p < .001 and ####p < .0001 one‐way ANOVA, Tukey test compared to the 100 Hz EA group; n = 3-4). (h) Kyoto Encyclopedia of Genes and Genomes (KEGG) pathway analysis. (i) The concentration of cAMP in the ARC after EA at different frequencies. (***p < .001, two‐way ANOVA, Tukey test compared to the sham group at the corresponding time point; #p < .05, two‐way ANOVA, Tukey test compared to the 2 Hz EA group at the corresponding time point; n = 4). (j) Representative immunoblots of PKA, phosphorylated PKA, CREB and phosphorylated CREB in the ARC at 30min after EA at different frequencies. (k) Graphic representation of relative phosphorylated level of PKA and CREB protein. (**p < .01, one‐way ANOVA, Tukey test compared to the sham group; n = 3). The data in the graphs are the mean ± SEM.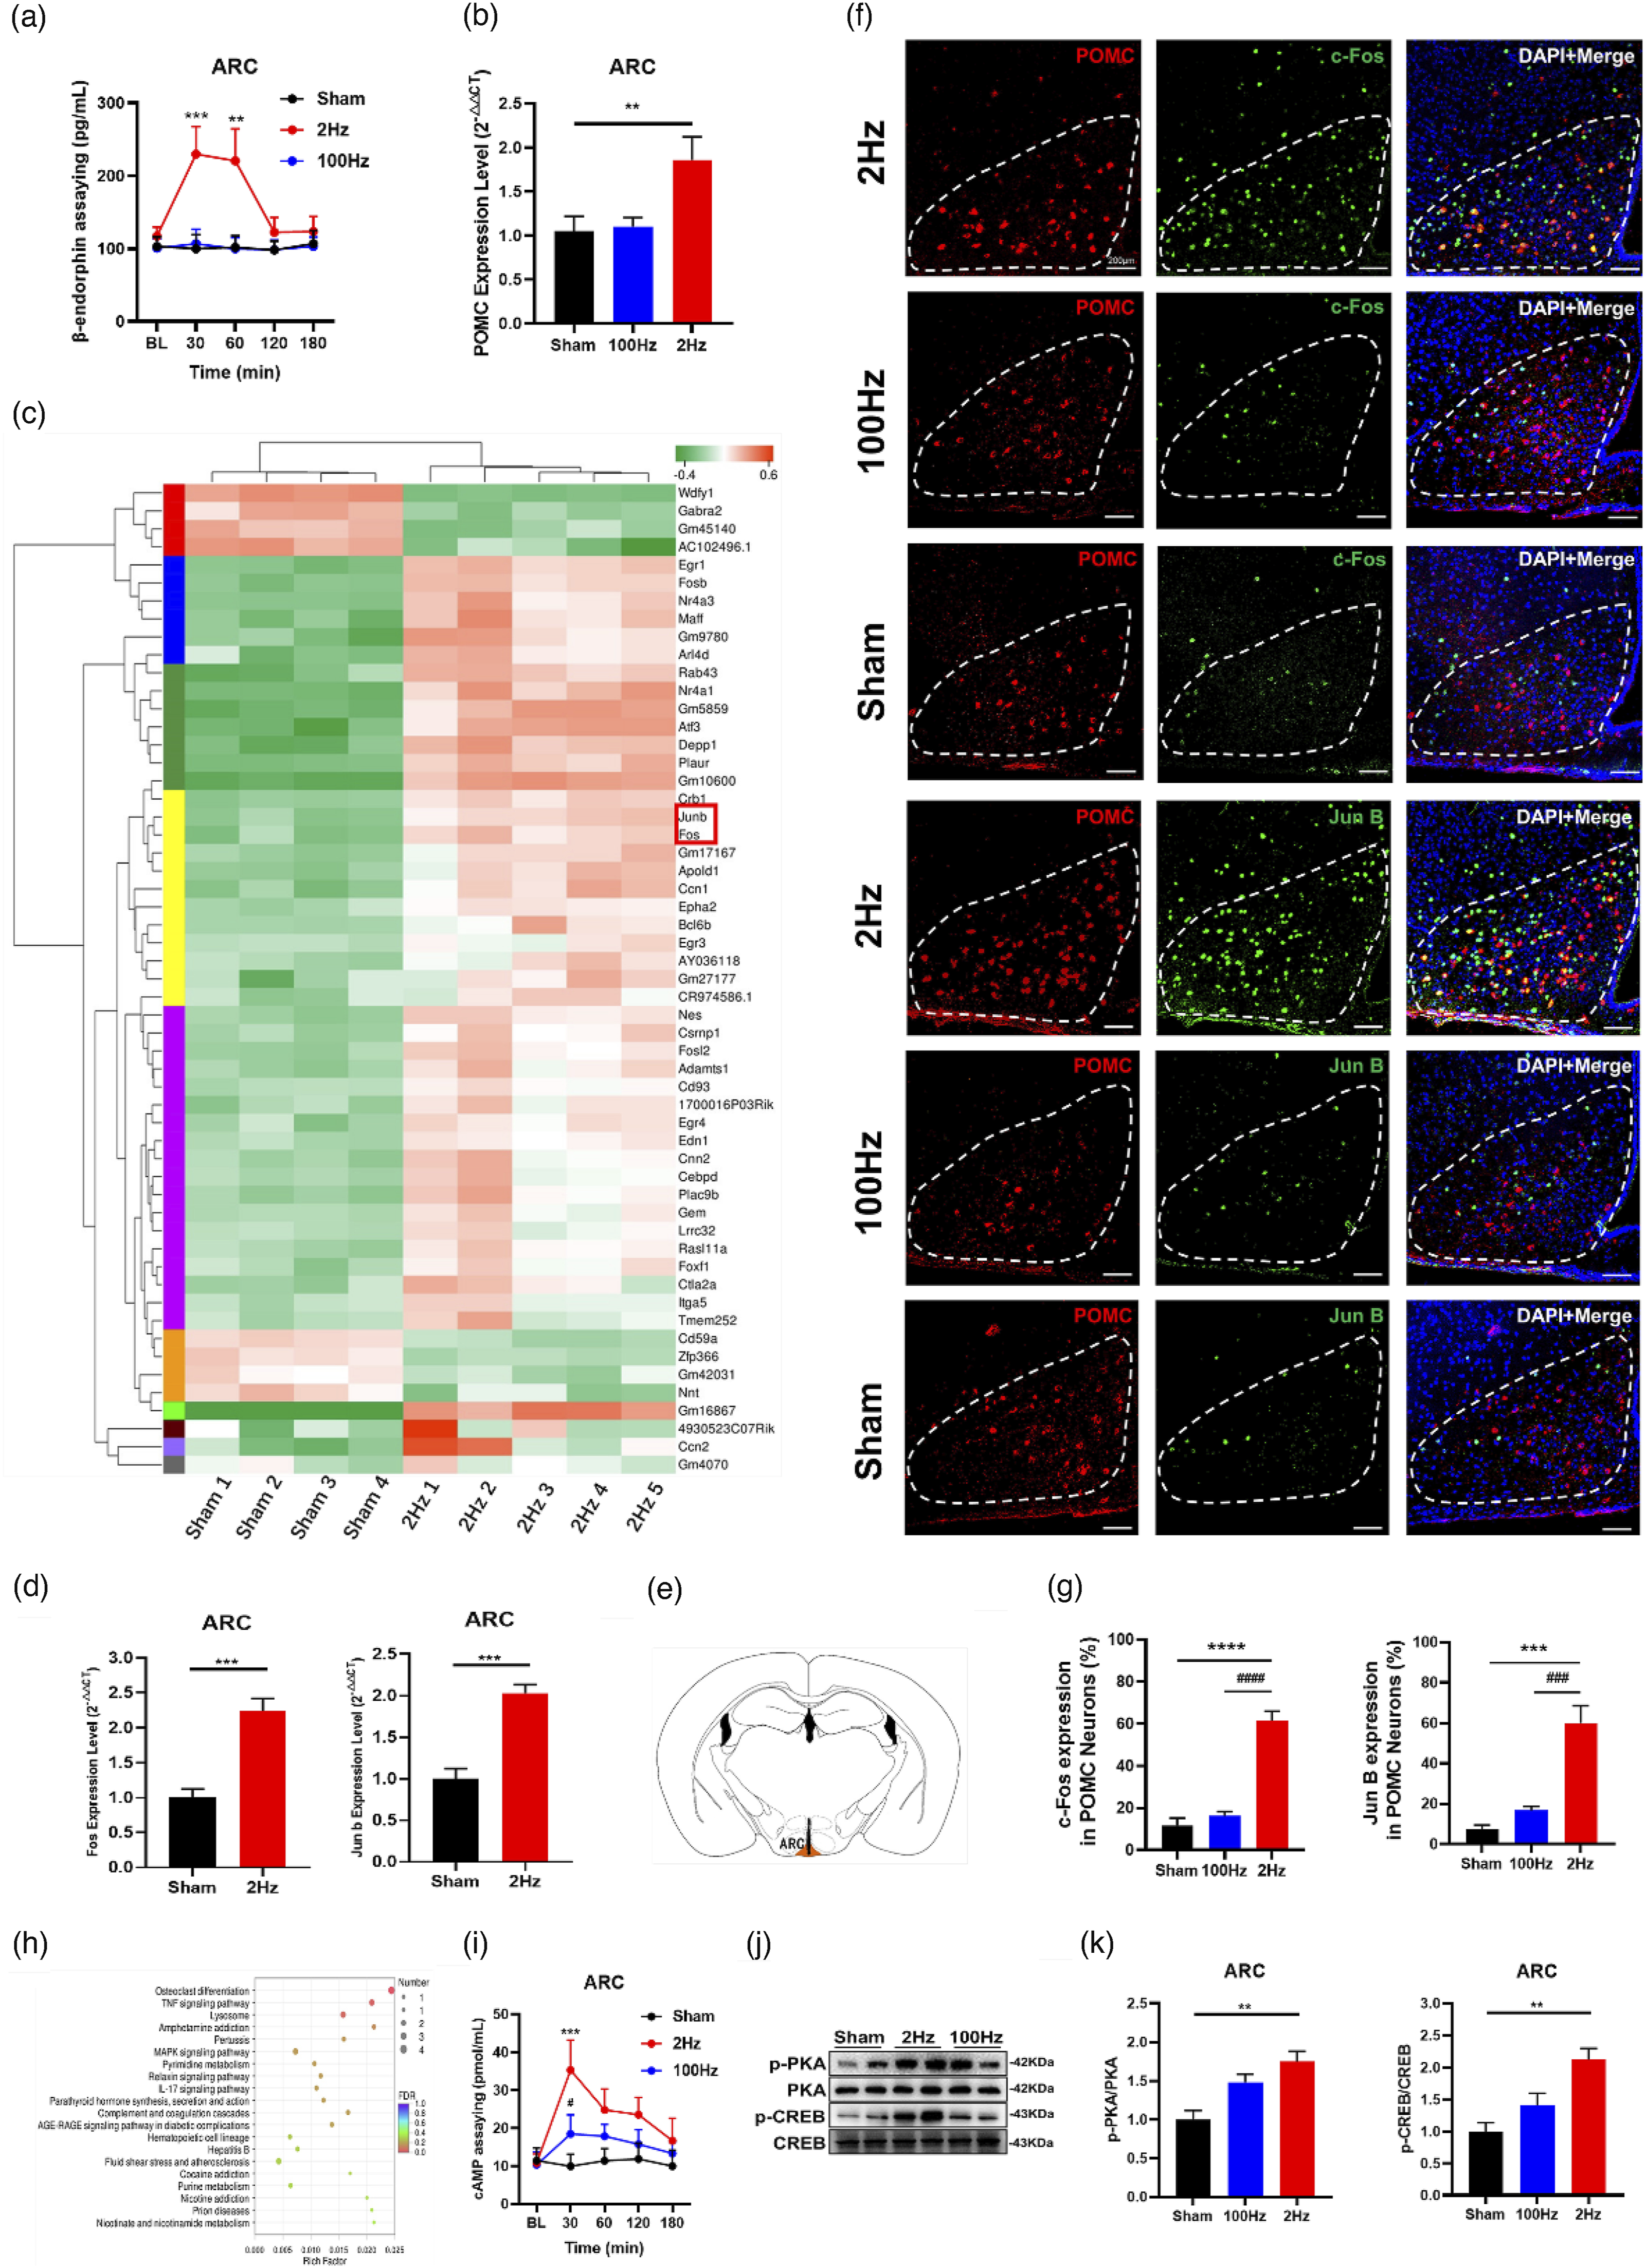
To uncover the molecular mechanism underlying the 2 Hz EA-induced increase in β-endorphin levels and upregulation of POMC gene expression in the ARC, RNA transcriptional profiles of the ARC were tested using next-generation high-throughput sequencing. The genes altered by fold change of >2 or <0.5, and p-value <.05 are shown in the heatmap. We found that c-Fos and Jun B mRNA level in the ARC were approximately two times higher in 2 Hz EA mice than that in sham group mice (Figure 2(c)). According to the abovementioned screening criteria for differentially expressed genes, the POMC gene was not included in the heat map, but RNA sequencing raw results indicated that 2 Hz EA upregulated the expression of the POMC gene in the ARC. We verified the results of RNA sequencing results by qPCR. The c-Fos and Jun B mRNA levels in the ARC of 2 Hz EA mice were significantly enhanced compared with those in sham stimulated mice (Figure 2(d)). Meanwhile, the levels of the proteins encoded by the c-Fos and Jun B in ARCPOMC neurons were evaluated using immunofluorescence staining, we found that c-Fos and Jun B protein levels in the ARCPOMC neurons of 2 Hz EA mice were significant upregulated (Figure 2(e)–(g)).
Kyoto Encyclopedia of Genes and Genomes (KEGG) pathway analysis indicated that the altered genes mainly related to metabolism, genetic information processing, environmental information processing, cellular processes, organismal systems, and human diseases. Among these pathways, MAPK signaling pathway was more likely to be related to antinociceptive effects (Figure 2(h)).
The cAMP-PKA-CREB signaling pathway, as a part of the MAPK signaling pathway seems to be involved in the transcription regulation of the POMC gene. 26 In Addition, the cAMP-PKA-CREB signaling pathway is also related to the antinociceptive effect of EA in anterior cingulate cortex. 27 However, whether this pathway contributes to activate ARCPOMC neurons by 2 Hz EA is still unclear. Therefore, we measured the levels of cAMP in the ARC before and after EA at different frequencies. The cAMP level gain to peak at 30min after 2 Hz EA, which was increased approximately 3-fold compared to baseline, and then gradually decreased. This change was not observed after 100 Hz EA or sham stimulation (Figure 2(i)). Then, we used western blotting to assess the expression levels of downstream effectors of cAMP, including PKA, and CREB, and their phosphorylation (p) status in the ARC after 30min of EA at different frequencies. The data presented that the phosphorylation levels of PKA and CREB were greatly increased in the ARC of 2 Hz EA mice compared to those in sham stimulated mice. Meanwhile, there were no significant increases in the p-PKA and p-CREB levels in the ARC of 100 Hz EA mice compared to those in sham stimulated mice (Figure 2(j)–(k)).
Furthermore, we planned to assess the role of the c-Fos and Jun B genes in the antinociceptive effects of 2 Hz EA by specifically silencing the expression of c-Fos and Jun B in the ARC with siRNA injection (Figure 3(a)). First, we screened the siRNA knockdown c-Fos and Jun B respectively. c-Fos siRNA3 and Jun B siRNA2 were selected as effective siRNAs for subsequent experiments (Figure S4(a) and (b)). The data showed that the antinociceptive effect of 2 Hz EA was weakened by the knockdown of c-Fos, Jun B, and c-Fos/Jun B in ARC region (Figure 3(b)). The knockdown of c-Fos, Jun B and c-Fos/Jun B had no effect on the concentration of cAMP in the ARC (Figure 3(c)), but they decreased the concentration of β-endorphin in the ARC (Figure 3(e)) by downregulating the transcriptional level of POMC gene (Figure 3(d)). In addition, POMC mRNA level was not significantly altered, but β-endorphin levels in the PAG of c-Fos, Jun B, and c-Fos/Jun B knockdown mice were significantly decreased (Figure S4(c) and (d)). These results revealed that c-Fos and Jun B regulate POMC transcription levels contributing to the antinociceptive effect of 2 Hz EA. Effects of injection of forskolin, H-89, c-Fos siRNA, and Jun B siRNA into the ARC on the antinociceptive effect of 2 Hz EA stimulation. (a) Schematic of siRNA injection into the ARC. (b) The % MPE of 2 Hz EA to mice injected c-Fos siRNA, Jun B siRNA, or control siRNA into the ARC. (*p < .05, #p < .05, ##p < .01, $p<.05,$$p < .01, two‐way ANOVA, Tukey test compared to the 2 Hz + control siRNA group at the corresponding time point; n = 4). (c) The cAMP level in the ARC of mice injected c-Fos siRNA, Jun B siRNA, or control siRNA into the ARC. There was no significant difference in the concentration of cAMP in the ARC of the abovementioned mice. (d) The POMC expression level in the ARC of the abovementioned mice. (*p < .05, **p < .01 and ***p < .001, one‐way ANOVA, Tukey test compared to the 2 Hz + control siRNA group; n = 8). (e) The concentration of β-endorphin in the ARC of the abovementioned mice. (***p < .001, one‐way ANOVA, Tukey test compared to the 2 Hz + control siRNA group; n = 8). (f) Schematic of chemicals injection into the ARC. (g) The % MPE of 2 Hz EA that received H-89 or saline injection into the ARC and the % MPE of mice that received forskolin or forskolin/H-89 injection into the ARC. There was no significant difference between the % MPE of 2 Hz EA + saline and that of forskolin or between the % MPE of 2 Hz + H-89 and that of forskolin + H-89 in Tail-flick test and Hotplate test. (*p < .05 and ***p < .001, two‐way ANOVA, Tukey test compared to the 2 Hz EA + saline group at the corresponding time point;

To further authenticate the above results, forskolin as a generally direct, rapid and reversible activator of cAMP was injected into the ARC of C57BL/6J mice. Additionally, H-89, an inhibitory of PKA, was injected into the ARC of C57BL/6J mice to block the cAMP-PKA-CREB pathway. Saline was injected into the ARC as a control (Figure 3(f)). All chemicals were injected immediately before 2 Hz EA to ensure that their effects were exerted during 2 Hz EA. We found that injection of forskolin into the ARC produced the antinociceptive effect, which was similar to 2 Hz EA (Figure 3(g)). Similarly, injection of forskolin almost completely recapitulated the upregulation of downstream signaling in the ARC, such as c-Fos (Figure 3(h)), Jun B (Figure 3(i)), and POMC genes (Figure 3(j)). There were no significant differences between the effects of forskolin and 2 Hz + saline on the β-endorphin concentration in the ARC (Figure 3(k)). As expected, these effects of forskolin and 2 Hz EA, which could improve POMC transcription level and accelerate β-endorphin release, were markedly abolished by injection of H-89 (Figure 3(j)–(k), Figure S4(e) and (f)). These results demonstrated that 2 Hz EA seemed to exert its antinociceptive effect via activating ARC POMC neurons through the cAMP-PKA-CREB signaling pathway in ARC.
Previous studies reported that the activation of MOR by β-endorphin could induce an increased phosphorylation level of the extracellular signal-regulated kinase (ERK) in PAG, 28 and its phosphorylation level had something to do with the antinociceptive effect of EA. 29 In order to determine the relationship between the phosphorylated ERK in the PAG and the antinociceptive effect of EA, we tested the phosphorylation level of ERK in PAG at 30 min after EA at different frequencies. The data showed that the phosphorylation level of ERK1/2 in the PAG was greatly increased at 30 min after 2 Hz EA compared to after sham stimulation (Figure S4(a)–(b)). Similarly, the phosphorylation level of ERK (Figure S4(c) and (d)) and were decreased after c-Fos, Jun B, or c-Fos/Jun B siRNA administration. We also examined the phosphorylation level of ERK in the PAG of mice that had received stereotaxic injection forskolin and H-89 into the ARC. The data present that forskolin injection induced a similar increase in the phosphorylation level of ERK to the level of 2 Hz EA mice ((Figure S4(e) and (f)). These results indicated that an increased phosphorylation level of ERK in the PAG might be contribute to the antinociceptive effect of 2 Hz EA.
2 Hz EA activated POMC neurons within the ARC
To clarify whether 2 Hz EA specifically activate POMC neurons within the ARC, we recorded Ca2+ transients in POMC neurons within the ARC in real-time during EA at different frequencies. AAV2-EF1α-DIO-GCaMP6s was injected into the ARC of POMC-Cre mice, and then an optical fiber was implanted above the ARC (Figure 4(a)). 3-4 weeks following viral infusion, GCaMP6s was expressed specifically in POMC neurons and at all recording sites within the ARC (Figure 4(b)). By aligning the GCaMP6s signals over time with EA (Figure 4(c)), we found that ARC POMC neurons increased their activity during 2 Hz EA (Figure 4(d) and (e)); however, there was no significant changes in the activity of ARCPOMC neurons during 100 Hz EA (Figure 4(f) and (g)) and sham stimulation (Figure 4(h) and (i)). These fiber photometry results further convinced us that POMC neurons in the ARC activated by 2 Hz EA are very important for its antinociceptive effect. ARC POMC neurons were activated during 2 Hz EA. (a) Viral strategy for GCaMP6s injection and optical fiber implantation into the ARC. (b) An example coronal section (left, scale bars: 1 mm) showing histological verification of viral inject and optical fiber implantation and the magnified area of the ARC (right, scale bars: 200 μm) in a representative POMC-Cre mouse. (c) Schematic diagram of the fiber photometry recording system for EA. Ca2+ signals recorded from ARC POMC neurons. (d), (e) ARC POMC neurons increased their activity during 2 Hz EA (n = 8). (f),(g) ARC POMC neurons during 100 Hz EA (n = 8). (h),(i) ARC POMC neurons during sham stimulation (n = 8). (d, f, h) Heatmap illustration of Ca2+ signals aligned to the onset of EA was shown for POMC-Cre mice. Each row represents Ca2+ changes during one course of EA. Color scale indicates the range of ΔF/F. (e, g, i) Peri-event plots of average Ca2+ transients from POMC-Cre mice.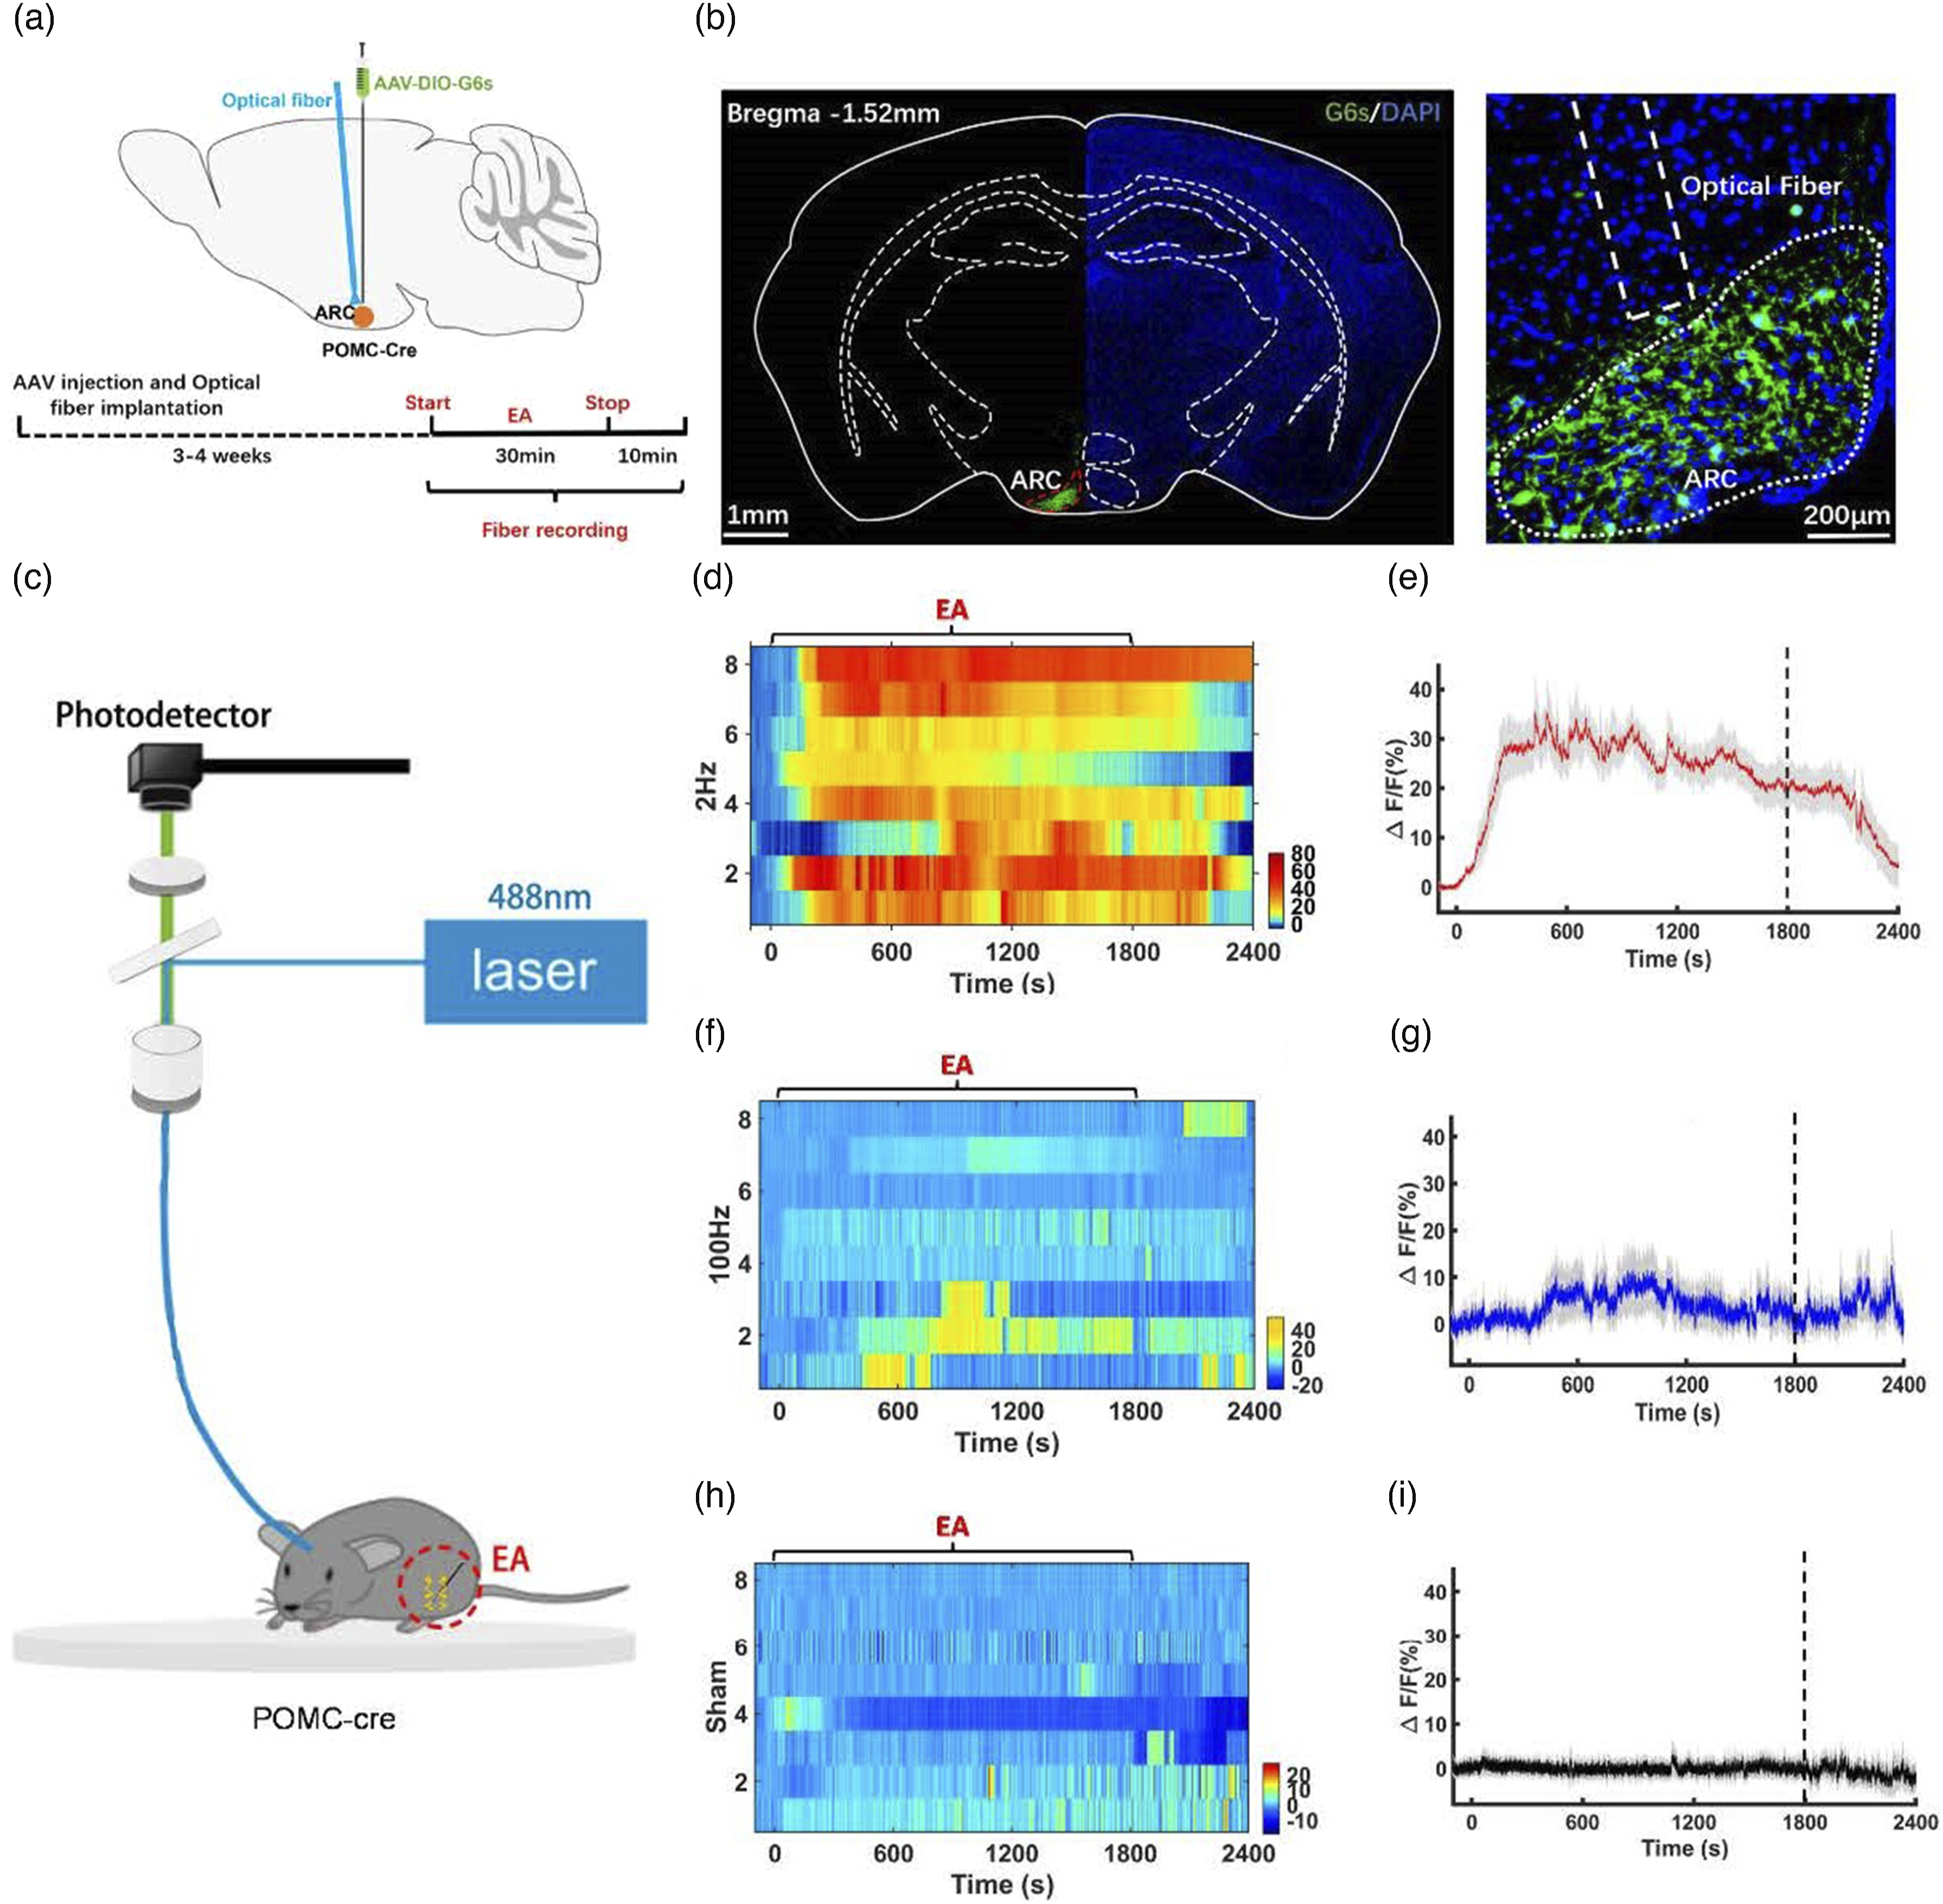
The ARCPOMC-PAGGABA neural circuit was involved in the acceleration of the transfer of β-endorphin from the ARC to the PAG induced by 2 Hz EA
Although β-endorphin is produced in the ARCPOMC neurons, the periaqueductal gray (PAG) is an integrated center of analgesia, and the β-endorphin level was significantly increased in the PAG 30 and 60min after 2 Hz EA (Figure 5(a)). Furthermore, we used a new strategy to trace the transfer of β-endorphin from the ARC to the PAG. For this paradigm, FITC-β-endorphin was injected into the ARC of C57BL/6J mice 15min before EA (Figure 5(b)) and only-FITC was also injected into the ARC of C57BL/6J mice as a control (Figure S1(a)). There was no FITC signal in the PAG before EA and after sham stimulation, but we observed some strong FITC signals after 2 Hz EA and very weak FITC signals in the PAG after 100 Hz EA (Figure 5(c)). After 2 Hz EA and 100 Hz EA, there was no FITC signal present in the PAG of mice that received the injection of only-FITC alone (Figure S1(b)). These findings provided evidence that 2 Hz EA accelerated the transfer of β-endorphin from the ARC to the PAG through the β-endorphinergic pathway. Unlike the concentration of β-endorphin, the concentration of γ-aminobutyric acid (GABA) in the PAG was decreased 30 and 60min after 2 Hz EA (Figure 5(e)). The concentrations of glutamate (Glu) and glycine (Gly) in the PAG were not changed after 2 Hz EA, 100 Hz EA, or sham stimulation (Figure S2(a) and (c)). The transfer of β-endorphin from the ARC to the PAG contributed to decrease the concentration of GABA in the PAG after 2 Hz EA. (a) The concentration of β-endorphin in the PAG after EA at different frequencies. (***p < .001, two‐way ANOVA, Tukey test compared to the sham group at the corresponding time point; n = 4) (b) Schematic of FITC-β-endorphin injection into the ARC and evaluation of FITC-β-endorphin levels in the PAG. (c) FITC signals in the PAG after EA at different frequencies in C57BL/6J mice. (d) The concentration of GABA in the PAG after EA at different frequencies. (*p < .05, two‐way ANOVA, Tukey test compared to the sham group at the corresponding time point; n = 4-5) The data in the graphs are the mean ± SEM.
A few studies have reported that the PAG receives neural projections from hypothalamic nuclei, such as the ARC. To determine whether ARCPOMC neurons project to the PAG, we injected AAV1-hSyn-FLEX-eGFP into the ARC of POMC-Cre mice (Figure 6(a)). Anterograde tracing with eGFP specifically expressed in ARCPOMC neurons revealed a few eGFP-expressing axons in the PAG and ARC 3-4 weeks later (Figure 6(b)), confirming that ARCPOMC neurons projected to the PAG.
30
β-endorphin, as an endogenous opioid, is more likely to combine with μ-opioid receptors in GABAergic neurons within the PAG to exert antinociceptive effects.
13
Based on above the results, we hypothesized that PAGGABA neurons receive inhibitory β-endorphinergic projections from ARCPOMC neurons and β-endorphinergic pathway between the ARC to the PAG is involved in the neural mechanism of 2 Hz EA antinociceptive effect. To verify this hypothesis, we applied a retrograde transsynaptic tracing approach to identify β-endorphinergic inputs from ARCPOMC neurons to PAGGABA neurons. The mDlx enhancer was inserted in front of promoter in adeno-associated virus (AAV) backbone to restrict the expression of reporter genes to GABAergic interneurons in vitro using rAAV.
31
rAAV-Retro-mDlx-eGFP was injected into the PAG of C57BL/6J mice (Figure 6(c)). After 3-4 weeks, several neurons expressing eGFP were observed in the ARC (Figure 6(d)), suggesting that PAG GABAergic neurons received direct innervations from the ARC. To further prove this conclusion, we also applied rabies virus (RV) as the retrograde tracer in C57BL/6J mice (Figure 6(c)). We observed some dsRed-expressing neurons in the ARC besides the PAG as expected (Figure 6(d)). The neural projection from ARC POMC neurons to PAG GABA neurons. (a) Cre-dependent eGFP-AAV1 was injected into the ARC of POMC-Cre mice as an anterograde tracer. (b) eGFP expression in the PAG and ARC of POMC-Cre mice 3-4 weeks after injection. (c) RV encoding dsRed and its auxiliary AAV were injected into the PAG of C57BL/6J mice as a retrograde tracer. (d) DsRed expression in the ARC and PAG of C57BL/6J mice 4 weeks after injection. (e) Sample current-clamp traces showing that 20 Hz photostimulation at ARC POMC neuron terminals induced action potential changes in a PAG GABA neuron (upper: light off, lower: light on). (f) The frequency of action potentials in PAG GABA neurons was reduced by 20 Hz photo stimulation at ARC POMC neuron terminals. (*p < .05,t test compared to the light off group; n = 4). The data in the graphs are the mean ± SEM.
To identify the functional synaptic connections between ARCPOMC neurons and PAG GABAergic neurons, slice electrophysiology of the PAG region was performed. We injected AAV-EF1a-DIO-ChR2-mCherry into the ARC and AAV-MDLX-EYFP into the PAG of POMC-Cre mice. 3-4 weeks later, the whole-cell recordings were obtained from ARC POMC neurons and PAG GABAergic neurons in acute brain slices from POMC-Cre mice. Moreover, the frequency of action potentials in PAG GABAergic neurons that received inputs from ARC POMC neurons was dramatically decreased (Figure 6(e) and (f)). The above results suggested that PAG GABAergic neurons received inhibitory inputs from ARC POMC neurons which were mediated by 2 Hz EA speeding up the transfer of β-endorphin from the ARC to the PAG.
2 Hz EA induced the inhibition of PAG GABAergic neurons contributing to the antinociceptive effect
According to the above results, we determined that 2 Hz EA produced much more antinociceptive effect at 30min after stimulation, and this time point was selected to record Ca2+ signals in PAG GABAergic neurons. rAAV-mDlx-GCaMP6s was injected into the PAG of C57BL/6J mice, followed by the implantation of an optical fiber above the PAG (Figure 7(a)). 3-4 weeks of virus injection later, the accuracy of cannula placement and viral expression were confirmed after the behavioral tests (Figure 7(b)). PAG GABAergic neuron activity was recorded during exposure to 30s of acute thermal stimulation 30min after EA at different frequencies (Figure 7(c)), and we observed a strong continuous decrease in GCaMP6s fluorescence when mice were exposed to heat stimulation after 2 Hz EA (Figure 7(d) and (e)). However, it was not observed in 100 Hz EA (Figure 7(f) and (g)) and sham stimulation (Figure 7(h) and (i)). These evidences indicated that the suppression of PAG GABAergic neurons contributed to the antinociceptive effect of 2 Hz EA. PAG GABA neurons were inhibited after 2 Hz EA. (a) Viral strategy for GCaMP6s specifical expression in PAG GABA neurons and schematic of optical fiber implantation into the PAG. (b) An example coronal section (left, scale bars: 1 mm) showing expression of GCaMP6s specifically in PAG GABA neurons and the location of optical fiber implantation and a magnified image of the PAG (right, scale bars: 50 μm). (c) Schematic diagram of the fiber photometry recording system used for the hotplate test. 30s of Ca2+ signals recorded from PAG GABA neurons during the hotplate test 30 min after (d), (e) 2 Hz EA, (f), (g)100 Hz EA, and (h), (i) sham stimulation (n = 12). (d, f, h) Heatmap showing the changes in Ca2+ signals during the hotplate test. (e, g, i) Color scale indicates the range of ΔF/F. Average Ca2+ transients of C57BL/6J mice during the hotplate test.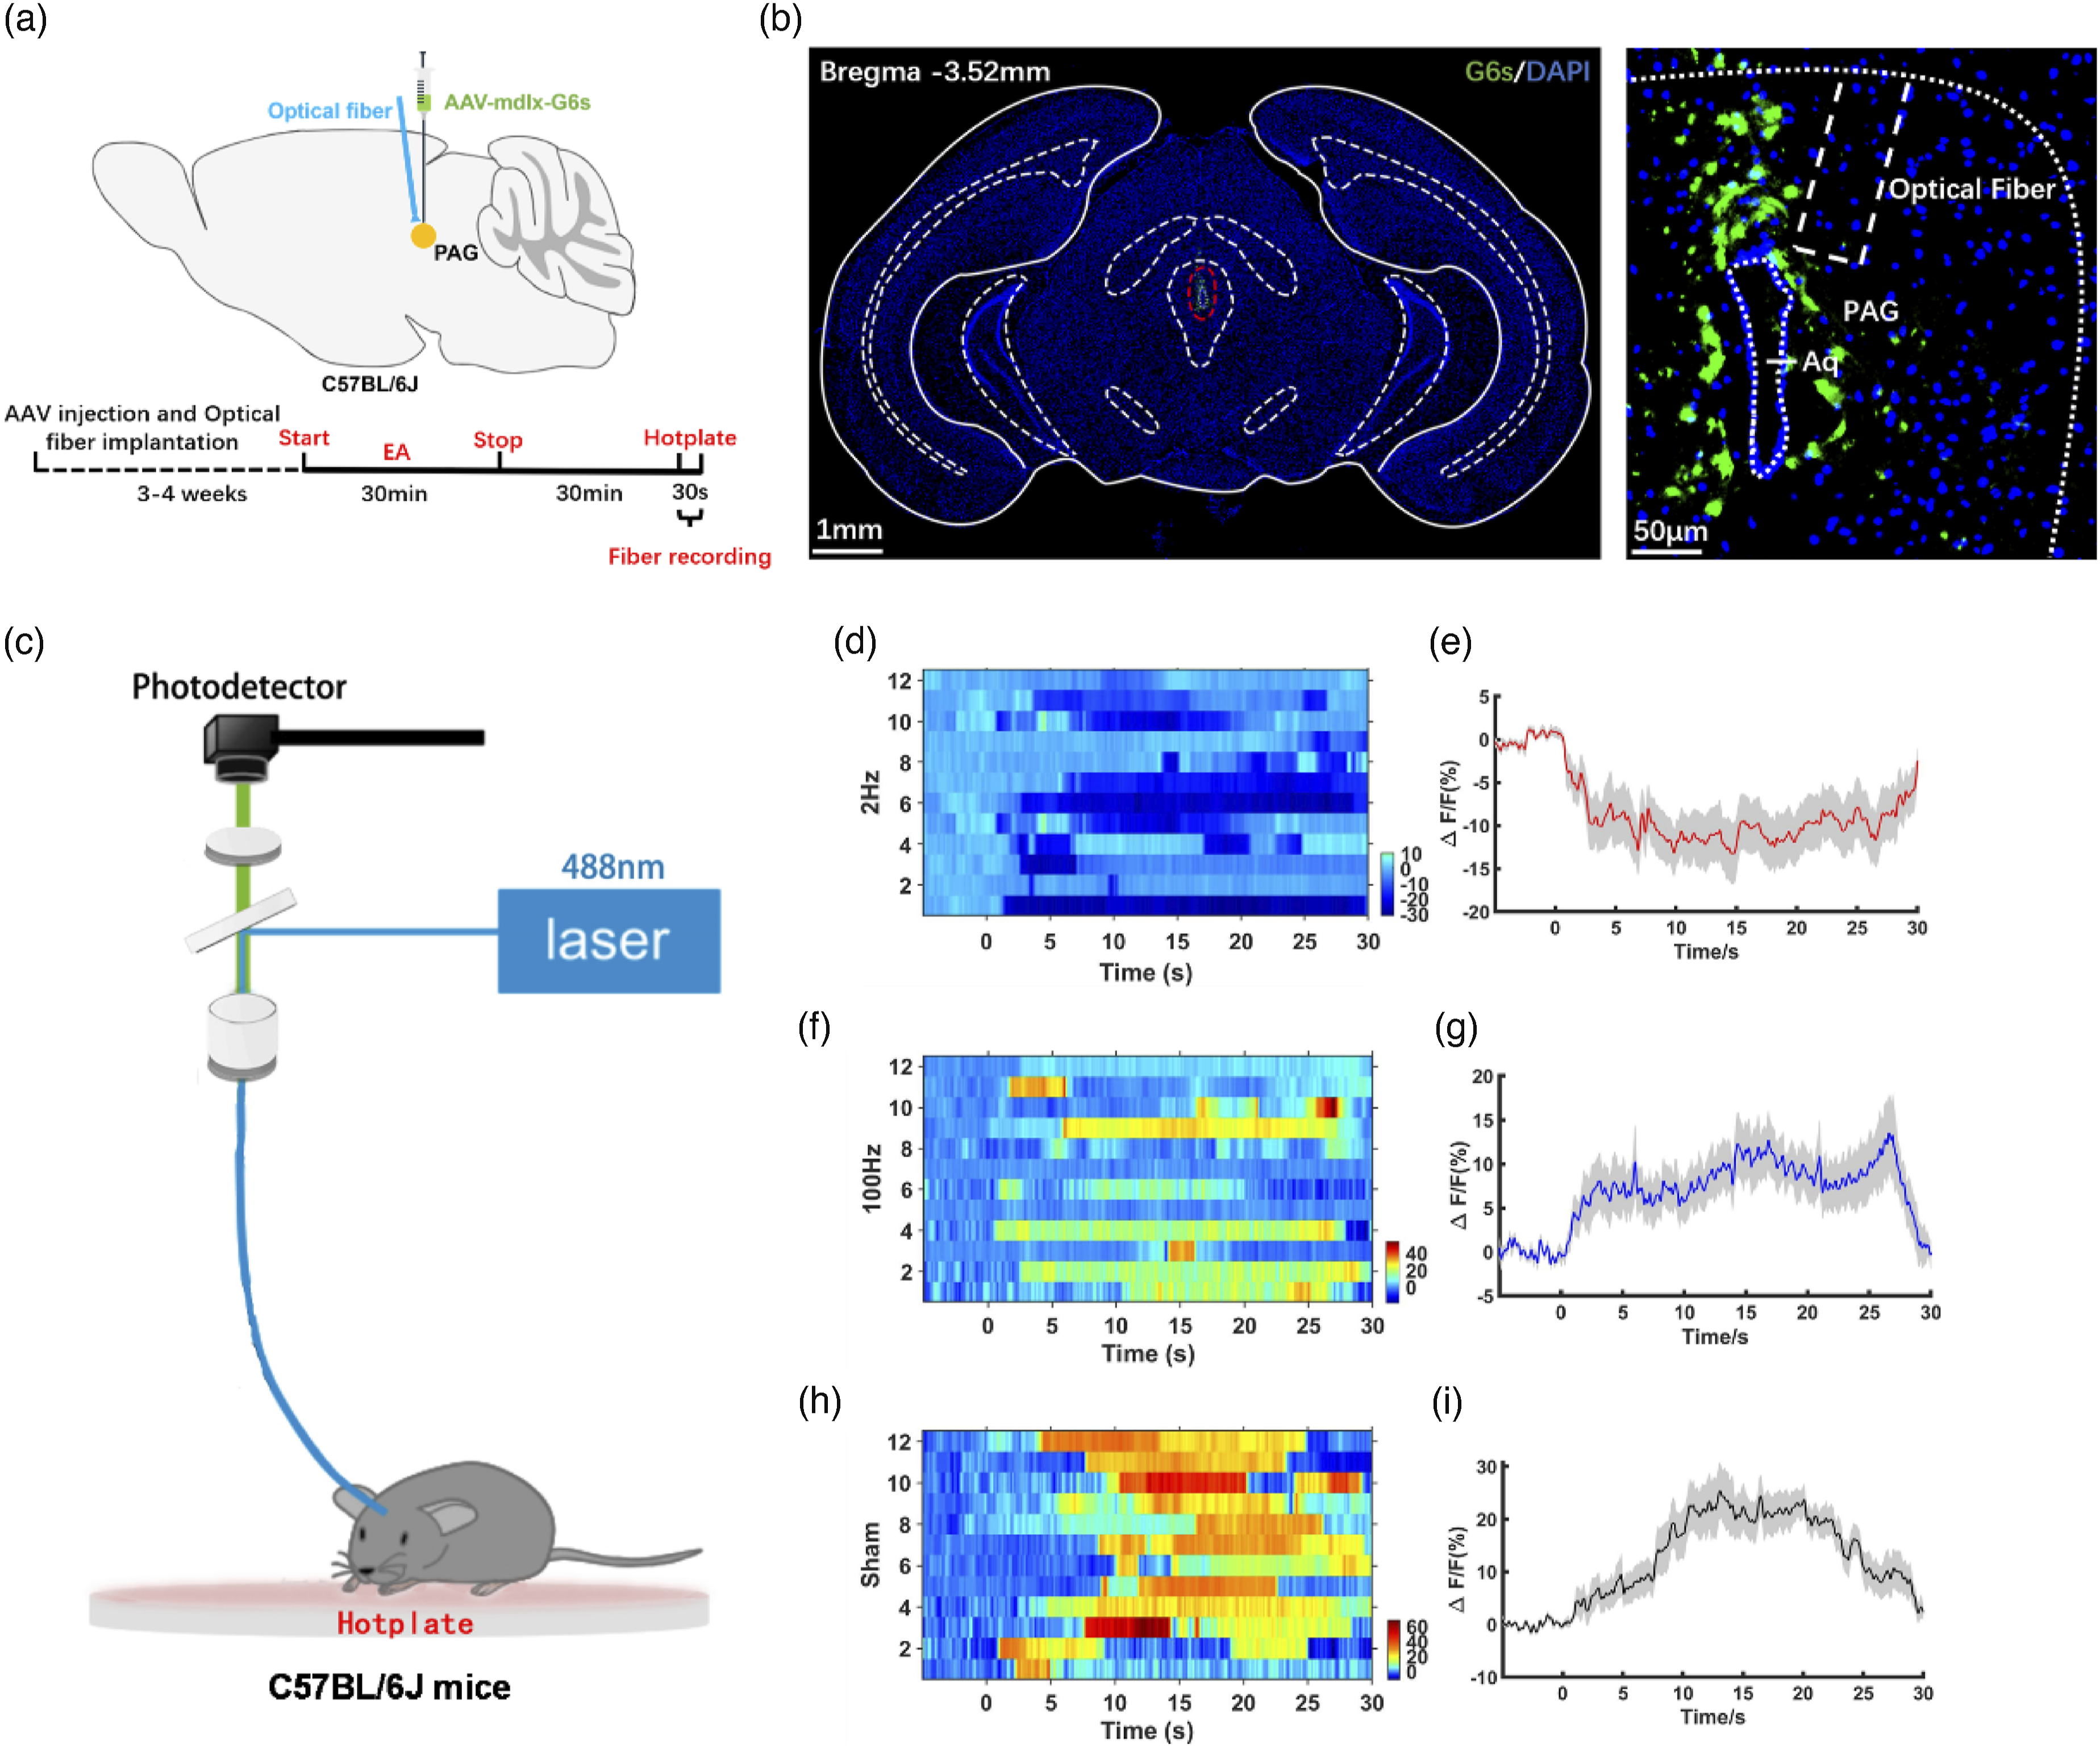
Antinociceptive effect of 2 Hz EA on neuropathic pain model in mice
To investigate the antinociceptive effect of EA at different frequencies on neuropathic pain model in mice, we first observed the changes in pain thresholds by tail-flick and hot plate tests. Consistent with the previous results, 2 Hz EA stimulation had a better antinociceptive effect than sham stimulation and 100 Hz stimulation at 30 and 60min (Figure 8(a)–(c)). Similarly, we also observed some FITC signals after 2 Hz EA in the PAG of neuropathic pain model in mice (Figure 8(d) and (e)). Then, to determine whether the ARCPOMC-PAGGABA neural circuit was still existed on neuropathic pain model in mice, RV was injected as the retrograde tracer into the PAG of neuropathic pain model in mice (Figure 8(f)). The results showed that we still could observe some dsRed-labeled neurons in the ARC besides the PAG (Figure 8(g)). Moreover, we detected Ca2+ signals in PAG GABAergic neurons through fiber optic recording system after 2 Hz EA and sham stimulation in neuropathic pain model of mice during 30s of acute thermal stimulation (Figure 8(h)). Interestingly, we also observed a continuous decrease in GCaMP6s fluorescence when neuropathic pain mice models were exposed to heat stimulation after 2 Hz EA (Figure 8(i) and (j)), whereas GCaMP6s fluorescence was increased after sham stimulation (Figure 8(k) and (l)). These results confirmed that 2 Hz EA was also able to exert antinociceptive effects through inhibiting the Ca2+ signals in PAG GABAergic neurons in neuropathic pain model. Antinociceptive effect of 2 Hz EA on neuropathic pain model in mice. (a) Schematic of the pain threshold tests after EA. (b) The location of EA at Zusanli point (ST36) in mice. (c) The % MPE of EA at different frequencies in the neuropathic pain model in tail-flick test (left) and hotplate test (right). (**p < .01 and ****p < .0001, two‐way ANOVA, Tukey test compared to the sham group at the corresponding time point; n = 11). The data in the graphs are the mean ± SEM. (d), (e) FITC signals after 2 Hz EA in the PAG of neuropathic pain model in mice. (f) RV encoding dsRed and its auxiliary AAV were injected into the PAG of neuropathic pain model in C57BL/6J mice as a retrograde tracer. (g) DsRed expression in the ARC and PAG of neuropathic pain model in C57BL/6J mice 4 weeks after injection. (h) Schematic diagram of the fiber photometry recording system used for the hotplate test. 30s of Ca2+ signals recorded from PAG GABA neurons of neuropathic pain model during the hotplate test 30min after (i), (j) 2 Hz EA and (k), (j) sham stimulation (n = 10). (i), (k) Heatmap showing the changes in Ca2+ signals during the hotplate test. (j), (i) Color scale indicates the range of ΔF/F. Average Ca2+ transients of neuropathic pain model during the hotplate test.
Chemogenetically suppression of the activity of POMC neurons projecting from the ARC to the PAG reduced the antinociceptive effect of 2 Hz EA
To examine the function of activated ARC POMC neurons that project to the PAG to the antinociceptive effect of 2 Hz EA, we chemogenetically suppressed the activity of ARC POMC neurons that project to the PAG by expressing H4MI in ARC POMC neurons of POMC-Cre mice (Figure 9(a) and (b)). The chemogenetically suppression experiment (Figure 9(c)) revealed that clozapine n-oxide (CNO) dihydrochloride treatment before 2 Hz EA reduced the pain threshold of mice compared with saline treatment (Figure 9(d)). Furthermore, there was no significant difference in pain threshold between control mice injected with saline and mice injected with CNO before 2 Hz EA (Figure 9(e)). The behavioral results confirmed that the excitability of ARCPOMC neurons projecting to PAG GABAergic neurons was crucial for the antinociceptive effect of 2 Hz EA. Chemogenetic manipulation on ARC POMC neurons markedly weakened the antinociceptive effect of 2 Hz EA. (a) Pattern map of the virus injection area. (b) Images showing mCherry virus expression in the ARC. Scale bars: 1 mm (left) and 200 μm (right). (c) The strategy for chemogenetic manipulation on ARC POMC neurons during 2 Hz EA. (d) The % MPE in H4MI expressing mice in the tail flick test (left) and hot plate test (right) after CNO treatment and saline treatment for 2 Hz EA. (*p < .05, ***p < .001 and ****p < .0001, two‐way ANOVA, Bonferroni test compared to the saline group at the corresponding time point; n = 8).(e) There was no significant difference in the % MPE of 2 Hz EA after CNO treatment and saline treatment in only mCherry expressing mice. The data in the graphs are the mean ± SEM.
Optogenetically suppression of the terminals of ARC POMC neurons projecting to the PAG reduced the antinociceptive effect of 2 Hz EA
To rule out the possibility that our observed results were due to the inhibition of collateral projections of POMC neurons from the ARC to other brain areas, we used optogenetic manipulation to suppress the activity of ARC POMC neuron projection terminals in the PAG of POMC-Cre mice. The terminals of ARC POMC neurons with viral-mediated expression of the inhibitory opsin eNpHR3.0 that projected to the PAG (Figure 10(a) and (b)) were illuminated by a yellow light-emitting diode (LED) placed over the PAG during behavioral testing (Figure 10(c)). Photo stimulation at 2 Hz, 10 Hz and 20 Hz partly reduced the antinociceptive effect of 2 Hz EA respectively, and only control mice expressing eGFP exhibited no light-induced behavioral changes (Figure 10(d)–(f)). Collectively, these results demonstrated a causal link between ARCPOMC-PAGGABA neural circuit activity and the antinociceptive effect of 2 Hz EA. Optogenetic manipulation on the synaptic terminals of ARC POMC neurons markedly weakened the antinociceptive effect of 2 Hz EA. (a) Pattern map of the location of virus injection and optical fiber implantation. (b) Pictures showing eGFP virus expression in the ARC (left, scale bars: 1 mm) and PAG (right, scale bars: 100 μm). (c) Schematic of optogenetic manipulation on ARC POMC neurons during the hotplate test 30min after 2 Hz EA. (d) The % MPE of 2 Hz EA with and without 2 Hz light stimulation in eNpHR3.0 and only eGFP expressing mice. (*p < .05, two‐way ANOVA, Bonferroni test compared to the light off in eNpHR3.0 expressing mice; n = 8). (e) The % MPE of 2 Hz EA with and without 10 Hz light stimulation in eNpHR3.0 and only eGFP expressing mice. (**p < .01, two‐way ANOVA, Bonferroni test compared to the light off in eNpHR3.0 expressing mice; n = 8). (f) The % MPE of 2 Hz EA with and without 20 Hz light stimulation in eNpHR3.0 and only eGFP expressing mice. (***p < .001, two‐way ANOVA, Bonferroni test compared to the light off in eNpHR3.0-expressing mice; n = 8). There was no significant difference in the % MPE of 2 Hz EA with and without different frequencies light stimulation in only eGFP-expressing mice. The data in the graphs are the mean ± SEM.
In brief, these observations convinced us that 2 Hz EA might firstly activate the second messenger cAMP to further activate the transcription factor c-Fos/Jun B through the cAMP- PKA-CREB pathway in the ARC, which seemed to contribute to activate ARC POMC neurons, and then activated ARC POMC neurons and promoted inhibitory beta-endorphinergic outputs from ARC POMC neurons to PAG GABAergic neurons to exert the antinociceptive effect (Figure 11). Proposed mechanisms of the antinociceptive effect of 2 Hz EA.
Discussion
Numerous clinical studies have confirmed that EA exhibits specific antinociceptive effects.2,32 In clinic practice, varying frequencies of EA are utilized to enhance analgesic effect. It has been suggested that the low frequency (2 Hz) EA is mainly mediated by the hypothalamic arcuate nucleus, whereas the high frequency (100 Hz) is integrated by different nucleus of the brainstem.33,34
Low frequency EA at ST36 mainly increases the release of β-endorphin to exert analgesic effect. 10 However, the mechanisms of low frequency EA inducing the release of β-endorphin in arcuate nucleus is still unclear. In this study. We initially confirmed that 2 Hz EA elevated β-endorphin levels in the ARC. To uncover the underlying molecular mechanism, we used next-generation high-throughput sequencing to analyze RNA from the ARC. The differential expression analysis revealed that the c-Fos and Jun B genes, key transcription factors of POMC, were significantly altered. Previous studies have indicated that that MAP kinase-mediated signaling pathways as well as the downstream molecules c-Fos and Jun B play important roles in EA-induced antinociceptive effect, 35 thus it is suggested that 2 Hz EA increased POMC gene transcription level through the cAMP-PKA-CREB pathway in ARCPOMC neurons. To validate our findings, a series of experiments using cAMP-PKA-CREB pathway inhibitors were conducted. However, due to the challenges of EA in vivo stimulation experimental, in this study, we unable to investigate this transcriptional mechanism in POMC neuron through single-cell sequencing technology.
Although numerous studies have demonstrated that EA activates neurons in the ARC based on the expression level of c-Fos in the ARC, 36 there remains a lack of concrete evidence that ARCPOMC neurons are specifically activated by EA, due to the absence of reliable neurobiology research methods. However, in recent years, the rapid development of fiber photometry, chemogenetic manipulation, optogenetic manipulation, and electrophysiological techniques, have elucidated the mechanisms that regulate the excitability of specific neural circuits. For the first time, we recorded the fluorescence signals of calcium ions to assess the real-time activity of ARCPOMC neurons during EA at different frequencies, and we found that 2 Hz EA significantly activated ARCPOMC neurons. This activation may contribute to the antinociceptive effects and other benefits of EA. It is widely recognized that ARCPOMC neurons not only release β-endorphin but also excitatory and inhibitory amino acids, as well as melanocortin, which play crucial roles in regulating food intake. Our finding indicates that long-term chemogenetic and optogenetic suppression of POMC neuron activity in POMC-Cre mice leads to a reduction in feeding behavior, the result we did not document in detail as it was not the primary focus of our study. However, this might suggest a potential the mechanisms through which EA could facilitate weight loss. The exploration of other effects of EA warrants further investigation. Additionally, the NTS cluster of POMC neurons, as a possible source of β-endorphin may synergize with 2 Hz EA, highlighting the importance of further research in this area.
Acupuncture could activate endorphinergic neurons in the ARC that project to the nucleus accumbens to treat alcohol dependence. 37 Inspired by this mechanism, we hypothesized that activated ARCPOMC neurons may be involved in transferring β-endorphin from the ARC to the PAG to alleviate pain. To investigate this pathway, β-endorphin tagged with FITC was injected into the ARC, and observed the FITC signals in vitro. However, this method does not allow for the dynamic in vivo visualization of β-endorphin transfer from the ARC to the PAG. Neurotransmitter probes, capable of high-resolution real-time in vivo 38 detection of neurotransmitters like glutamate (Glu), GABA, 39 and dopamine, 40 have been developed. Unfortunately, a probe for β-endorphin is yet to be developed; however, we are optimistic about its future availability and its potential to enhance our understanding of β-endorphin signaling and regulation in both normal and pathological states. Furthermore, we acknowledge that our experimental evidence regarding ARCPOMC neurons directly innervating PAG GABAergic neurons is not perfect. In this study, the simple slice electrophysiology experiment alone, which was lack of tetrodotoxin (TTX) stimulation, could not clearly draw this conclusion. We should use a voltage-gated mode or detect the hyperpolarization in the presence of TTX upon optogenetic stimulation. Synaptic contact of ARC POMC neurons with PAG GABAergic neurons should be also shown immunohistochemically for further conviction.
To assess the antinociceptive effect of EA, we also examined the real-time activity of PAG GABAergic neurons in mice upon exposure to heat after EA at different frequencies. Consistent with the GABA disinhibition hypothesis, 2 Hz EA had an inhibitory effect on PAG GABAergic neurons. Besides, the concentration of GABA in the PAG significantly decreased after 2 Hz EA. However, 100 Hz EA stimulation showed that different effect to PAG GABAergic neurons, which indicates the diversity mechanisms of different frequency EA mediates the PAG analgesia integrated center. This phenomenon is observed by other different research groups. The clearer regulation mechanism about this difference need to more in-depth investigation.
In this study we think this is induced by β-endorphin released from ARC POMC neurons projecting to PAG GABAergic neurons. As we all know, MOR is an inhibitory receptor that inhibits the activity of neurons. 41 We suggest that MOR on the surface of GABA neurons maybe inhibit the activity of GABAergic neurons through a series of protein signal transduction pathways, thus reducing the release of GABA, which need to be clarified in further study.
The potential role of the ARCPOMC-PAGGABA neural circuit in the antinociceptive effect of 2 Hz EA was further confirmed by the combination of chemogenetic manipulation and optogenetic manipulation. To date, optogenetic manipulation has not been used to study the antinociceptive effect of EA. Unlike chemogenetic manipulation, optogenetic manipulation allows instantaneous regulation of the activity of specific neural circuits and opens up causal investigation and specificity of rapid endogenous nervous system communication. The mechanisms of EA antinociceptive effect in the last decade predominately focused on cellular and molecular substrates and functional brain imaging. The use of optogenetic manipulation will greatly promote the EA development in neuroscience field.
EA-induced analgesia is essentially a manifestation of integrated processes in the CNS between afferent inputs from regions involved in pain processing and inputs from acupoints at the molecular level. Various signaling molecules contribute to mediating EA-induced analgesia, such as opioid peptides, cannabinoids, glutamate, 5-hydroxytryptamine, and cholecystokinin octapeptide. In our experiments, we performed EA after anesthetizing the mice, which was helpful for us to perform EA more conveniently and had been used in many researches,42,43 but we did not fully consider the effect of anesthesia on the pain signal pathway of mice. The extremely complex process, including peripheral nociceptors, dorsal root ganglion, spinal cord, and numerous brain regions are involved in neurotransmitter transmission. It has been proved that the analgesic effect of EA not only acts on the brain but also acts on other parts such as the spinal cord. 43 According to our results that β-FNA was injected individually into the Zusanli point (ST36), the spinal cord, and the ventricle, we were convinced that 2 Hz EA was more likely related to the highest level of nerve center than at the spinal cord level mediated by RVM, which was consistent with previous research. Professor Jisheng Han believes that low-frequency EA exerts antinociceptive effects at the level of above the spinal cord, while high-frequency EA exerts analgesic effects at the level of the spinal cord. As previously mentioned, 2 Hz EA significantly suppressed calcium signaling changes of PAGGABA neurons rather than 100 Hz EA. We are sure that EA at other frequencies would work in other parts, and even 2 Hz EA also exerts antinociceptive effects in other regions. However, our study focused on the antinociceptive effect of 2 Hz EA in the brain, especially from the ARC to the PAG neural circuit. We currently have no reliable means to rule out this possibility.
In summary, the current study demonstrated that β-endorphin transfer from ARC to PAG via ARCPOMC-PAGGABA neural circuit in the antinociceptive effect of EA. These findings enhance the understanding of the neural circuit underlying the antinociceptive effect of EA and provide guidance for optimizing stimulation parameters to improve the efficacy of EA in the treatment of pain.
Supplemental Material
Supplemental Material - Low-frequency electroacupuncture exerts antinociceptive effects through activation of POMC neural circuit induced endorphinergic input to the periaqueductal gray from the arcuate nucleus
Supplemental Material for Low-frequency electroacupuncture exerts antinociceptive effects through activation of POMC neural circuit induced endorphinergic input to the periaqueductal gray from the arcuate nucleus by Qian Wang, Zhonghao Li, Dengyun Nie, Xinru Mu, Yuxuan Wang, Yongwei Jiang, Yongchen Zhang, and Zhigang Lu in Molecular Pain
Footnotes
Authors’ contributions
D.Y.N., Z.H.L., Q.W., Z.Y.C. and Z.G.L. designed the research; Z.H.L., Q.W., D.Y.N., X.R.M., Y.X.W., Y.W.J. and Z.G.L. conducted the experiments and the data analysis. D.Y.N. and Z.H.L. drafted the manuscript. Z.Y.C. and Z.G.L. was responsible for the overall direction of the project and for edits to the manuscript.
Declaration of conflicting interests
The author(s) declared no potential conflicts of interest with respect to the research, authorship, and/or publication of this article.
Funding
The author(s) disclosed receipt of the following financial support for the research, authorship, and/or publication of this article: This work was supported by National Natural Science Foundation of China grant (82174498), Jiangsu Province Acupuncture-Moxibustion Integrated Education Ministry Key Laboratory Open Project (Grant numbers: AML202306), National Youth Qihuang Scholarship Development grant (2022), and Jiangsu Province’s Key Provincial Talents Program (2023). We are very grateful to Experiment center for science and technology, Nanjing University of Chinese Medicine.
Supplemental Material
Supplemental material for this article is available online.
References
Supplementary Material
Please find the following supplemental material available below.
For Open Access articles published under a Creative Commons License, all supplemental material carries the same license as the article it is associated with.
For non-Open Access articles published, all supplemental material carries a non-exclusive license, and permission requests for re-use of supplemental material or any part of supplemental material shall be sent directly to the copyright owner as specified in the copyright notice associated with the article.