
Abstract
Sensory neuron hyperexcitability is a critical driver of pathological pain and can result from axon damage, inflammation, or neuronal stress. G-protein coupled receptor signaling can induce pain amplification by modulating the activation of Trp-family ionotropic receptors and voltage-gated ion channels. Here, we sought to use calcium imaging to identify novel inhibitors of the intracellular pathways that mediate sensory neuron sensitization and lead to hyperexcitability. We identified a novel stimulus cocktail, consisting of the SSTR2 agonist L-054,264 and the S1PR3 agonist CYM5541, that elicits calcium responses in mouse primary sensory neurons in vitro as well as pain and thermal hypersensitivity in mice in vivo. We screened a library of 906 bioactive compounds and identified 24 hits that reduced calcium flux elicited by L-054,264/CYM5541. Among these hits, silymarin, a natural product derived from milk thistle, strongly reduced activation by the stimulation cocktail, as well as by a distinct inflammatory cocktail containing bradykinin and prostaglandin E2. Silymarin had no effect on sensory neuron excitability at baseline, but reduced calcium flux via Orai channels and downstream mediators of phospholipase C signaling. In vivo, silymarin pretreatment blocked development of adjuvant-mediated thermal hypersensitivity, indicating potential use as an anti-inflammatory analgesic.
Introduction
Sensitization of primary nociceptor neurons underlies inflammatory pain conditions. 1 Prior studies have elucidated specific mechanistic connections between individual G-protein coupled receptors and modulation of ion channels or ionotropic receptors that potentiate nociceptor activation. Most such investigations have focused on a relatively small number of metabotropic receptors, such as prostaglandin E2 (PGE2), nerve growth factor (NGF), and bradykinin (BK). These metabotropic receptors act primarily through protein kinase A (PKA), 2 protein kinase C (PKC), and mitogen activated protein kinase (MAPK) 3 signaling pathways, respectively, to increase nociceptor output via changes in the phosphorylation state and trafficking of ion channels and ionotropic receptors. However, because of the large number of metabotropic receptors present in nociceptors, there has been little capacity to address the broad influence of such receptors on pain sensitization.
We recently developed a methodology termed APPOINT (automated physiological phenotyping of individual neuronal types) that combines high throughput single cell calcium imaging, liquid handling, and automated analysis. 4 Using available activators of metabotropic receptors preferentially expressed in nociceptors, we performed an unbiased quantification of the contribution of individual metabotropic receptors to direct nociceptor activation. Surprisingly, even agonists traditionally associated with nociceptor sensitization, as opposed to direct nociceptor activation, yielded robust calcium flux. Furthermore, we observed strong activation across a wide range of metabotropic receptors, thus raising the question of whether such metabotropic receptors could contribute to both nociceptor sensitization and activation.
Screens to identify analgesic compounds have largely involved binding and other traditional assays. The ability to perform phenotypic screens to identify novel candidate analgesics in nociceptors has been limited because of practical considerations with regard to supply of primary neurons as well as difficulty in applying traditional physiological tools at sufficient resolution and scale for large numbers of compounds. For example, plate-based calcium imaging assays lack sufficient signal-to-noise to be feasible for even moderate sized screens in primary sensory neurons. Similarly, automated patch clamp requires large numbers of cells and has not been possible in primary neurons.
Leveraging our capacity to reliably activate nociceptors and quantify the activation in individual neurons at large scale, we developed and performed a screen to block nociceptor activation by metabotropic agonists. Because inflammatory activation occurs through a combination of mediators, often referred to as a “soup”, we balanced competing concerns: first, combining multiple activators to more closely model inflammatory sensitization as well as obtain hits capable of blocking downstream convergent targets, as opposed to simply an individual metabotropic receptor; second, restricting the number of activators in a cocktail to increase the probability of identifying hits. We opted for a cocktail of two compounds that activate distinct receptor classes; with this strategy, we would be well-positioned both to obtain a reasonable hit rate and to identify blockers of convergent signaling targets. We planned then to include assessment of hits that block activation by additional metabotropic agonists as part of the orthogonal validation of hits.
Our results demonstrate the ability to apply high-content phenotypic screening strategies using physiological readouts in primary neurons. We use this technique to identify a cocktail of metabotropic activators that we then validate as capable of inducing pain in vivo. We next use APPOINT to screen a moderate number of compounds and identify blockers of nociceptor activation by the cocktail. Our validation of these hits included not only demonstration of nociceptor activation block at relatively low compound concentrations but also a broad inhibition of nociceptor activation, extending to distinct metabotropic receptors that operate by different signaling pathways compared to the cocktail used to activate nociceptors in the screen. Finally, we show that one hit, silymarin, blocks pain in vivo using the complete Freund’s adjuvant (CFA) inflammatory pain model.
Materials and Methods
Mice
All animal protocols were approved by the MGH IACUC. Male and female mice (C57Bl6/J) from 2-8 weeks old were used for all experiments. For optogenetic activation experiments, Trpv1-Cre (Jax 017769)5,6 male mice were crossed with LSL-ChR2-EYFP (Jax 024109) 7 female mice and first-generation Trpv1/ChR2-EYFP pups were used for preparation of primary sensory neurons.
Primary DRG harvesting
Mice were euthanized by CO2 asphyxiation, followed by decapitation. Dorsal root ganglia (DRG; C1-L6, left and right) were quickly dissected into ice-cold DMEM/F-12 (Thermo Fisher 11320082) and dissociated using a solution of collagenase A (Sigma-Aldrich 10103578001, 2 mg/mL) and dispase (Thermo Fisher 17105041, 2 mg/mL) diluted in Hank’s Balanced Salt Solution (Thermo Fisher 14185052) for 60–90 min at 37°C, followed by mechanical trituration using a flame-polished Pasteur pipette. Dissociated cells were filtered using a 70 μm cell strainer (Thermo Fisher 22363548) and BSA gradient (Sigma-Aldrich A9576, 10% in PBS, centrifuge 12 min, 200 rcf). Cells were cultured in neurobasal media (Thermo Fisher 21103049) supplemented with B27 (Thermo Fisher 17504044), GlutaMax (Thermo Fisher 35050061), and Penicillin-Streptomycin (Thermo Fisher 15070063) overnight at 37°C in 96-well plates (Ibidi 89626) treated with poly-d-lysine (Sigma-Aldrich A-003-E, 1–2 hr at 37°C, 2 μL/well) followed by laminin (Thermo Fisher 23017015, 1–2 hr at 37°C, 2 μL/well). All primary sensory neurons were stained and imaged at 1 day in vitro.
Calcium imaging
Calcium imaging was performed as described previously. 4 Primary mouse sensory neurons obtained from female and male mice were stained with the calcium indicator Fluo4-AM for monitoring intracellular calcium concentration. Cells were washed once with physiological saline (in mM: 140 NaCl, 5 KCl, 2 CaCl2, 1 MgCl2, 10 D-glucose, 10 HEPES and pH 7.3–7.4 with NaOH) followed by incubation with Fluo4-AM (Thermo Fisher F14201, 3 μg/mL in 0.3% DMSO) in culture media in the dark at room temperature for 30 min. After 30 min, dye-containing media was removed and replaced with 100 μL of saline and immediately transferred to the imaging chamber. For optogenetics experiments, loading with the calcium indicator CalBryte-630a.m. (AAT Bioquest 20720, 3 μg/mL in 0.3% DMSO) followed the same protocol.
All calcium imaging experiments were conducted using an ImageXPress micro confocal high content imaging system (Molecular Devices) with automated robotic liquid handling. Cells were maintained at 37°C and with 5% CO2/O2 during imaging and were imaged (60 s/well) using widefield mode with 10x magnification at a frequency of 1 Hz in the center of each well. Asynchronous liquid dispensing was used for all stimulus applications. All stimuli were 20 μL and delivered at a rate of 5 μL/s. Stimulus concentrations are reported as the initial concentration applied. Doses for all stimuli are indicated in the main text and all stimuli and treatments were diluted in physiological saline, with DMSO (maximum 0.1%) or ethanol (maximum 0.1%) when necessary. Saline stimulation used the same physiological saline, with 0.1% DMSO or 0.1% ethanol when appropriate. DMSO and ethanol did not elicit any direct activation compared with saline alone.
Optogenetic stimuli consisted of five trains of increasing numbers of stimuli (1, 3, 5, 7, and 10 pulses per train) of 1 ms each, delivered at 50 Hz with 10 s between successive trains. CalBryte-630 intensity was measured at 5 Hz.
Cheek injection assay
The cheek injection assay was performed as described previously. 8 Mice were allowed to acclimate to cage apparatus for 2 h, with food and water provided. A white noise machine (Marpac) was used to reduce distractions from behavioral response. After habituation, mice were then immunized intradermally (i.d) in the right side of the cheek with 25 μL of vehicle or irritant under brief isoflurane anesthesia (2% in oxygen) using approximately equal numbers of female and male mice in each treatment group. All irritants were diluted in sterile 1x phosphate buffered saline. Mice were videotaped in isolation for 20 min and videos were then examined by a blinded experimenter for quantification of wiping (single ipsilateral paw to injected cheek) and scratching (ipsilateral hind paw to injected cheek). Data were quantified in 5-minute intervals.
Hargreaves’ radiant heat assay
We used a Plantar Analgesia Meter (IITC) to assess heat responses to radiant heat. Mice were placed in Plexiglas containers on an elevated glass plate and allowed to habituate for 1 hr prior to testing. A visible-light, radiant heat source was positioned beneath the mice and aimed using low-intensity visible light to the plantar surface of the hind paw. Trials began once the high-intensity light source was activated and ended once the mouse withdrew their hind paw and (1) shook their paw, (2) licked their paw, or (3) continued to withdraw their paw from stimulation. Immediately upon meeting response criteria, the high-intensity light-source was turned off. The latency to response was measured to the nearest 0.01 s for each trial using the built-in timer, which is activated and de-activated with the high-intensity beam. For all trials, high-intensity beam was set at 18%, low-intensity beam set at 10%, and maximum trial duration was 20 s. Three trials were conducted on each hind paw for each mouse per timepoint, with at least 1 min between trials of the same hind paw, and the median trial was used for each timepoint. All studies utilized approximately equal numbers of female and male mice in each treatment group.
Screen analysis
All calcium imaging experiments were analyzed using the APPOINT software, as described,
4
to quantify amplitudes of positive responses and percent of responsive cells. For analysis of the primary screen data, a summary effect score was calculated for each individual well according to the following formula

Effect scores were normalized within each independent batch according to the formula

Statistical analysis
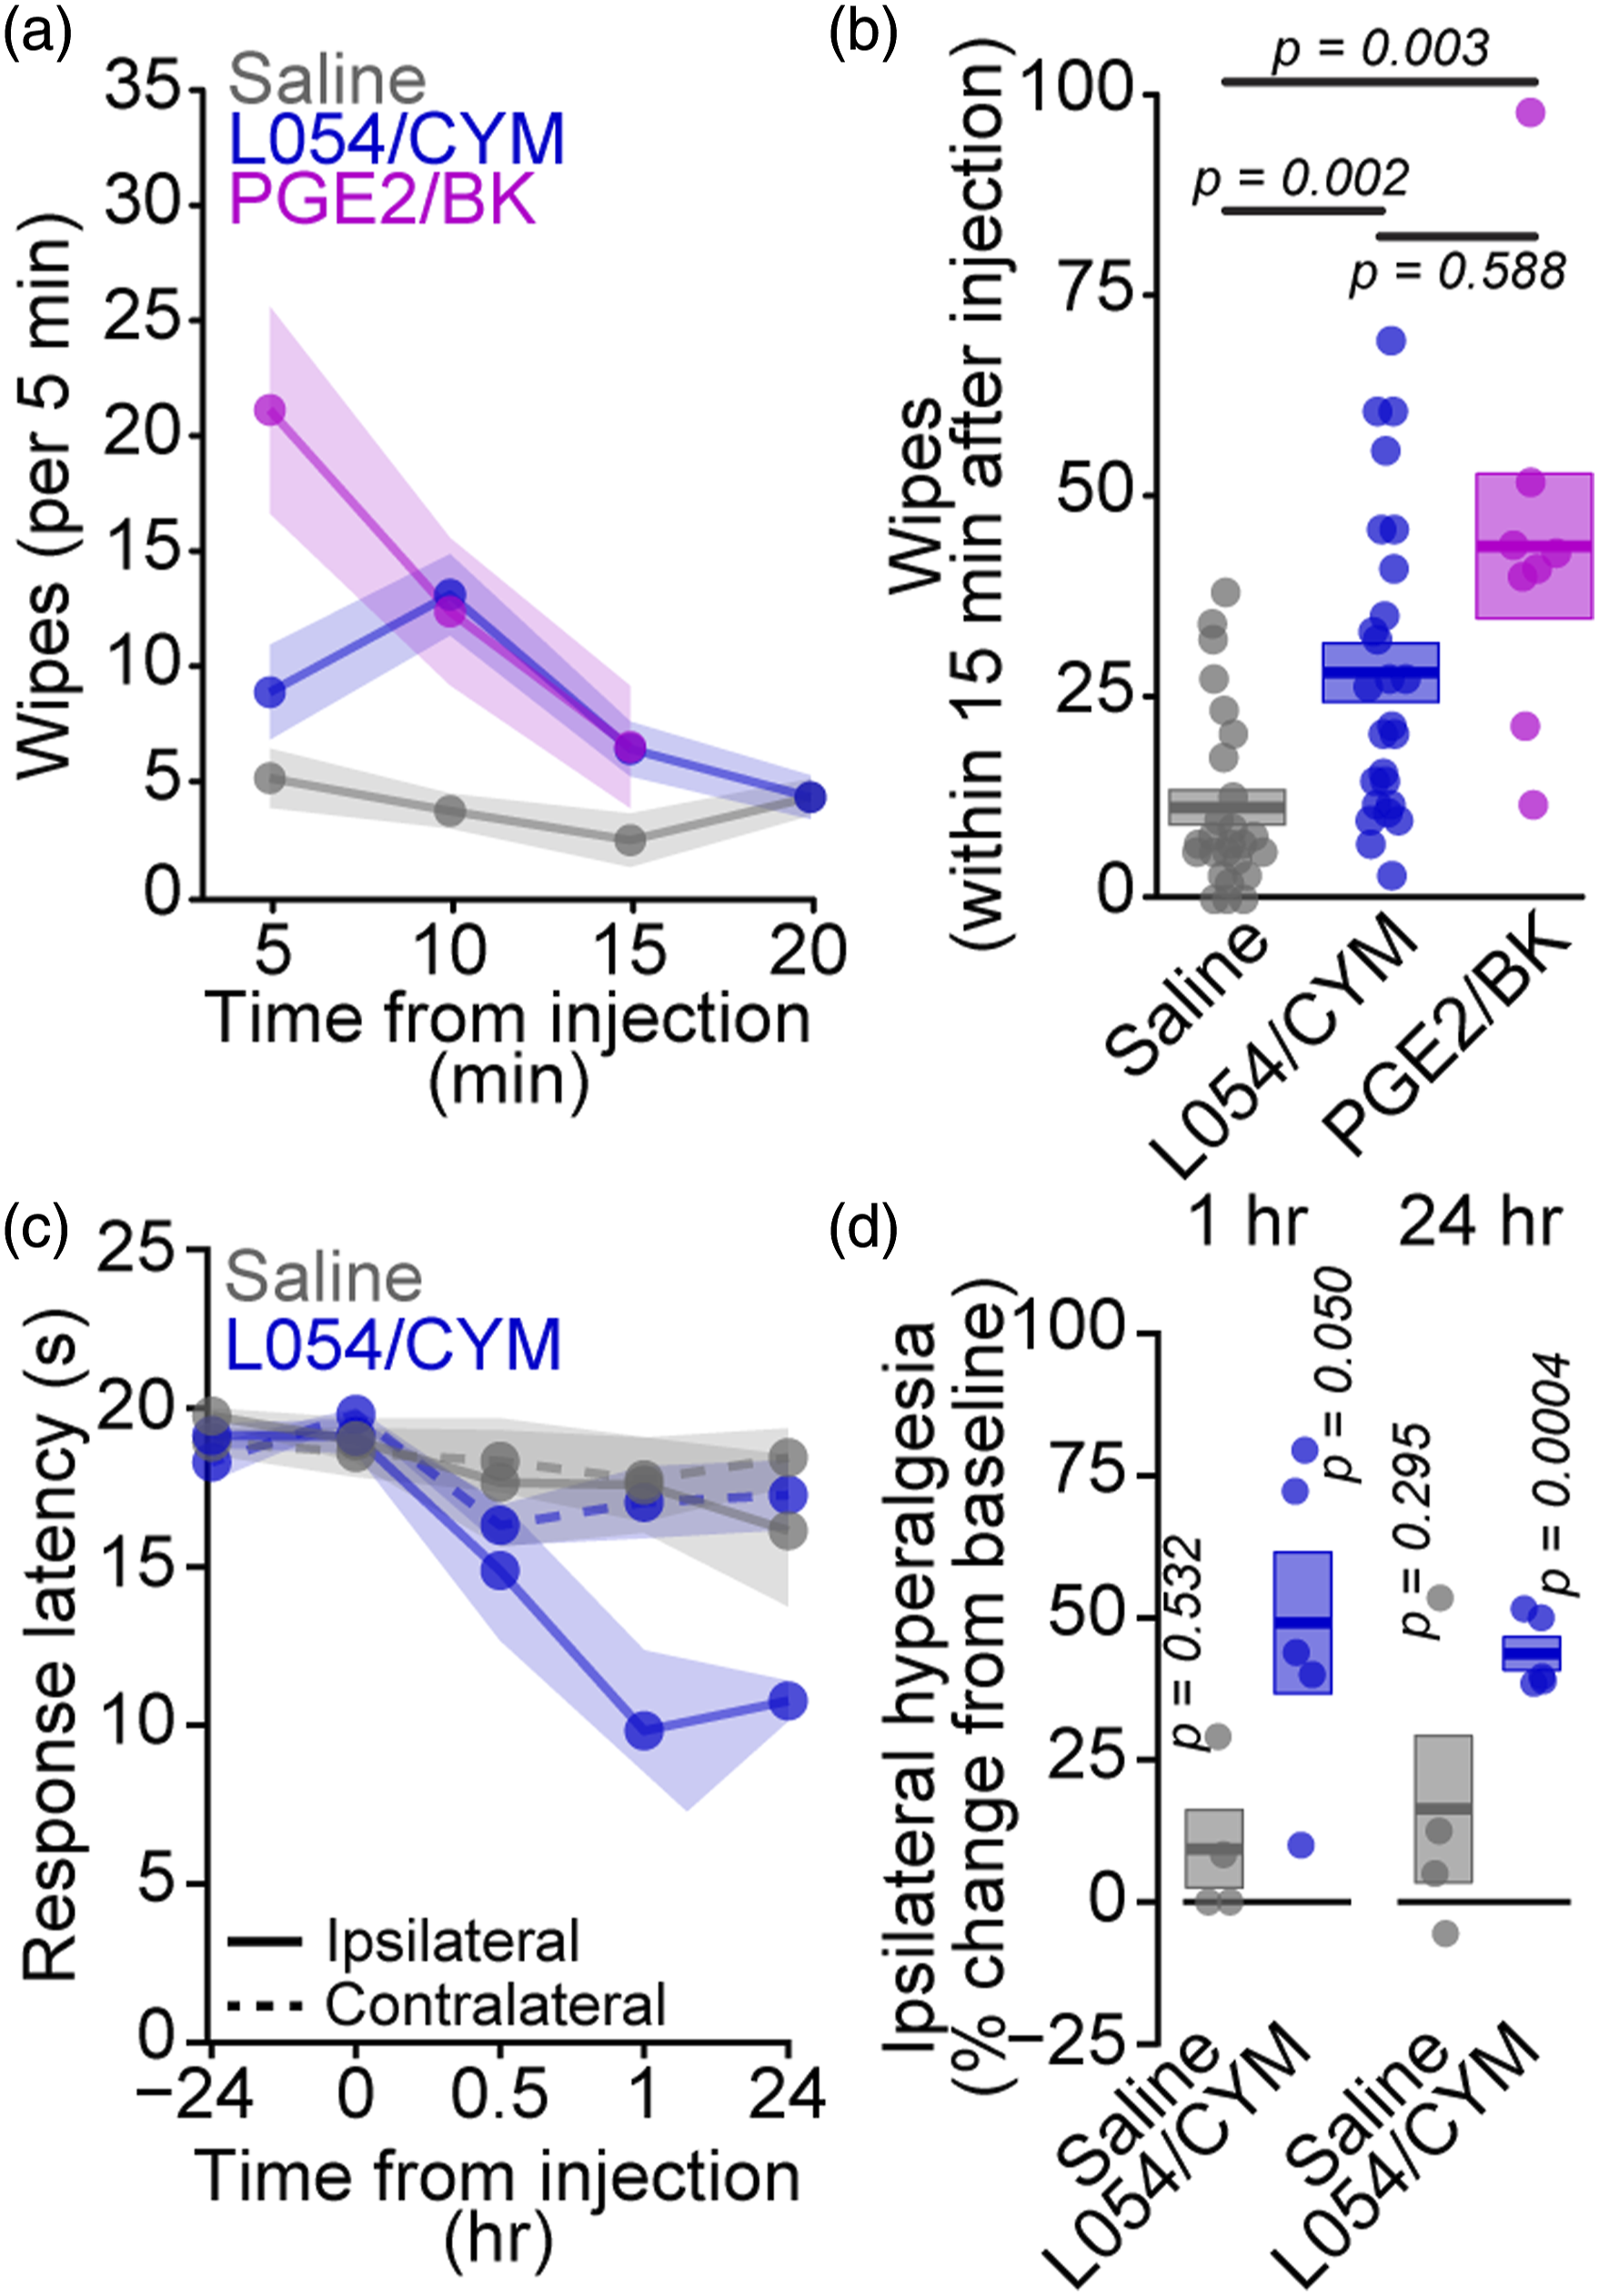
Statistical analysis was conducted in R (4.0.2)/RStudio (1.4.1106). Specific tests are indicated in the appropriate figure legends along with p-values indicating significance. For comparing cumulative probability distributions of peak response amplitudes (Figure 3(f) and (j) and Figure 4(e) and 4(f)), the Kolmogorov-Smirnov test was used, with Holm-Bonferroni adjustment to correct for multiple pre-specified comparisons. For assessing significance of hyperalgesia induced by in vivo L-054,264/CYM5541 (Figure 2(d)) and significance of inhibition of calcium responses (Figure 3(d),(h) and (l)), one-sample t-tests, with Holm-Bonferroni adjustment, were used. All remaining data were analyzed by ANOVA without multiple comparisons (Figure 3(g) and (k), Figure 4(b) and Figure 5(b) and (c)), Tukey HSD correction for post-hoc comparisons (Figure 1(f), Figure 2(b), S1b, Figure 4(e) and (f)), or Holm-Bonferroni adjustment for pre-specified comparisons (Figure 5(e),(f) and (g)). Identification of a robust agonist cocktail for calcium imaging-based phenotypic screen. (a) Traces of calcium responses to GPCR agonist cocktails or saline in individual primary mouse sensory neurons. (b) Percentage of sensory neurons activated by two-component cocktails of GPCR agonists as mean (line) and SEM (shaded region). L054/CYM (50 nM/10 μM): 34.9 ± 7.1%, n = 2412 cells from 8 wells; L054/Tre (50 nM/20 nM): 32.6 ± 4.6%, n = 2478 cells from 8 wells; Sul/Ang (50 ng*mL−1/50 ng*mL−1): 28.6 ± 6.4%, n = 2670 cells from 8 wells; Sul/Thr (50 ng*mL−1/50 ng*mL−1): 26.8 ± 6.5%, n = 2616 cells from 8 wells; L054/PGE2 (50 nM/1 mM): 20.1 ± 3.4%, n = 6331 cells from 48 wells; Sul/L054 (50 ng*mL−1/50 nM): 14 ± 2.1%, n = 2689 cells from 8 wells; PGE2/CYM (1 mM/10 μM): 9.4 ± 1.9%, n = 1127 cells from 16 wells; CYM/YY (10 μM/500 ng*mL−1): 6.6 ± 1.7%, n = 1153 cells from 16 wells; PGE2/YY (1 mM/500 ng*mL−1): 3.6 ± 0.7%, n = 1359 cells from 16 wells (c). Percentage of capsaicin-sensitive (200 nM) neurons activated by two-component cocktails of GPCR agonists as mean (line) and SEM (shaded region). L054/CYM: 36.2 ± 5.7% of nociceptors/35.1 ± 7.9% of non-nociceptors, n = 610 nociceptors/1802 non-nociceptors from 8 wells; L054/Tre: 15.6 ± 4.4% of nociceptors/36.9 ± 4.8% of non-nociceptors, n = 562 nociceptors/1916 non-nociceptors from 8 wells; Sul/Ang: 17 ± 4.5% of nociceptors/32 ± 6.9% of non-nociceptors, n = 712 nociceptors/1958 non-nociceptors from 8 wells; Sul/Thr: 19.3 ± 4% of nociceptors/28 ± 7.6% of non-nociceptors, n = 601 nociceptors/2015 non-nociceptors from 8 wells; L054/PGE2: 17.5 ± 2.5% of nociceptors/21.1 ± 3.9% of non-nociceptors, n = 1550 nociceptors/4781 non-nociceptors from 48 wells; Sul/L054: 13.4 ± 2.3% of nociceptors/14.3 ± 2.5% of non-nociceptors, n = 634 nociceptors/2055 non-nociceptors from 8 wells; PGE2/CYM: 22.2 ± 5.3% of nociceptors/7.6 ± 1.8% of non-nociceptors, n = 142 nociceptors/985 non-nociceptors from 16 wells; CYM/YY: 25.8 ± 7.1% of nociceptors/4 ± 1% of non-nociceptors, n = 151 nociceptors/1002 non-nociceptors from 16 wells; PGE2/YY: 7.7 ± 1.7% of nociceptors/2.3 ± 0.5% of non-nociceptors, n = 267 nociceptors/1092 non-nociceptors from 16 wells (d). Distributions of nociceptor activation rates by L054/CYM cocktail (blue) and saline (grey) at scale in two independent batches. Strictly standardized mean difference (SSMD, β) for batch #1: β = 2.05, and for batch 2: β = 1.78, across 48 wells per stimulus per batch. (e). Traces of calcium responses to L054/CYM or capsaicin following stimulation by thapsigargin (blue) or saline (grey) in individual primary mouse sensory neurons. (f). Percentage of sensory neurons activated by L054/CYM (left) or capsaicin (right) following stimulation by saline (grey) or thapsigargin (blue, 10 μM). Saline treatment, L054/CYM stimulation: 20.3 ± 2.3%, n = 16 wells, 1152 cells; Thapsigargin treatment, L054/CYM stimulation: 6.6 ± 1.3%, n = 16 wells, 1241 cells; Saline treatment, capsaicin stimulation: 33.3 ± 1.4%, n = 27 wells, 2423 cells; Thapsigargin treatment, capsaicin stimulation: 35.0 ± 2.0%, n = 26 wells, 2136 cells. Significance assessed by univariate ANOVA with Tukey HSD correction for multiple comparisons was for L054/CYM saline v thapsigargin p = 0.000004 and for capsaicin with saline v thapsigargin p = 0.787. Intradermal L054/CYM injection causes pain and thermal hyperalgesia in vivo. (a). Pain-related spontaneous wipe behavior elicited by intradermal cheek pad injection of saline (grey), L054/CYM (blue, 500 nM/100 μM), or PGE2/BK (magenta, 1 mM/90 μM) in 5-minute increments as mean (point/line) and SEM (shaded region). (b). Total wipes elicited by cheek pad injection within 15 min for individual mice (points) along with mean (line) and SEM (shaded region). Saline: 11.7 ± 2.2 wipes, n = 26 mice; L054/CYM: 28.8 ± 3.8 wipes, n = 26 mice; PGE2/BK: 44.9 ± 9.2 wipes, n = 8 mice. Significance assessed by univariate ANOVA with Tukey HSD correction for multiple comparisons was for saline v L054/CYM p = 0.002, for saline v PGE2/BK p = 0.003, and for L054/CYM v PGE2/BK p = 0.588. (c). Sensitivity of mouse hind paws to radiant heat ipsilateral (solid) and contralateral (dashed) to intraplantar injection of saline (grey) or L054/CYM (blue, 500 nM/100 μM) as mean (point/line) and SEM (shaded region). (d). Percent change from baseline at 1 hr (left) and 24 hr (right) in thermal sensitivity ipsilateral to intraplantar injection of saline (grey) or L054/CYM (blue) for individual mice (points) along with mean (line) and SEM (shaded region). Saline, 1 hr: 9.4 ± 6.9%, n = 4 mice; L054/CYM, 1 hr: 49.1 ± 12.4%, n = 5 mice; Saline, 24 hr: 16.4 ± 12.9%, n = 4 mice; L054/CYM, 24hr: 43.7 ± 2.9%, n = 5 mice. Significance of hyperalgesia >0% assessed by one sample t-test with Holm correction was for Saline, 1 hr: p = 0.532; L054/CYM, 1 hr: p = 0.050; Saline, 24 hr: p = 0.295; L054/CYM, 24 hr: p = 0.0004.
Results
Identification of an agonist cocktail suitable for high-throughput phenotypic screening
To identify a suitable agonist cocktail for identification of potential anti-inflammatory analgesics via phenotypic screening, we evaluated candidate cocktails consisting of metabotropic receptor agonists previously demonstrated to mobilize calcium in primary mouse neurons using APPOINT. 4 Four cocktails activated more than 25% of neurons, about a 10-fold increase over non-specific saline activation (Figure (a) and (b); L-054,264/CYM5541: 34.9 ± 2.5%, n = 8 wells, 2412 cells; L-054,264/Treprostinil: 32.6 ± 1.6%, n = 8 wells, 2478 cells; Sulprostone/Angiotensin: 28.6 ± 2.3%, n = 8 wells, 2670 cells; Sulprostone/Thrombin: 26.8 ± 2.3%, n = 8 wells, 2616 cells). Dividing neurons into nociceptors and non-nociceptors based on capsaicin-sensitivity,9,10 only L-054,264/CYM5541 among these four cocktails activated similar proportions of each cell type (Figure 1(c); 36.2 ± 5.7% of nociceptors and 35.1 ± 7.9% of non-nociceptors, n = 8 wells, 610 nociceptors, 1802 non-nociceptors). The other cocktails showed more biased activation of capsaicin-insensitive neurons (Figure 1(c); L054/Tre: 15.6 ± 4.4% of nociceptors and 36.9 ± 4.8% of non-nociceptors, n = 8 wells, 562 nociceptors, 1916 non-nociceptors; Sul/Ang: 17 ± 4.5% of nociceptors and 32 ± 6.9% of non-nociceptors, n = 8 wells, 712 nociceptors, 1958 non-nociceptors; Sul/Thr: 19.3 ± 4% of nociceptors and 28 ± 7.6% of non-nociceptors, n = 8 wells, 601 nociceptors, 2015 non-nociceptors). At full scale in 2 independent batches, calcium activation within capsaicin-sensitive nociceptors elicited by L-054,264/CYM5541 stimulation was robust (Figure 1(d)), with large strictly standardized mean difference 11 β values relative to activation rates elicited by saline (Batch #1: β = 2.05; Batch #2: β = 1.78).
To understand the mechanism of L-054,264/CYM5541-mediated calcium responses, we evaluated sensitivity to the calcium store inhibitor thapsigargin (Figure 1(e)). 12 Thapsigargin strongly reduced the L-054,264/CYM5541-mediated calcium response in capsaicin-sensitive nociceptors, without decreasing the capsaicin-dependent calcium response (Figure 1(f); L-054,264/CYM5541 with saline: 20.3 ± 2.3%, n = 16 wells, 1152 cells; L-054,264/CYM5541 with thapsigargin: 6.6 ± 1.3%, n = 16 wells, 1241 cells, p = 0.007 by ANOVA with Tukey HSD; Capsaicin with Saline: 33.3 ± 1.4%, n = 27 wells, 2423 cells; Capsaicin with Thapsigargin: 35.0 ± 2.0%, n = 26 wells, 2136 cells, p = 0.999 by ANOVA with Tukey HSD). These data indicate that L-054,264/CYM5541 primarily induces release of calcium from intracellular storage.
Agonist cocktail containing L-054,264 and CYM5541 induces pain and thermal hypersensitivity in mice
To assess the effects of L-054,264/CYM5541 on pain-related behaviors, we quantified spontaneous pain elicited by intradermal inoculation using the cheek injection assay, 13 as well as changes in thermal sensitivity following intraplantar injection using Hargreaves’ radiant heat assay. 14 In the cheek injection assay, the frequency of forepaw wipe and hindpaw scratch behaviors are used to assess pain and itch, respectively. Intradermal inoculation with L-054,264/CYM5541 (Figure 2(a) and (b)) elicited significantly greater wiping behavior than saline (saline: 11.7 ± 2.2 wipes, n = 26 mice; L054/CYM: 28.8 ± 3.8 wipes, n = 26 mice; p = 0.002) and at comparable levels to a cocktail composed of prostaglandin E2 (PGE2) and bradykinin (BK, 44.9 ± 9.2 wipes, n = 8 mice, p = 0.588).15,16 Neither cocktail elicited significant scratching behavior (Supplemental figure 1).
Intraplantar injection of L-054,264/CYM5541 (500 nM/100 μM) increased sensitivity of the ipsilateral hindpaw to radiant heat (Figure 2(c) and (d)) at 1 hr (49.1 ± 12.4%, p = 0.050) and 24 hr (43.7 ± 2.9%, p = 0.0004) after injection, whereas intraplantar saline had no effect (1 hr: 9.4 ± 6.9%, p = 0.532; 24 hr: 16.4 ± 12.9%, p = 0.295). Together, these data indicate that L-054,264/CYM5541 directly activates calcium flux in nociceptors leading to pain and thermal hyperalgesia in vivo, and thus is a biologically-relevant stimulus for phenotypic screening.
Primary screen of bioactive compounds that inhibit calcium responses to L-054,264/CYM5541
To identify compounds with anti-inflammatory analgesic activity, we screened 906 unique compounds from the Selleck bioactive compound library in duplicate. We quantified activation of primary mouse sensory neurons by L-054,264/CYM5541 stimulation using the APPOINT platform
4
and generated a summary effect score encompassing the percentage of cocktail-activated neurons, the percentage of capsaicin-sensitive nociceptors as an internal counter-screen, the total number of live neurons per well, and the percentage of non-specific activation by liquid dispensing (see Materials and Methods for details). Positive and negative control conditions, omission of L-054,264/CYM5541 stimulus and pretreatment with 0.1% DMSO, respectively, were included in each replicate batch; the difference between effect scores for positive and negative control wells was consistent across the screen (Figure 3(a)). Within each batch, average effect scores for positive and negative control wells were clearly separated (Figure 3(b), negative control wells: 0.02 ± 0.02 AU; positive control wells: 0.96 ± 0.02 AU). Each library compound was applied at 10 μM for 3 hrs prior to calcium imaging and the average effect score remained consistent across the screen duration (Figure 3(c)). Hits were identified as compounds with a z-score greater than 2 and, in total, 24 compounds significantly reduced sensory neuron activation by L-054,264/CYM5541. We selected 10 promising hits to validate with additional replicates (Figure 3(d)) and found that 80% validated (NSC697923: 80.7 ± 12.9% inhibition, n = 8 wells, p = 0.004; Nifedipine: 74.2 ± 12.3% inhibition, n = 8 wells, p = 0.005; Silymarin: 70.9 ± 15.7% inhibition, n = 8 wells, p = 0.017; BMS833923: 70.7 ± 12.5% inhibition, n = 8 wells, p = 0.006; Magnolol: 68.8 ± 13.9% inhibition, n = 8 wells, p = 0.012; Vanillylacetone: 60.8 ± 14.3% inhibition, n = 8 wells, p = 0.019; Benzbromarone: 60.1 ± 16.5% inhibition, n = 8 wells, p = 0.033; NSC405020: 54.5 ± 15.2% inhibition, n = 8 wells, p = 0.027; +JQ1: 38 ± 15.7% inhibition, n = 8 wells, p = 0.093; GZD824: 33.7 ± 14.1% inhibition, n = 8 wells, p = 0.096). Phenotypic screen identifies silymarin as inhibitor of GPCR-related calcium responses. (a). Effect scores for individual positive (green, no L054/CYM cocktail) and negative (red, 0.1% DMSO vehicle) control wells (points) across the screen duration along with running mean (line) and SEM (shaded region). (b). Average effect score of positive (green, no L054/CYM cocktail) and negative (red, 0.1% DMSO vehicle) control wells for each independent plate (points) along with mean (line) and SEM (shaded region). Effect scores for negative control wells: 0.02 ± 0.02 and positive control wells: 0.96 ± 0.02. (c). Effect scores for individual library compounds (points) along with running mean (line) and SEM (shaded region). Compounds with z-score > 2 (green) or < −2 (red) are highlighted. (d). Percent inhibition of L054/CYM-mediated (50 nM/10 μM) calcium responses by ten cherry-picked hits as mean (line) and SEM (shaded region) each at 10 μM. NSC697923: 80.7 ± 12.9% inhibition, n = 8 wells; Nifedipine: 74.2 ± 12.3% inhibition, n = 8 wells; Silymarin: 70.9 ± 15.7% inhibition, n = 8 wells; BMS833923: 70.7 ± 12.5% inhibition, n = 8 wells; Magnolol: 68.8 ± 13.9% inhibition, n = 8 wells; Vanillylacetone: 60.8 ± 14.3% inhibition, n = 8 wells; Benzbromarone: 60.1 ± 16.5% inhibition, n = 8 wells; NSC405020: 54.5 ± 15.2% inhibition, n = 8 wells; +JQ1: 38 ± 15.7% inhibition, n = 8 wells; GZD824: 33.7 ± 14.1% inhibition, n = 8 wells. Significance of inhibition >0% assessed by t-test with Holm correction was for NSC697923: p = 0.004; Nifedipine: p = 0.005; BMS833923: p = 0.006; Magnolol: p = 0.012; Silymarin: p = 0.017; Vanillylacetone: p = 0.019; Benzbromarone: p = 0.033; NSC405020: p = 0.027; +JQ1: p = 0.093; GZD824: p = 0.096. (e). Traces of calcium responses to L054/CYM and capsaicin (200 nM) in individual neurons (lines) following treatment with increasing doses of silymarin. (f). Cumulative probability distributions of response amplitudes to L054/CYM stimulation following treatment with increasing doses of silymarin. Significance assessed by Kolmogorov-Smirnov with Holm correction for multiple comparisons was for 0.01 μM (n = 306 cells from 6 wells) v 0.03 μM (n = 317 cells from 6 wells): p = 0.985; 0.03 μM v 0.05 μM (n = 384 cells from 6 wells): p = 0.650; 0.05 μM v 0.1 μM (n = 453 cells from 18 wells): p = 0.022; 0.1 μM v 0.3 μM (n = 450 cells from 6 wells): p = 0.0010; 0.3 μM v 0.5 μM (n = 702 cells from 19 wells): p = 8.8*10−12; 0.5 μM v 1 μM (n = 842 cells from 31 wells): p = 0.484; 1 μM v 10 μM (n = 634 cells from 25 wells): p = 0.046. (g). Percentage of L054/CYM-sensitive sensory neurons in individual wells (points) following treatment with vehicle (grey) or increasing doses of silymarin along with mean (line) and SEM (shaded region). Significance for main effect of dose assessed by ANOVA was p = 0.0324. (h). Percent inhibition of L054/CYM-induced calcium responses by increasing doses of silymarin in individual wells (points) along with mean (line) and SEM (shaded region). Significance of inhibition for each dose assessed by one-sample t-test with Holm correction for multiple comparisons was for 0.01 μM: n = 6 wells, p = 0.177; 0.03 μM: n = 6 wells, p = 0.093; 0.05 μM: n = 6 wells, p = 0.125; 0.1 μM: n = 6 wells, p = 0.138; 0.3 μM: n = 6 wells, p = 0.124; 0.5 μM: n = 10 wells, p = 0.020; 1 μM: n = 10 wells, p = 0.003; 10 μM: n = 4 wells, p = 0.094. (i). Traces of calcium responses to PGE2/BK and capsaicin in individual neurons (lines) following treatment with increasing doses of silymarin. (j). Cumulative probability distributions of response amplitudes to PGE2/BK (1 mM/90 μM) stimulation following treatment with increasing doses of silymarin. Significance assessed by Kolmogorov-Smirnov with Holm correction for multiple comparisons was for 0.01 μM (n = 1051 cells from 12 wells) v 0.03 μM (n = 835 cells from 12 wells): p = 0.182; 0.03 μM v 0.05 μM (n = 876 cells from 12 wells): p = 0.004; 0.05 μM v 0.1 μM (n = 1111 cells from 12 wells): p = 0.795; 0.1 μM v 0.3 μM (n = 1080 cells from 12 wells): p = 0.007; 0.3 μM v 0.5 μM (n = 667 cells from 12 wells): p = 0.021; 0.5 μM v 1 μM (n = 1330 cells from 21 wells): p = 0.141. (k). Percentage of PGE2/BK-sensitive sensory neurons in individual wells (points) following treatment with vehicle (grey) or increasing doses of silymarin along with mean (line) and SEM (shaded region). Significance for main effect of dose assessed by ANOVA was p = 0.004. (l). Percent inhibition of PGE2/BK-induced calcium responses by increasing doses of silymarin in individual wells (points) along with mean (line) and SEM (shaded region). Significance of inhibition for each dose assessed by one-sample t-test with Holm correction for multiple comparisons was for 0.01 μM: n = 12 wells, p = 0.115; 0.03 μM: n = 12 wells, p = 0.010; 0.05 μM: n = 12 wells, p = 0.002; 0.1 μM: n = 12 wells, p = 0.118; 0.3 μM: n = 12 wells, p = 0.181; 0.5 μM: n = 12 wells, p = 0.005; 1 μM: n = 12 wells, p = 0.153.
Of particular interest, three of the top hits with validated inhibition of L-054,264/CYM5541-mediated calcium responses, were natural products (silymarin, magnolol, and vanillylacetone). Based on a significant literature evaluating effects in patients,17–21 as well as a favorable toxicity and pharmacokinetic profile, we elected to focus our follow-up validation studies on silymarin. We quantified the effects of eight doses of silymarin on both the amplitude of L-054,264/CYM5541-evoked calcium responses (Figure 3(e) and (f)) and the percentage of L-054,264/CYM5541-sensitive neurons (Figure 3(g) and (h)). We observed a striking dose-dependent decrease in L-054,264/CYM5541-evoked response amplitudes (Figure 3(f)), with a minimal effective dose of 100 nM (p = 0.022). Similarly, as low as 500 nM silymarin significantly reduced the percentage of L-054,264/CYM5541-sensitive neurons (Figure 3(g) and (h), p = 0.020), with each lower dose showing a similar effect size, but high variability. To determine if silymarin reduces activation by an orthogonal GPCR cocktail, we also tested seven doses of silymarin on PGE2/BK-evoked calcium responses (Figure 3(i-l)). We did not observe any effect of silymarin on PGE2/BK-evoked response amplitudes (Figure 3(j)), but silymarin reduced the percentage of PGE2/BK-sensitive neurons (Figure 3(l)), with a minimal effective dose of 30 nM (p = 0.01). These data indicate that silymarin significantly reduces calcium signaling downstream of two independent GPCR agonist cocktails.
Silymarin reduces calcium signaling via Orai channels and phospholipase C signaling in nociceptors
To identify the potential mechanisms by which silymarin reduces calcium signaling, we evaluated effects on other activation modalities. We first evaluated the effect of silymarin on optical rheobase (Figure 4(a)) using the previously described all-optical rheobase assay, which recruits physiologically-relevent NaV, KV, and CaV channels.
4
We observed no effect of silymarin on light-dependent activation of Trpv1-lineage nociceptors (Figure 4(b)), indicating that silymarin does not directly modulate neuronal excitability. Silymarin inhibits intracellular calcium signaling without affecting nociceptor excitability. (a). Traces of calcium responses to stimulation by ascending intensity trains of blue light in individual Trpv1/ChR2-EYFP sensory neurons following treatment with either vehicle (grey) or silymarin (10 μM, blue). (b). Percent activation by trains of blue light following treatment with vehicle (grey) or silymarin (blue) as mean (point/line) and SEM (shaded region). Significance for main effect of treatment with vehicle (n = 66 wells) v silymarin (n = 58 wells) assessed by ANOVA was p = 0.519 and for interaction between treatment and train length was p = 0.992. (c). Direct activation of calcium responses via specific intracellular signaling pathways. Blue arrows indicate calcium ion flow and red text indicates tested agonists. (d). Traces of calcium responses elicited in capsaicin-sensitive sensory neurons by 2-APB (left), m-3M3FBS (middle), or caffeine (right) following treatment with vehicle (grey) or silymarin (1 μM, blue). (e–f). Effects of silymarin (blue) on calcium response amplitude as cumulative probability distribution (left) and percentage of responsive cells (right) in individual wells (points) along with mean (line) and SEM (shaded region) to stimulation by 2-APB (top, 30 μM), m-3M3FBS (middle, 100 μM), or caffeine (bottom, 50 mM) in all sensory neurons (e) or capsaicin-sensitive (200 nM) nociceptors (f). Significance of change in response amplitude assessed by Kolmogorov-Smirnov with Holm correction for multiple comparisons was for 2-APB among all neurons: n = 771 dmso-treated, 991 silymarin-treated neurons, p = 0.305; m-3M3FBS among all neurons: n = 331 dmso-treated, 346 silymarin-treated neurons, p = 0.511; caffeine among all neurons: n = 1428 dmso-treated, 1411 silymarin-treated neurons, p = 0.0004; 2-APB among nociceptors: n = 403 dmso-treated, 513 silymarin-treated nociceptors, p = 0.040; m-3M3FBS among nociceptors: n = 161 dmso-treated, 167 silymarin-treated nociceptors, p = 0.024; caffeine among nociceptors: n = 542 dmso-treated, 470 silymarin-treated nociceptors, p = 0.374. Significance of change in percent responders assessed by ANOVA with Tukey HSD correction was for 2-APB among all neurons: n = 14 dmso-treated, 17 silymarin-treated wells, p = 0.969; m-3M3FBS among all neurons: n = 14 dmso-treated, 17 silymarin-treated wells, p = 0.986; caffeine among all neurons: n = 14 dmso-treated, 17 silymarin-treated wells, p = 0.994; 2-APB among nociceptors: n = 14 dmso-treated, 17 silymarin-treated wells, p = 0.723; m-3M3FBS among nociceptors: n = 14 dmso-treated, 17 silymarin-treated wells p = 0.999; caffeine among nociceptors: n = 14 dmso-treated, 17 silymarin-treated wells, p = 0.999.
Since L-054,264/CYM5541 primarily mediates release of calcium from intracellular stores, we sought to identify agonists that directly activate specific pathways related to intracellular calcium storage in order to assess the assess the effect of silymarin more specifically (Figure 4(c)). Ryanodine receptors (RyR) and inositol triphosphate receptors (IP3R) are the two principal pathways of calcium release from intracellular storage and can be activated by caffeine and phospholipase C via m-3M3FBS, respectively.22–24 Orai channels are the primary mechanism by which calcium stores are refilled and can be activated by 2-APB. 25 All three of these agonists directly activate calcium responses in primary mouse sensory neurons (Figure 4(d)), including capsaicin-sensitive nociceptors. We assessed the effects of silymarin on the amplitude and percentage of responsive cells among all neurons (Figure 4(e)), as well as specifically within capsaicin-sensitive nociceptors (Figure 4(f)). Silymarin pretreatment did not alter the percentage of neurons or nociceptors activated by any of the stimuli and had no effect on the amplitude of 2-APB- or m-3M3FBS-mediated calcium responses among all neurons (2-APB: p = 0.305, m-3M3FBS: p = 0.511). Silymarin reduced the amplitude of caffeine-mediated responses (p = 0.0004) among all neurons, although the small effect size likely indicates little biological significance. Within capsaicin-sensitive nociceptors, however, silymarin significantly reduced the amplitude of both 2-APB- and m-3M3FBS-mediated responses (2-APB: p = 0.040, m-3M3FBS: p = 0.024), without reducing caffeine-evoked response amplitudes (p = 0.374). These data suggest that silymarin reduces PLC-dependent store-mediated calcium release and inhibits store refilling via Orai channels specifically within nociceptors, without directly modifying nociceptor excitability.
Silymarin specifically blocks development of heat hyperalgesia in a mouse model of inflammatory pain
To assess the effect of silymarin on acute and inflammatory pain behaviors, we administered silymarin via intraperitoneal injection and evaluated (1) spontaneous pain using the cheek injection assay (Figure 5(a)), (2) thermal sensitivity using Hargreaves’ radiant heat assay (Figure 5(d)), and (3) heat hyperalgesia using the complete Freund’s adjuvant (CFA) model of inflammatory pain (Figure 5(d)). Silymarin treatment 2 hours prior to intradermal inoculation with either L-054,264/CYM5541 (Figure 5(b), p = 0.892) or PGE2/BK (Figure 5(c), p = 0.892) had no effect on spontaneous wipe behavior, indicating that silymarin does not reduce pain directly. Similarly, silymarin does not directly alter sensitivity to heat within 2 hrs of injection (Figure 5(e), p = 0.096). However, when silymarin is administered 2 hrs prior to intraplantar injection of CFA, there is a strong reduction in the thermal hyperalgesia that develops 24 h later (Figure 5(f), 71% reduction, p = 0.012). After thermal hyperalgesia has developed, silymarin treatment has no effect at reducing pathological hyperalgesia within 2 hrs of administration (Figure 5(g), p = 0.563). These data suggest that silymarin specifically reduces the initiation of nociceptor sensitization related to inflammatory signaling, without interfering with acute pain or thermal sensitivity, and may act as a prophylactic therapy in settings where inflammatory sensitization may be expected to occur, or where chronic inflammation maintains peripheral sensitization. Silymarin specifically inhibits development of inflammatory thermal hyperalgesia (a). Experimental overview for in vivo evaluation of effect of silymarin on irritant-induced wiping behavior. (b). Effects of intraperitoneal (i.p.) saline (grey) and silymarin (blue, 50 mg/kg) on wipe behavior induced by intradermal (i.d.) cheek pad injection of L054/CYM in 5-minute intervals (left) as mean (point/line) and SEM (shaded region) and total within 15 min (right) for individual mice (points) along with mean (line) and SEM (shaded region). Saline: 40 ± 7 wipes, n = 8 mice; Silymarin: 32 ± 6 wipes, n = 8 mice. Significance assessed by ANOVA was p = 0.892. (c). Effects of intraperitoneal saline (grey) and silymarin (blue) on wipe behavior induced by intradermal cheek pad injection of PGE2/BK in 5-minute intervals (left) as mean (point/line) and SEM (shaded region) and total within 15 min (right) for individual mice (points) along with mean (line) and SEM (shaded region). Saline: 45 ± 10 wipes, n = 8 mice; Silymarin: 37 ± 9 wipes, n = 8 mice. Significance assessed by ANOVA was p = 0.892. (d). Experimental overview for in vivo evaluation of effects of silymarin on thermal sensitivity and CFA-mediated thermal hyperalgesia. (e). Effects of intraperitoneal saline (grey) and silymarin (blue) on thermal sensitivity (left) in naïve mice as mean (point/line) and SEM (shaded region) along with total analgesia for individual mice (points) and mean (line) and SEM (shaded region). Saline: 4.07 ± 2.00 AU, n = 8 mice; Silymarin: −0.92 ± 0.82 AU, n = 7 mice. Significance assessed by ANOVA with Holm correction for multiple comparisons was p = 0.096. (f). Effects of intraperitoneal saline (grey) and silymarin (blue) on induction of thermal hyperalgesia by CFA (left) in naïve mice as mean (point/line) and SEM (shaded region) along with percent hyperalgesia for individual mice (points) and mean (line) and SEM (shaded region). Saline: 77.8 ± 2.5%, n = 4 mice; Silymarin: 22.3 ± 11.9%, n = 4 mice. Significance assessed by ANOVA with Holm correction for multiple comparisons was p = 0.012. (g). Effects of intraperitoneal saline (grey) and silymarin (blue) on established thermal hyperalgesia (left) 24 hr after intraplantar (i.pl.) CFA as mean (point/line) and SEM (shaded region) along with total analgesia for individual mice (points) and mean (line) and SEM (shaded region). Saline: 5.76 ± 2.77 AU, n = 7 mice; Silymarin: 7.78 ± 2.06 AU, n = 8 mice. Significance assessed by ANOVA with Holm correction for multiple comparisons was p = 0.563.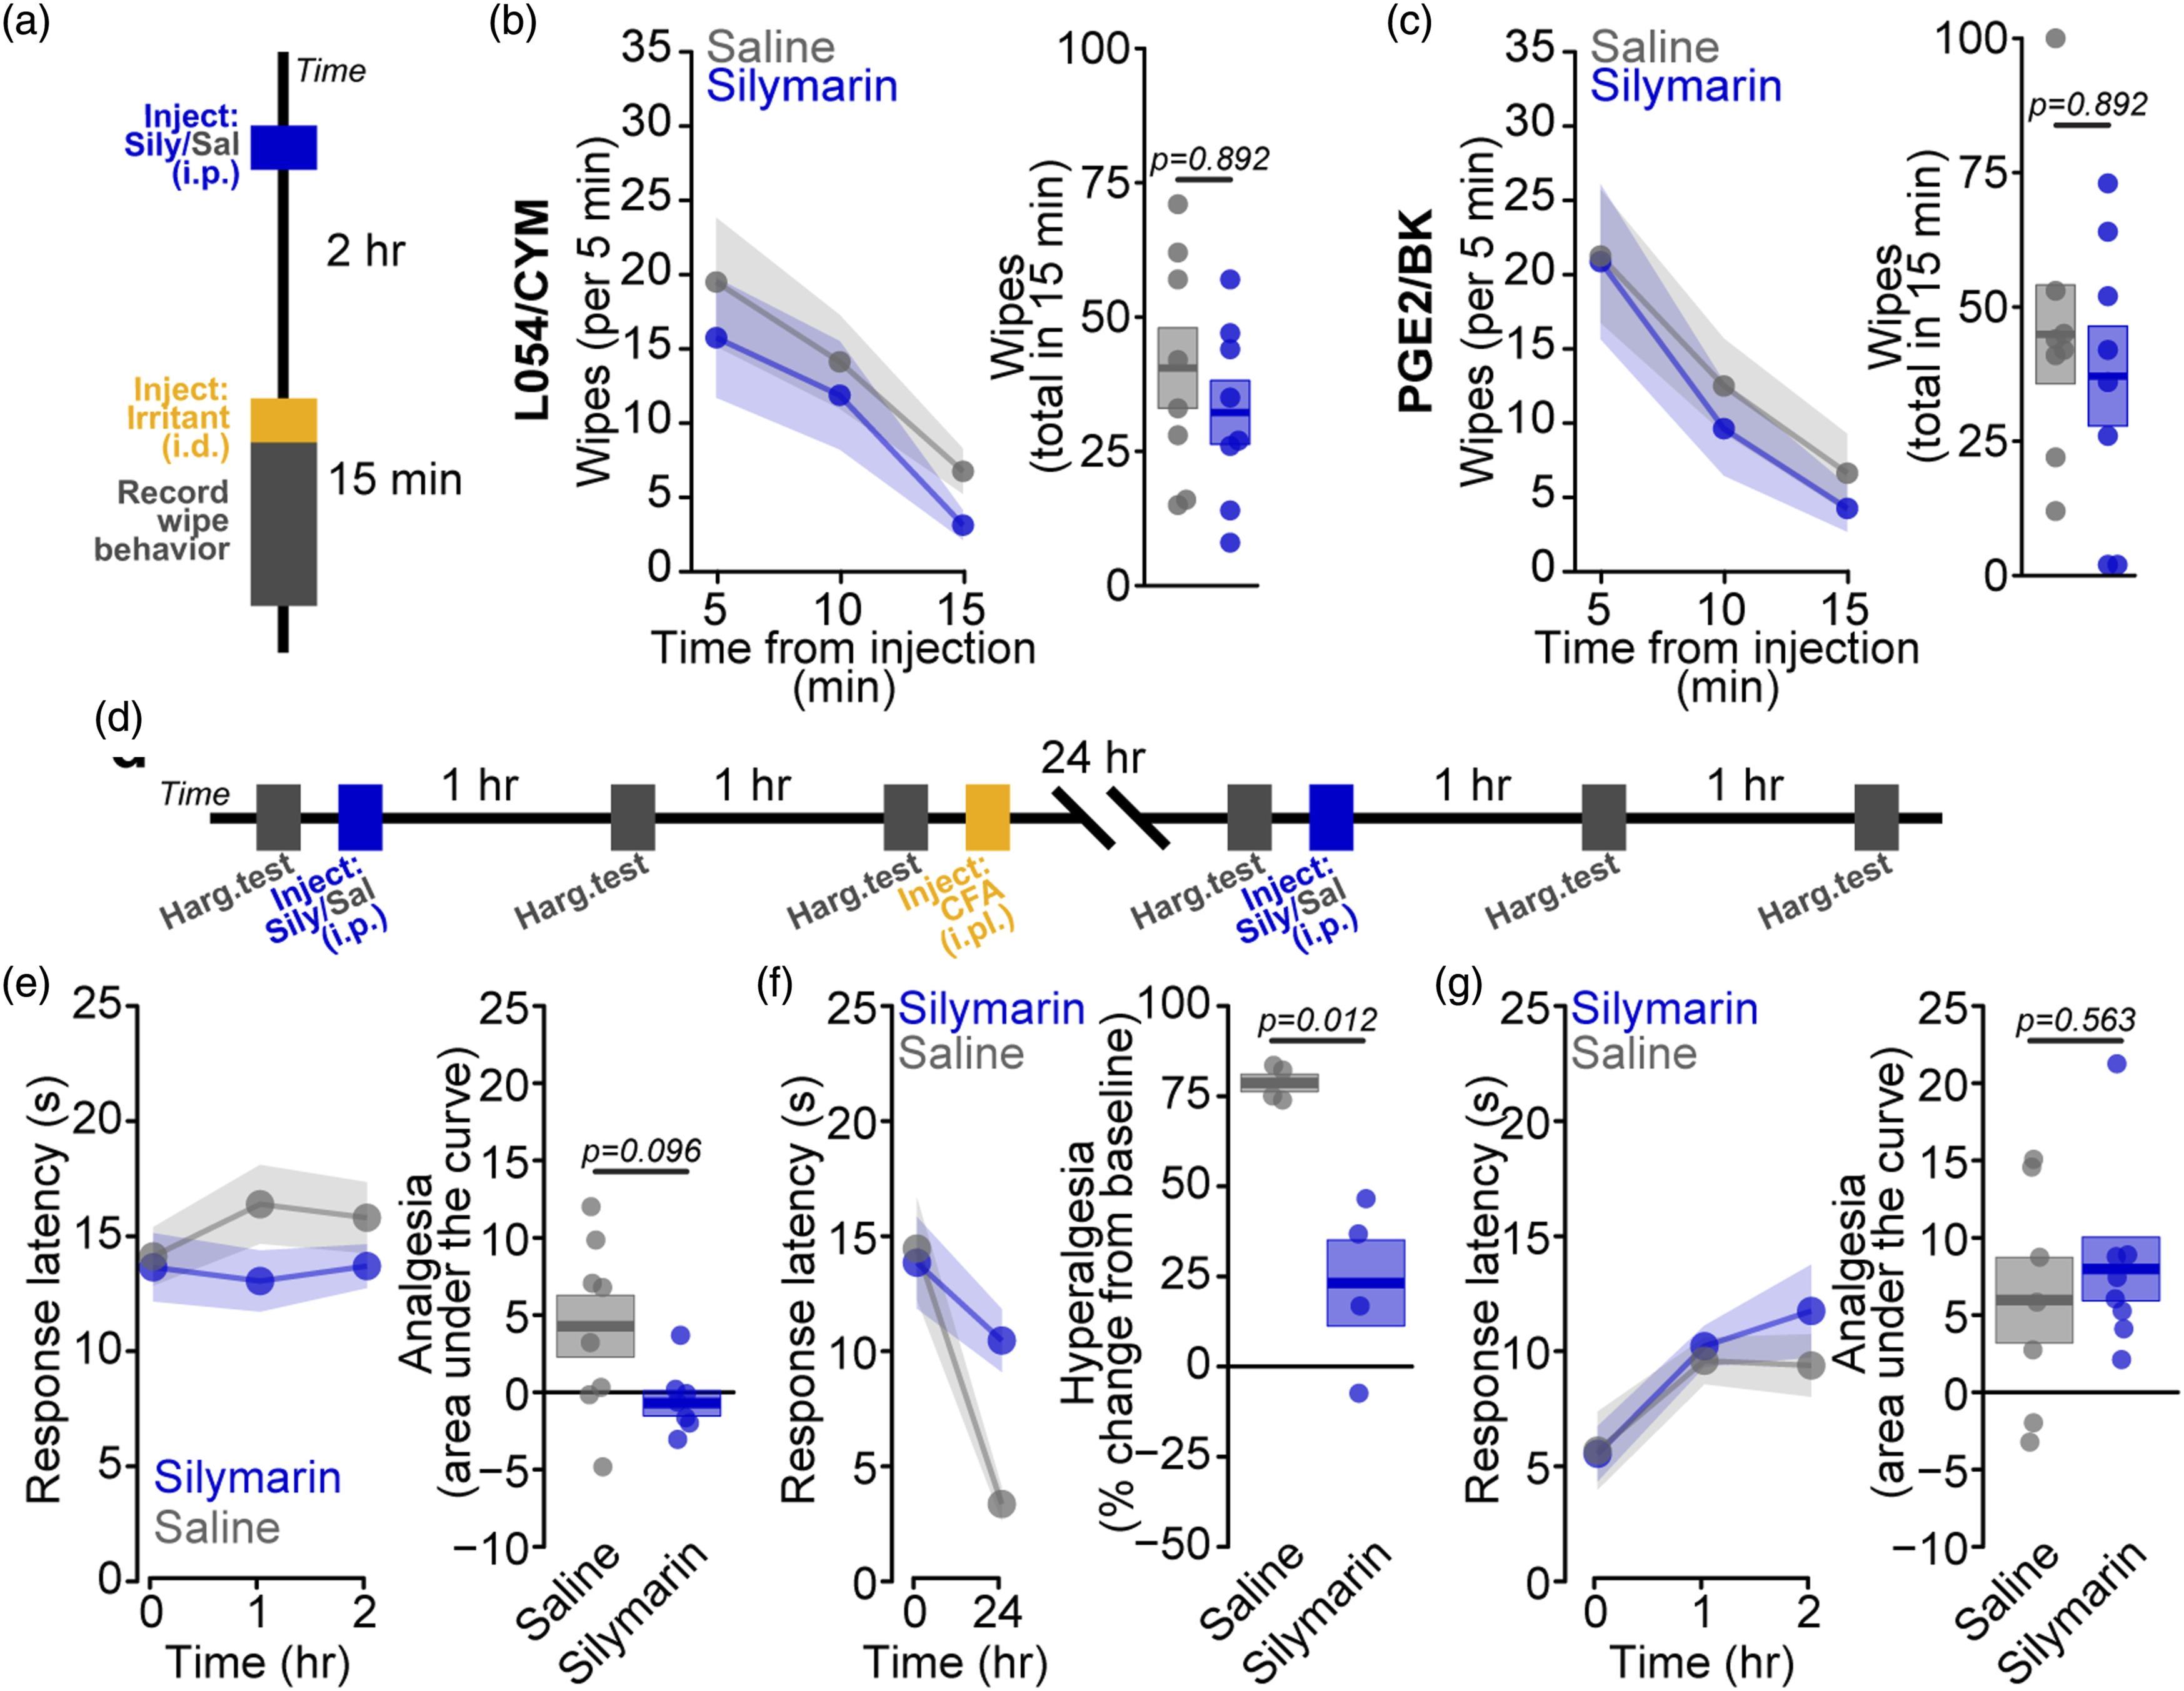
Discussion
The peripheral activation of nociceptor neurons is the primary initiating stimulus of pain sensation. In the setting of tissue injury, sensitization of nociceptors by inflammatory mediators provides critical augmentation of pain signals. Such response amplification can serve protective functions or, in cases of unrestricted or prolonged enhancement, drive pathological pain conditions. In vitro modeling of nociceptor sensitization has identified connections between specific metabotropic receptors on nociceptors and increases in nociceptor excitability. These include mechanisms by which inflammatory mediators alter the trafficking and biophysical properties of specific ion channels that facilitate increased nociceptor activation.1,26
Our study adds several novel contributions. First, the range of ionotropic receptors that facilitate calcium release in nociceptors is large, and the attention paid to the plethora of mechanisms eliciting calcium flux in nociceptors has been insufficient. Deeper investigation of these receptors and their downstream pathways may hold promise for the identification of potential new targets for analgesic development. For our drug screen, we chose a two-component cocktail of somatostatin and sphingosine-1-phosphate receptor activators, L-054,264 (L054) and CYM5541, respectively. Both of these receptors have been implicated in pain processing but evaluated only in limited contexts.27–32 Using a cocktail of metabotropic agonists provides an opportunity to identify compounds that block downstream signaling pathways, as opposed to the receptors themselves. Furthermore, the approach may identify novel convergent targets of metabotropic activation. Our results that silymarin blocked not only nociceptor activation by the screening cocktail but also by the more commonly used combination of BK and PGE2 support this line of reasoning.
Second, we expand the role of metabotropic agonists as playing distinct roles in the direct activation of nociceptors as well as sensitization to noxious or subthreshold stimuli that yield hyperalgesia and allodynia, respectively. Our result that L-054,264/CYM5541 directly elicits pain is consistent with the physiological activation of calcium flux in nociceptors; the distinction in our behavioral results – between a lack of effect of silymarin on acute pain behavior but a pronounced reduction in later heat hyperalgesia – provides support for these dual roles of metabotropic agonists in inflammatory pain.
Third, we demonstrate the capacity to use physiologically relevant tools for drug screening, here with primary sensory neurons and a single cell calcium readout, and avoid more reductionist strategies typically taken in screens. Because of the improved signal-to-noise and efficiency of the APPOINT system, we were able to conduct a medium scale compound screen using primary mouse DRG neurons, as opposed to cell lines heterologously expressing specific channels and receptors of interest. Although calcium imaging is only a surrogate for neuronal activity, with accuracies that reflect calcium buffering within individual cell types, we believe that the success of this screen and hit validation supports the continued use of these approaches to identify promising mechanisms and compounds, particularly in cases involving metabotropic modulation for which the breadth of receptors is large.
Silymarin, the active component from milk thistle extract, is a mixture of six major flavonolignans: silybins A and B, isosilybins A and B, silychristin, and silydianin. 33 Based on prior studies supporting suppression of inflammation, silymarin was previously evaluated in formalin inflammatory and nerve injury neuropathic pain models. 34 In that study, silymarin treatment specifically reduced the inflammatory component of formalin-induced pain, 35 consistent with our results on inhibition of nociceptor sensitization but not acute pain activation. The clinical safety of silymarin has been well validated, positioning it for evaluation as a clinical analgesic,18,33,36 although its mechanism of action, particularly in neurons, remains unclear.37–40 Silymarin and other natural products may hold promise across a broad range of clinical conditions; on the other hand, traditional target deconvolution for such products is challenging, particularly for mixtures of several compounds. Silymarin has been investigated in rigorous clinical trials for treatment of liver disease due to hepatitis C18. As much is known about dosing and pharmacokinetics, the path to clinical trials for such compounds is clearer, as we and others have leveraged previously. 41 Notably, pharmacokinetic studies in people have found that serum levels of silymarin flavonoligans can reach μM concentrations. 33 Thus, with the caveat that free levels may be substantially lower, the observed physiological effects may be relevant at feasible dosing levels. Additional studies aimed at translation of silymarin or other hits from this screen for pain treatment should include multiple treatment doses, pharmacokinetics assays such as measurements of free flavonoligan serum levels, and mechanistic investigation to develop a pharmacodynamics marker. In the future, more extensive clinical outcomes databases may also provide upfront unbiased support for the repurposing of hit compounds from such phenotypic screens.
Supplemental Material
Supplemental Material - Phenotypic screen identifies the natural product silymarin as a novel anti-inflammatory analgesic
Supplemental Material for Phenotypic screen identifies the natural product silymarin as a novel anti-inflammatory analgesic by Daniel M DuBreuil, Xiaofan Lai, Kevin Zhu, Grace Chahyadinata, Caroline Perner, Brenda Chiang, Ashley Battenberg, Caroline L Sokol, Brian J Wainger in Molecular Pain
Footnotes
Author Contributions
D.M.D., C.P, C.L.S., and B.J.W. designed all experiments. D.M.D., X.L., K.Z., B.C, G.C, and A.B performed experiments. D.M.D., G.C., and B.J.W. wrote the paper. All authors reviewed and edited the manuscript.
Declaring of Conflicting Interests
The author(s) declared the following potential conflicts of interest with respect to the research, authorship, and/or publication of this article: C.L.S. is a paid consultant for Bayer and Merck. C.L.S. receives sponsored research support from GSK. B.J.W. is a paid consultant for Takeda and Sanofi. B.J.W receives sponsored research support from Sanofi and GSK.
Funding
The author(s) disclosed receipt of the following financial support for the research, authorship, and/or publication of this article: This work was supported by NIH DP2-NS106664 and The New York Stem Cell Foundation (B.J.W.) with grant NYSCF-I-R44. B.J.W is a New York Stem Cell – Robertson Investigator. C.L.S. received support from Massachusetts General Hospital as a Howard Goodman Fellow. C.P. received funding from the DFG PE2864/3-1.
Supplemental Material
Supplemental material for this article is available online.
References
Supplementary Material
Please find the following supplemental material available below.
For Open Access articles published under a Creative Commons License, all supplemental material carries the same license as the article it is associated with.
For non-Open Access articles published, all supplemental material carries a non-exclusive license, and permission requests for re-use of supplemental material or any part of supplemental material shall be sent directly to the copyright owner as specified in the copyright notice associated with the article.