
Abstract
Neurostimulation therapies are frequently used in patients with chronic pain conditions. They emerged from Gate Control Theory (GCT), which posits that Aβ-fiber activation recruits superficial dorsal horn (SDH) inhibitory networks to “close the gate” on nociceptive transmission, resulting in pain relief. However, the efficacy of current therapies is limited, and the underlying circuits remain poorly understood. For example, it remains unknown whether ongoing stimulation of Aβ-fibers is sufficient to drive activity in SDH neurons. We used multiphoton microscopy in spinal cords extracted from mice expressing the genetically encoded calcium indicator GCaMP6s in glutamatergic and GABAergic populations; activity levels were inferred from deconvolved calcium signals using CaImAn software. Sustained Aβ-fiber stimulation at the dorsal columns or dorsal roots drove robust yet transient activation of both SDH populations. Following the initial increase, activity levels decreased below baseline in glutamatergic neurons and were depressed after stimulation ceased in both populations. Surprisingly, only about half of GABAergic neurons responded to Aβ-fiber stimulation. This subset showed elevated activity for the entire duration of stimulation, while non-responders decreased with time. Our findings suggest that Aβ-fiber stimulation initially recruits both excitatory and inhibitory populations but has divergent effects on their activity, providing a foundation for understanding the analgesic effects of neurostimulation devices.
Perspective: This article used microscopy to characterize the responses of mouse spinal cord cells to stimulation of non-painful nerve fibers. These findings deepen our understanding of how the spinal cord processes information and provide a foundation for improving pain-relieving therapies.
Keywords
Introduction
Spinal cord and peripheral nerve stimulation are neuromodulation therapies frequently used to treat chronic refractory pain. These approaches emerged from Gate Control Theory (GCT), the most influential theoretical concept in the pain field. GTC states that activation of Aβ-fibers “closes the gate” on pain by enhancing inhibitory drive in the superficial dorsal horn (SDH). 1 Despite the longevity of GCT, no studies directly addressed whether sustained stimulation of Aβ-fibers is sufficient to drive activity in SDH neurons, primarily because of the vulnerability of electrophysiological recordings to the electrical artifact generated by continuous stimulation.2,3 Multiple publications have indirectly supported that Aβ-fiber stimulation modulates spinal cord neurons. For example, dorsal column stimulation (DCS) increased GABA,4,5 and depressed excitatory neurotransmitter levels in the spinal cord in rats. 4 A one-second-long train of DCS, at a frequency most commonly employed clinically (50 Hz), was sufficient to activate SDH neurons in cats—although the identity of the recorded cells was not explored. 6 Studies looking at immediate-early gene expression following DCS have been equivocal: some found expression of c-fos throughout the spinal cord,7,8 whereas others only observed increased immunoreactivity in regions distal to the electrode at lower frequencies (4 Hz). 9
The neurons residing in the SDH can be functionally divided into excitatory and inhibitory populations, based on the expression of VGlut2 (vesicular glutamate transporter) and Viaat (vesicular inhibitor amino acid transporter), respectively.10,11 These populations are critical for developing and maintaining chronic pain states.12–15 Thus, it remains to be determined whether sustained activation of Aβ-fibers, using clinically relevant stimulation waveforms, is sufficient to modulate activity in GABAergic and glutamatergic SDH populations.
Optical approaches combined with advancements in protein-based indicators such as GCaMP6 have overcome many of the limitations of electrical recordings and revolutionized our understanding of neuronal circuits.16–20 These techniques have been implemented to image molecularly defined brain and spinal cord populations.21–23 The application of these tools presents a unique opportunity to dissect the effects of continuous Aβ-fiber stimulation on SDH neurons and provides a cellular basis for how it mediates analgesia. 21
We constructed a miniaturized bipolar epidural DCS electrode and identified physiological stimulation parameters in vivo and in vitro. We imaged neuronal activity ex vivo in the thoracolumbar spinal cord blocks extracted from mice expressing GCaMP6s in glutamatergic and GABAergic neurons. DCS and dorsal root stimulation (DRS) at Aβ-fiber intensities activated both populations, although only transiently. In glutamatergic neurons, we observed biphasic responses with a robust initial increase followed by decreased activity during and after stimulation. We observed that only about half of the GABAergic neurons responded to stimulation; this subset had sustained activity levels above baseline for the entire duration of stimulation. Our findings support the hypothesis that activation of Aβ-fibers differentially activates SDH networks and, for the first time, provide direct evidence that DCS and DRS can drive sustained activity in GABAergic interneurons.
Methods
All experiments were approved by the Institutional Animal Care and Use Committee at Oregon Health and Science University.
Mouse strains
VGlut2-Cre mice (Stock No: 016963, Vglut2-cre knock-in; The Jackson Laboratory) were crossed with homozygous floxed GCaMP6s mice (derived from strain Ai96; Stock No: 024106; The Jackson Laboratory, Bar Harbor, ME), resulting in GCaMP6s expression in glutamatergic neurons. To drive expression of GCaMP6s in GABAergic interneurons, we crossed Viaat-Cre mice (Stock No: 016962; The Jackson Laboratory) with homozygous GCaMP6s mice. The mice were kept under standard colony conditions, with 12-h day/night cycles, and had access to food and water ad libitum. Both males and females were used.
Fabrication and validation of a bipolar dorsal column stimulation electrode
Bipolar electrode construction
The electrode was constructed from two pieces of 36-gauge gold wire (catalog # 751,000, A-M Systems, Sequim, Washington) sandwiched between 0.5 mil (13 μm thick) Kapton tape (Caplinq, Ontario, CA). The electrode dimensions were as follows: width 1 mm, length 2.5 mm, and thickness 150 μm, cut to size with an 11 blade scalpel under a standard dissection microscope. The exposed gold wire segments measured 0.5 mm and were separated by a distance of 0.5 mm from the caudal end of the superior segment to the rostral end of the inferior one. The electrode template was etched in stainless steel to help standardize electrode construction (custom designed from ponoko.com).
In vivo spinal cord stimulation and sciatic compound action potential recording
Adult Viaat/GCaMP6s mice (6–8 weeks old) were used for these experiments. Isoflurane anesthesia was induced (5%) and maintained at 2% for the duration of the experiments. The mice were endotracheally intubated with a 20G angiocath (Braun, Melsungen, Germany) and ventilated for the duration of the experiments (tidal volume 260 μL, rate 240 breaths/min; MiniVent Type 845, Hugo Sachs Electronik, March-Hugstetten, Germany). Body temperature was monitored with a rectal thermometer probe (Model BAT-12, Physitemp, Clifton, NJ) and maintained (35–36°C) with a circulating water heating pad (T/Pump Professional, Stryker, MI). Heart rate was monitored continuously via needle electrodes. The thoracic curvature prominence (∼T11, corresponding to the L1/2 segment) was exposed, and the interlaminar space was accessed with blunt and sharp dissection. A custom bipolar electrode (described above) was gently inserted in the epidural space and sutured to the fascia. The skin was closed with interrupted sutures (5–0 Polysorb, Covidien, Dublin, Ireland). Spinal cord stimulation (30 biphasic charge-balanced pulses at 50 Hz with equal negative and positive phases, each 0.2 ms duration) was delivered via the epidural electrode using an isolated stimulator (Model 4100, A-M Systems, Sequim, Washington), allowing us to determine the motor threshold amplitude. The stimulation amplitude was gradually increased in 10 μA steps until a visible twitch or contraction was noted at the trunk or limbs. This value was recorded as the motor threshold. Once the motor threshold was established, the sciatic nerve was exposed at the mid-thigh by carefully separating the gluteus maximus and biceps femoris muscles. A stainless steel hook electrode was carefully placed around the nerve, and a ground needle electrode was placed in the nearby tissue. Warm mineral oil was used to cover the hook electrode. Then, the mouse was paralyzed with pancuronium (1 mg/kg). Five bipolar square pulses (1 Hz) were delivered via the epidural electrode, and the resulting compound action potentials (cAP) were amplified using a CyberAmp320 amplifier, digitized, and recorded using Spike2 software. The stimulation strength was gradually increased until cAPs were clearly observed. cAPs were averaged offline using Matlab (Mathworks, Natick, MA). To standardize our protocol for detection of cAP thresholds, we measured the variance of the signal within a 2 ms window before the stimulation was delivered and compared it with a similar window starting after the simulation artifact returned to baseline. The stimulation threshold for evoking a sciatic nerve cAP was defined as the amplitude where a significant difference was present in the variance test (p < 0.01) between the two regions. Conduction velocities were measured by dividing the estimated distance between stimulation and recording sites by the latency from the start of the stimulation to the first peak of the cAP.
In vitro compound action potential recording
The lumbar spinal cord was extracted as described below from adult (five-to seven-week-old) Viaat/GCaMP6s mice, and the DCS electrode was placed over the dorsal columns near the L1/2 segments. Five square pulses (0.2 ms) were delivered at 1 Hz using a stimulus isolator (A365, WPI, Sarasota, FL) driven by pClamp software (Molecular Devices, San Jose, CA). The cAPs were recorded at the dorsal roots via tight-fitting, thin-wall glass pipettes (1.2 mm diameter, Sutter Instruments, Novato, CA) backfilled with ACSF and attached via suction. Signals were amplified and digitized (MultiClamp 700, Molecular Devices, San Jose, CA) and analyzed offline using Matlab (Mathworks, Natick, MA). Conduction velocities were measured by dividing the estimated distance between stimulation and recording sites by the latency from the start of the stimulation to the first peak of the cAP.
Lumbar spinal cord preparation for electrophysiology and imaging experiments
Five-to seven-week-old Viaat/GCaMP6s or VGlut2/GCaMP6s mice of both sexes were deeply anesthetized with 5% isoflurane and decapitated. The lumbar spinal cord was rapidly removed en bloc and placed in oxygenated ACSF (in mM: 125 NaCl, 2.5 KCl, 26 NaHCO3, 1.25 NaH2PO4H2O, 1 MgCl2, 2 CaCl2, and 25 glucose) at room temperature. The dorsal roots were trimmed, and the dura was removed. The tissue block was glued to a thick glass rectangle and perfused with room temperature, oxygenated ACSF at 3 mL/min during experiments.
Dorsal column and dorsal root stimulation
Dorsal column stimulation was delivered via our custom-made electrode applied to the dorsal columns at L1/2 in vitro, in lumbar spinal cords obtained from mice of both sexes. Stimulation was delivered using a stimulus isolator (A365, WPI, Sarasota, FL) driven by a waveform generator (Pulsemaster A300, WPI). DRS was delivered via a tight-fitting, thin-wall glass pipette (1.2 mm diameter; Sutter Instruments, Novato, CA) backfilled with ACSF and attached to the root via suction, typically at L4. DCS was delivered as charge-balanced square biphasic pulses (equal negative and positive phases, 0.2 ms duration each) at 50 Hz unless otherwise specified. DRS consisted of square pulses (0.2 ms duration) at 50 Hz.
Multiphoton microscopy and image analysis
The imaging system consisted of a Zeiss 7 MP microscope (Zeiss Instruments, Thornwood, NY) equipped with a femtosecond-pulsed tunable Ti:Sapphire laser (Coherent, Santa Clara, CA), tuned to a wavelength of 940 nm (<40 mW at back aperture), and a 512 × 512 field of view. Fluorescence images were acquired using a 20X/1.0 water immersion objective at ∼3 Hz. Neurons residing in a volume 50–100 μm deep from the surface of the dorsal horn at L3 were imaged for both DCS or DRS unless otherwise specified. The optical plane with the most neurons responding to a test stimulation was selected, with at least 10 min between imaging sessions. Tissue drift was generally minimal. The image analysis software CaImAn was used for image processing, including motion correction, neuron outline, and deconvolution of the spike rates.24,25 Standard settings were used for the constrained nonnegative matrix factorization method, and we observed robust results that were comparable with manual neuronal outline and signal extraction. 21 Inferred spike rates obtained from CaImAn were analyzed using custom Matlab functions and plotted using Prism (GraphPad, San Diego, CA). The spike rates have arbitrary units and do not represent actual spike counts; instead, they are a measure of deconvolved neural activity that is proportional to the firing rates of the neurons at each time. 26 Responder neurons were defined as having a 50% increase in spike rates during a window 10 s after the stimulation started. To bin neuronal activity, responses were averaged every 1 min.
Statistics
Data are shown as mean ± SEM unless otherwise indicated. Data analysis was performed in Prism. Activity levels were compared to pre-stimulation levels using repeated measures ANOVA (RM ANOVA) followed by Dunnett’s multiple comparisons test. Between-group experiments were compared using two-way ANOVA followed by Sidak’s multiple comparisons test. For in vivo experiments, the motor thresholds were compared using unpaired two-tailed t-tests. The fractions of responder neurons were compared using Chi-squared tests.
Results
Generation and testing of a miniaturized bipolar epidural stimulation electrode in vivo and in vitro
We developed and validated an epidural DCS electrode appropriately sized for mice. As the dimensions of the electrode were a major limiting factor, we used Kapton (polyimide tape) and thin gold wire to achieve a thickness of 150 μm (Figure 1). The electrodes were implanted without difficulty in anesthetized mice and used to deliver charge-balanced square biphasic pulses at 50 Hz. We used this frequency as it is the most commonly used in clinical practice27,28 and in mechanistic animal studies.21,29–32 Motor thresholds were measured by gradually increasing the DCS amplitude until a response was observed. We then measured compound action potentials at the sciatic nerve using the same range of stimulation parameters. Action potentials with fast conduction velocities (CV) were clearly distinguished (CV 22.30 ± 2.92 m/s, n = 10), supporting the activation of Aβ-fibers and retrograde propagation (Figure 1(b)). The threshold for evoking action potentials was 26.67 ± 11.18 μA, which was significantly less than the motor threshold (71.11 ± 20.37 μA, n = 9; p < 0.05). Thus, our bipolar electrode activated Aβ-fibers and elicited motor responses, supporting its usefulness for exploring DCS biology. Dorsal column stimulation activates Aβ-fibers in vivo and in vitro. (a) A mouse-sized bipolar electrode was created from gold wires and thin Kapton tape with the dimensions listed. (b) The bipolar electrode was placed in the epidural space in anesthetized Viaat/GCaMP6s mice. The motor threshold to 50 Hz stimulation was determined using charge-balanced biphasic pulses and increasing amplitudes. Retrogradely transmitted compound action potentials were recorded at the sciatic nerve. (c) The amplitude required to elicit motor responses (motor threshold) was significantly higher than that required to evoke a compound action potential (n = 9; Student’s t-test, p < 0.05). (d) Dorsal column stimulation evoked retrogradely transmitted action potentials at the dorsal roots. The custom-made electrode described in a) was placed on the dorsal columns in spinal cord blocks from Viaat/GCaMP6s mice. Brief square pulses (0.2 ms duration) were delivered at amplitudes of 50 (upper panel) and 100 μA (lower panel). The compound action potentials were measured at the dorsal roots shown in the diagram on the corresponding side. The dark line represents the average trace. N = 6.
Next, we established the ability of our electrode to activate dorsal column fibers in vitro (Figure 1(d)). This is important, as current shunting may occur through the ACSF bathing the spinal cord, with diminished flow through tissue and decreased activation of adjacent dorsal column axons. The electrode was positioned over the dorsal columns spanning the L1/2 segments, and brief square pulses were delivered at amplitudes of 50 and 100 μA. These amplitudes were selected to approximate the Aβ-fiber and motor thresholds measured in vivo, respectively. We observed retrogradely transmitted action potentials on both sides of the spinal cord at all the dorsal roots examined (L2–L5). The conduction velocities at left and right L5 dorsal roots were compared for the 100 μA stimulation amplitude, and no differences were found (CV left L5 = 13.52 ± 2.03 m/s, right L5 = 15.18 ± 2.38 m/s; p > 0.05; n = 6 mice). These findings validated the use of our bipolar electrode to activate dorsal column fibers in vitro.
Tonic dorsal column stimulation transiently activates glutamatergic and GABAergic populations
We imaged SDH neurons in lumbar spinal cord segments from mice expressing GCaMP6s in either glutamatergic or GABAergic neurons and inferred activity (deconvolved spikes rates) from calcium fluorescence with the software CaImAn (Figures 2(a)–(c)).
24
Spontaneous activity levels were stable over the duration of the imaging period in both populations (Figure 2(d)). Imaging glutamatergic and GABAergic activity in the superficial dorsal horn. (a) The spinal cord was dissected from transgenic mice expressing GCaMP6s and imaged in vitro. The custom-made electrode was applied to the dorsal columns. Dorsal column stimulation (DCS; 100 μA, 50 Hz, 0.2 ms charge-balanced biphasic pulses) was delivered at L1/2, and superficial dorsal horn neuronal activity was imaged distally at L3. (b) Image acquisition, processing, and analysis pipeline. A Zeiss multiphoton microscope was used to acquire the images. Post-processing and spike rate deconvolution was accomplished with the image analysis software CaImAn. (c) Example glutamatergic responses to dorsal column stimulation delivered for 3 min. The left panel is a max projected image of the 5-min long time series. The right panel shows the raw fluorescence traces (darker lines) overlaid on inferred spiking (traces individually scaled; numbers corresponding to the neurons in the image). Scale bar 50 μm. (d) The activity of glutamatergic and GABAergic neurons residing in the superficial dorsal horn was measured continuously for 5 min in the absence of stimulation. There was no significant change in activity over time for either population via RM ANOVA (VGlut2/GCaMP6s group: F (4, 56) = 1.65, p = 0.20; n = 61 neurons from 4 mice. Viaat/GCaMP6s group: F (4, 124) = 1.93, p = 0.15; n = 129 neurons from five mice).
We delivered DCS at 50 Hz continuously for 3 min. This stimulation duration was selected as it allows stable imaging of the same neurons (due to negligible drift) and minimizes photobleaching. We observed a pronounced activation of glutamatergic neurons when using a stimulation amplitude of 100 μA (Figure 2(c) and Figure 3). We also observed responses at an amplitude of 50 μA, but they were less prominent (data not shown). As demonstrated in Figure 3(Ab), DCS produced a profound but transient activation that lasted seconds. We binned spike rates every minute and observed an initial increase, followed by a decrease to below pre-stimulation levels (inferred spike rate: 7.17 ± 0.38 at minute 1 vs 12.94 ± 0.42 at minute 2, 5.43 ± 0.34 at minute 3, 5.17 ± 0.34 at minute 4; p < 0.0001; n = 258 neurons from five mice; Figure 3(Ac)). Firing rates further decreased after the stimulation ended (3.02 ± 0.34 at 5 min, p < 0.0001). Thus, DCS transiently activated and then depressed SDH glutamatergic neurons. Dorsal column stimulation modulates the activity of glutamatergic and GABAergic populations. (Aa) Raster plot of inferred glutamatergic neuronal activity. Two-photon images were acquired for 5 min, and dorsal column stimulation (DCS) was delivered for 3 min, with charge-balanced biphasic pulses at a frequency of 50 Hz and an amplitude of 100 μA. The duration of each phase was 0.2 ms; these parameters are similar to those typically used in patients. (Ab) Top panel: Averaged inferred activity for all neurons (n = 258 from five mice). The lower panel demonstrates activity over a 60 s time window. (Ac) Neuronal activity was binned every minute. Activity changed at every time point during and after stimulation (RM ANOVA F (4,253) = 142.90, p < 0.0001). Glutamatergic activity significantly increased during the first minute of stimulation, then decreased below baseline and remained depressed once dorsal column stimulation was turned off. (B) DCS transiently increased GABAergic neuron activity. (Ba) Raster plot of inferred neuronal activity. (Bb) Averaged spike rates in all neurons (n = 327 from six mice; top panel); the lower panel demonstrates activity over a narrower window (60 s long). (Bc) Neuronal activity was binned every minute. Although GABAergic activity increased briefly during the first minute of stimulation, it subsequently returned to baseline. Activity levels decreased below baseline once the stimulation was turned off (RM ANOVA F (4,322) = 27.27, p < 0.0001).
Next, we imaged the activity of GABAergic SDH neurons. As with glutamatergic neurons, we observed a significant increase in activity (Figure 3(Ba–b)) that concurred with the start of stimulation. The elevated neuronal firing was transient and then returned to baseline for the rest of the stimulation period. As with glutamatergic cells, spike rates decreased below baseline once the stimulation was turned off (10.82 ± 0.62 at 1 min versus 8.02 ± 0.54 at 5 min, p < 0.01; n = 327 neurons from six mice). The short-lived activation of GABAergic neurons was surprising as DCS is thought to drive sustained firing in inhibitory neurons, as hypothesized in GCT. In sum, DCS generated robust but transient activation of both glutamatergic and GABAergic SDH networks.
Dorsal root stimulation at Aβ-fiber intensity transiently activates glutamatergic and GABAergic populations
We pursued experiments where Aβ-fiber stimulation was delivered at the dorsal root to ask whether activation of Aβ-fibers peripherally had similar effects to central stimulation (DCS) and in order to avoid direct recruitment of neuropil adjacent to the dorsal column electrode.
2
We used a pipette tightly attached to the L4 dorsal root and a stimulation intensity (20 μA, 0.2 ms) previously shown to activate large myelinated axons preferentially.
30
SDH neurons residing at the L3 segment were imaged (Figure 4). As with DCS, DRS elicited an intense but brief activation of glutamatergic neurons (Figure 4(c)). During the first minute, glutamatergic activity increased significantly (inferred spike rate: 7.11 ± 0.29 at baseline vs 12.70 ± 0.41 at minute 2, p < 0.0001; n = 475 from six mice). Activity decreased from pre-stimulation levels during the second minute of DRS (6.26 ± 0.26) and was further attenuated once stimulation was turned off (3.92 ± 0.23 at minute 5). Overall, DRS and DCS resulted in similar patterns of activation and inhibition of glutamatergic SDH neurons. Dorsal root stimulation at Aβ-fiber intensity modulates the activity of glutamatergic and GABAergic populations. (a) Experimental setup. Dorsal root stimulation (DRS) (3 min at 50 Hz, 20 μA, 0.2 ms) was delivered using a suction pipette, and superficial dorsal horn neurons were imaged one segment rostral. (b) Max projected image of an exemplar time-series stack obtained in a VGlut2/GCaMP6s mouse imaged over 5 min. Lower panel: Raw fluorescence traces (darker lines; individually scaled; corresponding to the numbers in the image) overlaid on inferred spiking. Scale bar 50 μm. (c) Averaged inferred activity in all glutamatergic neurons (n = 475 from six mice; upper left panel). The lower panel shows a narrower time window (60 s long). Neuronal activity was binned every minute (right panel). Activity levels increased immediately after stimulation, then decreased below baseline during the second minute and after the stimulation ended (RM ANOVA F (4,471) = 180.80). (d) Averaged inferred activity in all GABAergic neurons (n = 184 from six mice; upper left panel). The lower panel includes a narrower time window. Neuronal activity was binned every minute (right panel). Activity levels increased immediately after stimulation and decreased below baseline after the stimulation was stopped (RM ANOVA F (4,179) = 40.79).
Similar experiments were conducted in labeled GABAergic neurons (Figure 4(d)). DRS resulted in a transient increase in activity during the first minute of stimulation (7.06 ± 0.49 at baseline vs 11.89 ± 0.57 at minute 1, p < 0.0001; n = 184 from six mice). Activity levels returned to baseline, then decreased after DRS was turned off (5.17 ± 0.45, p < 0.01). These findings were congruous with those observed for DCS, consistent with a common mode of Aβ-fiber activation.
Superficial dorsal horn GABAergic neuron activation by dorsal column stimulation or dorsal root stimulation is independent of neuron depth
We were surprised that DCS and DRS did not elicit sustained activation of SDH inhibitory cells. As low-threshold myelinated Aβ-fiber afferents terminate in the deeper dorsal horn lamina (IIi-VI), we set to determine whether DCS or DRS drove activity preferentially in deeper SDH.
33
We took advantage of the ability of multiphoton microscopy to image deep in tissues and examined neurons residing up to 180 μm from the surface of the dorsal horn, which corresponds to lamina III.34,35 We delivered a 30-s train of DCS at six planes separated by 30 μm, sampling neurons throughout SDH (Figure 5(a)). We binned neuronal activity for the 30 s of stimulation (Figure 5(b)). The calculated spike rates were higher than those described above (e.g., Figures 3 and 4) due to the shorter duration of stimulation over which the responses were binned. There were no effects of depth on GABAergic neuronal activity for both DCS or DRS via ANOVA. These findings suggest that DCS or DRS did not preferentially activate inhibitory neurons residing in deeper SDH. Superficial dorsal horn GABAergic neuron activity evoked by dorsal column and dorsal root stimulation is independent of depth. (a) The activity of GABAergic neurons was measured up to 180 μm below the surface of the dorsal horn during a 30-s long train of dorsal column (DCS) or dorsal root stimulation (DRS). Optical planes were imaged in 30 μm increments. (b) Averaged activity during stimulation (30 s) was plotted over depth. There was no significant effect of depth on SCS-evoked activity (one-way ANOVA F (5, 406) = 0.96, p = 0.44; n = ∼68 neurons/plane from nine mice). Similarly, there was no effect of depth on responses evoked by dorsal root stimulation (F (5, 331) = 1.28, p = 0.27; n = ∼56 neurons/plane from 10 mice).
Dorsal column stimulation and dorsal root stimulation drove sustained activation of a subset of GABAergic neurons
The experiments thus far examined pooled activity in the entire population of glutamatergic and GABAergic neurons. However, some neurons increased their activity briskly at the onset of stimulation. We, therefore, aimed to determine if the effects of continuous Aβ-fiber stimulation were different in neurons classified based on their initial responses. To this end, we defined neurons as responders, characterized by a 50% increase in activity during the first 10 s of DCS or DRS, or non-responders. We observed a significant difference in the fraction of responders between glutamatergic and GABAergic populations (Figure 6(a)), with both locations of stimulation preferentially driving a more substantial proportion of glutamatergic neurons (84% vs 52% for DCS, 76% vs 59% for DRS; p < 0.001). Glutamatergic responders showed a significant increase during the first minute of DCS; activity levels then decreased below baseline, despite ongoing stimulation (Figure 6(b) left panel). GABAergic responders exhibited a different pattern of activity during DCS or DRS: an initial robust response, followed by significantly elevated activity levels for the entire duration of the stimulation, and finally a return to baseline levels once the stimulation stopped (Figure 6(b) right panel). As only about half of GABAergic neurons were responders, we also examined non-responders. Notably, GABAergic non-responders had increased baseline activity levels versus responders (inferred spike rate: 13.99 ± 0.92 vs 7.17 ± 0.66 for DCS, 10.44 ± 0.79 vs 4.82 ± 0.52 for DRS, in non-responders and responders, respectively, p < 0.0001 for both conditions). The activity levels of non-responders decreased below baseline during and after stimulation (Figure 6(c)). Therefore, our findings suggest the existence of two populations of GABAergic neurons with dichotomous responses to Aβ-fiber stimulation. Dorsal column and dorsal root stimulation increased firing in a subset of GABAergic neurons. (a) Responder neurons were defined by an increase in spike rates of >50% during the first 10 s after the stimulation was turned on. Both dorsal column (DCS) and dorsal root stimulation (DRS) activated a more significant proportion of glutamatergic neurons (p < 0.0001 for both). (b) DCS or DRS preferentially increased activity in GABAergic responders. Glutamatergic responders had increased activity levels during the first minute of stimulation, followed by a decrease below baseline during and after stimulation (n = 217 neurons from five mice; RM ANOVA F (4, 212) = 196.2 followed by Dunnett’s multiple comparisons test, p < 0.0001). In contrast, GABAergic responders had elevated firing rates for the entire duration of DCS and returned to baseline levels once the stimulation was turned off (n = 170 neurons from six mice; RM ANOVA F (4,165) = 49.51, p < 0.0001). Lower panels: Glutamatergic neurons increased their activity initially once DRS began, then spike rates returned to baseline. Activity levels decreased from baseline once the stimulation was turned off (n = 360 neurons from six mice; RM ANOVA F (4,355) = 224.0, p < 0.0001). As observed with DCS, GABAergic responder activity was potentiated for the entire duration of stimulation and then returned to baseline (n = 109 neurons from six mice; RM ANOVA F (4,104) = 65.71, p < 0.0001). (c) Non-responder GABAergic neurons had depressed activity levels during and after stimulation for both DCS or DRS (DCS n = 157 from six mice, RM ANOVA F (4,152) = 22.01, p < 0.0001; dorsal root stimulation n = 74 neurons from six mice, RM ANOVA F (4,69) = 8.978, p < 0.001).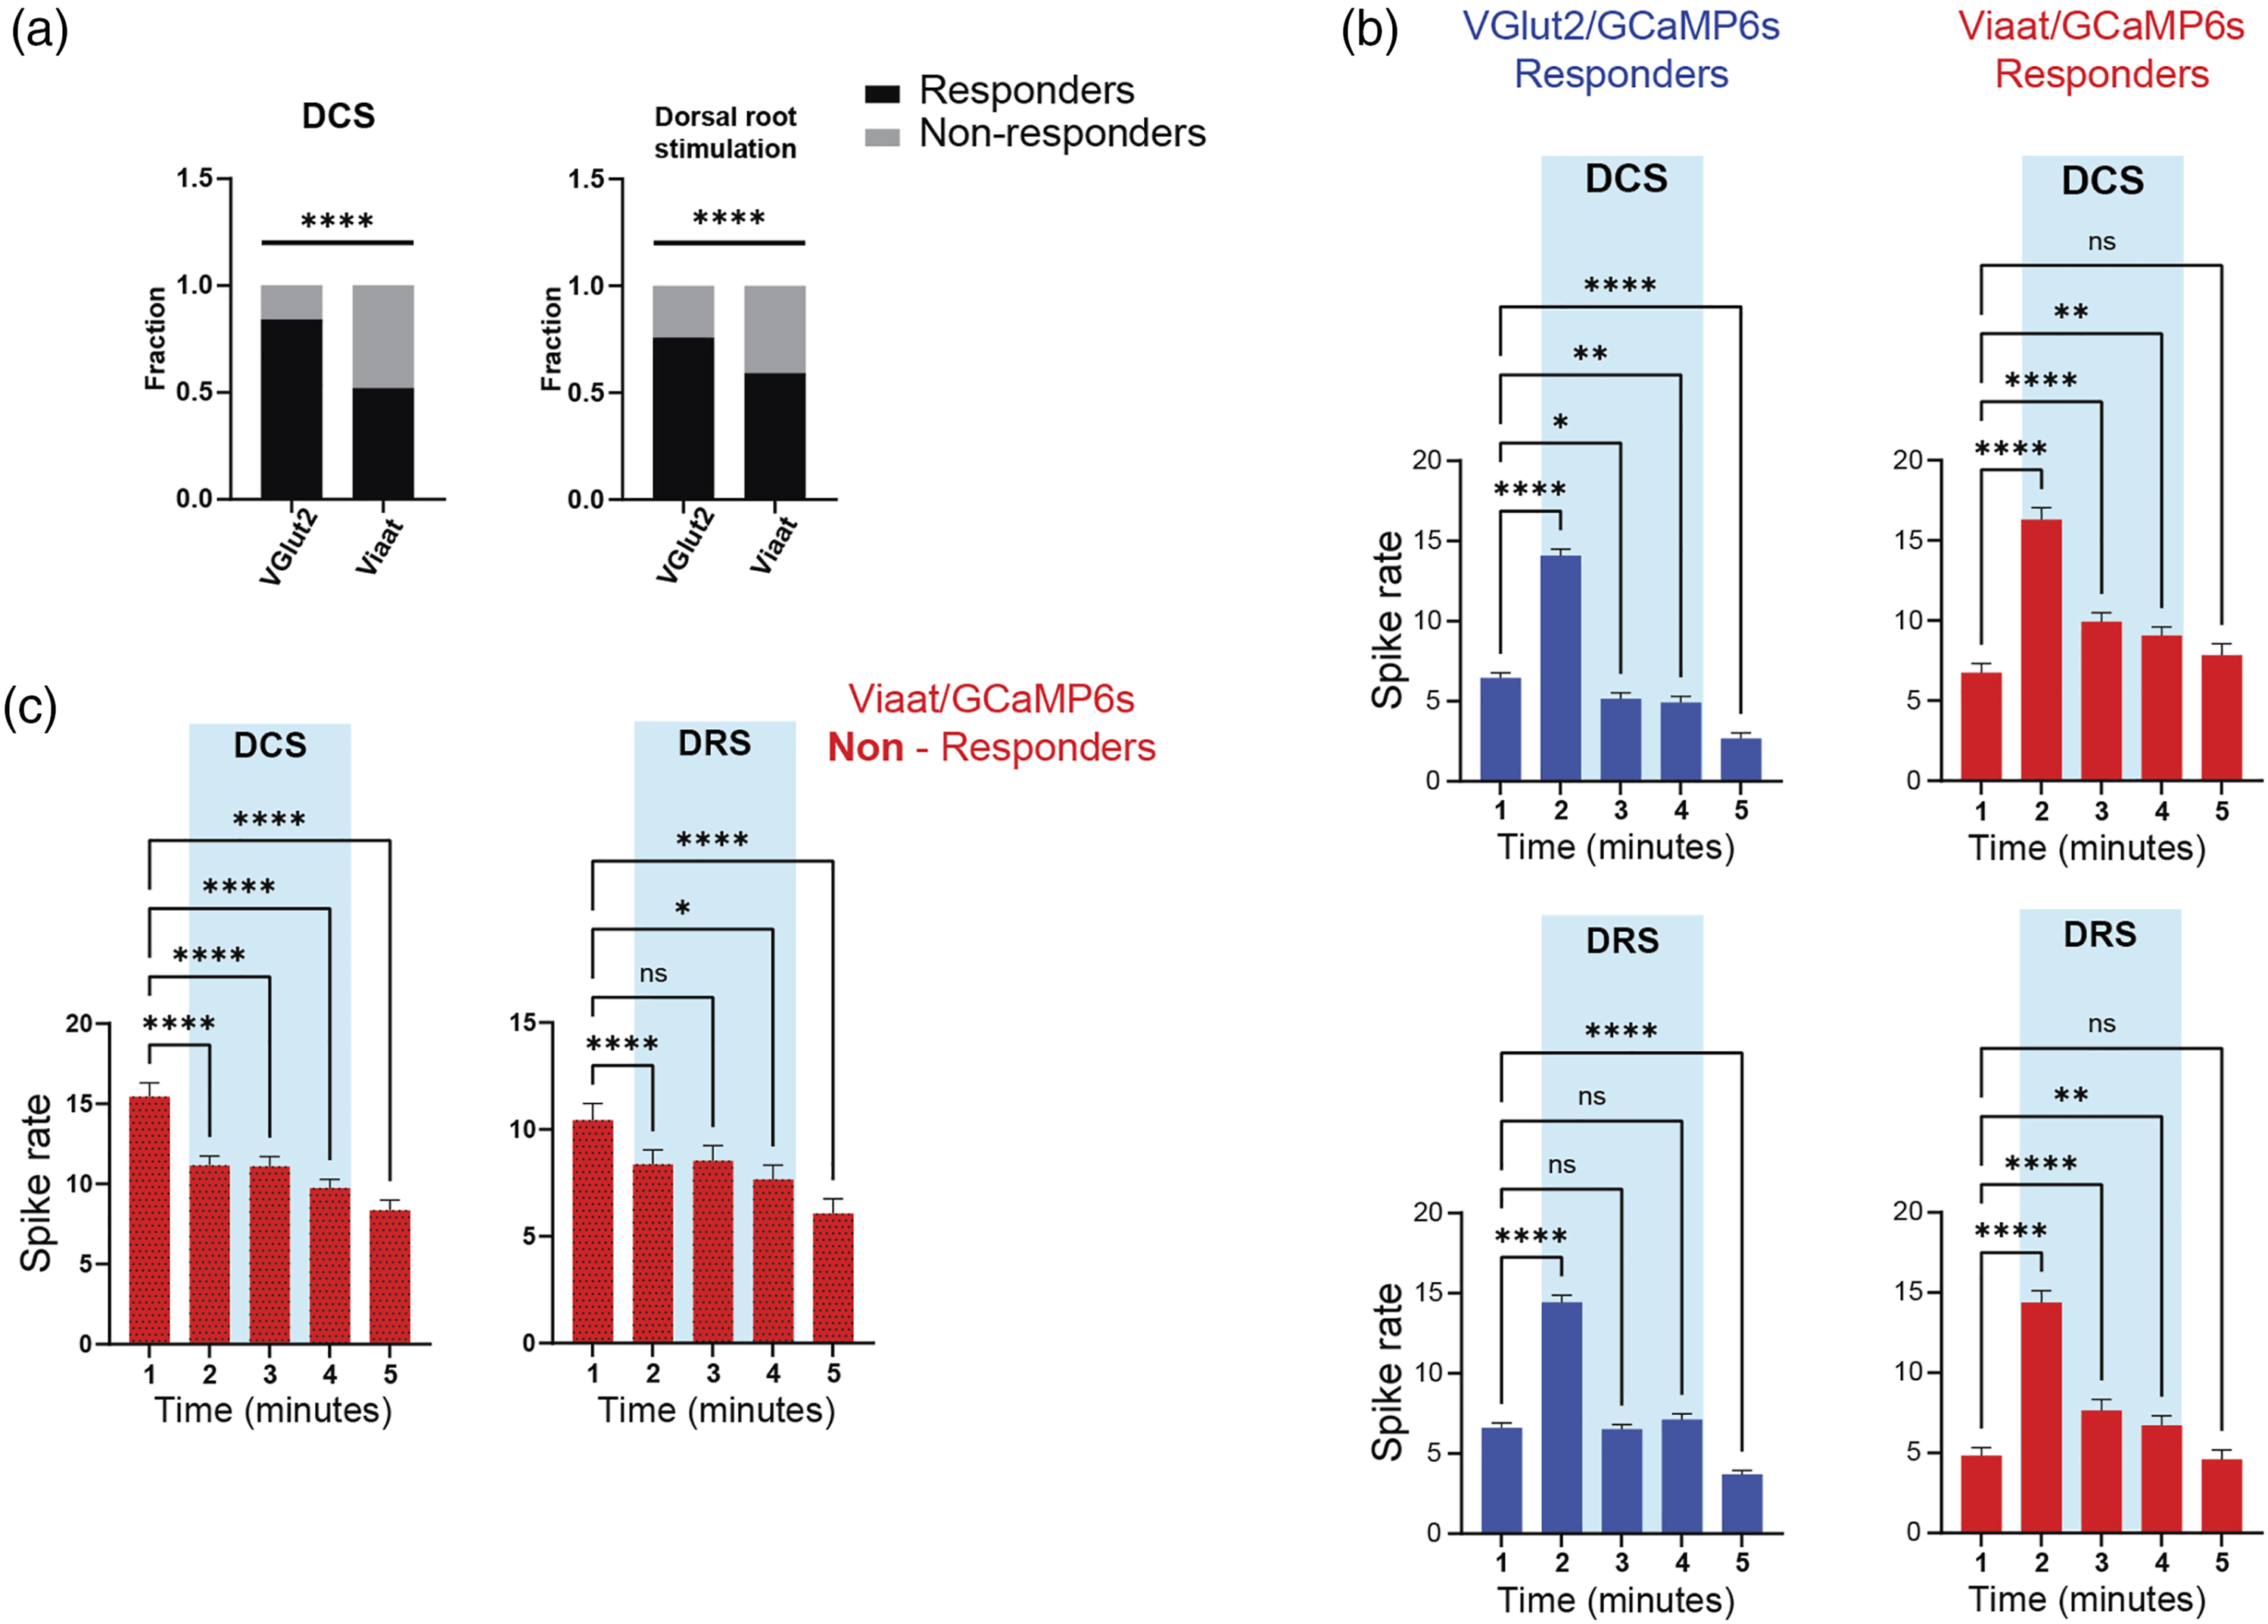
Discussion
We imaged the activity of molecularly defined glutamatergic and GABAergic SDH neurons in vitro and found that DCS and DRS induced biphasic responses in both populations. We observed a robust but transient initial activation at the start of stimulation, followed by depressed activity levels in glutamatergic neurons, and return to baseline in GABAergic cells. Both populations showed slightly depressed activity levels after the stimulation was turned off. Although most glutamatergic neurons responded transiently to stimulation, only about half of GABAergic neurons responded either to DCS or DRS. GABAergic responders had significantly increased activity levels during the entire duration of stimulation; in contrast, non-responders displayed depressed levels. To our knowledge, this is the first report supporting the existence of a subset of GABAergic neurons engaged by sustained Aβ-fiber activation, as proposed in GCT. 1
Recent studies highlighted the cellular heterogeneity of the dorsal horn, including the presence of functionally distinct circuits involved in mechanical pain and itch.36,37 Inhibitory neurons are particularly relevant for gating afferent excitatory inputs and have been implicated in chronic pain conditions.38,39 Five non-overlapping populations of inhibitory interneurons were described in SDH, the largest proportion (1/3) being neuropeptide Y expressing cells. 40 In our experiments, about half of GABAergic neurons were classified as responders to DCS or DRS, suggesting that more than one population was activated. Non-responders had nearly double baseline (spontaneous) activity levels than responders, implying that they may represent a distinct physiological subset. Notably, responders maintained elevated activity levels during stimulation (Figure 6). Thus, we provide direct evidence that DCS and DRS augmented the activity of a subset of GABAergic neurons residing in SDH, which may explain how Aβ-fiber stimulation increases GABA release,4,5 reverses wide dynamic range neuron (WDR) plasticity, 41 and depresses WDR neuron hyperexcitability. 29 As over 30 molecularly defined populations of SDH neurons have recently been described, future experiments will be needed to investigate the identity of GABAergic responders and whether they are necessary for generating pain relief.10,11
Prior studies investigated which neurons are modulated by Aβ-fiber stimulation by examining the expression of immediate early genes and found modest 7 or no 42 increases in the number of immunoreactive cells for DCS at 50–60 Hz. We found robust activation in most SDH neurons that lasted only seconds, which may be insufficient to drive expression of immediate early genes,43,44 and could explain prior reports. The mechanism for the brief activation deserves further investigation. One possibility is neurotransmitter depletion, as previously described for continuous Aβ-fiber stimulation.15,45 Alternatively, it may be that the subset of GABAergic responders caused widespread inhibition of other SDH populations. As Aβ-fibers terminate in the inner dorsal horn, it is possible that deeper GABAergic neurons (e.g. lamina IIi-VI) receive stronger inputs and are engaged differently during stimulation. 46 For example, parvalbumin-expressing interneurons reside in lamina IIi/III and receive direct inputs from myelinated afferents; in turn, they drive presynaptic and postsynaptic inhibition of lamina II excitatory neurons. 15 We tested this hypothesis within the constraints of our imaging system and found comparable responses to DCS or DRS in cells residing up to 180 μm below the surface, which corresponds to lamina III. Future experiments using novel microscopy techniques capable of imaging deeper in biological tissues, such as 3-photon microscopy, are needed. 47
In our study, DCS and DRS evoked responses in both glutamatergic and GABAergic SDH neurons. We found a higher percentage of responsive glutamatergic neurons compared to what was reported before.48–50 These differences are likely due to our approach (intact spinal cord) and the use of a sustained train of Aβ-fiber stimulation versus single pulses. Recently, it was proposed that DCS directly excites superficial dorsal horn dendrites. 2 We do not expect this mechanism in our preparation as the regions imaged were more than one segment distal to the electrode, further than the previously reported rostro-caudal dendritic arbor dimensions for SDH neurons. 51 Moreover, similar levels of activation were seen with DRS. Earlier work in vivo described excitatory synaptic drive from collaterals of dorsal column fibers into lamina I-III. 6 In that study, 24 of 29 recorded units showed excitation after brief DCS (1-s train at 50 Hz), with shorter latencies in neurons residing in lamina II-III. The authors concluded that the neurons activated were inhibitory cells (given the inhibitory nature of DCS), although the identity of the recorded neurons was not investigated. A recent study found that projection neurons responded heterogeneously to DCS, suggesting complex circuit interactions, although the stimulation duration was also brief. 52 As we observed biphasic responses, it will be critical for future studies to determine the effects of sustained Aβ-fiber stimulation on SDH output projection neurons.
An unexpected finding was that DCS and DRS strongly activated glutamatergic SDH neurons. Clinically, tonic DCS elicits sensory responses termed paresthesias. Electrodes are placed such that paresthesias overlap the painful body regions, which is necessary for pain relief. 27 Although paresthesias have been long believed to represent activation of dorsal column fibers,27,29,53 our findings suggest that they could also signify retrograde activation of excitatory SDH networks, an off-target effect. This could explain why most patients find paresthesias unpleasant and why stimulation amplitude windows tend to be narrow. 54 These observations have prompted strategies to minimize paresthesias, including sensors that adapt stimulation intensity to patient position, 55 and closed-loop stimulation, with improved pain relief. 56 Furthermore, paresthesia-free stimulation paradigms have been successfully implemented.57–60 It will be critical to examine the frequency- and waveform-dependent activation of SDH neurons, particularly in models of chronic pain, where neuropathy-related changes have been demonstrated. 39 It is tempting to speculate that specific frequencies and waveforms differentially activate glutamatergic and GABAergic populations depending on the type of pain, although this hypothesis needs further attention.
Various approaches have been used to identify physiological Aβ-fiber stimulation parameters in vitro,29,30 as overstimulation could result in unwanted recruitment of non-dorsal column neuropil (such as dorsal root entry zone axons and/or adjacent dendritic arbors) and Aδ/C-fibers for DCS and DRS, respectively. Although DRS pulse widths and amplitudes selective for Aβ-fibers have been described in mice,30,48 this information is not available for DCS. We addressed this by identifying stimulation parameters in vivo, using a miniaturized bipolar electrode and charge-balanced pulses, which parallels clinical practice. We measured motor thresholds and confirmed dorsal column activation by measuring retrogradely conducted compound action potentials in vivo. Activation of Aβ-fibers was observed in vitro at the lumbar dorsal roots, using a similar configuration as in our imaging experiments. In previous mouse studies, a single epidural cathode electrode was used for DCS, with the anode placed in the abdomen. 61 The average motor threshold amplitude reported in that study was 730 μA, which is an order of magnitude greater than what we measured (71 μA). We attribute this discrepancy to the bipolar architecture of our electrode, resulting in more focal electrical fields and greater activation of dorsal column axons while minimizing unwanted heat generation and electrolysis.28,62 Studies in rats, using larger electrodes, reported motor and dorsal column axon thresholds comparable to ours, confirming the scalability of our design.29,63,64 These results validate the usefulness of our electrode to study the mechanisms of DCS in mice. 65
Multiphoton microscopy of GCaMP has been used extensively to understand the behavior of neuronal circuits.66,67 The mouse spinal cord is well-suited for optical techniques given its size and expanding understanding of the molecularly defined populations processing somatosensation.19,68,69 We imaged activity-evoked changes in intracellular calcium using GCaMP6s and deconvolved activity using spike-inference algorithms built into the software CaImAn, an established methodology.24,26,70 A recent imaging study demonstrated that calcium responses faithfully encode action potentials in lamina I in mice. 71 Others have found that a significant proportion of single action potentials are missed by GCaMP6 imaging, suggesting that our results may underrepresent the spontaneous activity of SDH populations. 72 Future studies will be required to collect ground-truth electrophysiological and imaging data in spinal cord populations, as done in other regions. 73 This information will be critical for optimizing spike detection algorithms.
In summary, we provide evidence that DCS and DRS at a clinically relevant frequency and physiological amplitudes activate and modulate the activity of SDH neurons and drive sustained firing in a subset of GABAergic cells—as proposed in GCT. Future studies are needed to characterize the molecular identity of GABAergic responders and whether their activation is necessary for analgesic effects. The optimization and implementation of neuromodulation therapies will depend on a detailed understanding of the effects of Aβ-fiber stimulation on spinal cord circuits.
Footnotes
Declaration of Conflicting Interests
The author(s) declared no potential conflicts of interest with respect to the research, authorship, and/or publication of this article.
Funding
The author(s) disclosed receipt of the following financial support for the research, authorship, and/or publication of this article: This work was supported by the National Institutes of Health (grant K08NS099503 to ADS).
Data availability statement
The data that support the findings of this study are available in electronic format from the corresponding author, ADS, upon reasonable request.