
Abstract
Spinal cord stimulation is a proven effective therapy for treating chronic neuropathic pain. Previous work in our laboratory demonstrated that spinal cord stimulation based on a differential target multiplexed programming approach provided significant relief of pain-like behavior in rodents subjected to the spared nerve injury model of neuropathic pain. The relief was significantly better than obtained using high rate and low rate programming. Furthermore, transcriptomics-based results implied that differential target multiplexed programming modulates neuronal–glial interactions that have been perturbed by the pain process. Although differential target multiplexed programming was developed to differentially target neurons and glial cells, our previous work did not address this. This work presents transcriptomes, specific to each of the main neural cell populations (neurons, microglia, astrocytes, and oligodendrocytes), obtained from spinal cord subjected to continuous spinal cord stimulation treatment with differential target multiplexed programming, high rate programming, or low rate programming compared with no spinal cord stimulation treatment, using the spared nerve injury model. To assess the effect of each spinal cord stimulation treatment on these cell-specific transcriptomes, gene expression levels were compared with that of healthy animals, naïve to injury and interventional procedures. Pearson correlations and cell population analysis indicate that differential target multiplexed programming yielded strong and significant correlations to expression levels found in the healthy animals across every evaluated cell-specific transcriptome. In contrast, high rate programming only yielded a strong correlation for the microglia-specific transcriptome, while low rate programming did not yield strong correlations with any cell types. This work provides evidence that differential target multiplexed programming distinctively targeted and modulated the expression of cell-specific genes in the direction of the healthy state thus supporting its previously established action on regulating neuronal–glial interaction processes in a pain model.
Keywords
Introduction
The establishment and maintenance of chronic neuropathic pain involve the disruption of biological processes that maintain the homeostatic balance of neurotransmission. 1 Central to these processes are the interactions between neurons and the surrounding glial cells that support the proper metabolic and immunologic microenvironment of the neural tissue. 2 Recently, our group reported the transcriptomics of spinal cord stimulation (SCS) using a differential target multiplexed programming (DTMP) approach in which electrical signals were synchronously delivered to the dorsal aspect of the cord of rodents subjected to the spared nerve injury (SNI) model of neuropathic pain. 3 This work showed that DTMP provided significant relief from mechanical and thermal hypersensitivity relative to pre-treatment levels. Additionally, the relief of mechanical hypersensitivity obtained with DTMP was significantly better than that obtained with high rate and low rate stimulation programs (HRP and LRP, respectively). This work also showed that DTMP modulated biological processes associated with neuroglial interactions toward a non-painful naïve state, more effectively than the other traditional SCS approaches. Given that the analyses in that report were based in the full tissue transcriptome (i.e. the entire set of genes detected), an important matter that remained pending was demonstrating that the electrical fields used in the DTMP approach could differentially target neurons and glial cells (microglia, astrocytes, and oligodendrocytes) in the spinal cord tissue examined.
To address this critical matter, we examined sets of genes (transcriptomes) from our collected data that are known to be uniquely and unequivocally over-expressed by the different cell types.4,5 The expression changes of genes in these cell-specific transcriptomes upon treatment with DTMP, LRP, or HRP were compared to those in untreated animals. Correlations of gene expression patterns produced by each SCS treatment with that of healthy naïve animals were used to quantify the extent to which each SCS treatment produced changes in each of the cell-specific transcriptomes. High positive correlations indicate a large extent of return of cell expression levels toward those found in the naïve state. This work presents the results of this analysis.
Methods and Materials
A full description of the experimental design is provided elsewhere. 3 Briefly, the study was approved by the Institutional Animal Care and Use Committee at Illinois Wesleyan University. Male adult Sprague–Dawley rats (Envigo, Indianapolis, IN) weighing 275–315 g were randomized into five groups. Animals in four of the groups were subjected to the SNI model of neuropathic pain and implanted with a miniaturized SCS lead. Animals in one of these groups did not receive stimulation (No-SCS, n = 10), while animals in the other three groups were subjected to 48 h of continuous SCS with either DTMP (n = 9), LRP (n = 11) or HRP (n = 10). A control group (n = 7) consisted of naïve animals with no surgical intervention. Animals were housed individually in a temperature and humidity control room and subjected to a 12-h light/dark cycle. Food and water were supplied ad libitum.
DTMP utilizes multiplexed charge-balanced pulsed signals with components at frequencies of 50 Hz (150 µs pulse width, PW) and 1200 Hz (50 µs PW), distributed over the four contacts of the lead. LRP was set to 50 Hz and 150 μs PW, and HRP at 1200 Hz and 50 μs PW.Signal intensities were set to ∼70% of the motor threshold (MT) tested under a given stimulation program and were in the 0.02–0.10 mA range for HRP, 0.03–0.09 mA range for LRP, and 0.03–0.10 mA range for DTMP. Programs were not duty cycled, and the initial intensities were kept throughout the 48 h of stimulation. Naïve and No-SCS animals were assessed in parallel to the stimulated animals.
Animals were euthanized after stimulation and the ipsilateral dorsal quadrant of the L1–L2 segment of the cord, which was underneath the SCS lead, was harvested. RNA was extracted and sent to the Roy J. Carver Biotechnology Center at the University of Illinois at Urbana-Champaign for RNA sequencing (RNAseq). Barcoded RNAseq libraries were constructed with the TruSeq® Stranded mRNA Sample Prep kit (Illumina, San Diego, CA) and quantitated with Qubit™ (ThermoFisher, Waltham, MA). These libraries were diluted to 10 nM and further quantitated using the Polymerase Chain Reaction (qPCR) on a CFX Connect™ Real-Time qPCR system (Biorad, Hercules, CA) for accurate pooling of the barcoded libraries and maximization of the number of clusters in the flow cell. Pooled barcoded libraries were loaded on an eight-lane flow cell for cluster formation and sequenced on an Illumina HiSeq® 4000 (Illumina, San Diego, CA). The libraries were sequenced from one end of the cDNA fragments for a total of 100 base pairs (bp). Salmon v 0.8.2 was used to quantify the abundance of each transcript based on the NCBI’s Rnor_6.0 transcriptome, Annotation Release 106.6 Gene-level counts were estimated from transcript-level counts using the “bias-corrected counts without an offset” method from tximport v 1.6.0, which provides more accurate gene-level counts and keeps multi-mapped reads in the analysis compared to traditional genome alignment methods. 7 Gene-level counts were imported into R v 3.4.3 and genes without at least 0.5 counts per million after trimmed-mean of M values (TMM) normalization in at least four samples were filtered out. 8 TMM normalization factors were re-calculated, and log2-based count per million values (logCPM) were calculated using edgeR v 3.20.5.9 Differential gene expression analysis was performed using the limma-trend method on the logCPM values for naïve and SCS-treated groups relative to untreated animals (No-SCS).10,11
Cell-specific transcriptomes for neurons, astrocytes, oligodendrocytes (both precursors and matured), and microglia were obtained from the literature.4,5 The dataset for neurons, astrocytes, and oligodendrocytes was generated using cell sorting and high-quality purification techniques that identified, isolated, and purified each of these cell types from the forebrain of young mice. 4 The mRNA contained in these isolated and purified cell-specific samples was quantified using microarray techniques to develop master lists of genes consistently expressed by only one cell population. The microglia-specific transcriptome was obtained using cell sorting and purification techniques that isolated microglia from the brain of young adult mice. 5 Direct RNA sequencing was used to identify and quantify genes that were differentially enriched in the isolated microglia relative to the content in full brain of the rodents. These cell-specific lists were cross-referenced to our own whole-transcriptome data. Data that overlapped for every cell type were used in the analysis. Pearson correlations coefficients (R) and p values were calculated (Microsoft Excel for Windows 10) for the correlation between the gene expression pattern in each cell-specific transcriptome for each SCS treatment (relative to No-SCS) and the expression pattern of naïve (relative to No-SCS). A correlation with a p value below 0.05 was considered significant.
The percentage of genes which underwent expression changes due to the pain model by at least 10% (%Cp) was estimated for each cell-specific transcriptome. The percentage of expression change (%C) due to the pain model was obtained for each gene as follows (equation 1)

The percentage of genes that returned toward the expression level in the naïve state (%RSCS) due to each SCS treatment was also obtained for each cell-specific transcriptome. To determine if the expression of a gene had returned to naïve levels, a recovery factor (Rf) was estimated for each gene as follows (equation 2)

Finally, the percentage of genes that had expression levels within 15% of the expression levels in naïve animals (%Dn) was obtained for each cell-specific trancriptome. This was based on the percentage difference in the expression level of a gene as a result of SCS relative to that in the naïve state (%CSCS) calculated as follows (equation 3)

Gene ontology enrichment analysis (GOEA) for biological processes and molecular functionality as well as interaction network maps were performed using the String Database web-based freeware application (String Database v11.0). 12 Biological processes or molecular functionality are considered significantly enriched when the false discovery rate (FDR)-based p value is below 0.05 (FDR p < 0.05).
Results
The neuron-specific transcriptome from our data was cross-referenced with the 72 genes of the literature set. The astrocyte-, oligodendrocyte-, and microglia-specific transcriptomes from our data cross-referenced with 188, 154, and 101 genes of the literature lists, respectively. These lists are provided in the Supplementary Material. Figure 1 shows heat maps for the four cell-specific transcriptomes for gene expression ratios (i.e. fold changes) for Naïve:No-SCS, DTMP:No-SCS, HRP:No-SCS, and LRP:No-SCS. Table 1 shows the Pearson correlation coefficients (R) and p values for the comparison of gene expression patterns of each treatment relative to naïve. Table 1 also shows the percentage of genes in each transcriptome that has at least a 10% change in gene expression as a result of the pain model (No-SCS) relative to naïve (%Cp), as well as the percentage of genes returned toward naïve levels by each SCS treatment (%RSCS) and the percentage of genes that resulted with expression levels within 15% of those in the naïve state (%Dn) due to SCS treatment. It is important to mention here that untreated animals (No-SCS) represent a pain state, while naïve animals represent a healthy state.

Differential gene expression heat maps for cell-specific transcriptomes of each SCS treatment relative to no treatment (pain state) compared to the healthy state (naïve) relative to the pain state (No-SCS). For illustration purposes, genes that did not change more than 10% as a result of the pain model (No-SCS) relative to naïve were not included in the figure.
Pearson correlation coefficients (R), percentage of genes changed by the pain state relative to naïve (%Cp), percentage of genes recovered by SCS (%Rscs) and percentage of genes that ended near naïve levels upon SCS treatment(%Dn) for each cell-specific transcriptome.
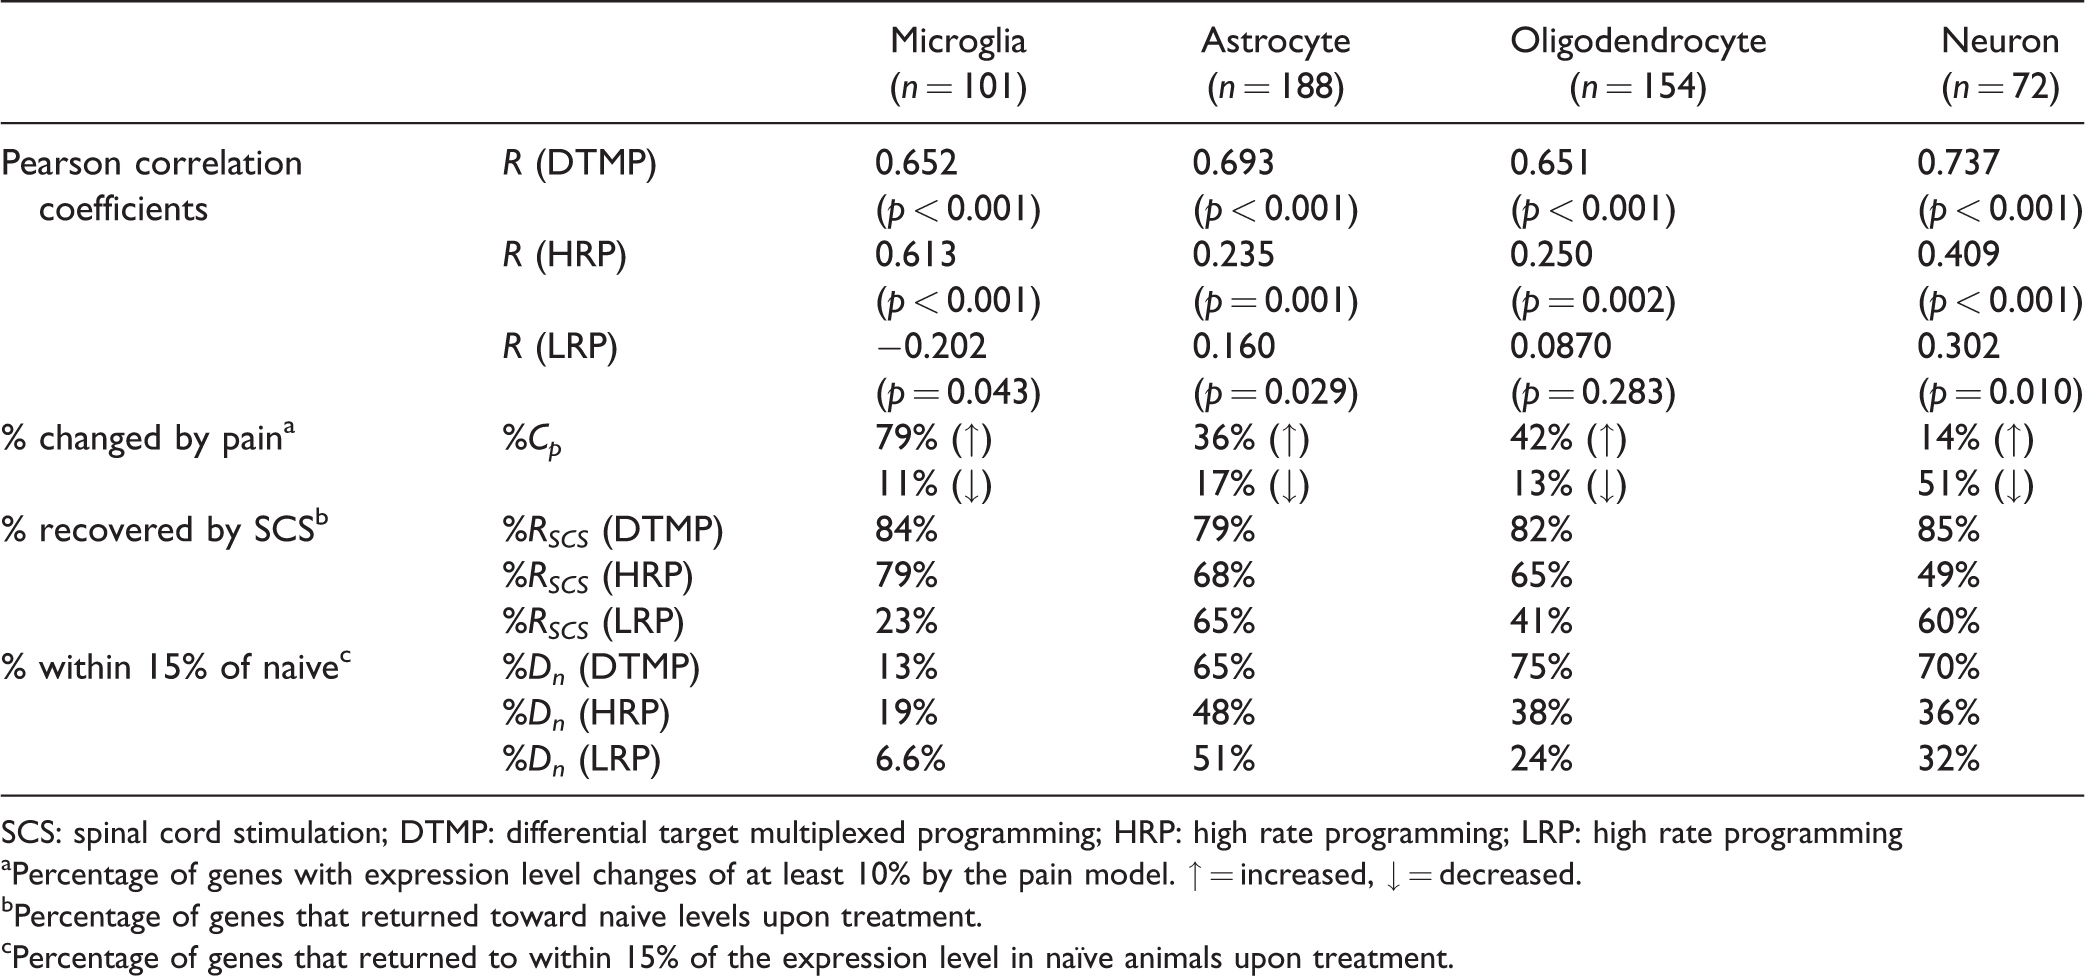
SCS: spinal cord stimulation; DTMP: differential target multiplexed programming; HRP: high rate programming; LRP: high rate programming
aPercentage of genes with expression level changes of at least 10% by the pain model. ↑ = increased, ↓ = decreased.
bPercentage of genes that returned toward naive levels upon treatment.
cPercentage of genes that returned to within 15% of the expression level in naïve animals upon treatment.
Table 2 shows the most significant biological processes related to the 40 most upregulated genes by the pain model in the microglia-specific transcriptome. Table 3 shows the most significant biological processes related the top 40 most downregulated genes by the pain model in the neuron-specific transcriptome. Tables for the most significant biological processes involving oligodendrocytes and astrocytes are found in the Supplementary Material. This also contains interaction network maps and molecular functionality enrichment for each cell type.
Top 10 most significant biological processes related to the 40 most upregulated genes by the pain model in the microglia-specific transcriptome.a

FDR: false discovery rate.
aA list of the 117 biological processes found to be significant, and an interaction network of these 40 genes can be found in the Supplementary Material.
Ten of the top most significant biological processes related to the 40 most downregulated genes by the pain model in the neuron-specific transcriptome.a

FDR: false discovery rate.
aA list of the 80 biological processes found to be significant and an interaction network of these 40 genes can be found in the Supplementary Material.
Discussion
Effect of the pain model in the cell-specific transcriptomes
It is evident that the SNI model of neuropathic pain has a strong effect on the cell-specific transcriptomes, as illustrated clearly by the differential gene expression between naïve (healthy state) and No-SCS (pain state) animals (left-most columns in Figure 1). This is also reflected in the percent of genes that have experienced at least a 10% change in the expression levels in going from the naïve to the pain state (%Cp in Table 1). The total of genes (sum of both up and downregulated) being modulated by pain corresponds to 65% of neuron-specific genes, 90% of microglia-specific genes, 55% of oligodendrocyte-specific genes, and 53% of astrocyte-specific genes contained within our data. An interesting result from the analysis is that in all glial cell-related transcriptomes, the pain model up regulates most of the genes. The larger effect is especially observed in the microglia gene set, where 79% of genes are upregulated by the pain model. In contrast, the pain model down regulates most of the genes specific for neurons (51%). This counter effect in the expression levels of glia and neurons imply an imbalance in neuronal–glial interactions as a result of the establishment of neuropathic pain.
As previously reported, the pain model sets an immune and inflammatory response that involves glial cells.3,13 The larger effect on microglia reflects the early stage of the development of chronic pain in our model. By the time tissues are dissected, animals in the untreated group have experienced seven days of pain-like behavior. At such stage, microglia are the most active glia population, as they are heavily engaged in responding to injury. A GOEA on the microglia genes most upregulated by the pain model implies that these are involved in signaling pathways that activate the immune response (Table 2). As expected, the expression of astrocyte-specific genes was not affected at the same extent. The effect of astrocyte activation is known to manifest more robustly as the pain process extends. We also found that the %Cp for oligodendrocyte-specific genes is remarkably similar to that found in the astrocyte-specific genes. This result reaffirms the role of oligodendrocytes in the establishment of chronic pain14,15 and emphasizes that the effect of the pain model on oligodendrocytes during the early stages of pain chronification is not as noticeable as it is in the microglia.
As mentioned above, the overall effect of the pain model in the neuron-specific transcriptome contrasts with that found for the glial transcriptomes. The expression levels of neuronal genes are mostly downregulated. A GOEA for the 40 most downregulated neuron-specific genes by the pain model (Table 3) implies that pain affects biological processes involved with neurotransmission via ion transmembrane transport, as well as proper neuronal development. It is well known that chronic pain reduces inhibitory neurotransmission that involves the reduction of the activity of GABAergic cells. 16 Previous research in rodent models also demonstrated that neuropathic pain causes apoptosis of neurons in the dorsal horn of the spinal cord. 17
Effect of SCS treatment in the cell-specific transcriptomes
The results clearly indicate that SCS has a modulating effect on the gene expression of cells in neural tissue. However, the characteristics of the electrical stimulation field influence the extent of the modulation of gene expression patterns for each specific cell population. For instance, treatment with LRP correlates the least with the naïve state profile. Correlations for microglia-, astrocyte-, and neuron-specific cells were significant, albeit weak. Interestingly, the correlation for the microglia-specific transcriptome was negative. This indicates that the expression levels of certain genes modulated by the pain model are further modulated in the same direction by LRP. Indeed, LRP upregulates many microglia-specific genes that are already upregulated by the pain model. This implies that LRP increases the effect on the signaling and immune processes that have been affected in the pain state. Whether this effect is beneficial or not would depend on the role of these processes in terms of neuroprotective or neurodegenerative effects that microglial activation may induce. These effects will be presented in future work in which the changes in the expression of genes associated with microglial phenotypes will be studied.
The correlations between HRP treatment and naïve for all cell-specific transcriptomes are statistically significant and positive. Only the correlation for the microglia-specific transcriptome is strong, while the correlation for the neuron-specific transcriptome is moderate, and the other two correlations are weak. In contrast to the effect of LRP, HRP drives microglia gene expression toward the naïve state as a predominant effect, while the effect of astrocytes, oligodendrocytes, and neurons is weaker.
The effect of multiplexing stimulating electrical signals as done in DTMP is significant. The correlations between DTMP treatment and naïve animals were positive and strong for all the cell-specific transcriptomes. In contrast with the other two treatments, DTMP is more effective at modulating gene expression in all cell types and more strongly in the direction of expression levels in the naïve state. The enhanced effect of DTMP is also reflected in the percentage of genes that are modulated back toward the naïve state (%RSCS in Table 1). DTMP modulates about 80% or more of the genes toward the naïve state in all cell populations. Only HRP has a similar effect on the microglia population. Indeed, it can be stated that the HRP treatment only matches DTMP on its effect on microglia, while LRP does not match the effect of DTMP in any of the different cell populations. Additionally, when compared to HRP and LRP, the cell-specific transcriptomes related to DTMP contained the largest percentage of genes with expression levels that are within 15% (%Dn in Table 1) of the levels they have in the healthy naïve state. In this respect, the effect of DTMP and HRP in microglia-specific genes is also similar, although less than 20% of these genes returned to expression levels within 15% of the naïve state. It is plausible that at the early stage of pain chronification studied here, the large expression levels of microglia genes overcome the effect of 48 h of SCS with DTMP or HRP and thus the effect of stimulation may not yet be pronounced in this cell population. Future work is planned to explore the effect of the pain model at longer times and how longer exposure to SCS affects the neuronal and non-neuronal cell populations.
This study provides evidence that the multiplexing of electric signals as implemented in DTMP is effective at returning a majority of genes in the transcriptomes of neuron and glial cells to the expression patterns found for naïve animals. In contrast, HRP provides similar effects only at the microglia-specific genes and only weak to moderate effects on the other cells’ genes. LRP, on the other hand, is weakly effective, and for many genes in the microglia-specific transcriptome, it enhances the effect of the pain model.
There are certain limitations in this study. The study depicts an early stage in the chronicity of the pain model, equivalent to 3–4 months of pain in humans. 18 It is likely that the results would be different at longer times when the astrocytes have become more active. Also, 48 h of continuous stimulation is not a reflection of the clinical long-term stimulation periods used in humans. It is plausible that longer durations of stimulation may result in different outcomes. For instance, gene expression profiles for HRP and LRP may yield stronger correlations with naïve profiles, similar to those obtained with DTMP. Another limitation is that, given the limited existing data, the cell-specific transcriptomes used for comparisons were obtained from brain cells in mice. However, the evolutionary similarities in the role of glial cells and neurons imply that the cell-specific transcriptomes of neural cells in mice and rats should be remarkably similar. It is our intention to address these limitations in future studies through utilization of longer stimulation periods and generating cell-specific transcriptomes from rat spinal cords.
Supplemental Material
sj-pdf-1-mpx-10.1177_1744806920964360 - Supplemental material for Spinal cord stimulation using differential target multiplexed programming modulates neural cell-specific transcriptomes in an animal model of neuropathic pain
Supplemental material, sj-pdf-1-mpx-10.1177_1744806920964360 for Spinal cord stimulation using differential target multiplexed programming modulates neural cell-specific transcriptomes in an animal model of neuropathic pain by David L Cedeño, William J Smith, Courtney A Kelley and Ricardo Vallejo in Molecular Pain
Footnotes
Author Contributions
DLC and RV designed the experiments. CAK performed experiments; DLC, WJS, CAK and RV analyzed the data. All authors contributed to the drafting and revisions of the manuscript. DLC and RV managed the project.
Declaration of Conflicting Interests
The author(s) declared the following potential conflicts of interest with respect to the research, authorship, and/or publication of this article: DLC and RV are co-inventors of patents related to SCS using differential target multiplexed programming. They are consultants for SGX Medical LLC and Medtronic Inc. CAK is a consultant for SGX Medical LLC. WJS has no conflict of interest to declare.
Funding
The author(s) disclosed receipt of the following financial support for the research, authorship, and/or publication of this article: The study was funded by Millennium Pain Center and Stimgenics.
References
Supplementary Material
Please find the following supplemental material available below.
For Open Access articles published under a Creative Commons License, all supplemental material carries the same license as the article it is associated with.
For non-Open Access articles published, all supplemental material carries a non-exclusive license, and permission requests for re-use of supplemental material or any part of supplemental material shall be sent directly to the copyright owner as specified in the copyright notice associated with the article.