
Abstract
Offset analgesia is defined by a dramatic drop in perceived pain intensity with a relatively small decrease in noxious input. Although functional magnetic resonance imaging studies implicate subcortical descending inhibitory circuits during offset analgesia, the role of cortical areas remains unclear. The current study identifies cortical correlates of offset analgesia using functional near infrared spectroscopy (fNIRS). Twenty-four healthy volunteers underwent fNIRS scanning during offset (OS) and control (Con) heat stimuli applied to the forearm. After controlling for non-neural hemodynamic responses in superficial tissues, widespread increases in cortical oxygenated hemoglobin concentration were observed, reflecting cortical activation during heat pain. OS–Con contrasts revealed deactivations in bilateral medial prefrontal cortex (mPFC) and bilateral somatosensory cortex (SSC) associated with offset analgesia. Right dorsolateral prefrontal cortex (dlPFC) showed activation only during OS. These data demonstrate opposing cortical activation patterns during offset analgesia and support a model in which right dlPFC underlies ongoing evaluation of pain intensity change. With predictions of decreasing pain intensity, right dlPFC activation likely inhibits ascending noxious input via subcortical pathways resulting in SSC and mPFC deactivation. This study identifies cortical circuitry underlying offset analgesia and introduces the use of fNIRS to study pain modulation in an outpatient clinical environment.
Keywords
Introduction
Subjective pain intensity experienced during a noxious stimulus is significantly lower if it is immediately preceded by a stronger noxious stimulus. This phenomenon, termed “offset analgesia,” is thought to represent and perhaps be a measure of endogenous pain inhibition.1–3 Animal models of chronic pain have demonstrated progressive deficits in endogenous pain inhibitory pathways measured by invasive physiologic techniques, implicating a loss of pain inhibition in chronic pain pathophysiology. 4 Despite these preclinical data, it remains unclear whether pain inhibition plays a central role in initiating or maintaining pain in patients with chronic pain.5,6 To address this gap, multiple studies have sought to determine mechanisms underlying human quantitative sensory testing paradigms reflecting endogenous analgesia, including offset analgesia, so that mechanistic changes in patients might be measured to refine diagnosis, optimize treatment, or identify targets for non-invasive stimulation.
In the laboratory setting, offset analgesia is most commonly studied using a complex, 3-step, suprathreshold heat stimulus. 3 Pain intensity is reported, often continuously in real-time with a computerized visual analogue scale, and offline analysis of pain intensity demonstrates a dramatic drop in pain intensity with a small step down in noxious heat. The dynamics of continuous pain intensity ratings reported during the 3-step stimulus and other related paradigms argue against adaptation accounting for offset analgesia.2,7 Although peripheral mechanisms may contribute, behavioral,8–11 neuroimaging,12–15 and computational modelling8,16 studies support a central nervous system mechanism. Brain activity during offset analgesia has been studied primarily with functional magnetic resonance imaging (fMRI) blood-oxygen-level-dependent (BOLD) imaging. BOLD activations have been observed in areas consistent with the periaqueductal gray (PAG) and rostroventral medulla (RVM),12,13,17 implicating descending inhibitory pathways. Indeed, offset analgesia has been associated with decreases in spinal cord dorsal horn activation, 15 consistent with offset analgesia involving a descending inhibitory circuit in which the PAG inhibits ascending nociceptive input from the spinal cord dorsal horn via RVM.18,19 Cortical regions including the prefrontal cortex and somatosensory cortex have been implicated in offset analgesia. However, whether these structures are activated 13 or deactivated 12 during offset analgesia is not clear.
The relationship of cortical activity and offset analgesia becomes particularly relevant in the clinical context of chronic pain. Offset analgesia is diminished in neuropathic pain, 20 migraine, 21 and fibromyalgia. 22 Interestingly, frontal cortical function is impaired in chronic pain during non-painful cognitive tasks. 23 Additionally, frontal and sensorimotor cortical areas are potential non-invasive stimulation targets to treat chronic pain.23,24 Understanding cortical activity during offset analgesia would clarify normal physiology, frame changes in brain function in the setting of chronic pain, and potentially inform non-invasive stimulation targets. The current study sought to elucidate cortical activity during offset analgesia by measuring activity-dependent hemodynamic changes with functional near infrared spectroscopy (fNIRS).
FNIRS is a cost-effective, portable, non-invasive neuroimaging tool that complements fMRI BOLD by measuring hemoglobin concentration in cerebral cortex over time.25–27 FNIRS is uniquely suited to study pain intensity changes since changes in blood flow due to well-known autonomic responses to acute pain can be adjusted for as part of signal analysis to isolate blood flow changes due to neuronal activity. 28 Prior fNIRS studies have found dynamic cortical responses to different experimental painful stimuli29–35 and surgical stimuli.36,37 During 5-second painful heat33,34 or electrical stimuli,29,30 oxygenated hemoglobin concentration dynamically changes in both frontal and sensorimotor regions, with the largest changes observed a few seconds after the stimulus ends. Morphine attenuates these cortical changes. 38 The effect of longer noxious stimuli on frontal and somatosensory cortex hemodynamic change is less well studied. In a study focusing only on frontal NIRS responses that did not control for autonomic responses to pain, a painful 15°C water immersion was associated with increases in hemoglobin oxygenation in the frontal region. 31 It remains unknown whether endogenous pain modulation, including offset analgesia, affects pain related cortical signals measured by fNIRS.
The current study investigates the cortical responses to offset analgesia using fNIRS in healthy volunteer subjects. During offset analgesia and constant control stimuli, hemodynamic signals were measured bilaterally over the frontal and somatosensory cortex. Analytic techniques controlling for autonomic hemodynamic changes were used to identify cortical hemodynamic correlates of offset analgesia. Additionally, real-time pain intensity ratings were collected during fNIRS scanning, to confirm the presence of offset analgesia and allow for complementary analytic approaches based on both heat stimuli and pain intensity parameters. In this manner, the current study aimed to elucidate the role of the frontal and somatosensory cortex in offset analgesia.
Methods
Participants
Nine male and fifteen female healthy volunteers provided signed informed consent to participate in this cross-sectional study, which was approved by the University of Pittsburgh Institutional Review Board (Study #19030002). Participants were recruited from the University of Pittsburgh Clinical and Translational Science Institute (CTSI) Pitt+Me research registry, which includes more than 200,000 people from the Pittsburgh area reporting an interest in research study participation. The sample size was determined based on the number of participants required to observe behavioral measures of offset analgesia in the same target population. 19
For inclusion, participants were required to be 18–50 years old. Participants were excluded from the study if they endorsed any of the following: (1) active ongoing pain every day that was acute or chronic in duration, (2) current use of narcotics (including opioids) or other analgesic medications, (3) clinically unstable systemic illness judged to interfere with the study, (4) current severe medical disorder, (5) a lifetime history of mood disorder or psychosis, (6) use of antidepressants, psychotropic medications, or medications known to affect the autonomic nervous system (e.g., beta-receptor antagonist), (7) non-ambulatory status, (8) pregnancy, (9) unable to complete written questionnaires in English, (10) forearm tattoos at sensory testing sites, or (11) history of brain surgeries.
After participants reported an interest in the study to the Pittsburgh CTSI Pitt+Me research registry, study staff contacted the participants to determine study eligibility. If the participants were eligible, they were scheduled for the single study visit, which took approximately 2 hours to complete. Participants were compensated financially for their travel and time.
Study visit timeline
Participants arrived to the lab, which was located within an outpatient clinical office. After review and provision of informed consent, the participants answered a set of standardized questionnaires and were then fitted with the NIRS cap (Figure 1(a)). During NIRS scanning, participants underwent a heat pain calibration paradigm with a cutaneous heat thermode. Next, a suprathreshold heat stimulus paradigm designed to measure offset analgesia was administered (Figure 1(b)) using the same setup and equipment as the heat pain calibration paradigm (Figure 1(a)). At the end of the sensory testing, the NIRS cap was removed and participants completed post-testing questionnaires. Experimental design. A. Participant setup, depicting thermode placement on the left forearm, the computerized visual analogue scale for real-time pain intensity rating controlled with the right hand, and placement of the NIRS cap. B. The two different suprathreshold heat stimuli used to measure offset analgesia. T1 is the individually tailored temperature that evokes a moderate pain (50/100 mm on the COVAS). T2 is 1 C° hotter than T1. C. NIRS head probe with sources and detectors positioned across the frontal and sensorimotor cortices. For region-of-interest (ROI) analysis, Brodmann areas (BA) are shown with the corresponding color intensity reflecting channel weights for a given ROI.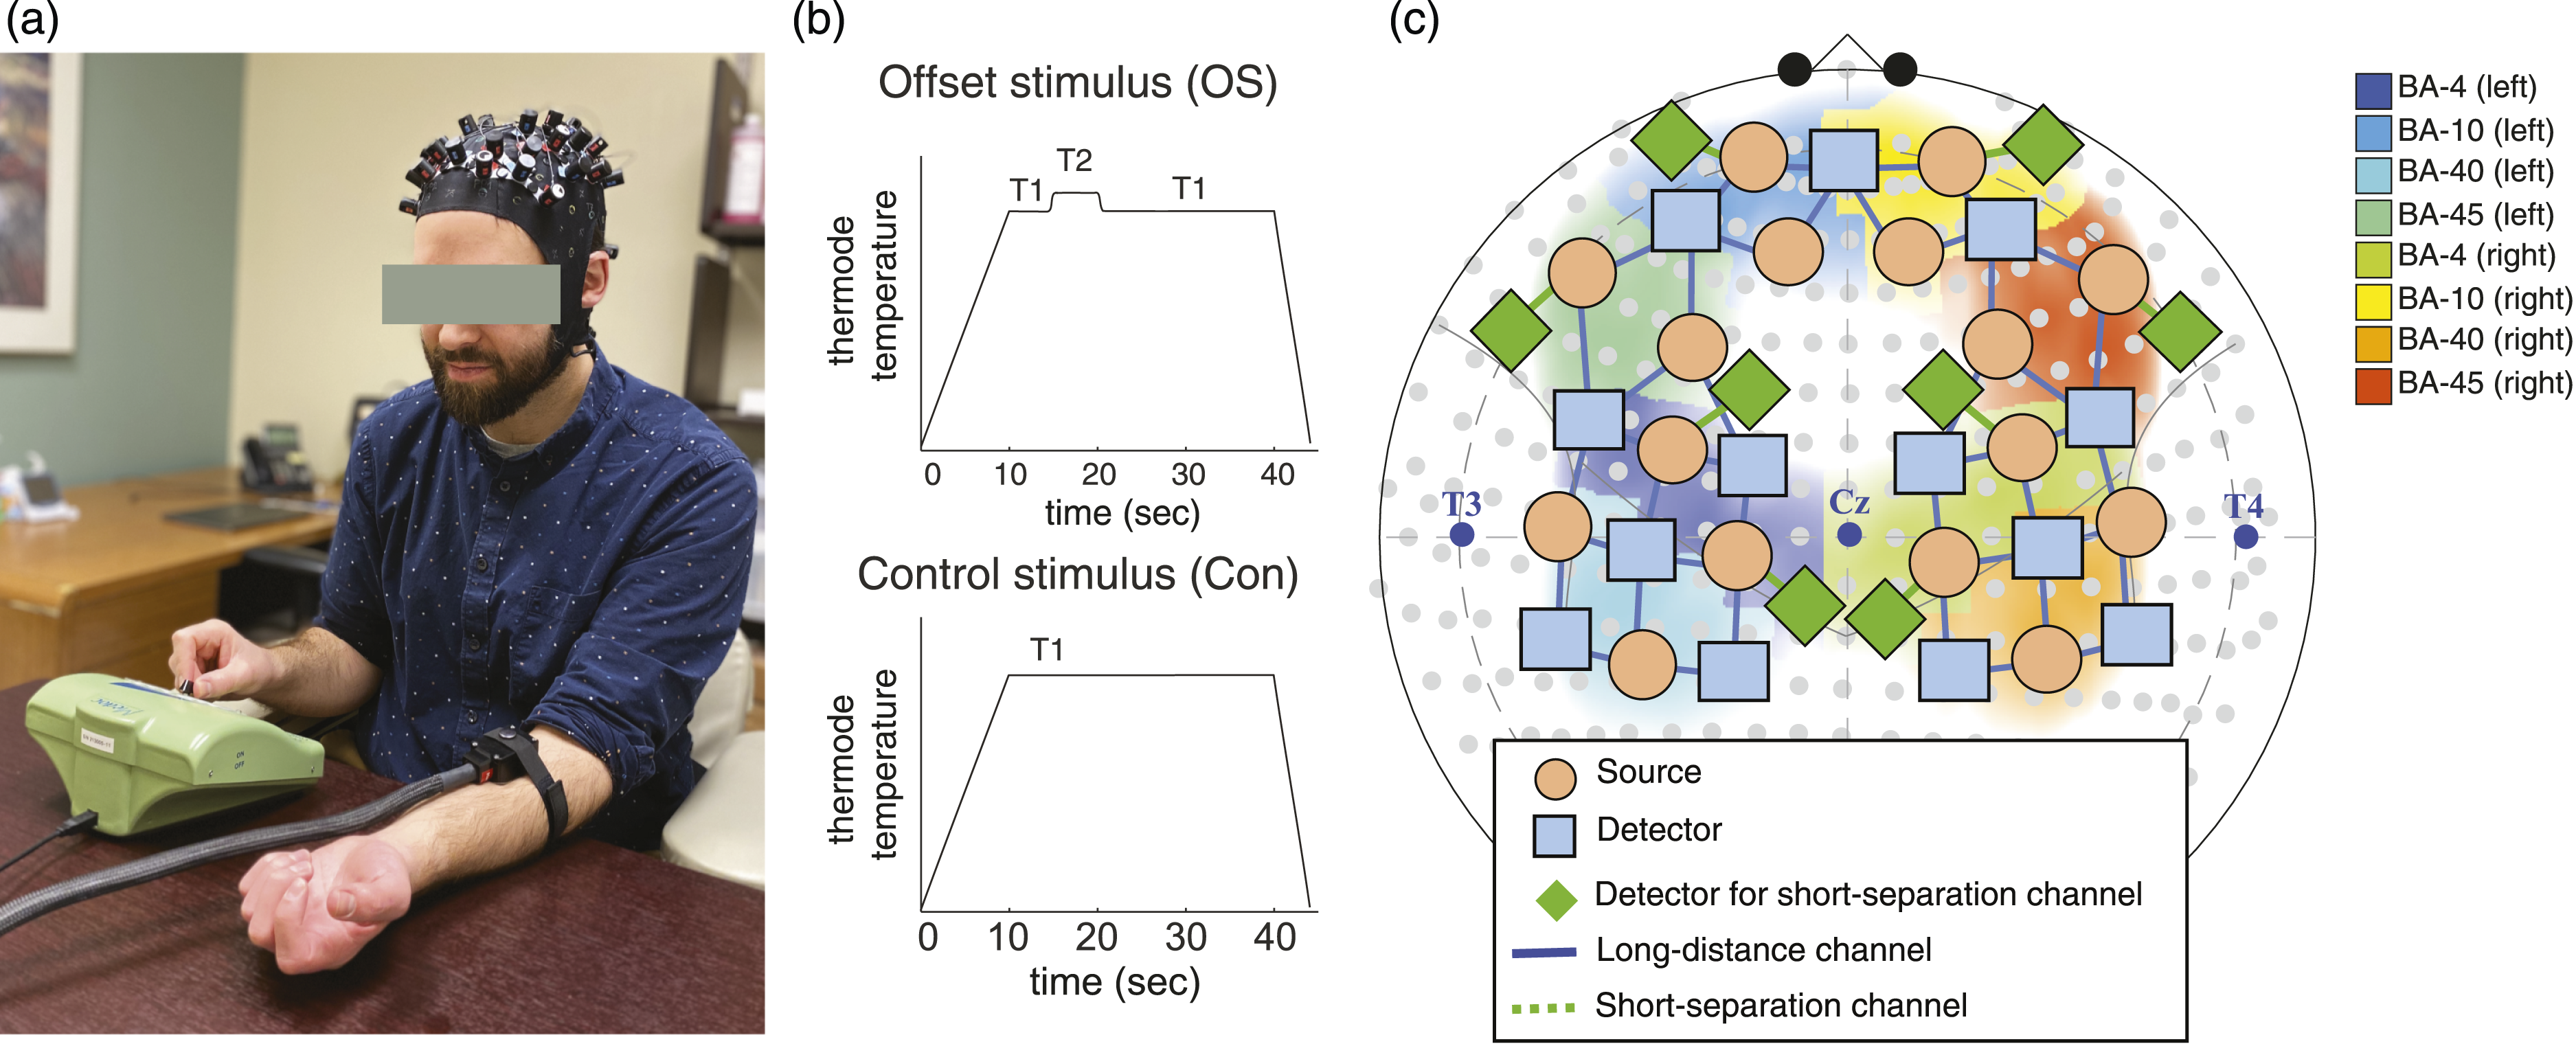
Questionnaires
Participants completed a survey including self-reported demographics, medical information, and standardized psychometric questionnaires, summarized and administered as previously done. 19 Briefly, the psychometric surveys included instruments measuring social status (BSMSS), depression (BDI-II), anxiety (STAI Y-1 and Y-2), impulsivity (BIS-11), and pain catastrophizing (PCS). The BSMSS generates an ordinal score reflecting the respondent’s education and occupation as well as the education and occupation of their parents and spouse. 39 The BDI-II generates a combined ordinal score reflecting depression with excellent psychometric properties across different populations. 40 The STAI measures both state (Y-1) and trait (Y-2) anxiety, producing an ordinal score reflecting apprehension, tension, nervousness, and arousal.41,42 The PCS measures catastrophic thinking associated with pain incorporating magnification of pain-related symptoms, rumination about pain, feelings of helplessness, and pessimism about pain-related outcomes. 43 The BIS-11 measures attentional, motor, and non-planning impulsiveness 44 which are associated with reward processing relevant to pain and addiction.45,46 After sensory testing outlined below, the STAI Y-2 and the situational pain catastrophizing scale (SPCS), measuring catastrophizing related to a pain experience, 47 were administered.
Heat pain calibration
Subjects were comfortably seated in an office chair in front of a small table with the NIRS cap positioned for all sensory testing paradigms (Figure 1(a)). A TSA-II 3 × 3 cm thermode (ATS model, Medoc; Ramat Yishai, Israel) was applied to the left forearm and secured with a Velcro strap. First, heat pain threshold was measured in triplicate at three different locations on the forearm as previously done 19 with participants reporting the transition from heat to pain via button press during a ramped heat stimulus (1.5 C°/sec). Specific instructions were for the participant to press the button “when the sensation in your forearm changes from heat to pain”. The temperature reached at button press was recorded as the heat pain threshold. The heat stimulus maximum was set to 55°C with an interstimulus interval (ISI) of 2 minutes.
Next, based on the heat pain threshold, a previously described calibration protocol 19 was used to individualize suprathreshold heat pain stimuli offset analgesia paradigm described below. Briefly, participants were asked to rate pain intensity during an ascending series of 30-second noxious heat stimuli applied to the forearm with the Medoc thermode. Participants rated their pain during the constant noxious heat stimuli in real time by operating a Computerized Visual Analogue Scale (COVAS, Medoc) with their right hand. The COVAS device features a horizontally positioned slider connected to a potentiometer inside the device and a 100-mm visual analogue scale (VAS) positioned externally along the slider. The anchors to the VAS were “no pain sensation” on the left and “most intense pain sensation imaginable” on the right. Pain intensity was recorded using Medoc software. Real-time plots of the pain intensity curves were monitored by the experimenter during each 30-second stimulus, which involved a ramp to target temperature (1.5 C°/sec), a 30-second hold at target temperature, and then a ramp back to baseline temperature (32°C) at a rate of 6 C°/sec. Pain intensity and thermode temperature were not visible to the participant. The initial target temperature for the series of heat stimuli was either 2 C° higher than heat pain threshold rounded to the nearest whole number or, if the heat pain threshold was greater than 45°C, 45°C. Then, the target temperature was increased by 1 C° for each stimulus (ISI 2 min) until the participant reported a pain intensity of approximately 50/100 mm on the COVAS (within a window of 40–60/100 mm). This temperature was used as the individualized noxious heat temperature for that participant, termed “T1”. The maximum temperature cutoff for the target temperature was 47°C to prevent tissue damage. Each stimulus in the set of ascending heat stimuli was applied to one of three locations on the forearm, rotating amongst them, so that the time between stimuli for a given skin site was ∼6 minutes.
Suprathreshold heat stimuli to measure offset analgesia:
A mixture of two suprathreshold heat stimuli were delivered through the Medoc thermode: a standardized “offset stimulus” (OS) and a constant control stimulus (Con).3,19 Each stimulus type was repeated in triplicate with an ISI of 2 minutes, rotating between three forearm skin sites as done with the calibration procedure. Stimulus order alternated between OS and Con with a counterbalanced design, such that half participants experienced the OS first and half experienced the Con stimulus first. There were no order effects detected for behavioral measures of offset analgesia.
The offset stimulus (OS; Figure 1(b) top) started from baseline (32°C) with a rise rate 1.5 C°/sec to target temperature (T1) held for 5 seconds, then an increase in thermode temperature by 1 C° (termed the T2 temperature) which was held for 5 seconds, then a decrease in temperature back to the T1 temperature which was held for 20 seconds, and finally a ramp (6 C°/sec) back to baseline temperature. Pain intensity during the time period after the decrease from T2 to T1 is examined for offset analgesia. 3
The constant control stimulus (Con; Figure 1(b) bottom) started from baseline (32°C) with a rise rate 1.5 C°/sec to target temperature (T1), continues with a hold at T1 for 30 seconds, and then returns to baseline at a rate of 6 C°/sec. Comparing the last portion of the OS with the Con stimulus in a time period following the “temperature offset” from T2 to T1 allows for a within-subject control for pain intensity adaptation known to occur during a prolonged noxious stimulus.3,19 Offline analysis of pain intensity curves to calculate offset analgesia is described below.
Functional near-infrared spectroscopy
FNIRS measures brain activity non-invasively by measuring hemodynamic changes of the cortex with infrared light. 27 Light travels from an emitter on the scalp, is both scattered by tissues and absorbed by hemoglobin, and returns to a scalp detector optode. Using a modified Beer-Lambert law, 48 changes in attenuation of light at specific wavelengths for oxygenated (HbO) and deoxygenated (HbR) hemoglobin can be calculated, providing a measure of change in HbO and HbR concentration over time. Since neuronal activity elicits a hemodynamic response, there is an increase in HbO and a decrease in HbR with brain activation, similar to the fMRI BOLD signal. 26 Changes in HbO and HbR for an emitter-detector pair (termed “channel”) spatially reflect change in tissues at the midpoint of the channel and a depth of roughly half the distance between the two optodes. Long-separation channels measure deeper cortical activity, while short-separation channels measure non-neuronal hemodynamic changes in skin (i.e., systemic physiological noise).
NIRS data were recorded using a commercial NIRScout-2 (NIRx, GmbH, Berlin, Germany) continuous fNIRS system with short-separation measurements. A total of 50-channels (42 channels for long distance and eight channels for short-separation measurements) were distributed across bilateral frontal cortex and bilateral sensorimotor cortex (Figure 1(c)). Long-distance channels comprised 16 source optodes (orange circles) and 13 detector optodes (blue rectangles) placed on the scalp (Figure 1(c)). One detector optode split into eight detectors (green diamonds) was used for short-separation channels in eight locations across the scalp. The blue solid-line represents long-distance channels and the green dotted-line represents short-separation channels. Figure 1(c) also shows the sensitivity of the probes overlying eight Brodmann areas: BA-4 (L, R), BA-10 (L, R), BA-40 (L, R), and BA-45 (L, R) which will be used for ROI analysis. Data for two wavelengths (760 and 850 nm) were recorded at a sampling rate of 7.8125 Hz. After positioning the headcap, signal quality was optimized using the NIRx Aurora software. Artifacts from hair were identified by poor signal optimization and/or lack of pulsatile hemodynamic change in raw signals at ∼1 Hz. To address this, hair was parted underneath the optode and signal optimization was repeated. Ambient light was blocked using an opaque, black shower cap. Following scanning, data were processed and analyzed offline as outlined below.
Statistical analysis
Thermode temperature and pain intensity curves from the Medoc were analyzed as previously described 19 using MATLAB 2021a (The MathWorks Inc, Natick, MA). Briefly, temperature-defined time points were extracted from raw Medoc data files. Key time points included the onset of the initial stimulus ramp, the time T1 was reached (∼10 after the onset of the stimulus ramp) in both OS and Con stimuli, and the time of temperature offset in the OS (temperature transition from T2 down to T1 at ∼20 seconds after the onset of the stimulus ramp). These time points were used to define the temperature epoch of interest for fNIRS analysis of offset analgesia, which is the 20–40 s time window after the start of the stimulus. Additionally, behavioral measures of offset analgesia were extracted from the pain intensity curves using these time points.
To calculate offset analgesia, the minimum of the pain intensity curve during the OS was determined first by determining the maximum pain intensity around the transition from T2 down to T1 using a time window of 10 seconds, centered on the T2-T1 transition. Next the minimum pain intensity following that maximum was calculated. This minimum value was recorded for a given OS replicate. To control for pain adaptation during the heat stimulus, pain intensity at the same time point was determined from the Con heat stimulus. Specifically, the pain intensity at the OS stimulus minimum determined above was extracted from the COVAS pain intensity curve during the Con stimulus. This procedure results in pain intensity at the OS minimum and Con at the equivalent time point for each paired OS-Con replicate. The three replicates were averaged within a given subject, plotted, summarized with descriptive statistics, and compared using paired t-tests with StataMP v14 (Statacorp, College Station, TX) and Prism 9 (GraphPad Software, La Jolla, CA). Pain difference curves were calculated with a simple subtraction of the replicate pairs of OS and Con pain intensity curves, each sampled at a rate of 1 Hz. For a given subject, the mean pain difference across replicates at each second was calculated. Single-subject curves during the 20–40 second interval were then plotted along with median values using Prism 9. Analysis of these group-level pain difference curves led to the behaviorally defined epoch of interest used in fNIRS analysis of offset analgesia.
For NIRS data, processing and data analysis were implemented in MATLAB 2021a (The MathWorks Inc, Natick, MA) as the part of an open-source AnalyzIR toolbox. 49 Raw light intensities for each wavelength and channel were resampled at 4 Hz, then converted to optical density, and finally converted to hemoglobin concentration with “OpticalDensity” and “BeerLambertLaw” modules, respectively. First level within-subject modelling was then performed. Given the superior performance in filtering motion artifacts and accounting for physiological noise, including cardiopulmonary oscillations, an iteratively pre-whitened general linear model, with short-separation channel data set as regressors-of-no-interest was used. 50 This GLM incorporated finite impulse response (FIR) deconvolution, rather than a canonical “boxcar” hemodynamic response function. This was done because the canonical hemodynamic response function imposes assumptions about task-based hemodynamic change, which may not apply to dynamic changes in pain during offset analgesia. On the other hand, FIR deconvolution is unconstrained, allowing for full estimation of the hemodynamic response (see Santosa et al. 51 for details and comparison of the performance with other models). In the GLM module in Toolbox, “FIR_smoothing” was used with a 16 second window and a 6-second (FWHM) Gaussian smoothing kernel. The eight short-separation NIRS channels were included as regressors of no interest using both HbO and HbR (16 regressors total) for all long channels. 50 After solving this within-subject GLM, a second-level fixed effects regression model was solved that included both time and stimulus type (offset stimulus versus control stimulus). The first level noise covariance models were used to pre-whiten the second level model and a robust (iterative outlier rejection) statistical estimator was used. Contrasts included epochs of interest that were temperature defined (20–40 sec following heat stimulus ramp onset) or behaviorally defined (10-second interval with maximal offset analgesia in a subgroup of participants with robust offset analgesia). For whole-brain analysis, Student’s t-statistic estimates and Benjamini-Hochberg false-discovery rate corrected p-values (q-values) were also calculated, addressing the problem of elevated type 1 error due to multiple comparisons. A significance level of q < 0.05 was used in heatmaps of T-scores plotted in 10–20 format. In a sensitivity group-level analysis, a fixed effects model was used to examine both average subgroup responses based on magnitude of offset analgesia, operationalized as a binary variable (“robust offset analgesia” versus “no offset analgesia”) created with a median-split of offset analgesia. This group-level model additionally supports iterative (robust) statistics described above to down-weight any outliers.
For region-of-interest (ROI) analysis, channel statistics derived from the first-level model, corresponding to hemoglobin concentration within a given channel and subject over time, were weighted and combined to capture activations in Brodmann areas (BA) 6, 10, 40, and 46 using the “roiAverage” utility in Toolbox. 49 This function uses the projected weights onto the NIRS channels of the Brodmann areas as defined in brain space using the Talairach daemon atlas 52 and location of the NIRS probe. This defines a tapered ROI weight across the channels to test the null hypothesis of that region's null involvement in the response. 49 Hemoglobin concentrations were normalized, setting the initial time point to a concentration value of zero, and then plotted for each region of interest, allowing a graphical analysis of change in hemoglobin concentration over time. Median hemoglobin values across the subjects are plotted. Student’s t-tests, T-scores, and q-values using Student’s t-test were calculated for a given ROI.
Results
i. Prolonged noxious heat stimuli are associated with activation of frontal and somatosensory cortex
Healthy, pain-free participants (N = 24; self-identified gender: nine male and 13 female; mean age 27.4 years ±standard deviation (SD) 8.7 years; 23 right handed) provided informed consent to participate in the study. Participants were positioned as in Figure 1 and heat stimuli were applied during fNIRS scanning. Group mean heat pain threshold on the left forearm was 46.6°C ± SD 2.1°C. To tailor the noxious temperature used for each participant to measure offset analgesia, a heat pain calibration procedure was performed. Using real-time pain intensity rating with a COVAS (Figure 1(a)), the 30-second heat stimulus that elicited a heat pain intensity of approximately 50/100 mm was determined for each participant and recorded as “T1” (Figure 1(b) bottom). Group mean T1 was 46.4°C ± SD 1.0°C. To measure offset analgesia, participants underwent a series of suprathreshold heat stimuli (Figure 1(b)), which included a mixture of offset stimuli (“OS”) and constant control stimuli (“Con”).
The offset and control stimuli evoked widespread activation in frontal and somatosensory cortices. In Figure 2, group-level, whole-brain contrasts of oxygenated (HbO) and deoxygenated (HbR) hemoglobin concentration are shown comparing the entire stimulus time period (from ramp onset until return to baseline, see Figure 1(b)) with the preceding baseline rest period. Channels measuring bilateral frontal and somatosensory cortical activity are significantly activated in both control (Figure 2(a)) and offset stimuli (Figure 2(b)). In somatosensory cortex, activations during the constant control stimulus appear to be more robust than the offset stimulus, with different regional patterns achieving statistical significance after adjusting for multiple comparisons (q < 0.05). In prefrontal cortex, varying levels of activation are noted in multiple regions, which suggest that each stimulus, offset versus control, may be associated with different regional patterns of activation. Cortical activation during prolonged noxious heat stimulation of the forearm. Whole-brain T-score heatmaps are displayed for each channel during constant control (A) and offset (B) stimuli. Forty-five seconds during noxious stimulation were contrasted with an immediately preceding baseline time period. In C., [OS-Con] contrast during the full 45-second stimulus time period is shown. Solid lines reflect statistically significant contrasts surviving correction for multiple comparisons (q < 0.05). Dashed lines are not statistically significant.
ii. In an epoch-of-interest analysis, offset analgesia is associated with differential cortical activation and deactivation.
To examine the neural correlates of offset analgesia, an epoch-of-interest (EOI) analysis during the suprathreshold heat stimuli was conducted. Since offset analgesia is measured by examining behavioral responses following the temperature offset from T2 to T1 in the OS
3
which occurs at ∼20 seconds after the start of the OS, an EOI of 20–40 seconds was chosen. Using this temperature-derived EOI, activation maps were calculated and shown in Figure 3. During the Con stimulus (Figure 3(a)), channels overlying bilateral somatosensory (SS) and medial prefrontal cortex (mPFC) show robust activation compared to a baseline rest period prior to the stimulus. Although activations are apparent during the OS in this 20–40 second EOI, they are less robust and widespread than during the Con. Results from an [OS–Con] contrast plotted in Figure 3(c) confirm that most activations during the OS are decreased compared with Con. OS-associated activations are less in the bilateral SSC and bilateral mPFC. Interestingly, right dorsolateral prefrontal cortex (dlPFC) shows greater activation during the OS than Con (Figure 3(c)). Examination of EOI-baseline contrasts in Figures 3(a) and (b) shows that R dlPFC activation appears only to occur during OS. Temperature offset is associated with divergent patterns of cortical activation. Whole-brain T-score heatmaps reflecting constant control (Con)–baseline (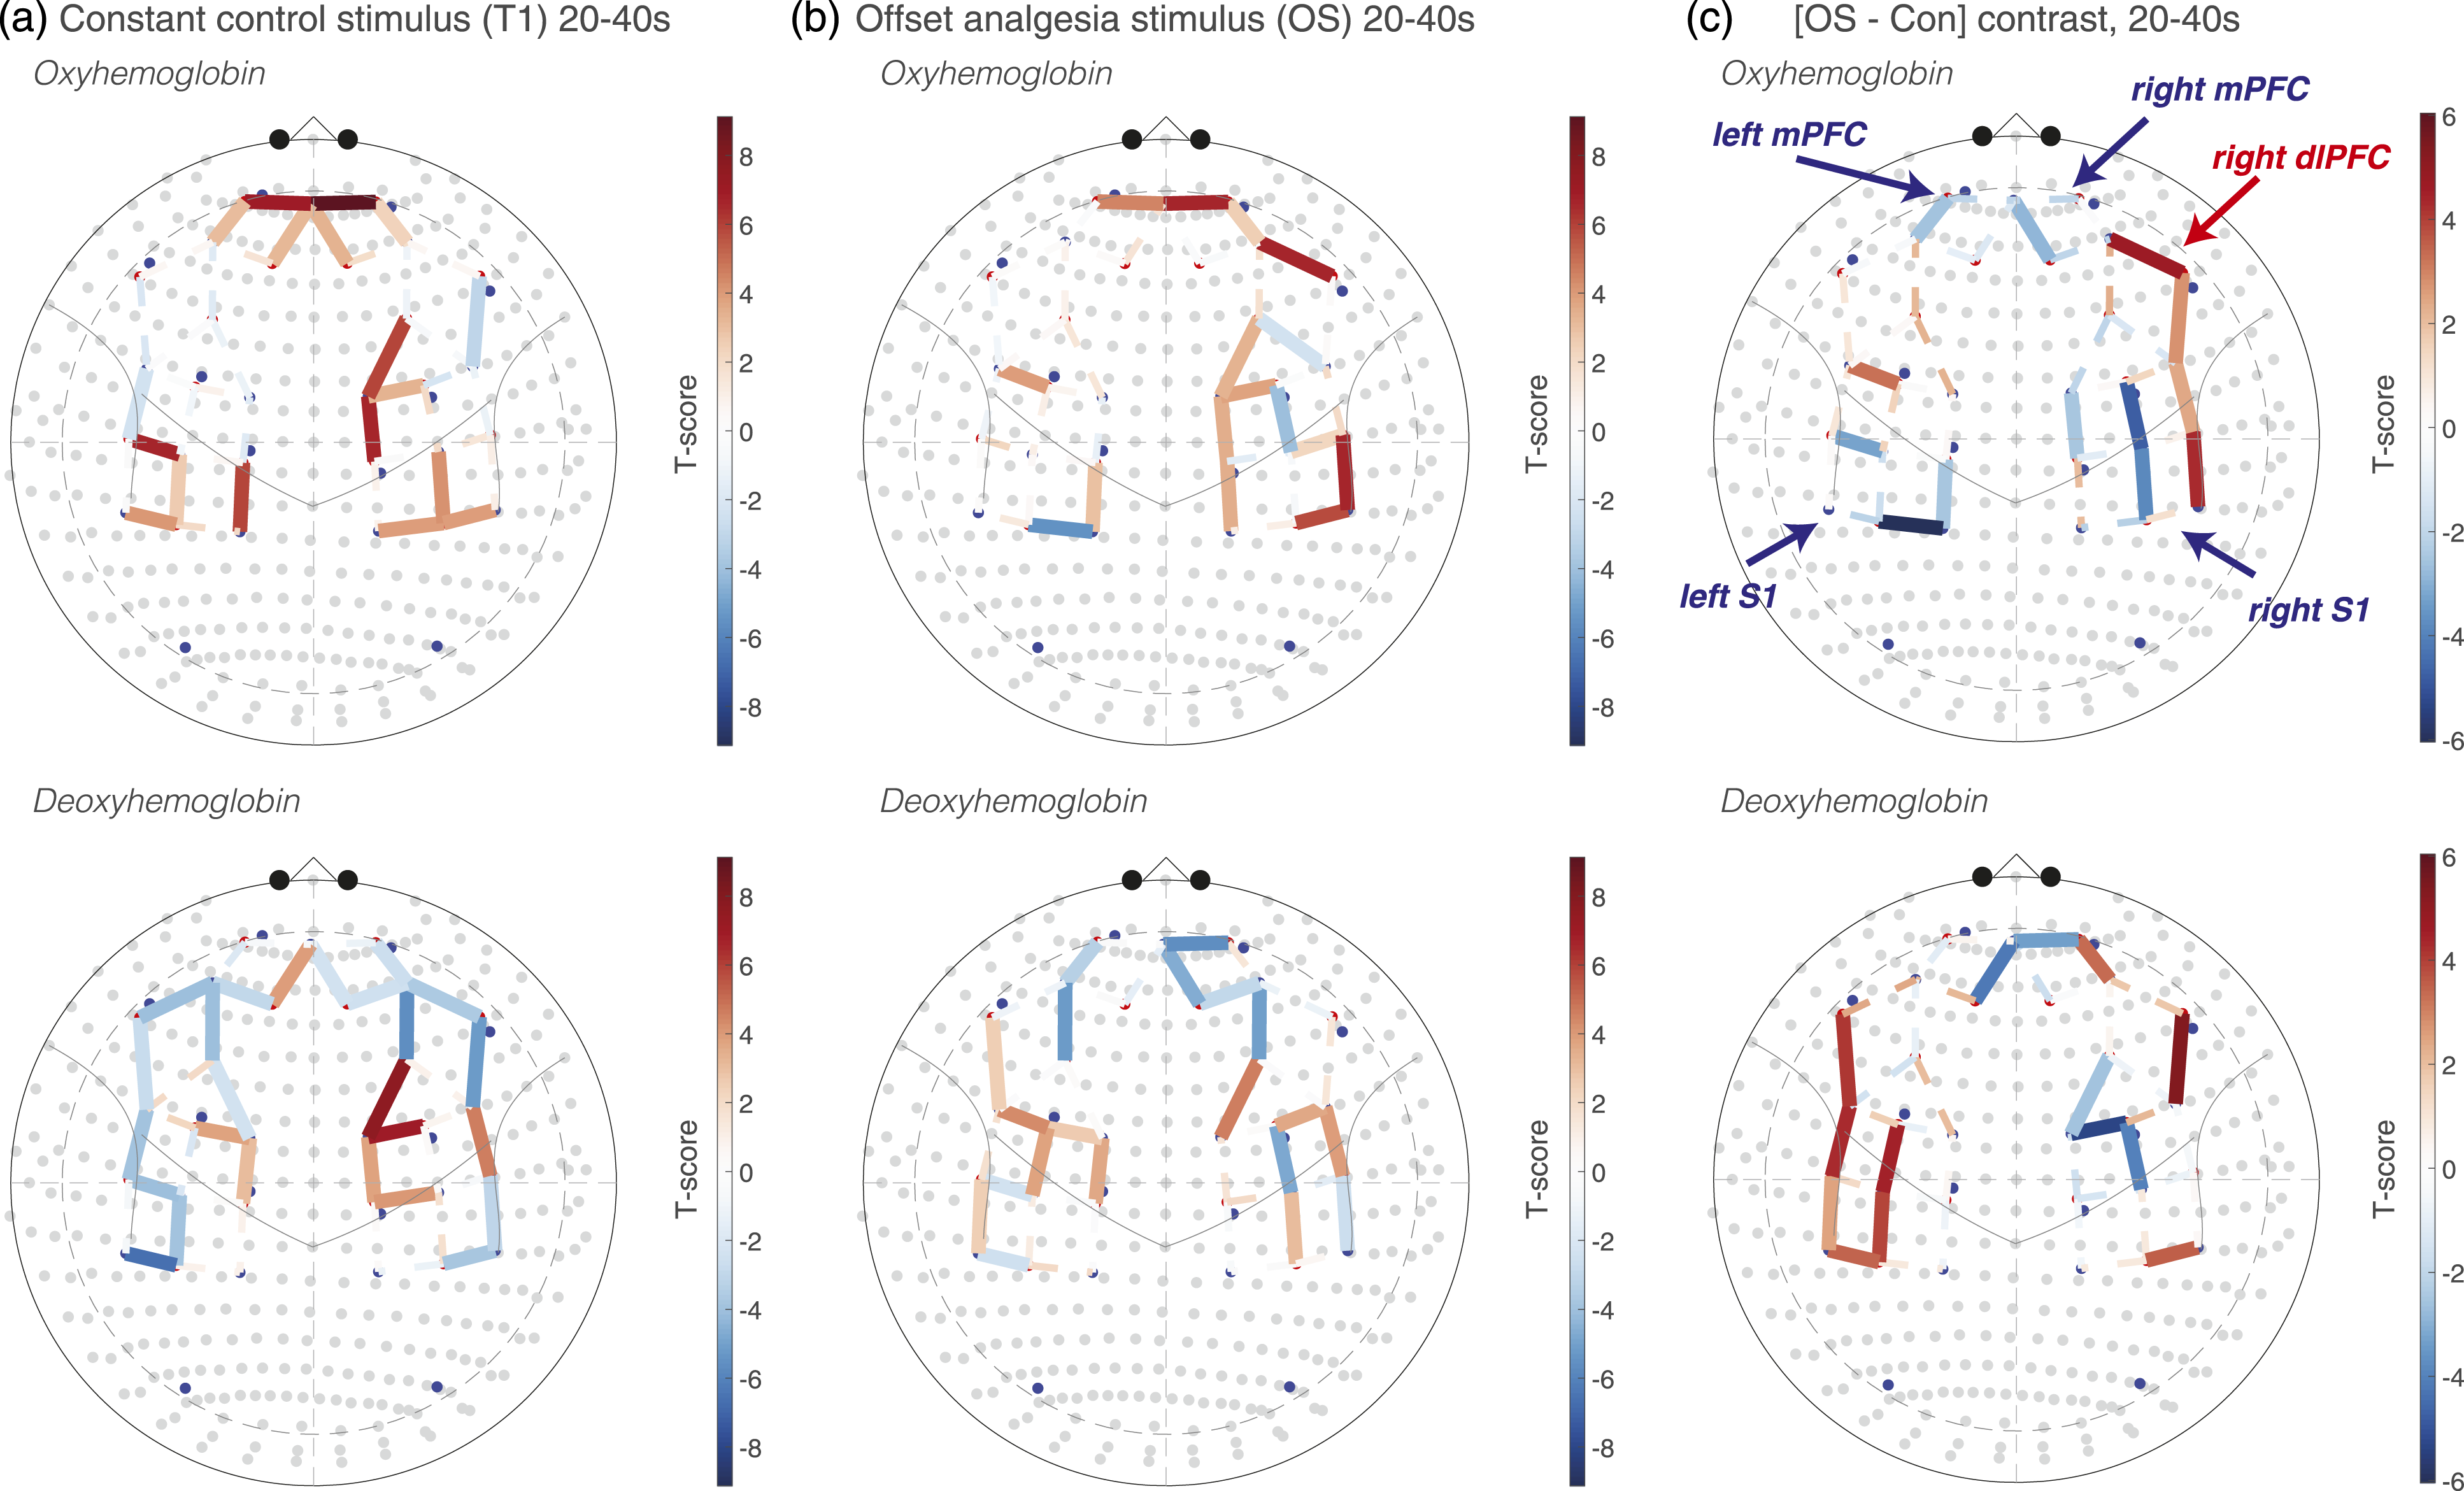
To guide further NIRS analysis, behavioral data were examined. In the current sample, offset analgesia was detected on the group level. Figure 4(a) shows an example of one participant’s real-time pain intensity rating, with a pronounced separation between OS and Con pain intensity curves following temperature offset at 20 seconds, a graphical representation of offset analgesia. Using a standard method to quantify offset analgesia,3,19 the minimum of the OS pain intensity curve following temperature offset was compared with the pain intensity at a corresponding time point during the Con pain intensity curve (black arrow, Figure 4(a)). On the group level, the pain intensity during the OS is significantly less than during the Con stimulus (Figure 4(b)). The pain difference (OS pain intensity–Con pain intensity) for the same participant in Figure 4(a) is plotted in Figure 4(c), highlighting a robust offset analgesia response in this participant. The magnitude of the OS-Con pain intensity difference calculated at the OS minimum (black arrow in Figure 4(a)) is variable across participants, depicted graphically with the scatter plot in Figure 4(d). Interestingly, in this sample, this distribution appeared biphasic with separation along the group median. To determine a behaviorally defined epoch-of-interest with maximal offset analgesia, individual pain difference curves from all participants were plotted starting at temperature offset (20 sec; Figure 4(e)). In participants with robust offset analgesia (greater than the median value), the OS-Con pain intensity difference decreased below 0, reflecting offset analgesia, at 26 seconds and returned to zero at approximately 36 seconds (dotted vertical lines in Figure 4(e)). Overall, this behavioral analysis confirmed the presence of offset analgesia in this sample and guided the definition of a behaviorally relevant EOI. Behavioral measures of offset analgesia. A. An example of pain intensity continuously rated over time during offset (OS) and constant control stimuli (Con) from a single subject. Cutaneous thermode temperatures for different time periods are noted above the graph. In this participant, T1 = 47°C and T2 = 48°C. The black arrow represents a standard measure of offset analgesia, derived by subtracting the minimum pain intensity in that time period during the OS with Con pain intensity at the same time point. B. Group-level data demonstrate offset analgesia, as measured by comparing pain intensity at the time point of the minima following OS temperature offset during both OS and Con stimuli. Group mean values are plotted with error bars representing 95% CI, ** paired t-test, p < .01. Pain intensity difference (OS–Con) at each time point for a single participant (
Using the behavior-defined EOI, similar activation patterns emerged as the temperature-defined EOI. During the 26–36 EOI, Con–baseline and OS–baseline contrasts showed activations in bilateral SSC and mPFC (data not shown). The OS–baseline contrast showed a significant activation in R dlPFC, without significant activation in that region in the Con-baseline contrast. Similar to the temperature-defined EOI, the OS-Con contrast during the 26–36 EOI showed a deactivation of the bilateral SSC (Figure 5). In the 26–36 EOI, the right mPFC was significantly deactivated during OS, but the left mPFC did not achieve significance. Right dlPFC showed significantly greater activation during OS. Taken together, both temperature-defined and behavior-defined EOI strategies demonstrate activations in SSC and mPFC that are significantly reduced during the OS compared with Con and an OS-specific activation in the right dlPFC. Offset analgesia is associated with decreases in mPFC and SSC activation and increases dlPFC activation. Whole-brain T-score heatmaps reflecting [OS-Con] contrasts during maximal offset analgesia, 26–36 seconds after the start of the OS. Solid lines reflect statistically significant contrasts surviving correction for multiple comparisons (q < 0.05). Dashed lines are not statistically significant. For the oxyhemoglobin montage, regional activations and deactivations are labeled in red and blue, respectively.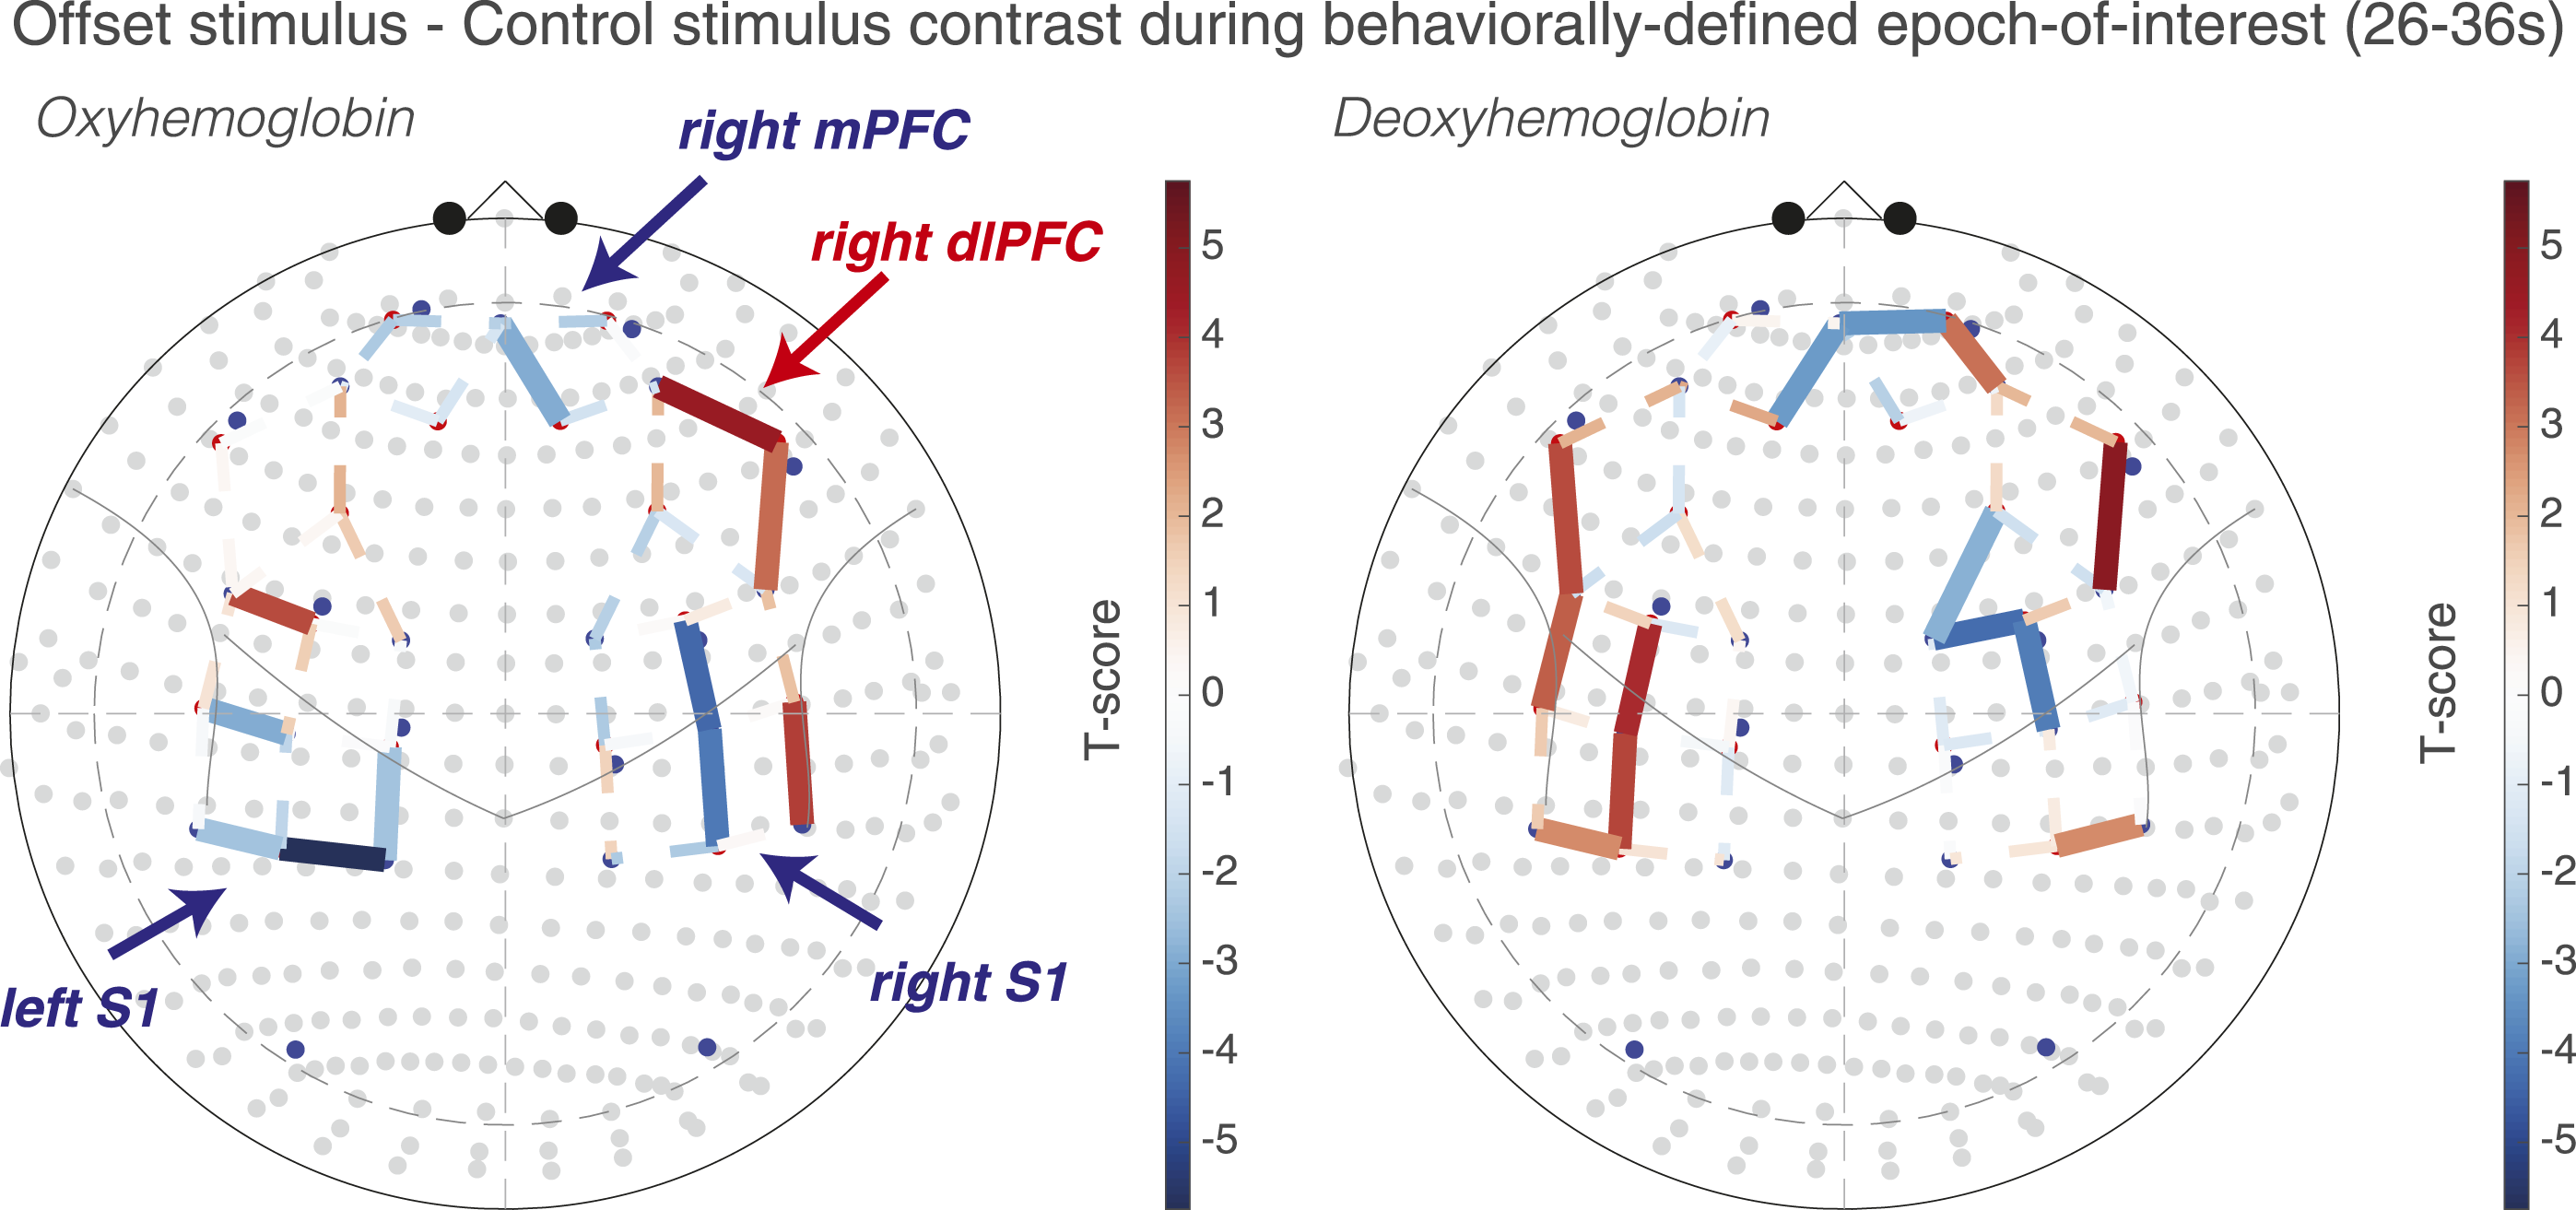
iii. Timeseries analysis reveals dynamic cortical activity changes during offset and control stimuli
A timeseries analysis was performed to visualize dynamically changing HbO and HbR values, given the dynamic changes in pain intensity during the OS and Con. Since whole-brain contrasts implicated SSC, mPFC, and dlPFC, Brodmann areas within these regions were selected using an ROI approach. In Figure 6, HbO increases and accompanying HbR decreases reflect cortical activation and are observed in multiple ROIs. Consistent with the whole-brain analysis, significant differences between OS and Con were observed. Relative SSC (BA-40) deactivation during OS was observed bilaterally, while right dlPFC (BA-46) showed activation. In the left BA-10 ROI although median values of the curves do not appear dramatically different, there is a significant group level difference (HbO: T = −2.95, q = 0.01) consistent with a decreased left BA-10 activation during OS compared to Con. The only difference with the whole-brain analysis was in the right BA-10 ROI, which showed a relative activation during OS with borderline statistical significance (HbO: T = 2.22, q = 0.04), whereas in the whole montage analysis there appeared to be a relative deactivation. Dynamic changes in oxygenated and deoxygenated hemoglobin during offset and control stimuli. Group median HbO (red) and HbR (blue) from right and left medial prefrontal cortex (BA-10), dorsolateral prefrontal cortex (BA-45), and somatosensory cortex (BA-40) are plotted at a sampling rate of 1 Hz during both offset stimuli (OS) and constant control stimuli (Con). Stars indicate significant differences (q < 0.05) from the ROI analysis between OS and Con during the 20–40 second interval examined for offset analgesia. Red stars represent oxyhemoglobin OS-Con, and blue stars represent deoxyhemoglobin OS-Con. Borderline significance is noted with the q-value.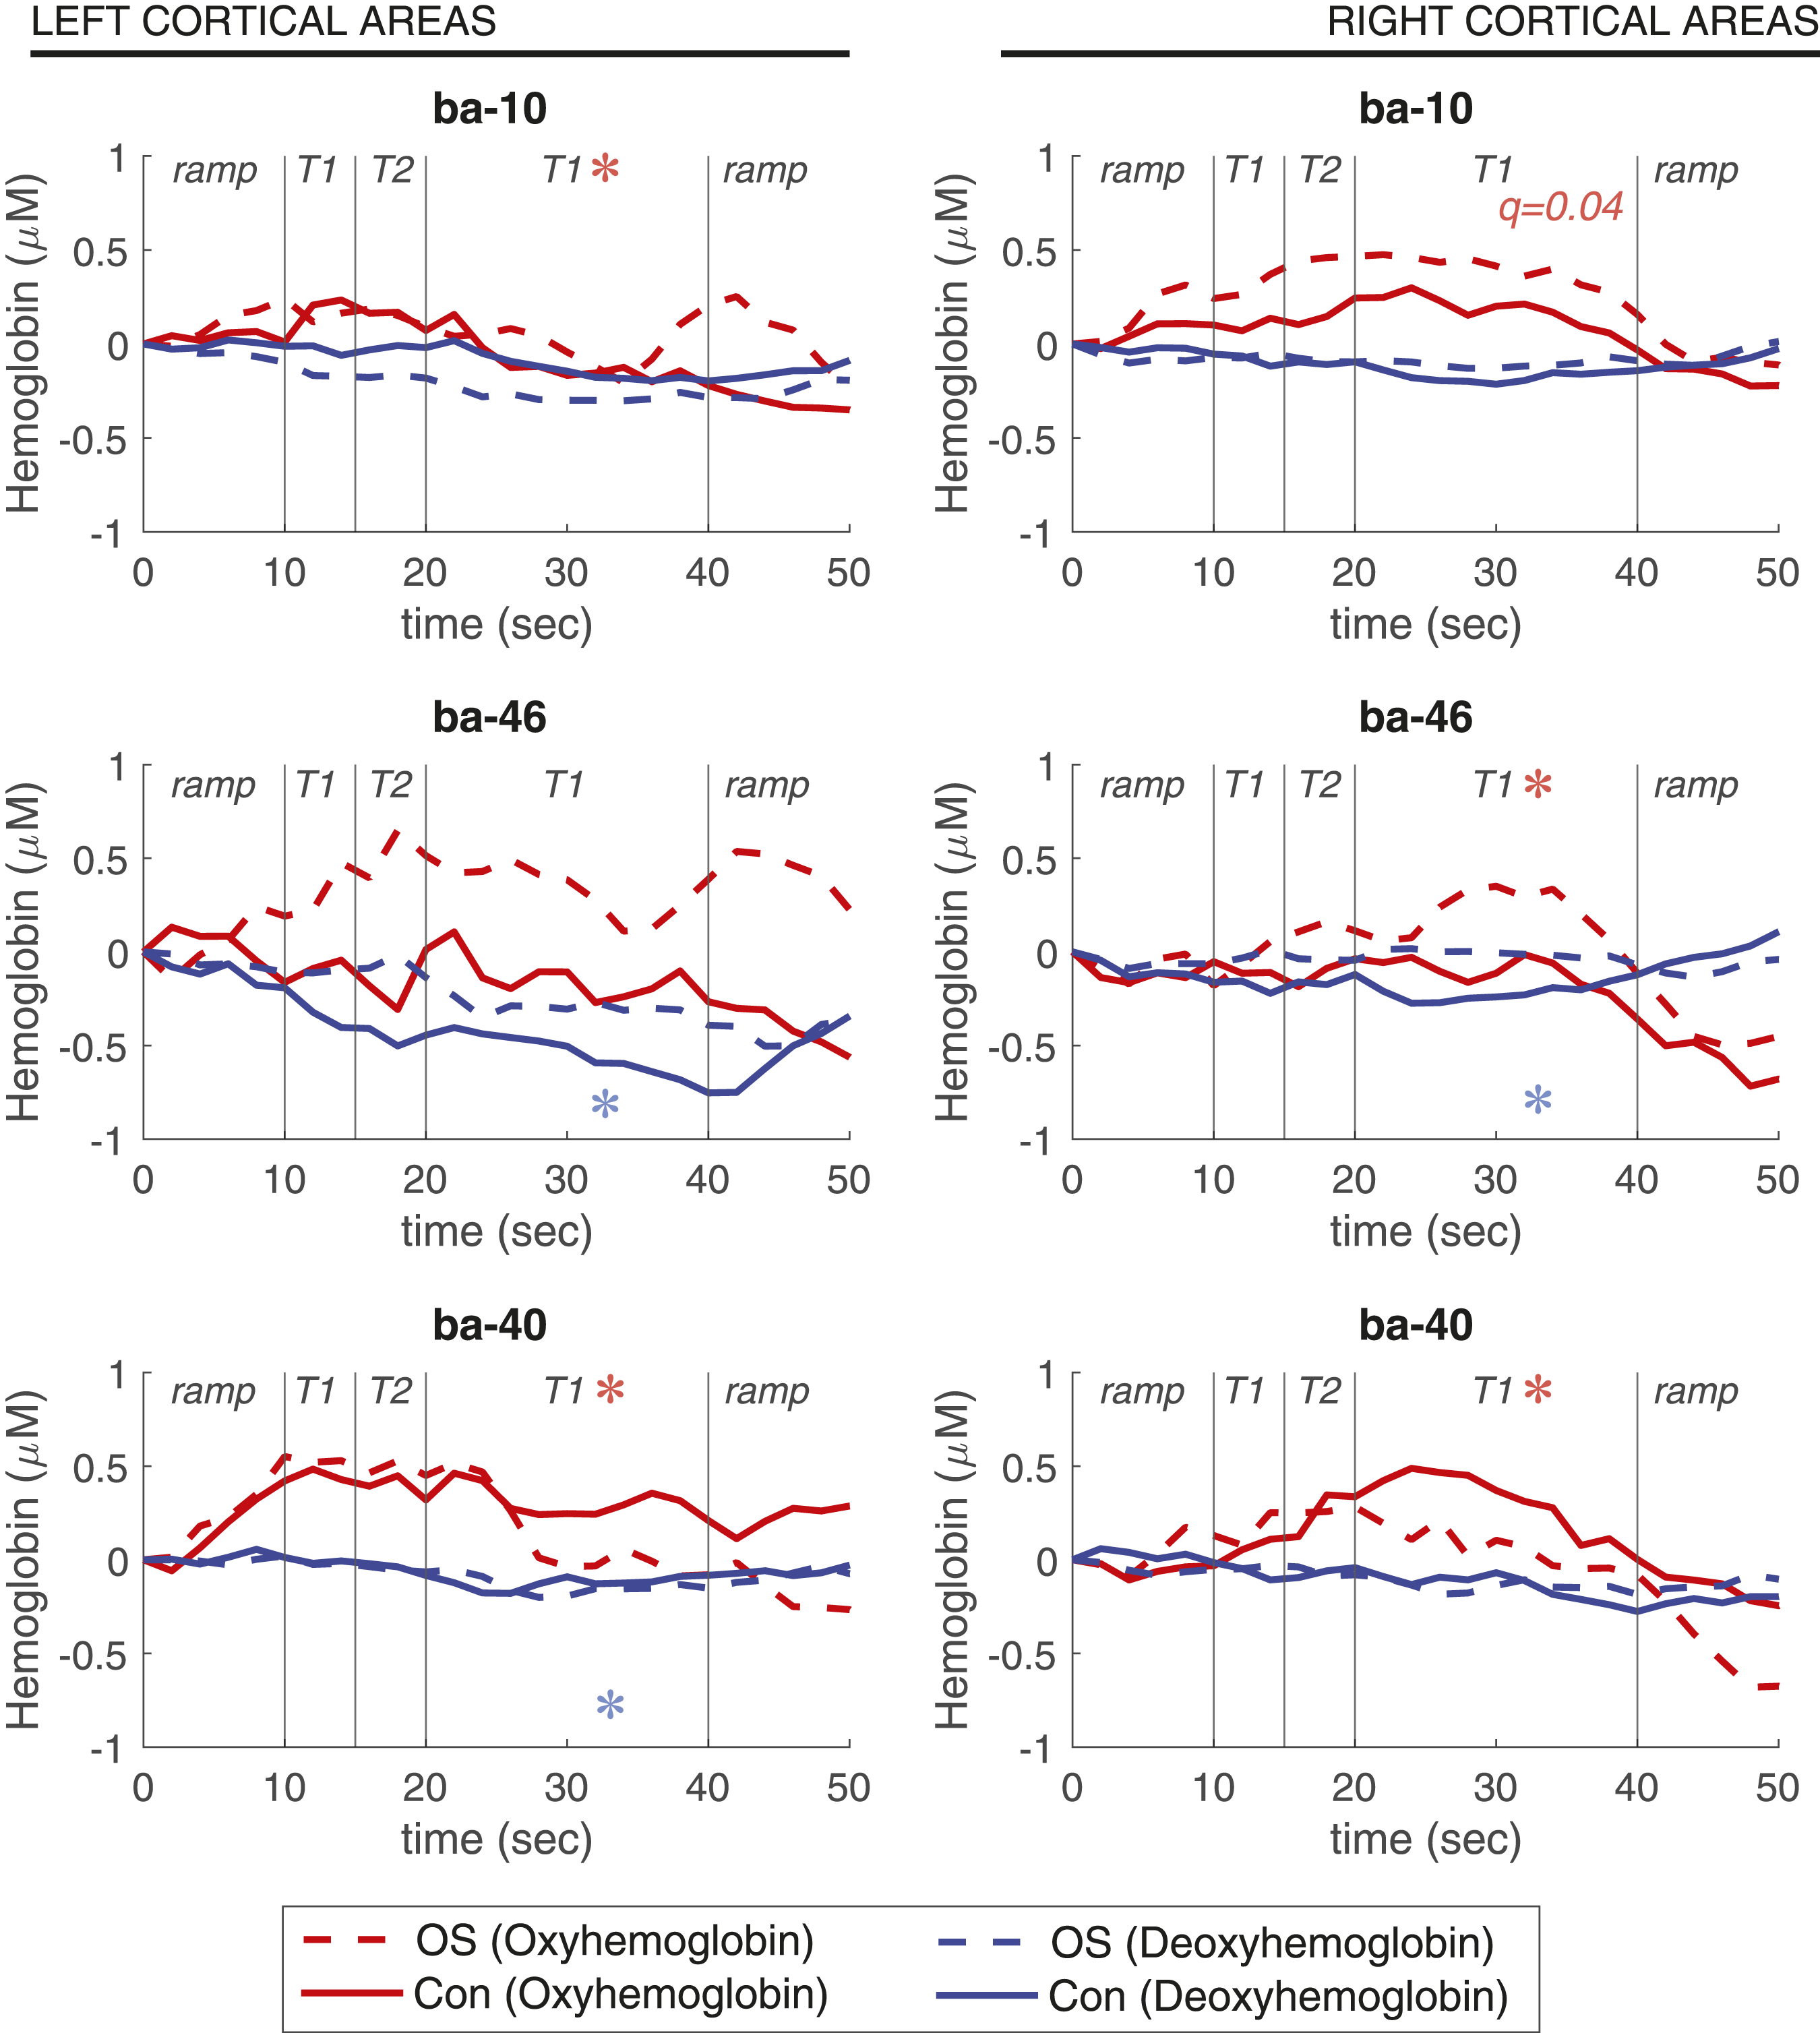
iv. Subgroup sensitivity analysis is consistent with whole-group analysis, implicating mPFC, SSC, and right dlPFC.
Using the behavior-defined subgroup analysis outlined above, in which participants were divided by the whole-group median magnitude of offset analgesia, participants with robust offset analgesia showed significant differences between OS and Con (Figure 7), with similar regional patterns outlined above. Although differences appeared to be less robust in participants without offset analgesia, there remained several statistically significant differences. Subgroup sensitivity analysis. HbO and HbR activation maps reflecting OS-Con contrast T-scores in participants with robust offset analgesia (
Characteristics of participants with and without robust offset analgesia.

aFor continuous variables, mean and standard deviations are presented with p-values from t-tests. For categorical variables, row counts over column counts with percentages in parenthesis are listed. p-values are from Chi-square tests. p-values ≦ .05 are italicized and bolded.
Discussion
Although subcortical descending modulatory pathways are activated during offset analgesia, the role of the cerebral cortex remains unclear. The goal of this study was to elucidate the cortical correlates of offset analgesia. Using fNIRS and regression models that accounted for non-neural hemodynamic responses to pain, we found that offset analgesia is associated with relative deactivation of bilateral somatosensory cortex (SSC), deactivation of bilateral medial prefrontal cortex (mPFC), and activation of right dorsolateral prefrontal cortex (dlPFC). This pattern of cortical activation was observed both in temperature- and behavior-defined epochs-of-interest and confirmed with region-of-interest analysis. Taken together, these observations imply opposing modulation of cortical activation during offset analgesia. This study adds to the mechanistic understanding of offset analgesia and, with the use of fNIRS, provides proof-of-concept for clinic-based assessment of brain activity during pain modulation.
i. Neural correlates of offset analgesia
Clarifying the underlying mechanisms of offset analgesia would provide insight into acute pain inhibitory processes that are altered in and likely contributing to chronic pain. As such, several studies have examined central nervous system activity during offset analgesia using fMRI BOLD. Subcortical circuits implicated in other examples of endogenous pain inhibition, such as placebo analgesia, 53 appear to be activated during offset analgesia. This includes the PAG and RVM12,13 and is accompanied by relative deactivation in spinal cord dorsal horn (SCDH), 15 suggesting that offset analgesia engages a top-down inhibitory PAG-RVM-SCDH pathway to inhibit ascending nociceptive input. 18
Cortical modulation has been implicated in other endogenous pain inhibition paradigms, 54 but details remain unclear in offset analgesia due to conflicting results from fMRI BOLD studies.2,12 Yelle and colleagues reported decreased contralateral S1 activation during offset analgesia. Compared to baseline, mPFC was inhibited during the control stimulus with a larger inhibition during offset analgesia. Right dlPFC showed greater activation during offset analgesia than the control stimulus. On the other hand when contrasting the offset and control stimuli, Derbyshire and colleagues reported a relatively decreased BOLD signal in multiple areas of the cerebral cortex, including bilateral S1, S2, and right dlPFC (BA-46). The reason for disparate results between these two studies could be stimulus related—Yelle and colleagues included a longer duration heat stimulus than Derbyshire and colleagues—or related to differences in analytic approach—Derbyshire and colleagues contrasted activity during the EOI following temperature offset with the initial period of the OS at T1 during painful stimulation, while Yelle and colleagues contrasted the offset EOI with a baseline period at rest. Neither study corrected for autonomic responses to acute pain, which could confound fMRI BOLD analysis. 55
With fNIRS, we find widespread activations during both the control (Con) and offset stimuli (OS) and, when contrasting the two stimuli to examine offset analgesia, we find relative deactivation of bilateral SSC, bilateral mPFC deactivation, and right dlPFC activation. The general pattern of cortical activation we observed is more consistent with Yelle and colleagues, although there are some differences. In the present study, bilateral, rather than unilateral, SSC activations are noted during both OS and Con. All three studies find mPFC deactivation during offset analgesia. Although this study and Yelle find dlPFC activation with offset analgesia, Derbyshire and colleagues reported relative deactivation. We speculate that a lack of control for non-neural autonomic changes underlies differences with prior fMRI studies and the current study. By controlling for hemodynamic change in the scalp with short-separation channel data integrated into first-level regression modeling, the current technique controls for autonomic responses to acute pain, adding confidence to our findings.
ii. fNIRS-measures of pain and analgesia
The results from the current study confirm prior work that painful stimulation causes measurable changes in cortical hemodynamics, summarized in the Introduction and reviewed recently by Karunakaran and colleagues. 56 To our knowledge, the current study is the first to utilize prolonged heat stimulation (45 sec), with most prior work examining shorter noxious stimuli. One study reported increases in HbO reflecting prefrontal activation in response to the minutes-long cold pressor test. 31 While this study only used four channels over bilateral PFC and did not measure somatomotor cortex, the reported results are consistent with our findings of bilateral PFC activation during the entire noxious heat stimulus.
The direction and timing of HbO change appears to be different during shorter noxious stimuli than those used in the current study. For example, a 5-second noxious heat stimulus was associated with a biphasic decrease, increase, and a more prolonged decrease in mPFC HbO. 34 This response started about 4 seconds after initiation of the 5-second stimulus and lasted for at least 20 seconds. Similar decreases in mPFC HbO were reported with transient noxious stimuli29,30 with the largest changes in signal occurring after the stimulus end. On the other hand, increases in SSC HbO with noxious stimuli, similar to those observed in the current study, have also been reported,30,33,34 and these monophasic increases in HbO are typically present during innocuous stimulation but at a lower magnitude. Although SSC HbO increases observed presently are consistent with these prior studies, the mPFC responses show an increase in HbO (activation) with prolonged heat pain rather than a decrease. We speculate that this difference in mPFC HbO response may be due to a composite hemodynamic response during short duration noxious stimulation, reflecting both the onset and offset of pain. Specifically, with pain onset mPFC activates, but then deactivates with decreased pain intensity. During longer noxious stimulation, with either prolonged heat in the present study or cold pain, 31 mPFC activation becomes more apparent since responses are not superimposed in time. Future work will be required to clarify the waveform of mPFC response to different durations of noxious stimulation.
There is less work examining the neural correlates of pain relief using fNIRS. One small volunteer study (n = 11) found that morphine attenuated mPFC (BA-10) responses to short noxious stimuli with a decrease in contralateral SSC activation detected by subgroup analysis. 38 FNIRS scanning during an expectancy conditioning paradigm, often used in the study of placebo analgesia, revealed an association between placebo analgesia and right dlPFC activation which was diminished in patients with chronic neuropathic pain. 57 This is consistent with our observation of right dlPFC activation during offset analgesia and other studies of placebo analgesia using fMRI, PET, and transcranial magnetic stimulation. 53 The current study provides additional evidence in characterizing the cortical responses during endogenous pain inhibition, specifically examining offset analgesia.
iii. Clinical implications
In chronic pain, offset analgesia is attenuated, 3 suggesting alterations in pain modulation which may contribute to the pathophysiology of different chronic pain conditions. The current study identified cortical patterns of activation during offset analgesia using fNIRS which is portable, scalable, and clinic-based. These data raise the possibility that pain modulatory circuits could be examined in patients in an outpatient clinical environment. Serial imaging in the setting of prospective clinical studies may be more feasible with fNIRS and could potentially be integrated into the development of biosignatures of pain. 58
iv. Model for offset analgesia
Based on the current fNIRS study we posit a model of cortical pain modulation during offset analgesia. A small decrease in noxious input results in predictions of further decreases in pain intensity. 18 We propose that R dlPFC activation underlies this cognitive-evaluative process involved in pain prediction. R dlPFC output to PAG engages a descending inhibitory circuit which decreases ascending noxious input. This decreased noxious input results in decreased SSC and mPFC activation, areas which have previously been related to sensory-discriminative and emotional-motivational aspects of pain. In support of this model, recent anatomic and functional studies in rodents have identified descending inhibitory pathways from PFC that engage the PAG directly or more indirectly via the nucleus accumbens and amygdala to decrease pain-like behaviors.59–68 In monkey, there are robust projections from PFC to PAG. 69 Although direct translation across species is difficult 70 , these findings combined with results from the present study suggest that R dlPFC to PAG pathways contribute to offset analgesia, likely as part of a larger, pain-modulatory network. 23
The current study is limited by a focus only on offset analgesia and not on pain facilitatory paradigms. Based on our model, one would hypothesize that during predictions of increased pain intensity or “onset hyperalgesia,” 19 R dlPFC would still show activation, reflecting the same cognitive-evaluative process, but that pain intensity and negative valence would be high, resulting in SSC and mPFC activation. Future studies examining the bidirectional effects of expectancy using brain imaging will be important in testing this hypothesis. Another study limitation is that fNIRS cannot image deeper cortical structures known to contribute to pain modulation, including insula and anterior cingulate cortex, or subcortical regions, such as the PAG. Future work combining fNIRS and fMRI may address this limitation.
Conclusions
Using fNIRS, we find widespread activation in frontal and somatosensory cortices during pain. During offset analgesia, divergent patterns of cortical activation emerge, with relative deactivation in bilateral SSC, deactivation in bilateral mPFC, and activation of R dlPFC. These findings are consistent with a model in which updated pain predictions during a noxious stimulus offset robustly inhibit pain through activation of R dlPFC and deactivation of both SSC and mPFC. Future work will examine the role of stimulus increases and the clinical relevance of offset analgesia.
Footnotes
Author contributions
B.J.A. developed the concept of the study. B.J.A., A.D.W., and T.J.H. designed the study. B.J.A., H.S., and Q.H.N. acquired the data. B.J.A., H.S., and T.J.H. analyzed the data. B.J.A., H.S., A.D.W., and T.J.H. interpreted the data. B.J.A. prepared the first draft of the manuscript. All authors revised the manuscript critically and approved the published version.
Declaration of conflicting interests
The author(s) declared no potential conflicts of interest with respect to the research, authorship, and/or publication of this article.
Funding
The author(s) disclosed receipt of the following financial support for the research, authorship, and/or publication of this article: This work was supported by the National Institutes of Health (NIH) National Institute of General Medical Sciences in the form of a grant supporting B.J.A. [T32GM075770], the NIH National Institute of Biomedical Imaging and Bioengineering in the form of a grant supporting T.J.H. [R01EB028248-01], the Virginia Kaufman Endowment Fund in the form of a Pain Research Challenge grant, a program of the Clinical and Translational Science Institute at the University of Pittsburgh, awarded to B.J.A., H.S., A.D.W., and T.J.H., and the International Anesthesia Research Society in the form of the Mentored Research Award, awarded to B.J.A. Finally, recruitment of participants was supported by the University of Pittsburgh Clinical and Translational Science Institute (CTSI), funded by the National Center for Advancing Translational Sciences Grant Number UL1TR001857.