
Abstract
Background
Prior studies identified iron deposition in deep brain nuclei and the periaqueductal gray matter region in chronic migraine, and less is known about the cerebral iron deposition over the whole cerebral gray matter in CM. The aim of this case–control study is to investigate the cerebral iron deposition of gray matter in CM using an advanced quantitative susceptibility mapping.
Methods
A multi-echo gradient echo MR sequence was used to obtain raw quantitative susceptibility mapping data from 12 CM patients and 18 normal controls and the quantitative susceptibility mapping were reconstructed. Three dimensional T1 images were segmented and the gray matter mask was generated to extract the susceptibility value of gray matter over the whole brain. The independent t test and receiver operating characteristic curve Receiver operating characteristics was used to investigate the iron deposition changes in CM patients.
Results
CM presented a higher susceptibility value (1.44 × 10⁻³ ppm) compared with NC group (0.47 × 10⁻³ ppm) (p < 0.0001) over the whole cerebral gray matter. There was no correlation between susceptibility value and the clinical variables including disease duration, Visual Analog Scale (VAS), Migraine Disability Assessment Scale (MIDAS), Hamilton Anxiety Scale (HAMA), Hamilton Depression Scale (HAMD), and Montreal Cognitive Assessment (MoCA) scores (p > 0.05). ROC analysis demonstrated the susceptibility had a high diagnostic efficacy (AUC 0.949, sensitivity 77.78% and specificity 100%) in distinguishing CM from NC.
Conclusion
CM patients had increased iron deposition in total cerebral gray matter which could be considered as a potential diagnostic and evaluated imaging biomarker in CM.
Keywords
Introduction
Migraine is a common disabling primary headache disorder worldwide.1–3 Chronic migraine (CM) has been defined as headache occurring at least 15 days per month for a period of more than 3 months, and at least 8 days per month with features of migraine according to International Classification of Headache Disorders, 3rd edition (ICHD-III). 4 Approximately 1–2% of population suffered from CM globally, 5 which imposes a significant burden on families and society for migraineurs. Despite the prevalence of this disabling condition, the physiopathological mechanism is still unclear and early diagnosis is difficult. Chronicity of migraine accounts for approximately 2.5% of episodic migraines annually, and its neuromechanism remains unknown. 6
Cerebral gray matter plays an important role in the pathophysiology of CM, 7 and the previous study demonstrated that gray matter was associated with pain sensitivity, 8 which was common in chronic pain. Advanced functional imaging studies have shown that functional connectivity changed in cortex9,10 and deep nuclei9–14 was altered in both the interictal and ictal phases of migraine, and further structural imaging studies also indicated significantly abnormal gray matter volumes in migraine.15–19 Recently, some studies have shown that CM patients had greater iron accumulation in deep nuclei20,21 and periaqueductal gray matter (PAG), 22 suggesting that accurate assessment of cerebral iron deposition may be considered another important research topic for understanding the pathophysiological mechanism of chronic migraine.
Previous studies have assessed iron deposition in deep brain nuclei20,23,24 and PAG 23 using T2, T2* (semi-quantitative assessment), and SWI sequences (visual assessment) in CM patients. However, quantitative analysis of iron deposition was not performed in CM patients. Quantitative susceptibility mapping (QSM) 25 is an advanced MRI technique that quantitatively analyzes the magnetic susceptibility of magnetically sensitive materials, which could be used to quantitatively assess cerebral iron deposition in multiple sclerosis, 26 Parkinson’s disease, 27 amyotrophic lateral sclerosis,28,29 and cerebral bleeds.30,31 In previous studies, an analysis of the region of interest (ROI) was used to assess cerebral iron deposition, which could not truly reflect cerebral iron deposition at the whole brain level. Therefore, in the current study, a susceptibility analysis of the whole brain gray matter was performed, which would provide more valuable information for understanding the neuromechanism of CM.
The aim of this study is to quantitatively assess iron deposition in whole brain gray matter, compare differences between CM patients and healthy controls, and further investigate the possible role of iron accumulation in chronicity mechanisms.
Materials and methods
Design
Exploratory observational analytic study with case-control design.
Subjects
Twelve CM patients (9 females and 3 males, mean age 40.17 ± 8.47 years) and 18 normal controls (NC, 12 females and 6 males, mean age 40.11 ± 10.98 years) were enrolled from the Neurologic Clinic of Chinese PLA General Hospital. The written informed consents were obtained from all subjects according to the approval of the ethics committee of the local institutional review board.
The included criteria should meet the ICHD-III criteria of chronic migraine without aura, 4 which was listed as follows: (1) CM diagnosis refers to 1.3CM in ICHD-III and without aura; (2) without preventive medication history for migraine in the past 3 months; (3) absence of other subtypes of headache, chronic pain other than headache, severe anxiety or depression, and psychiatric diseases; and (4) absence of alcohol, nicotine, or other substance abuse. The exclusion criteria should meet the following: cranium trauma, the cerebrovascular disease, long-standing hypertension, diabetes mellitus, tumor history, brain surgery, and other disorders resulting in cerebral increased iron deposition (Supplementary table 1).
NCs were recruited from the society, and should never have any primary headache disorders or other types of headaches. Two groups had the same exclusion criteria.
All the patients were performed with the Visual Analog Scale (VAS), Migraine Disability Assessment Scale (MIDAS), Hamilton Anxiety Scale (HAMA), Hamilton Depression Scale (HAMD), and Montreal Cognitive Assessment (MoCA) evaluation. NCs were performed with HAMA, HAMD, and MoCA evaluation.
MRI acquisition
MR images were obtained by using a conventional eight channel phased-array head coil on a GE 3.0 T MR scanner (DISCOVERY MR750, GE Healthcare, Milwaukee, WI, USA). QSM raw data was acquired by a multi-echo gradient echo T2 weighted sequence with the following parameters: first echo time (TE) = 4.72 ms, the last TE = 22.96 ms, deltaTE = 3.648 ms, repetition time (TR) = 26.7 ms, flip angle (FA) = 15°, field of view (FOV) = 22×22 cm and matrix = 416 × 320, slice thickness = 1.2 mm, slice gap = −0.6 mm, number of averages = 1. Three dimensional T1 gradient echo sequence was performed with the following parameters: TE = 3.0 ms, TR = 7.0 ms, inversion time = 400 ms, FA = 12°, FOV = 25.6 × 25.6 cm and matrix = 256 × 256, slice thickness = 1.0 mm, slice gap = −0.6 mm, number of averages = 1. All MR imaging protocols were performed by the same operator.
Imaging processing
The QSM images were reconstructed by STI Suite (V3.0) software (
The image processing steps included as follows: (1) The magnitude images and phase images were imported into the STI software and then automatically generated magnetic susceptibility images (Figure 1(a)); (2) 3D T1 images were coregistered with the magnitude images (TE = 4.72 ms), and then generated the warped T1 images; (3) The individual warped T1 images were normalized with the T1 template (provided by the SPM software), and then The warped T1 images generated the normalized parameters; (4) The normalized parameters were applied with the quantitative susceptibility images, and then generated the normalized susceptibility images (Figure 1(b)); (5) The warped T1 images of CM and NCs were segmented to gray matter and white matter probability maps, and the all the gray matter probability maps were used to make average gray matter probability and the generated gray matter mask (Figure 1(c)); and (6) The susceptibility value was extracted from the normalized QSM maps based on the gray matter mask (Figure 1(d)) by REST software [V1.8, Forum of resting-state fMRI (restfmri.net)]. The quantitative susceptibility mapping (QSM) value of gray matter over the whole brain was extracted according to the above flowchart. (A), raw QSM image; (B), normalized QSM; (C), Gray matter mask; (D), the gray matter mask and normalized QSM.
The regions of interest (ROI) method based on automated anatomical labeling (AAL) template
32
(Figure 2) was used to extract the magnetic susceptibility value of the regional brain regions and the subcortical gray nuclei using REST software (V1.8). The extraction of the susceptibility value of the cerebral regions labeled by the automated anatomical labeling (AAL) template (No.1–90).
Statistical analysis
The data with normal distribution (Kolmogorov–Smirnov test) was described as mean ± standard deviation. The Hamilton Anxiety Scale (HAMA), Hamilton Depression Scale (HAMD), Montreal Cognitive Assessment (MoCA) score, and susceptibility value were performed with independent sample t test (2 tails, age as covariable). Correlation analysis was applied between susceptibility value and the clinical variables in CM patients. Significant level was set as p value of <0.05. Receiver operating characteristics (ROC) curve was applied to evaluate the diagnostic efficacy of the susceptibility value, and area under the curve (AUC) was recognized reasonable diagnostic valuable with AUC >0.7.
Results
The clinical variables between chronic migraine (CM) and normal controls (NC).

aχ2 value. NA, not available; DD, disease duration; HDPM, headache days per month; VAS, Visual Analog Scale; HAMA, Hamilton Anxiety Scale; HAMD, Hamilton Depression Scale; MoCA, Montreal Cognitive Assessment; MIDAS, Migraine Disability Assessment Scale.
Comparison of susceptibility value between CM and NC
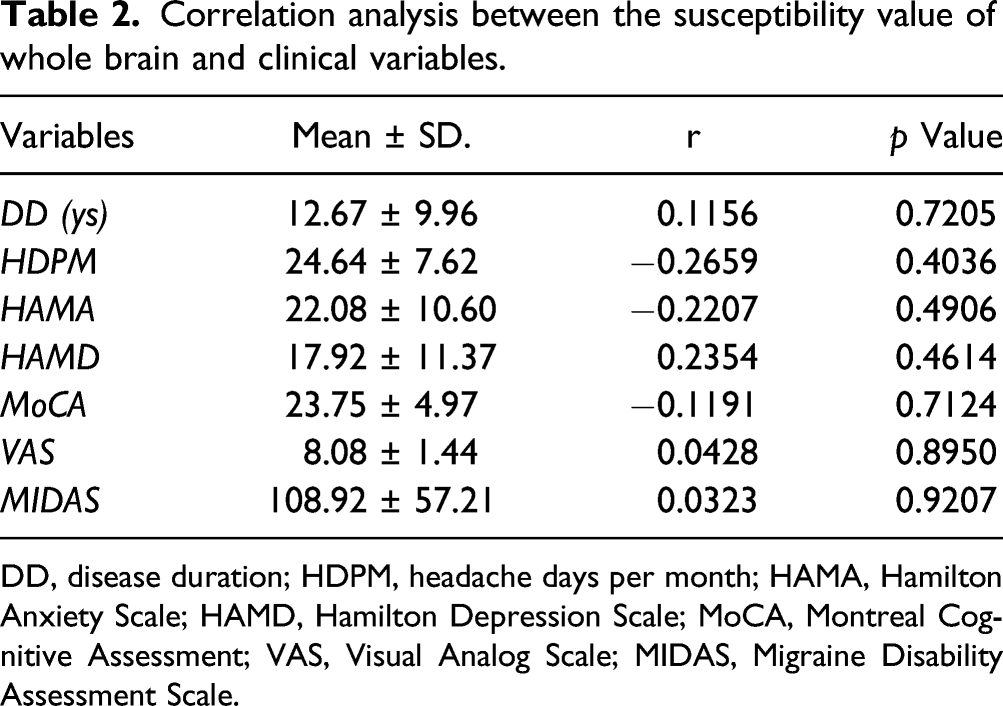
CM presented a higher susceptibility value (1.44×10⁻³ ppm) compared with the NC group (0.47×10⁻³ ppm) (p < 0.0001) (Figure 3). Although the standard deviation of ages was 10 years in NCs, the coefficient of skewness was calculated as −0.8413 (p = 0.8678), and suggested that age had no significant effect on the results. There was no significant correlation between susceptibility value and the clinical variables including disease duration, headache days per month, VAS, HAMA, HAMD, MoCA, and MIDAS scores (p > 0.05) (Table 2). The pooled histogram of susceptibility value of chronic migraine (CM) patients (1.44 × 10⁻³ ppm) and normal controls (NC) (0.47×10⁻³ ppm). Correlation analysis between the susceptibility value of whole brain and clinical variables. DD, disease duration; HDPM, headache days per month; HAMA, Hamilton Anxiety Scale; HAMD, Hamilton Depression Scale; MoCA, Montreal Cognitive Assessment; VAS, Visual Analog Scale; MIDAS, Migraine Disability Assessment Scale.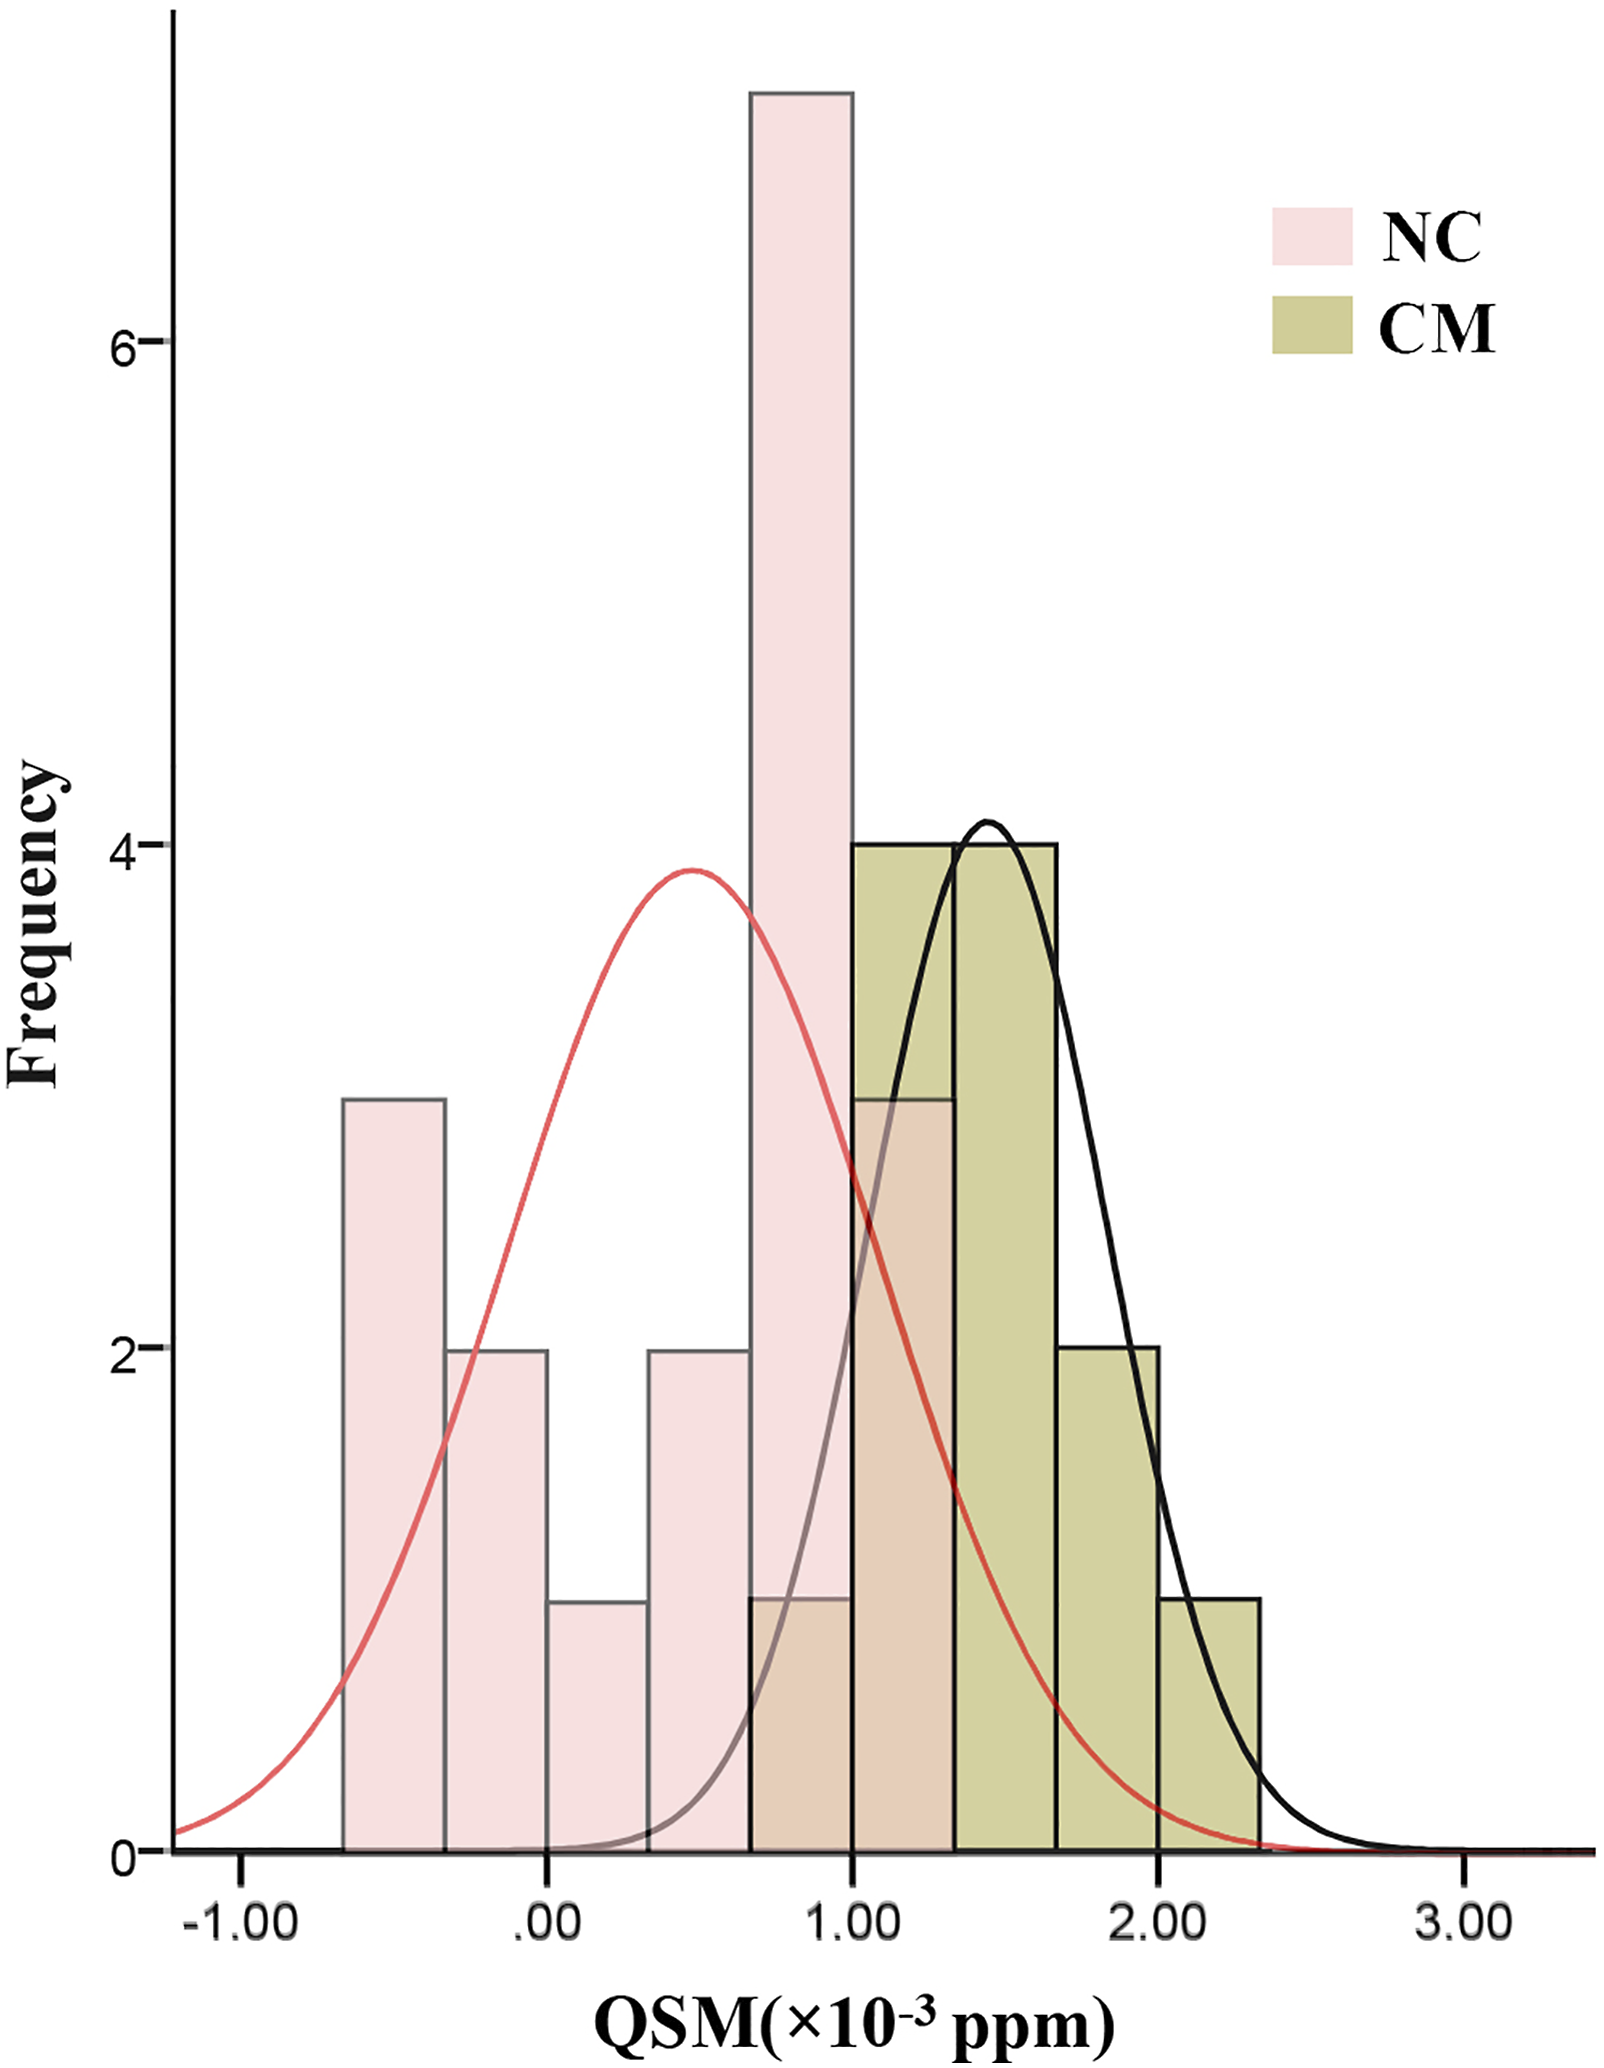
Receiver operating characteristics analysis of susceptibility value of CM and NC
The area under curve (AUC) was 0.949 (95% CI 0.879–1.019), and the cut-off value of the susceptibility value was set as 0.908×10⁻³ with sensitivity 77.78% and specificity 100% in distinguishing CM from NC (Figure 4). ROC curve of chronic migraine (CM) versus normal controls (NC) with the area under the curve 0.949.
Altered iron deposition of the brain regions based on automated anatomical labeling template in CM
Figure 5 indicated that the brain regions with the increased iron deposition located in the bilateral middle frontal gyri, inferior frontal gyri (opercular and triangular part), postcentral gyri, inferior parietal gyri, supramarginal gyri, angular gyri and precuneus, left precentral gyrus, superior frontal gyrus and middle occipital gyrus, right Rolandic operculum, supplementary motor area, and cuneus, while the decreased iron deposition located in the left inferior temporal gyrus in CM compared with NC based AAL template segment (Supplementary table 1). The comparison of the magnetic susceptibility value of the regional brain region between chronic migraine (CM) and normal controls (NC). Automated anatomical labeling (AAL)_01, left precentral gyrus; AAL_03, left superior frontal gyrus; AAL_07, left middle frontal gyrus; AAL_08, right middle frontal gyri; AAL_11, left opercular part of inferior frontal gyri; AAL_12, right opercular part of inferior frontal gyri; AAL_13, left triangular part of inferior frontal gyri; AAL_14, right triangular part of inferior frontal gyri; AAL_18, right Rolandic operculum; AAL_20, right supplementary motor area; AAL_46, right cuneus; AAL_51, left middle occipital gyrus; AAL_57, left postcentral gyrus; AAL_58, right postcentral gyrus; AAL_61, left inferior parietal gyrus; AAL_62, right inferior parietal gyrus; AAL_63, left supramarginal gyrus; AAL_64, right supramarginal gyri; AAL_65, left angular gyrus; AAL_66, right angular gyrus; AAL_67, left precuneus; AAL_68, right precuneus; AAL_89, left inferior temporal gyrus.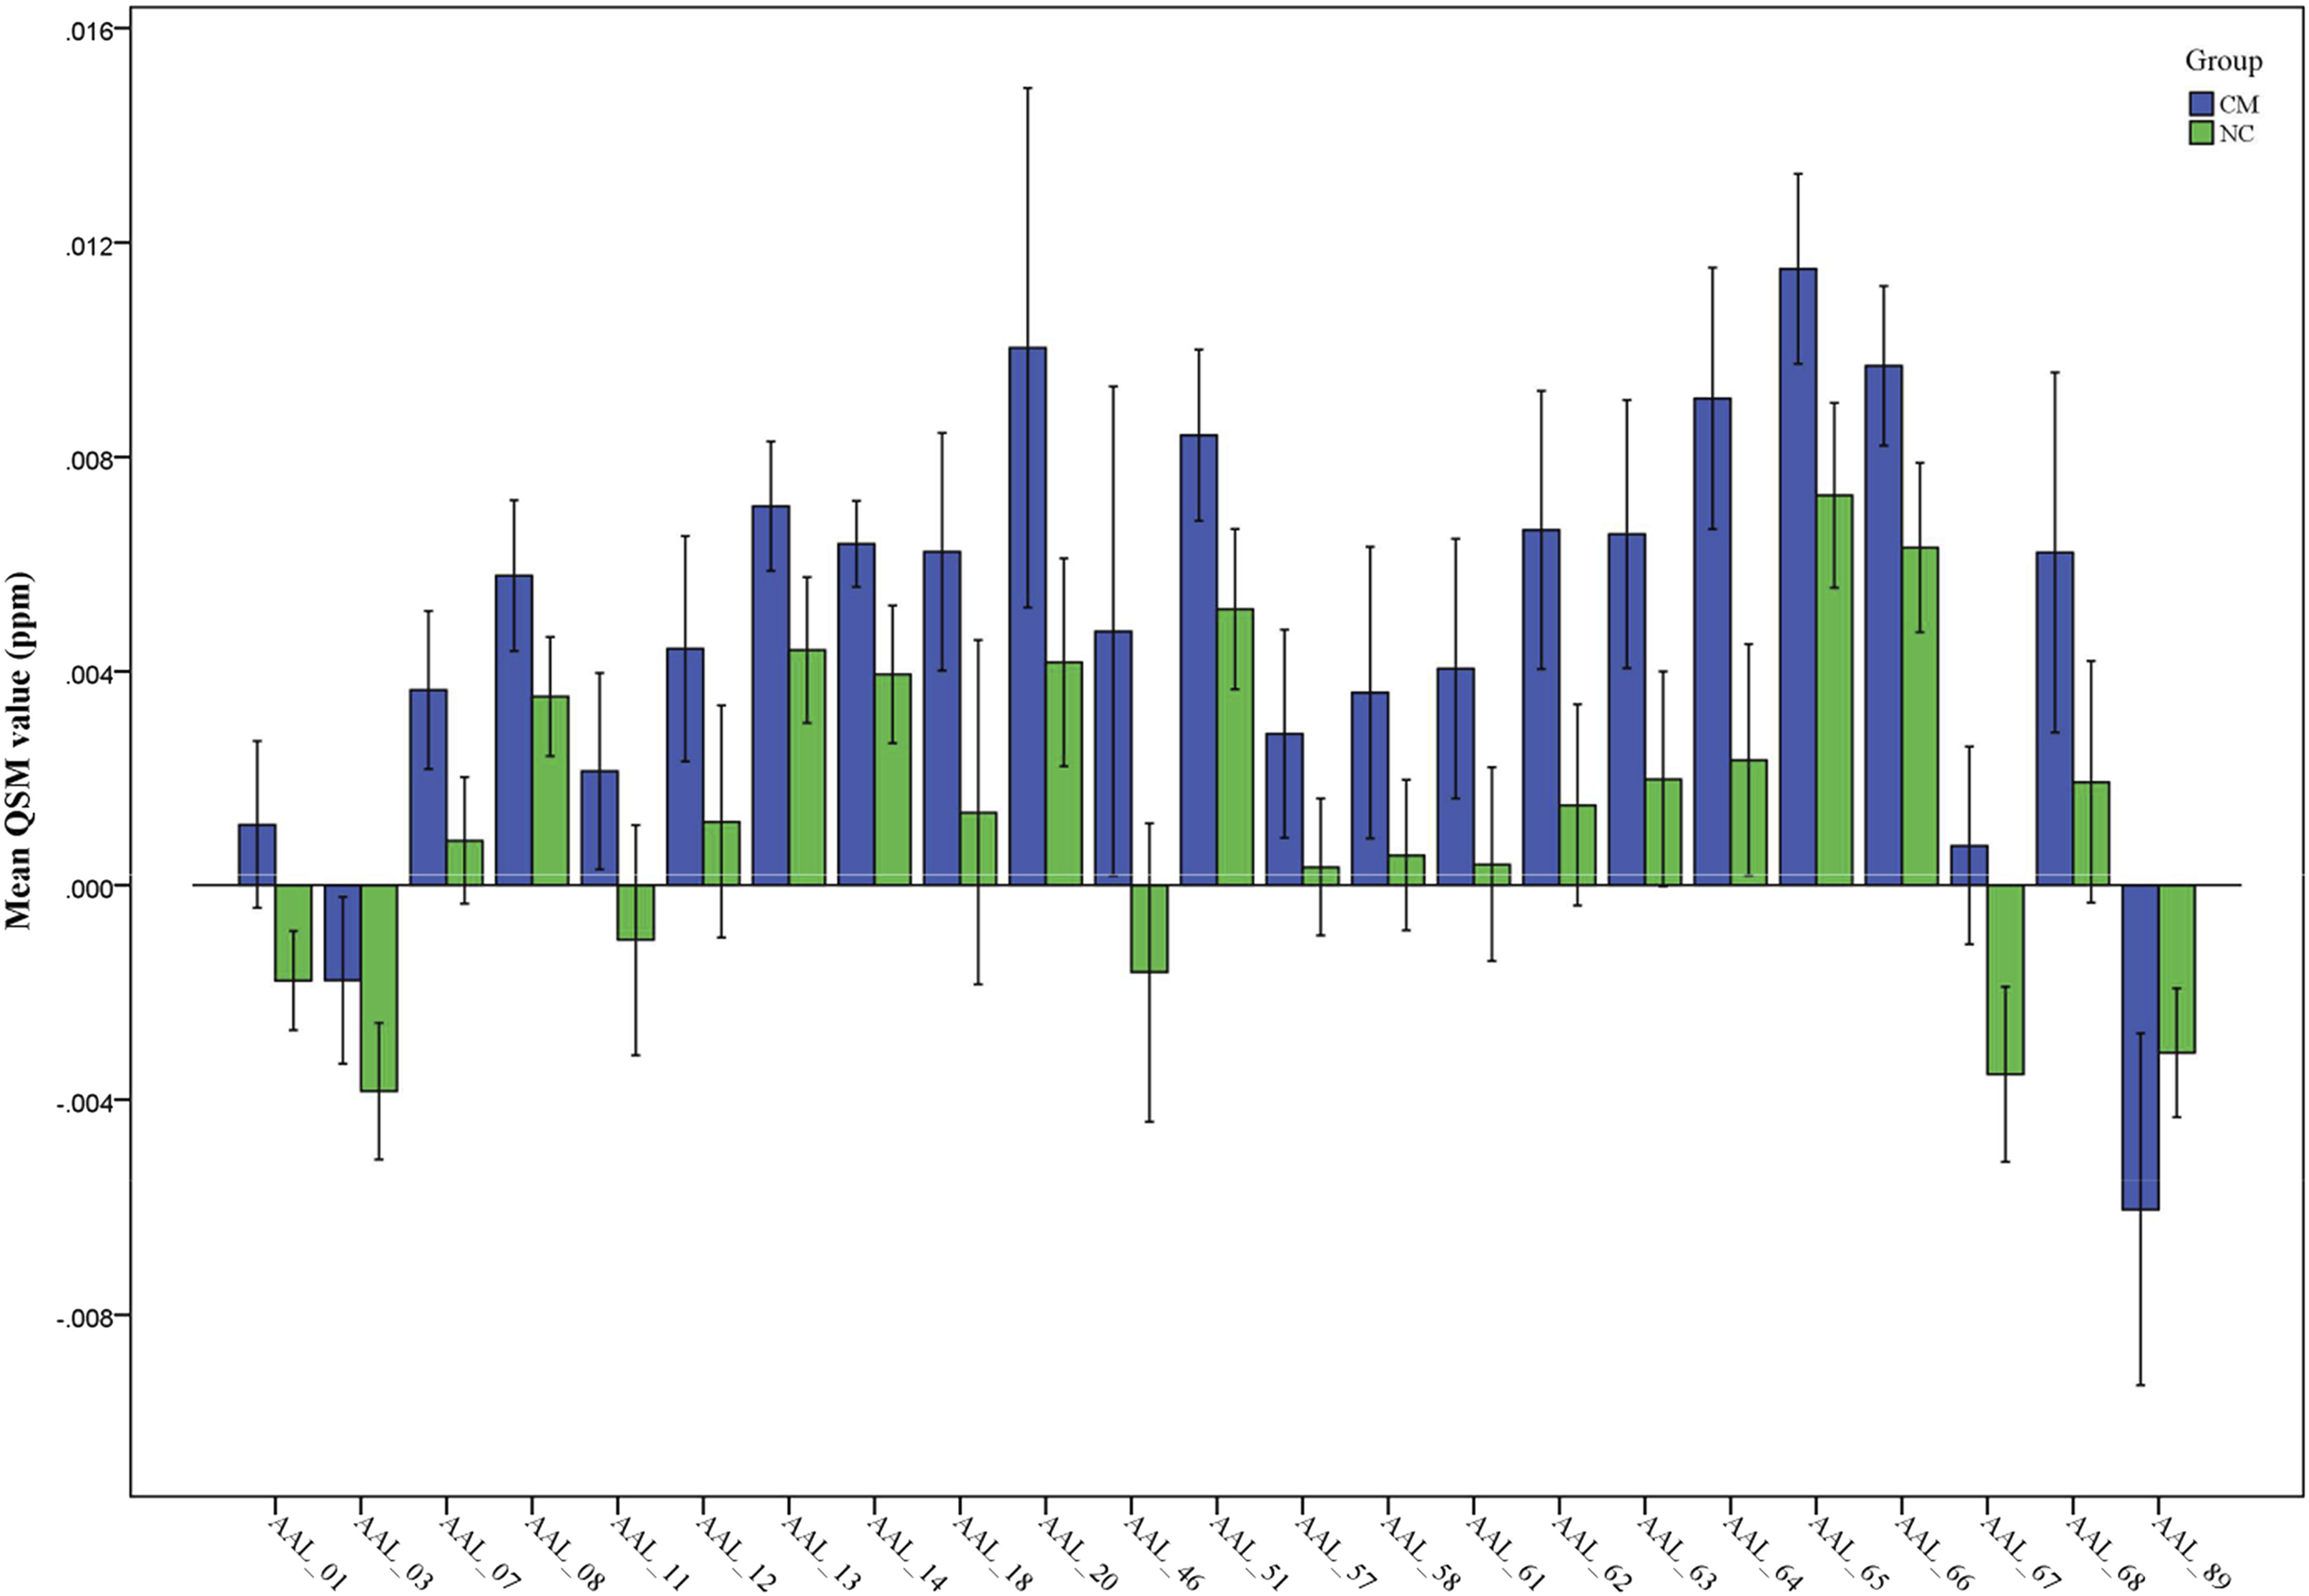
Discussion
Our exploratory cross-sectional study with QSM found that CM had a higher sensitivity score in whole brain gray matter compared to the NC group. There was no correlation between susceptibility value and clinical variables. The ROC analysis showed that QSM had high diagnostic efficacy in discrimination.
The prior studies demonstrated that increased iron deposition in affected brain regions, including PAG and red nuclei, may be related to clinical variables such as the duration of the disease and the frequency of attacks, 22 suggesting that increased infratentorial iron deposition presented in migraine. Another study found increased iron deposition in the globus pallidus in episodic migraine (EM) and was able to distinguish EM from CM, 21 suggesting that increased iron deposition in subcortical nuclei may play a role in the development or pathophysiology of migraine. However, cortical iron deposition in migraine has not been reported previously. Therefore, the current study sought to investigate iron deposition in the whole gray matter.
The current results indicated that CM patients had higher sensitivity values than NC in whole gray matter, suggesting that rich iron deposition was detected in CM. To date, the pathophysiology of migraine mainly included vascular and neural mechanisms. The increased iron deposition in this study reflected not only the vascular mechanism, which could be explained by cerebral venous insufficiency, 33 but also the neural mechanism, which is related to free radical damage,34,35 cellular transport of iron, and disruption of iron homeostasis 36 in CM. The causes of increased iron deposition in brain gray matter in CM could include: (1) The transferrin presents in the brain and its receptors, which may contribute to the transfer of iron to cells. Transferrin is much more distributed in the gray matter of the brain than in the white matter. 37 Therefore, the increased iron deposition might be associated with the higher iron metabolism and (2) The free radicals could easily damage the neurons with high iron transferrin levels, 38 and the migraine attacks could lead to hyperoxia episodes and then increase the iron-induced free radical cell damage, which could lead to increased iron deposition. 39
Previous studies focused on the deep nuclei20,21 and PAG 22 to investigate iron deposition. However, in the current study, iron deposition was mainly evaluated from the perspective of the whole brain gray matter, reducing the influence of selection bias without prior hypothesis. The increased iron deposition in the whole brain gray matter could explain the chronicity of migraine, 40 which could be associated with central sensitization, ultimately leading to synaptic plasticity, increased neuronal excitability, and enhanced neuronal response to painful stimuli in the central nervous system. In addition, the high iron content of brain gray matter would promote future research focused on altering connectivity between the cortex and subcortical gray nuclei in CM.
Further correlation analysis showed that susceptibility value had no statistically significant relationship with clinical variables assessed at the whole gray matter level to measure iron deposition. However, a prior study 22 demonstrated a correlation between clinical variables and iron deposition when focusing on the gray nuclei area. The difference of these two studies might be related with the brain iron deposition region of interest, which further indicated the iron deposition of whole gray matter might be useful in future studies as an independent imaging biomarker to distinguish CM from NC without 3-month clinical observation. 4 Furthermore, the finding may suggest the different mechanisms of supratentorial and subtentorial structure. Structural and functional imaging studies9,11,41 showed differences in thalamic and thalamo-cortical activity in migraine patients both during and between migraine attacks, indicating supratentorial structure might play an independent mechanism in CM development. In contrast, activation of the descending pain modulation system, including PAG could be response to the repeated pain stimulation.
Figure 4 further showed that susceptibility value could able to discriminate CM patients with a sensitivity of 77.78% and a specificity of 100% (AUC = 0.949), which could be considered as an optimal imaging biomarker for the diagnosis of CM. Previously, conventional, functional, 42 and structural MRI15–18 had been used to understand the neuromechanism of CM and had limited clinical practice. However, quantitative assessment of iron deposition by QSM could be conveniently performed from a clinical perspective. In our study, iron deposition was re-evaluated in the following ways: (1) quantitative evaluation was performed by QSM method, while conventional iron deposition was evaluated semi-quantitatively with T2*, SWI, T2, and T2′ sequence21,23; (2) iron deposition was measured in the whole brain gray matter, while conventional evaluation was limited to subcortical gray nuclei and PAG; and (3) it was an automatic measurement of iron deposition without subjective bias, whereas the conventional measurement was performed using the ROI method with manual drawing.
In the current study, Figure 6 suggested the altered pattern of the iron deposition presented as follows: (1) All the positive brain regions with altered iron deposition all located in the cortex, while the gray nuclei of the basal ganglia all presented no significant altered iron deposition; Compared with episodic migraine and normal controls, the morphological changes mainly locate the in the cerebral region might be associated the cortical region involved in the pain circuitry,43,44 and this morphological change pattern might be consistent with the altered iron deposition pattern in the current study, which should be further investigated. (2) The brain regions with the increased iron deposition mainly located in the bilateral frontal and parietal lobe and left middle occipital gyrus (22 brain regions), and the decreased iron deposition located in the inferior temporal gyrus (1 brain region). The increased iron deposition of the frontal and parietal gyri might be contributed to the reduced functional connectivity in the sensorimotor areas and cortex in CM patients
45
and disrupted pain processing.
46
However, the decreased iron deposition of the left inferior temporal gyrus might be related with vascular mechanism,
33
and the brain MR perfusion investigation should further be performed in CM patients in the future (Cerebral perfusion changes in migraineurs: a voxelwise comparison of interictal dynamic susceptibility contrast MRI measurements). The brain regions with the altered iron deposition.
Limitations of this study include: (1) the samples were relatively small, and therefore the results could only reflect the neuromechanism of CM to a certain extent; (2) other types of migraine should be investigated in the future study to better understand the neuromechanism of migraine; and (3) this study was a cross-sectional observation and could not directly infer the causal relationship in shifting the phenotype from episodic to chronic migraine. Therefore, longitudinal studies and assessment of response to treatment such as onabotulinumtoxin A 47 should be conducted in the future.
Conclusions
In conclusion, this study used the QSM technique to show the increased iron deposition in whole cerebral gray matter in CM. The susceptibility value of whole cerebral gray matter could be considered as a highly sensitive imaging biomarker for the diagnosis of CM, and QSM technique would be an optimal and simple tool for routine clinical practice in the diagnosis and therapeutic evaluation of CM.
Supplemental Material
sj-pdf-1-mpx-10.1177_17448069221074987 – Supplemental Material for The increased iron deposition of the gray matter over the whole brain in chronic migraine: An exploratory quantitative susceptibility mapping study
Supplemental Material, sj-pdf-1-mpx-10.1177_17448069221074987 for The increased iron deposition of the gray matter over the whole brain in chronic migraine: An exploratory quantitative susceptibility mapping study by Zhiye Chen, He Zhao, Xiaoyan Chen, Mengqi Liu, Xin Li, Lin Ma, and Shengyuan Yu in Molecular Pain
Footnotes
Author contributions
Zhiye Chen conceived and wrote the paper. Xiaoyan Chen collected clinical data. He Zhao and Xin Li wrote part of the paper. Mengqi Liu collected imaging data. Zhiye Chen analyzed the data. Lin Ma and Shengyuan Yu revised the paper.
Declaration of conflicting interests
The authors declare that the research was conducted in the absence of any commercial or financial relationships that could be construed as a potential conflict of interest
Funding
The author(s) received no financial support for the research, authorship, and/or publication of this article.
Ethic statement
This study was carried out in accordance with the recommendations of the Ethics Committee of Chinese PLA General Hospital with written informed consent from all subjects. All subjects gave written informed consent in accordance with the Declaration of Helsinki. The protocol was approved by the Ethics Committee of Chinese PLA General Hospital (S2015-085–01).
Supplemental material
Supplemental material for this article is available online.
References
Supplementary Material
Please find the following supplemental material available below.
For Open Access articles published under a Creative Commons License, all supplemental material carries the same license as the article it is associated with.
For non-Open Access articles published, all supplemental material carries a non-exclusive license, and permission requests for re-use of supplemental material or any part of supplemental material shall be sent directly to the copyright owner as specified in the copyright notice associated with the article.