
Abstract
Capsaicin is an agonist of transient receptor potential cation channel subfamily V member 1 (TRPV1). Strong TRPV1 stimulation with capsaicin causes mitochondrial damage in primary sensory neurons. However, the effect of repetitive and moderate exposure to capsaicin on the integrity of neuronal mitochondria remains largely unknown. Our electron microscopic analysis revealed that repetitive stimulation of the facial skin of mice with 10 mM capsaicin induced short-term damage to the mitochondria in small-sized trigeminal ganglion neurons. Further, capsaicin-treated mice exhibited decreased sensitivity to noxious heat stimulation, indicating TRPV1 dysfunction, in parallel with the mitochondrial damage in the trigeminal ganglion neurons. To analyze the capsaicin-induced mitochondrial damage and its relevant cellular events in detail, we performed cell-based assays using TRPV1-expressing PC12 cells. Dose-dependent capsaicin-mediated mitochondrial toxicity was observed. High doses of capsaicin caused rapid destruction of mitochondrial internal structure, while low doses induced mitochondrial swelling. Further, capsaicin induced a dose-dependent loss of mitochondria and autophagy-mediated degradation of mitochondria (mitophagy). Concomitantly, transcriptional upregulation of mitochondrial proteins, cytochrome c oxidase subunit IV, Mic60/Mitofilin, and voltage-dependent anion channel 1 was observed, which implied induction of mitochondrial biogenesis to compensate for the loss of mitochondria. Collectively, although trigeminal ganglion neurons transiently exhibit mitochondrial damage and TRPV1 dysfunction following moderate capsaicin exposure, they appear to be resilient to such a challenge. Our in vitro data show a dose–response relationship in capsaicin-mediated mitochondrial toxicity. We postulate that induction of mitophagy and mitochondrial biogenesis in response to capsaicin stimulation play important roles in repairing the damaged mitochondrial system.
Keywords
Introduction
For over 6000 years, capsaicin has been used in various food products to add a spicy flavor. 1 The functional complementary DNA (cDNA) encoding the capsaicin receptor was isolated at the end of the 20th century. 2 This receptor is currently referred to as the transient receptor potential cation channel subfamily V member 1 (TRPV1) and is a nonselective cation channel activated by noxious heat (>43°C) and low pH, apart from capsaicin.2,3 It has been shown that TRPV1 plays a critical role in the development of inflammatory thermal hyperalgesia, wherein its function is potentiated by inflammatory mediators such as bradykinin and nerve growth factor.4–8 Alternatively, strong TRPV stimulation causes nociceptor desensitization and is used for therapeutic purposes. An illustrative example is Qutenza®, the occlusive patches containing 8% (∼285 mM) capsaicin that confer a long-lasting relief from postherpetic neuralgia.9,10
The proposed mechanisms underlying nociceptor desensitization include downregulation of TRPV1 function11–13 and neurodegeneration.14,15 Several studies have demonstrated that the systemic administration of high-dose capsaicin (50–100 mg/kg) causes mitochondrial degeneration in the trigeminal ganglion (TG) and dorsal root ganglion (DRG) neurons for up to 70 days.16–19 Mitochondria are the powerhouse of the cell and home to apoptogenic molecules, such as cytochrome c and apoptosis-inducing factor. 20 Therefore, the integrity of mitochondria is crucial for maintaining cell viability. High-dose capsaicin-induced mitochondrial damage may contribute to antinociception by reducing the cell viability of TRPV1-expressing nociceptors, and concerns have been raised regarding the development of long-term sensory deficit and neuropathic pain stemming from neurodegeneration.1,21 However, it is unclear if moderate capsaicin stimulation can affect mitochondria in TRPV1-expressing nociceptors. At 10 mM dosage (∼0.28 weight/weight%), capsaicin has been observed to affect nocifensive behavior,3,22,23 somatosensory thalamocortical activation, 24 and extracellular signal-regulated kinase phosphorylation 25 in the trigeminal system. In addition to this, topical administration of capsaicin at a dose of 50 to 165 mM has been used to assess human dermal blood flow. 26 Therefore, it is pertinent to our daily lives that hot sauces contain variable amounts of capsaicinoids (capsaicin and dihydrocapsaicin), ranging from 4 to 800 µM. 27 Mitochondria have evolved a multitude of quality control systems. Restoration of damaged mitochondrial proteins can be executed by mitochondria-resident chaperones and proteases and by well-coordinated processes involving mitochondrial fission/fusion.28,29 In the event of extensive mitochondrial damage, bulk elimination of mitochondria is accomplished by mitophagy. 30
The effects of moderate capsaicin exposure on the integrity of mitochondria in TRPV1-expressing neurons remain largely unknown. Therefore, in the present study, we examined the capsaicin-mediated mitochondrial damage in TG neurons and TRPV1-expressing PC12 cells. We delineate the cellular mechanism by which cells cope with moderate exposure to capsaicin. The results of our study provide an important clue to the development of neuroprotective therapy for sensory neurons.
Materials and methods
In vivo experiments
Animals
A total of 25 adult male C57BL/6 mice (CLEA Japan, Fujinomiya, Japan) were used. All animal-based experiments were performed according to the protocol approved by the Laboratory Animal Care and Use Committee of Keio University (No. 14084). Mice were maintained in 12 h light/dark environment with food and water available ad libitum. Before beginning the experiments, all animals were anesthetized with 2% isoflurane.
TRPV1 stimulation in the mouse trigeminal nerve region with capsaicin
Repetitive capsaicin stimulation of the trigeminal nerve region was performed by placing a piece of blotting paper soaked in 10 mM capsaicin to the left side of the face for 2, 4, or 6 days (N = 5 in each group) and a dimethyl sulfoxide (DMSO)-soaked blotting paper placed on the right side of the face served as the control.The duration of each treatment session was 30 min based on our previous study. 22 To prepare the TG samples for electron microscopy, animals were anesthetized at the end of the pharmacological treatment. Subsequently, they were subjected to transcardial perfusion with phosphate-buffered saline (PBS), followed by freshly prepared 4% paraformaldehyde and 0.01% glutaraldehyde in phosphate buffer (pH 7.4). Next, TG tissue was gently excised and subjected to postfixation with 0.5% osmium tetroxide. Following dehydration, the tissue was embedded in epoxy resin. To assess the mitochondrial damage, 50 to 100 TG neurons were examined in each sample. To prepare samples for fluorescent immunostaining, perfusion fixation was performed with 4% paraformaldehyde in phosphate buffer (pH 7.4). The excised TG tissues were frozen in presence of 30% sucrose. Subsequently, 10- to 12-µm thick frozen sections were cut using a cryostat (Leica CM 3050S; Leica Biosystems, Nussloch, Germany). Immunostaining was performed using the rabbit polyclonal anti-TRPV1 antibody (code KM 018; TransGenic, Kumamoto, Japan) at a dilution of 1:500 as per the previously described protocol. 31
Heat pain threshold temperature measurement
Mice were subjected to repetitive 30 min capsaicin (10 mM) or DMSO exposure on the bilateral face for six consecutive days (N = 5 for each treatment). Heat pain threshold temperature was examined at the time points identical to those of the TG dissection. The detailed protocol for heat pain threshold temperature has been described previously. 31 Facial hair was trimmed with a clipper, followed by the application of a depilatory cream (Reckitt Benckiser Japan, Tokyo Japan) on the face for 1 min. Subsequently, facial hair was removed with a metallic spatula. Residual cream was completely wiped off, and the absence of any wound or flare reaction was confirmed. The mice were acclimatized to restrain using the following procedure. Briefly, mice were anesthetized with 1.5% isoflurane, and their bodily movement was gently restricted using surgical tapes. After a 30-min recovery period from anesthesia, the mice were placed in a heat pain threshold apparatus. The surface temperature of Peltier module bars was set at room temperature. One week before the heat pain threshold experiment, each mouse underwent three rounds of the acclimation procedure. Only those mice that were capable of staying calm for at least 1 min after this procedure in all the three rounds were used in this study. To measure threshold temperature for heat pain, a pair of Peltier module bars with surface temperature regulated between 36°C and 56°C was applied to the face bilaterally. The bar surface temperature was gradually increased from 36°C by 1°C/4 sec until face withdrawal. Mouse behaviors were monitored by a video recorder (Panasonic, Kadoma Japan). Video analysis was performed by an examiner blind to the identity of the animals. The lowest temperature at which a mouse turned the head away from the bars was recorded as the heat pain threshold temperature. In each session, measurement of the threshold temperature was repeated five times.
Our preliminary results revealed that the standard deviation (SD) of the heat pain threshold temperature of untreated control mice was 0.7°C. With the type I error rate and power set at 5% and 0.80, respectively, to detect a 0.5°C to 0.7°C difference, the sample size required was calculated as 16 to 31. Accordingly, we used five animals and measured the threshold temperature in pentaplicate at every measuring time point, as stated above.
In vitro experiments
Cell culture
We have previously reported the establishment of PC12 cells stably expressing full-length murine TRPV1 N-terminally fused with the enhanced green fluorescent protein (EGFP). 22 We obtained a cell line with no detectable TRPV1 expression, and it was used as a control in the present study. Cells were grown in Dulbecco's Modified Eagle Medium (DMEM)/F12 (Thermo Fisher Scientific, Waltham, MA) and supplemented with 15% horse serum (Thermo Fisher Scientific) and 2.5% fetal bovine serum (Thermo Fisher Scientific).The cells were cultured at 37°C, 95% relative humidity, and 5% CO2.
TRPV1 activation experiments
EGFP-TRPV1-expressing PC12 cells and control cells were exposed to TRPV1 agonists, capsaicin (M2028, Sigma-Aldrich, St. Louis, MO), and anandamide (Sigma-Aldrich). Cells were treated with capsazepine (a TRPV1 agonist), bafilomycin A1, or DMSO (control), 30 min prior to capsaicin treatment.
Calcium imaging
TRPV1-expressing PC12 cells were incubated with 5 µM Rhod-2 AM (Thermo Fisher Scientific) in the imaging solution containing 117 mM NaCl, 2.5 mM KCl, 2 mM CaCl2, 2 mM MgSO4, 25 mM 4-(2-hydroxyethyl)-1-piperazineethanesulfonic acid (HEPES), and 30 mM D-(+)-glucose (pH 7.4) at 37°C for 20 min.Subsequently, the cells were washed for 30 min in the imaging solution. For capturing images, the cells were flushed with imaging solution at a rate of 10 mL/min at 23°C to 25°C, followed by exposure to the imaging solution containing capsaicin. Images were acquired at 2 Hz (500 ms exposure time) with a cooled charge-coupled device camera (Andor iXon, DU897) connected to a Nikon Eclipse microscope with a 20 × (NA 0.45) objective lens.
Western blot analysis
Cells were rinsed with PBS and the pellet was collected by centrifugation (1000 rpm, 5 min). For the preparation of the whole cell lysate, cell pellets were lysed with 1X Laemmli sample buffer (Bio-Rad Laboratories, Hercules, CA). In a subset of experiments, protein-enriched fractions were isolated from the plasma membranes using Mem-PER™ Plus Membrane Protein Extraction Kit (Thermo Fisher Scientific) according to the manufacturer’s protocol. Samples were resolved using sodium dodecyl sulphate-polyacrylamide gel electrophoresis, and separated proteins were electrically transferred to the polyvinylidene fluoride membranes (Immobilon-P; Merck, Darmstadt, Germany). The membranes were immunolabeled with primary antibodies by incubating overnight at 4°C, followed by incubation with horseradish peroxidase-conjugated host-specific anti-IgG secondary antibodies (Jackson ImmunoResearch, West Grove, PA) at room temperature for 2 h. The primary antibodies and their dilutions used in this study were as follows: anti-LC3 antibody (#PM036, MBL, Nagoya, Japan; 1:1000), anti-glyceraldehyde 3-phosphate dehydrogenase antibody (#2118, Cell Signaling Technologies, Danvers, MA; 1:500), anti-α-tubulin antibody (T5168, Sigma-Aldrich; 1;5000), anti-GFP antibody (Code No. 598, MBL; 1:1000), and anti-Na+/K+-ATPase antibody (3010S, Cell Signaling Technologies; 1:500).Immunoreactivity was detected by chemiluminescence (Western Lightning Plus-ECL, PerkinElmer, Waltham, MA), while image capture and band intensity quantification were performed using Image Quant LAS4000 (GE Healthcare, Chicago, IL).
Gene expression analysis of mitochondria-resident proteins by real-time polymerase chain reaction
Total RNA was isolated from cells using the RNeasy Mini Kit (Qiagen, Hilden, Germany) according to the manufacturer’s instructions. With aliquots of 100 to 500 ng RNA, first-strand cDNA synthesis was carried out by using SuperScript™ III First-Strand Synthesis Kit (Thermo Fisher Scientific). The primer sets used for the amplification are listed in Table 1. Quantitative real-time polymerase chain reaction (RT-PCR) was performed with the PikoReal and DyNAmo Flash SYBR Green qPCR Kit (Thermo Fisher Scientific). Each reaction (40 cycles of denaturing at 95°C and annealing and elongation at 60°C) was run in quadruplicates, and Lamin A was used as the internal control to normalize quantitative PCR data.
Primer sets used for RT-PCR experiments.

Cox IV: cytochrome c oxidase subunit IV; Vdac: voltage-dependent anion channel.
Electron microscopic analysis of mitochondria
Cells were fixed with 2.5% glutaraldehyde/0.1 M cacodylate buffer, pH 7.4, followed by postfixation with 0.5% osmium tetroxide in 0.1 M phosphate buffer. Following dehydration using an ethanol ethanol/acetone and acetone gradient, the cells were embedded in epoxy resin. Ultrathin sections were stained with uranyl acetate and lead citrate and observed under a transmission electron microscope (JEOL 1230, Peabody, MA, USA). Images were captured randomly. Section areas of mitochondria were measured using Adobe Photoshop. Approximately 150 mitochondria images (10,000× magnification) were analyzed.
Mitochondrial staining and mitophagy detection
Cells were grown in glass-bottom dishes (Matsunami Glass, Kishiwada, Japan). After pharmacological treatments, the cells were washed twice with the serum-free medium. Mitochondrial staining was performed using MitoBright Red (300 nM, #MT07, Dojindo Molecular Technology, Kumamoto, Japan) at 37°C for 30 min. Thereafter, the culture media was changed, and serial confocal images were acquired using a TCS-SP5 confocal laser scanning microscope (Leica Microsystems, Mannheim, Germany) with excitation and emission wavelengths set at 561 nm and 600 nm, respectively. The numbers of dots representing mitochondria per cell were counted from 15 randomly chosen cells. Fluorescence was quantified in the regions of interest under a nonsaturated excitation condition, using the z-stack imaging and the associated analysis software. The Mtphagy Dye® (#MD01, Dojindo Molecular Technology) was used to detect mitophagy in cells. Briefly, cells were incubated with Mtphagy Dye (200 nM) at 37°C for 45 min. After washing twice with serum-free media, the cells were subjected to pharmacological treatment, and images were captured using the TCS-SP5 confocal laser scanning microscope. The proportions of cells bearing Mtphagy Dye®-positive dots were calculated by an examiner blinded to the identity of pharmacological treatments. All cells within the five randomly chosen visual fields (100–300 cells/field) were examined.
Statistical analysis
All data were expressed as mean ± SD. Data normality was assessed by D'Agostino–Pearson test. The normally distributed data were analyzed by one-way analysis of variance (ANOVA) along with Dunnett’s test for between-group comparisons. For nonnormally distributed data, the Kruskal‒Wallis test and Dunn’s multiple comparison test were applied. To assess the relationship between the pharmacological treatments and mitochondrial swelling, odds ratios were calculated, and their statistical significance was evaluated by Fisher’s exact test. For the effects of capsaicin and time on heat threshold temperature, two-way ANOVA and Sidak’s multiple comparison test were performed. GraphPad Prism 7 (GraphPad Software Inc., San Diego, CA) was used for the statistical analysis, and results with p < .05 were considered as statistically significant.
Results
Mitochondrial damage in TG neurons by repetitive facial capsaicin stimulation
We first sought to elucidate whether capsaicin caused mitochondrial damage in vivo. Daily application of capsaicin (10 mM) to the face of the mice was performed as shown in Figure 1(a). Schematic representation of the exact positioning of capsaicin treatment is shown in Figure 1(b). Figure 1(c) to (e) shows an electron microscopic (EM) image of normal TG tissue. Electron microscopy revealed the presence of two distinct populations of TG neurons: small neurons with dark cytoplasm (indicated with the white asterisk in Figure 1(c)) and large neurons with pale cytoplasm (indicated with the black asterisk in Figure 1(c)). Results from electron microscopy showed vacuolated mitochondria in small-sized neurons with relatively dark cytoplasm after four repetitive stimuli (Figure 1(f) to (h)). Fluorescent immunostaining showed TRPV1 expressed in small TG neurons (inset, Figure 1(f)), and the damaged mitochondria were swollen, and destruction of mitochondrial cristae (cristolysis) was observed (Figure 1(g) and 1(h)). Alternatively, we did not observe discernible morphological changes in mitochondria of the contralateral TG (data not shown). Moreover, damaged mitochondria were inconspicuous on Day 6 (data not shown).

Mitochondrial damage in TG neurons by repetitive facial capsaicin stimulation. (a) Experimental protocol for repetitive facial capsaicin stimulation. For histological analysis of TG neurons, vehicle and capsaicin (10 mM) were applied to the right side and left side of the face, respectively. For threshold temperature measurement, either vehicle or capsaicin (10 mM) was applied to the bilateral face. (b) Schematic representation shows the exact positioning of the blotting paper on the face of the mice. The area of hair removal is shown as (1). A 3 mm × 3-mm piece of blotting paper soaked with vehicle or 10 mM capsaicin was put on (2). Care was taken not to place the blotting paper on the area where hair was removed. Only the right side has been represented. (c) Low-power (×2000) image of TG tissue of a normal mouse. White and black asterisks indicate small and dark, and large and pale TG neurons, respectively; bar = 5 µm. (d) Enlarged (×5000) image of the white rectangle in (c); bar = 2 µm. (e) Enlarged (×10,000) image of the white rectangle in (d). The morphology of a representative mitochondrion in a TG neuron is shown (arrow); bar = 1 µm. Magnification: ×10,000. (f) Low-power (×2000) image of TG tissue of a mouse subjected to four repetitive capsaicin stimuli (day 4). White and black asterisks indicate small and dark, and large and pale TG neurons, respectively; bar = 5 µm. The inset shows a representative image of fluorescent TRPV1 immunostaining of TG tissue. TRPV1 immunostaining was mainly observed in small-sized neurons; bar = 5 µm. (g) Enlarged (×5000) image of the white rectangle in (f); bar = 2 µm. (h) Enlarged (×10,000) image of the white rectangle in (g). White arrows indicate mitochondria with damaged internal architecture; bar = 1 µm.
Capsaicin-induced abnormality in facial heat sensitivity
To assess trigeminal TRPV1 function in mice exposed to repetitive facial capsaicin stimulation, we examined the time course of heat pain threshold temperature in the face (Figure 1(a)). Unlike the animals used for histological analysis, mice were subjected to repetitive daily exposure of either capsaicin (10 mM) or vehicle (DMSO) to the face bilaterally. In the mice treated with vehicle, there was no significant change in heat pain threshold temperature through Day 6 as compared with the baseline (Figure 2). Capsaicin-treated mice exhibited significant elevation in heat pain threshold temperature versus the baseline value at all time points (mean differences: 1.796, 95% confidence interval (CI): 1.202–2.39, p < .001 at Day 2; 2.888, 95% CI: 2.294–3.482, p < .001 at Day 4, and 0.796, 95% CI: 0.2016–1.39, p < .01 at Day 6, Dunnett’s test). Two-way ANOVA revealed a significant interaction between capsaicin treatment and time (p < .0001). Moreover, significant differences were observed between the vehicle-treated and capsaicin-treated groups at Day 2, Day 4, and Day 6 (mean differences: 1.924, 95% CI: 1.383–2.465, p < .0001 at Day 2; 2.972, 95% CI: 2.431–3.513, p < .0001 at Day 4, and 0.952, 95% CI: 0.411–1.493, p < .0001 at Day 6, Sidak’s multiple comparison test).

Effect of capsaicin administration on facial heat pain threshold temperature. Facial heat pain threshold temperature was measured for mice subjected to repetitive capsaicin (red) or vehicle (green) facial application. One-way ANOVA and Dunnett’s multiple comparison test were performed to assess the change from baseline temperature in each treatment group. *p<.0001 vs. the baseline value, Dunnett’s multiple comparison test. Two-way ANOVA and Sidak’s multiple comparison were carried out to evaluate the effects of capsaicin treatment and time on the temporal profile of heat pain threshold temperature. #p<.0001 between the vehicle and capsaicin groups, Sidak’s multiple comparison test.
Effects of capsaicin treatment on mitochondrial morphology
The functional status of the TRPV1 expression cassette in PC12 cells was confirmed by calcium imaging using Rhod-2 AM (Figure 3(a)). When PC12 cells overexpressing TRPV1 (TRPV1 High) were treated with capsaicin (50 μM), cells assumed a rounded morphology and detached from the bottom of the culture dish within 30 min (Figure 3(b)). Alternatively, PC12 cells expressing TRPV1 at a lower level (TRPV1 Low) did not exhibit any obvious morphological changes under similar experimental conditions (Figure 3(b)). Further, treatment of TRPV1 High with 10 μM capsaicin for 60 min did not cause any discernible change. Electron microscopy results revealed that although the capsaicin stimulation did not induce morphological changes in the mitochondria in TRPV1 Low cells (Figure 3(c)), it did cause mitochondrial swelling in TRPV1 High cells (Figure 3(d)). Further, a significantly larger mitochondrial section area was observed in TRPV1 High cells treated with 10 μM capsaicin compared to DMSO-treated TRPV1 High and TRPV1 Low cells (Table 2). For instance, cells challenged with 10 µM capsaicin for 60 min were 7.11 times more likely to have mitochondria visible in a given section area ≥200 × 10–3 µm2 compared to DMSO-treated control cells (95% CI: 3.29–15.34) (p < .0001). Swollen mitochondria were also observed in TRPV1 High cells exposed to 50 µM capsaicin. However, cristolysis was also a striking feature in these cells (Figure 3(d)). Induction of mitochondrial swelling was more remarkable with 10 µM capsaicin treatment when we compared the odds of harboring mitochondria within a section area ≥300 × 10–3 µm2 relative to the control cells (10 µM capsaicin: 13.64% vs. 0.73%, OR: 21.47, 95% CI: 3.68–226.5, p < .001; 50 µM capsaicin: 2.82% vs. 0.73%, OR: 3.94, 95% CI: 0.64–48.55; Table 2). For comparison, we examined the effect of TRPV1 agonist anandamide on mitochondrial morphology and found that anandamide also caused mitochondrial swelling (Table 2). However, we did not observe any significant destruction of the internal structure at 50 µM anandamide (Figure 3(e)). Histograms for the frequency distribution of mitochondrial section areas are shown in Figure 4.
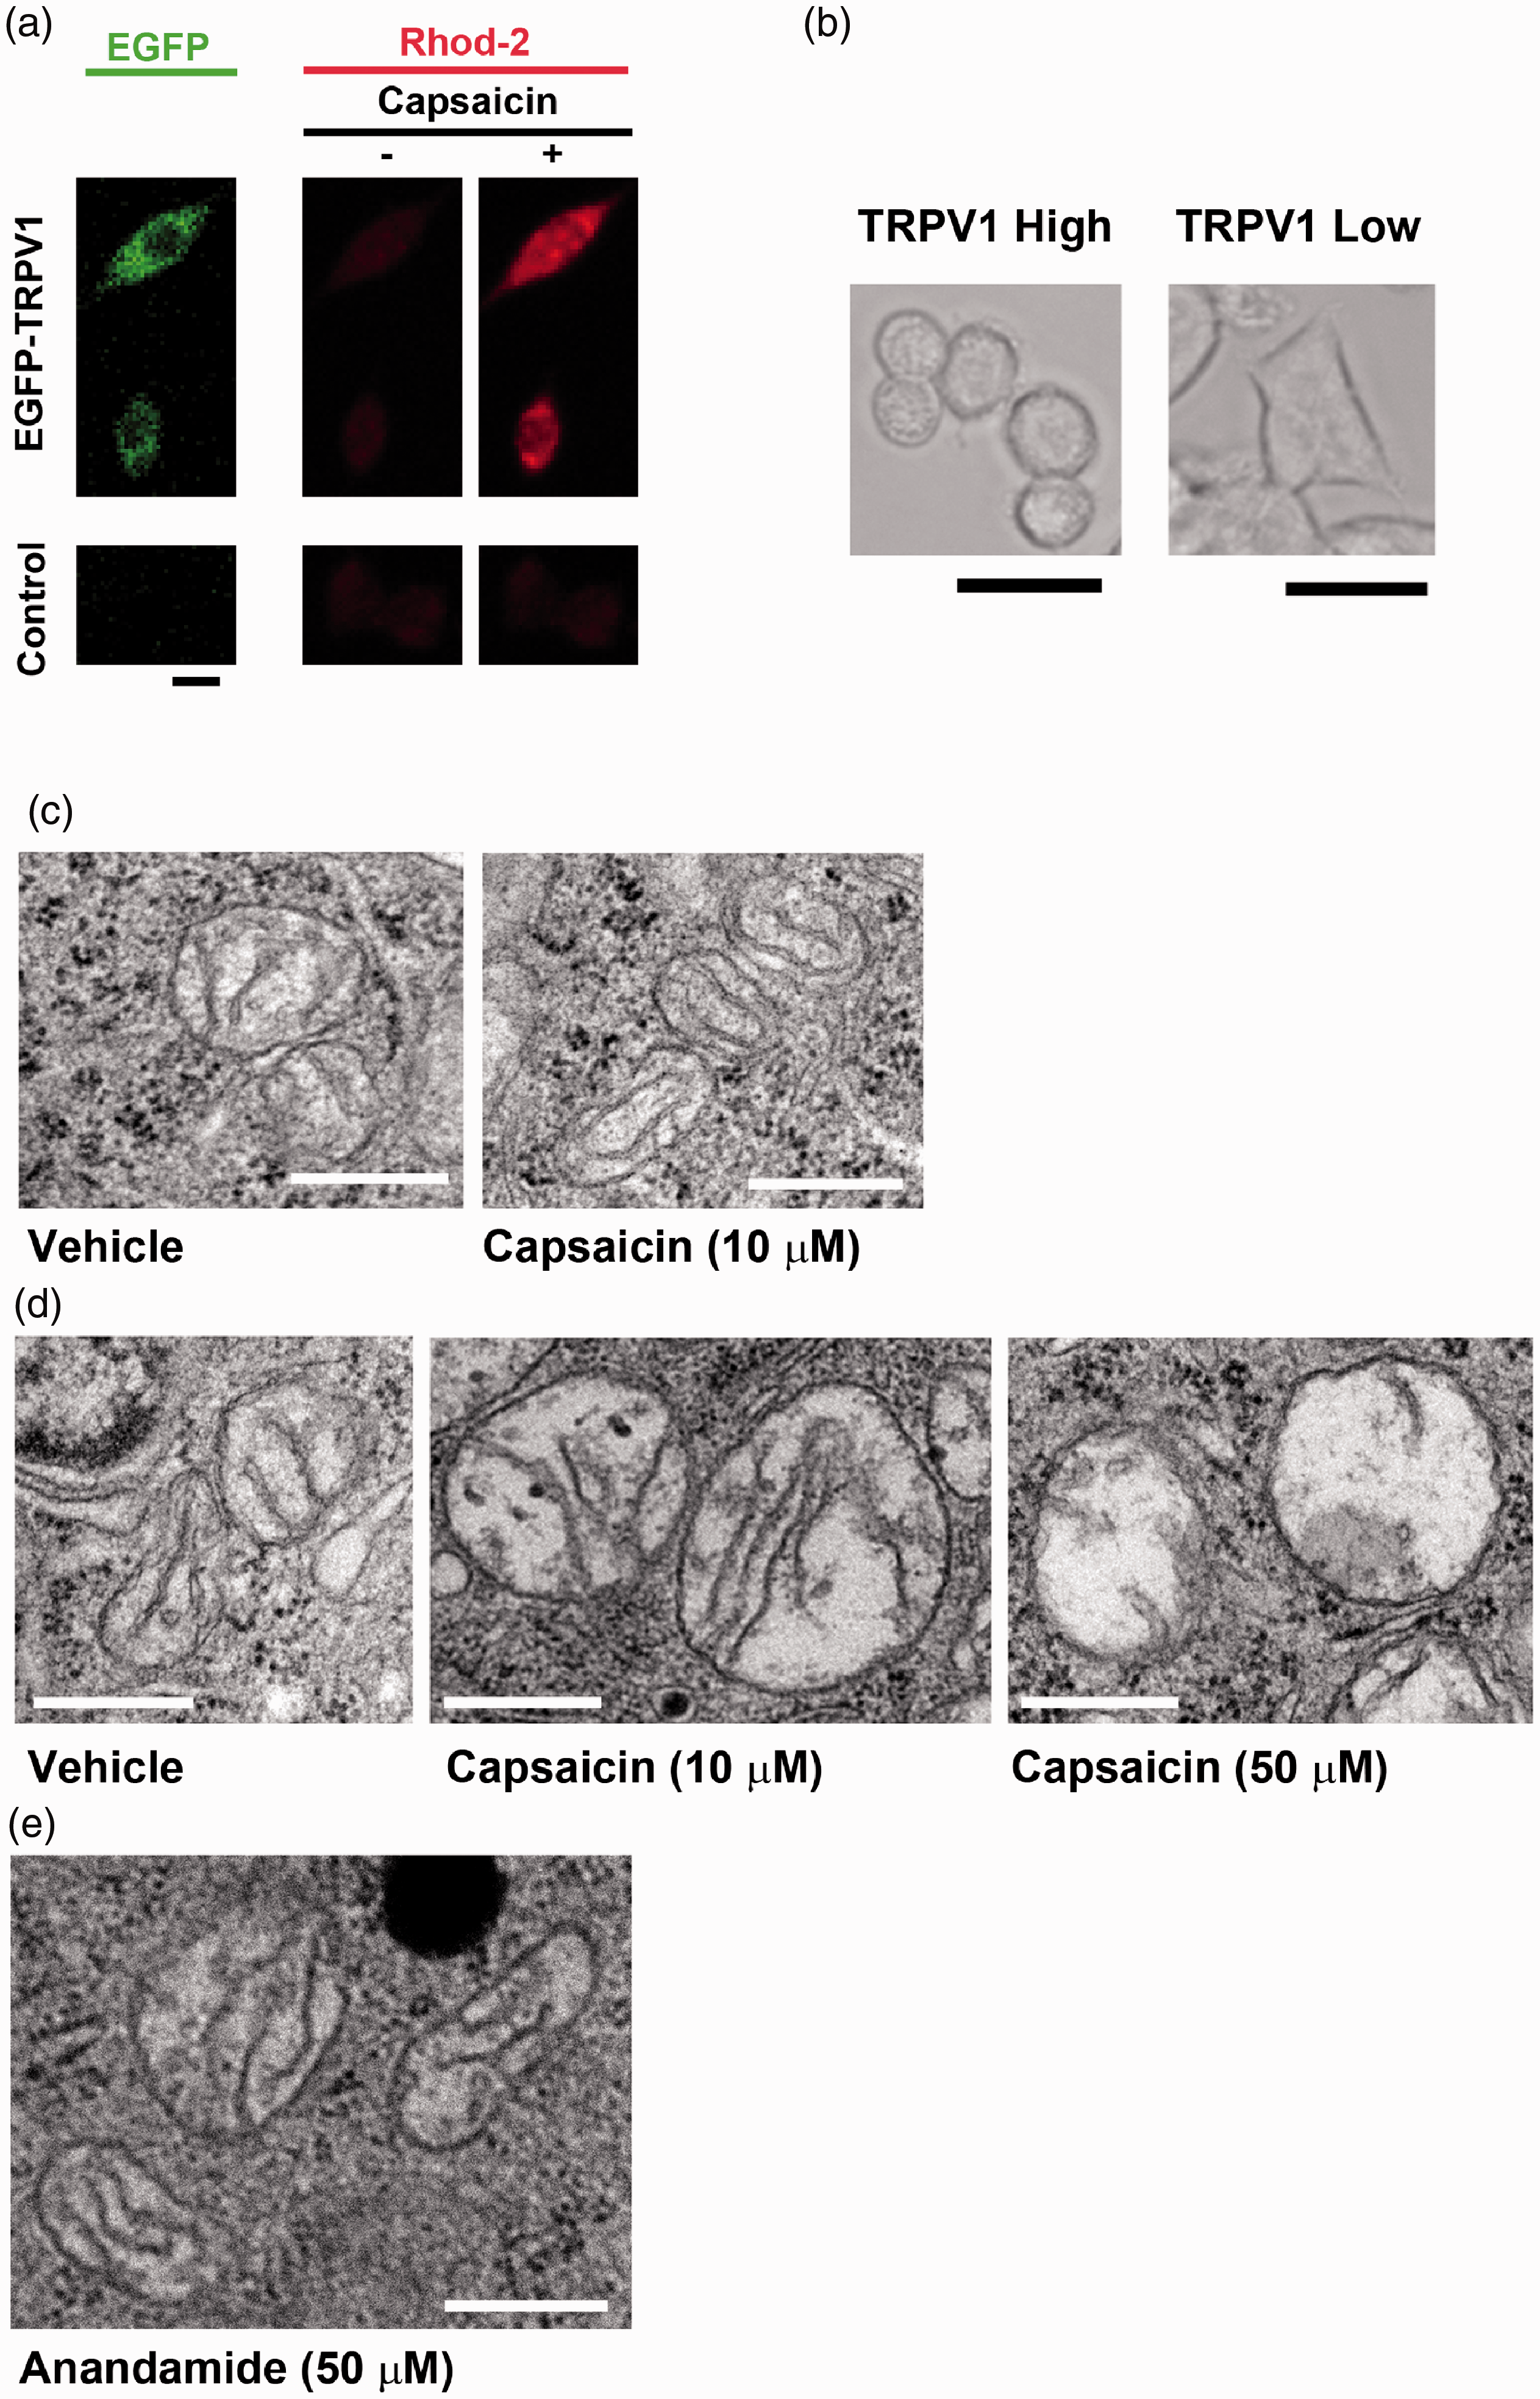
Dose-dependent effects of capsaicin on mitochondrial morphology. (a) Calcium imaging of EGFP-TRPV1-expressing PC12 cells. The cells were exposed to 10 µM capsaicin; bar = 10 μm. (b) Representative PC12 cells expressing high TRPV1 (left) and low TRPV1 (right) treated with 50 μM capsaicin for 30 min; bar = 20 μm. (c) Electron microscopic (eM) images of mitochondria observed in PC12 cells expressing low TRPV1 treated with the vehicle (left) or 10 μM capsaicin (right) for 60 min; bar = 0.5 μm. (d) EM images of mitochondria of PC12 cells expressing high TRPV1 treated with either of vehicle (left), 10 μM capsaicin (middle), and 50 μM capsaicin (right) for 60 min; bar = 0.5 μm. (e) EM image of mitochondria observed in a cell treated with 50 μM anandamide for 60 min; bar = 0.5 μm.
Mitochondrial swelling induced by capsaicin and anandamide.

SD: standard deviation; CI: confidence interval.
#p < .001, Dunnett’s test, versus Vehicle.
**p < .0001, Fisher’s exact test, versus Vehicle.
*p < .001, Fisher’s exact test, versus Vehicle.
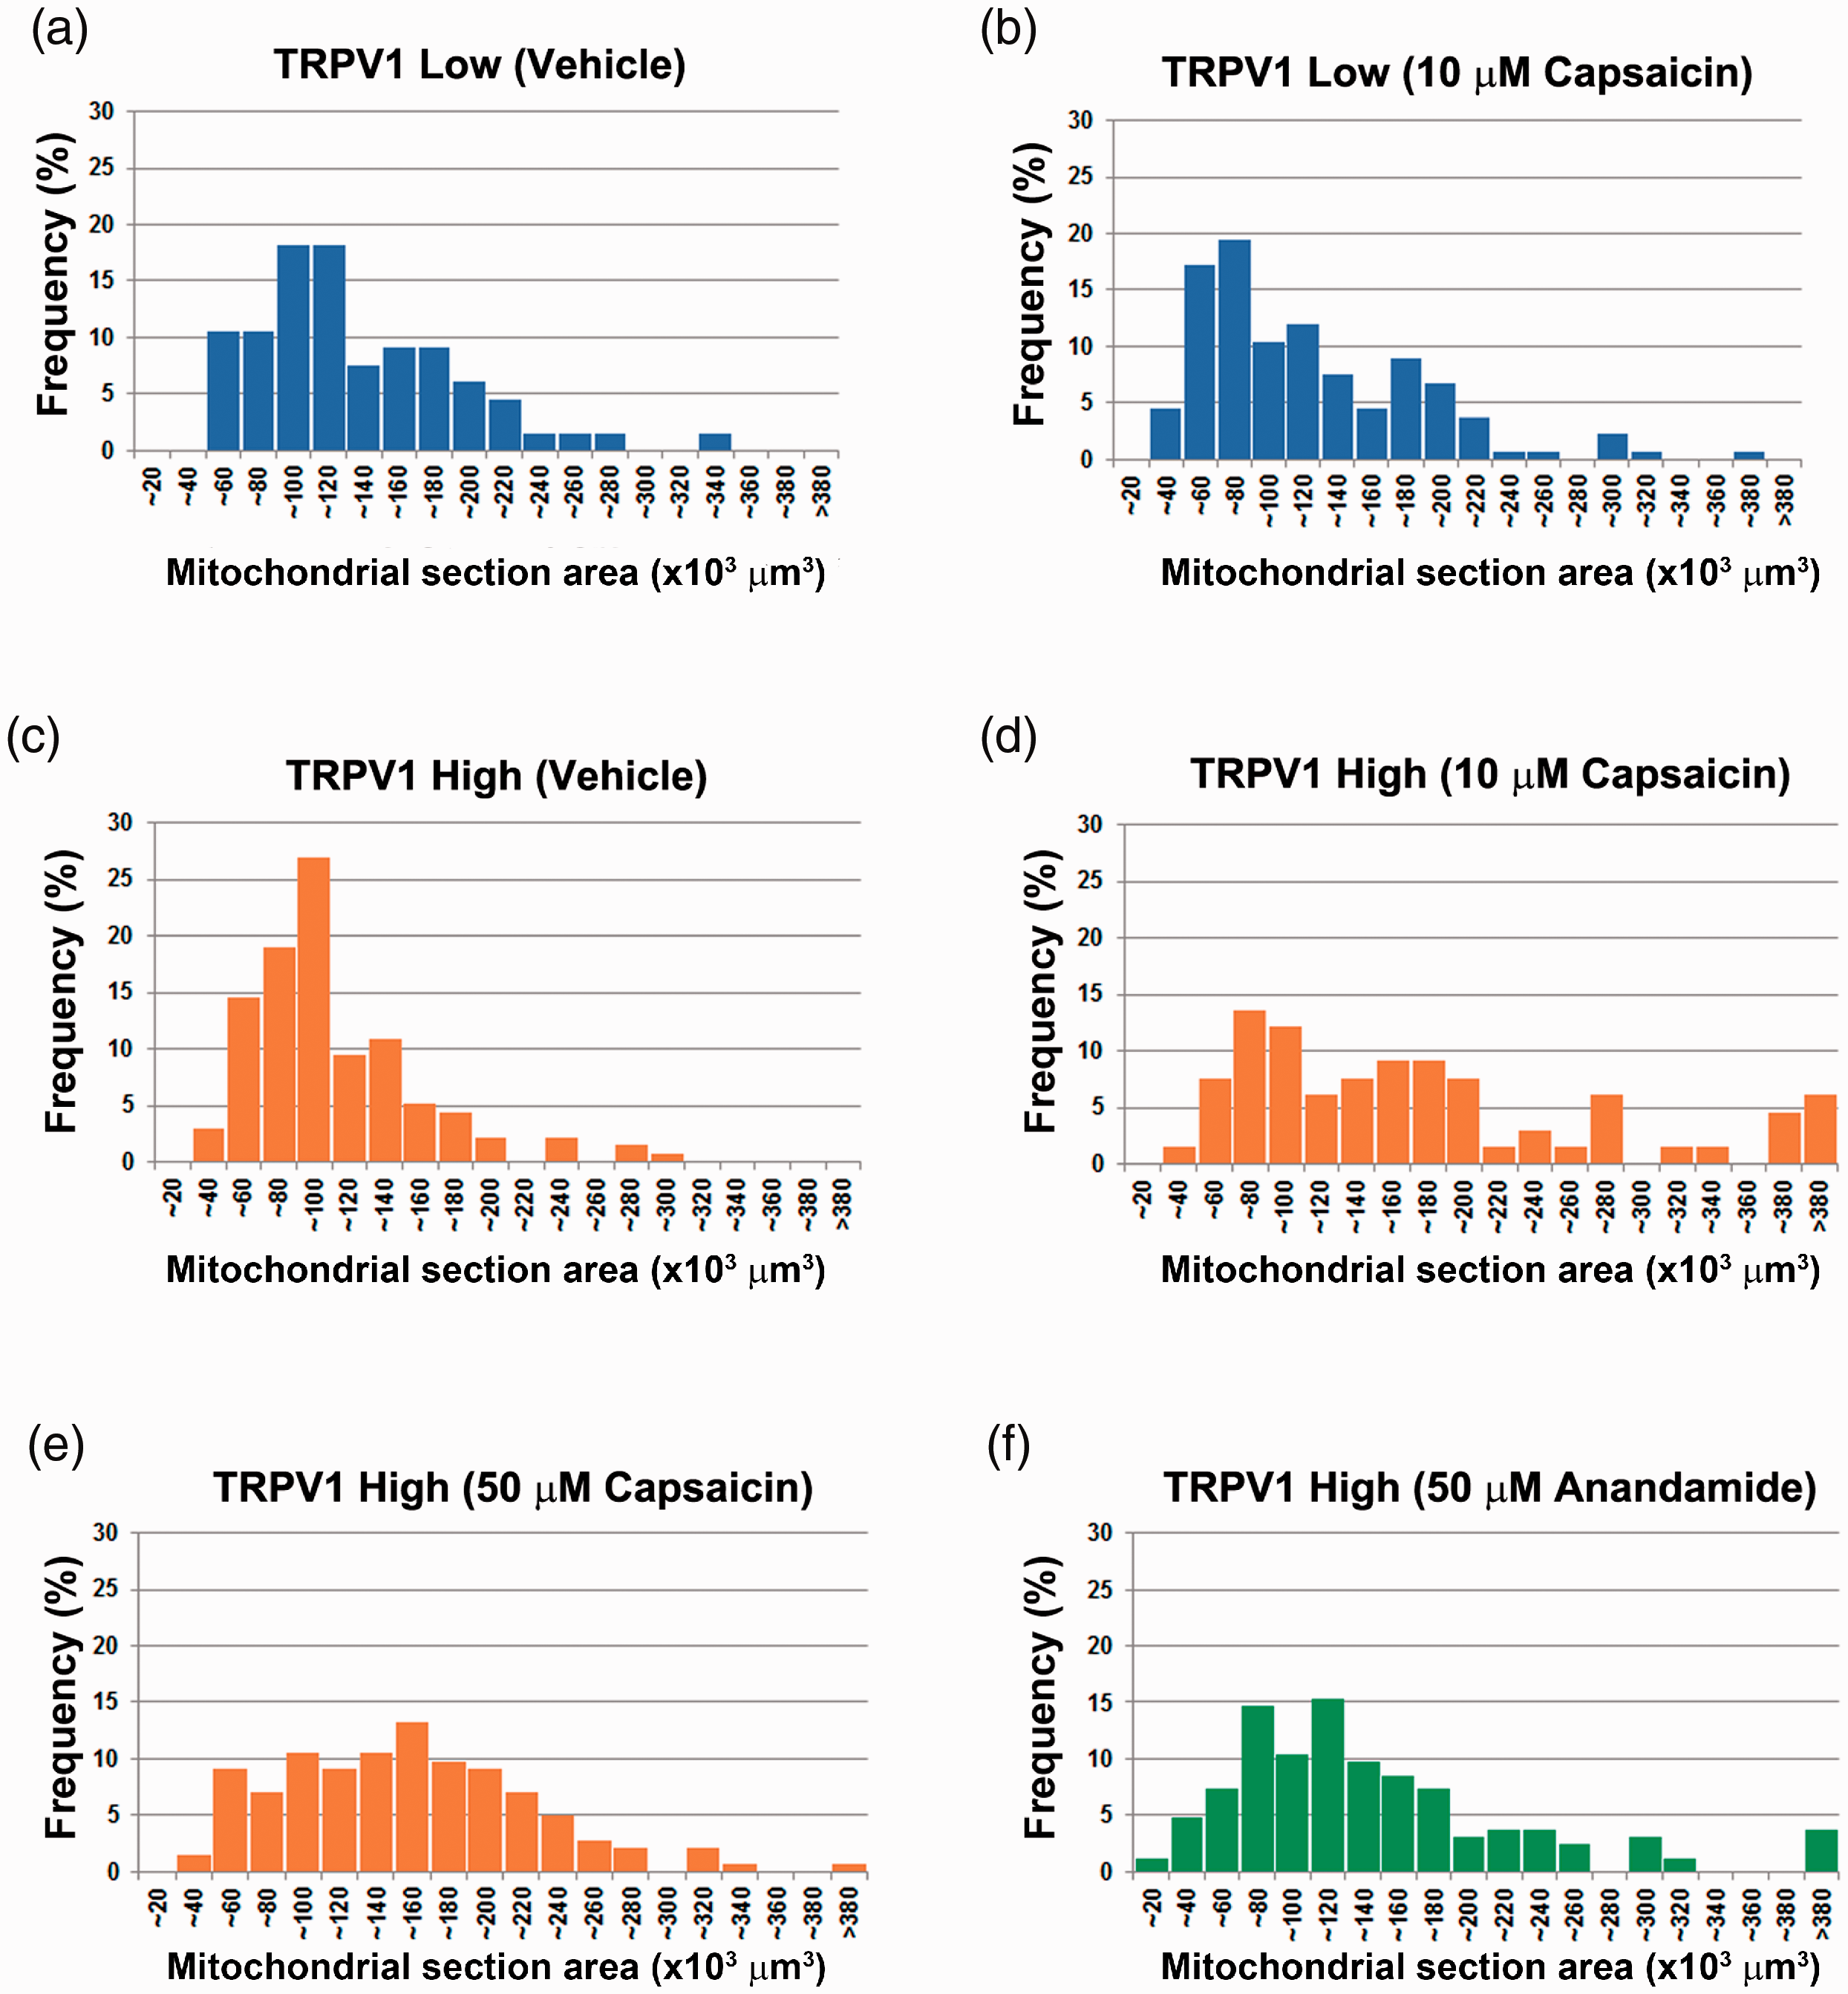
Histograms showing distribution frequency (%) of mitochondrial section areas (×10–3 µm2) in TRPV1-expressing PC12 cells subjected to TRPV1 stimulation. In each histogram, the abscissa and ordinate represent the mitochondrial section areas and distribution frequency (%), respectively.
Loss of mitochondria in cells exposed to capsaicin
Next, capsaicin-induced mitochondrial loss in TRPV1 High was examined with MitoBright Red. We deduced that mitochondrial loss would eventually occur after the mitochondrial damage. Hence, we opted for 24 h as the time point to assess the mitochondrial loss. These cells were incubated with vehicle (0.01% DMSO), 0.5, 5, or 10 µM capsaicin. Our results showed a dose-dependent decrease in the number of mitochondria (Vehicle: 28.3 ± 7.2/cell, 0.5 µM capsaicin: 19.9 ± 5.8/cell*, 5 µM capsaicin: 16.5 ± 5.4/cell*, 10 µM: 9.6 ± 3.9/cell*, *p < .001, ANOVA followed by Dunnett’s test) (Figure 5(a)). It was also observed that fluorescence intensity of mitochondrial dots was attenuated following capsaicin treatment. Exposure to 10 µM capsaicin for 24 h resulted in a significantly attenuated fluorescence intensity of mitochondrial dots (Vehicle: region of interest (ROI)1; 34.1 ± 6.5, ROI2; 35.3 ± 7.0 vs. 10 µM capsaicin: ROI1; 7.1 ± 1.0*#, ROI2; 7.0 ± 1.2*#, *p < .01 vs. Vehicle ROI1, #p < .01 vs. Vehicle ROI2, Kruskal‒Wallis test followed by Dunn’s multiple comparison test) (Figure 5(b)).

Capsaicin-induced mitochondrial loss and membrane depolarization. (a) Capsaicin-induced dose-dependent loss of mitochondria. The ordinate represents the number of mitochondrial dots identified by fluorescent mitochondrial staining. Statistical analysis was performed using one-way ANOVA followed by Dunnett’s test. (b) Representative fluorescent mitochondrial staining images of PC12 cells expressing high TRPV1 treated with either vehicle (upper) or 10 μM capsaicin (lower) for 24 h. The fluorescent images are of four consecutive confocal sections. The graph shows the signal intensities of fluorescent staining, which reflects the integrity of the mitochondrial membrane potential. Statistical analysis was performed by the Kruskal‒Wallis test followed by Dunn’s multiple comparison test. *p<.01 vs. Vehicle ROI1, #p<.01 vs. Vehicle ROI2.
Induction of mitophagy by capsaicin stimulation
We then sought to analyze the expression of microtubule-associated LC3 protein by western blot, in which the increased conversion of LC3-I to LC3-II indicated autophagy. 32 Our assessment of TRPV1 High cells subjected to capsaicin exposure for 60 min showed clear autophagy induction at 20 μM or higher concentrations (Figure 6(a)). However, autophagy was inhibited by capsazepine, a capsaicin antagonist that binds to TRPV1 (Figure 6(b)). Further, the capsaicin-induced LC3-II increase was augmented by pretreatment with bafilomycin A1, which functions to impair fusion of autophagosomes with late endosomes/lysosomes (Figure 6(b)). This finding supported the earlier report that capsaicin promoted autophagic influx rather than impairing autophagosome clearance.32,33

Induction of mitophagy by capsaicin stimulation. (a) Western blot showing LC3 expression in PC12 cells expressing high TRPV1 treated with either vehicle (control) or capsaicin at the indicated concentration for 60 min. (b) The effects of capsazepine (100 μM) and bafilomycin A1 (100 nM) on 50 μM capsaicin-induced autophagic activity. (c) The ordinate represents the percentage point of cells bearing mitophagy-affected mitochondria. The fluorescent dye-based mitophagy assay detected mitochondria-containing autophagosomes fused with lysosomes. Statistical analysis was carried out using the Kruskal–Wallis test followed by Dunn’s multiple comparison test. On the right, representative staining images of mitophagy-positive mitochondria (red) in PC12 cells expressing the EGFP-TRPV1 fusion protein treated with 10 μM capsaicin for 24 h.
We next studied whether long-term exposure to 10 µM capsaicin caused mitophagy in TRPV1 High cells using a live-cell staining assay. We observed an increasing trend in mitophagy at 6 h of treatment with 10 µM capsaicin; meanwhile, the number of mitophagy-affected mitochondria significantly increased at 24 h compared to the control cells (10.7 ± 3.5/cell vs. 2.6 ± 1.6/cell, p < .001, Kruskal–Wallis test followed by Dunn’s multiple comparison test; Figure 6(c)).
Gene expression profiles of mitochondrial proteins following capsaicin treatment
To examine the effect of capsaicin treatment on transcriptional activity of mitochondrial proteins in TRPV1 High cells, quantitative RT-PCR was performed for cytochrome c oxidase subunit IV (COX IV), Mic60/Mitofilin, and voltage-dependent anion channel 1 (VDAC1) The localizations of these proteins are shown in Figure 7(a). Our results showed a gradual increase in the transcriptional activity of COX IV following capsaicin exposure (Figure 7(b)). Significant differences were detected at 6, 24, and 72 h when compared with the control (p < .01, ANOVA followed by Dunnett’s test). Further, the level of Mic60/Mitofilin mRNA was significantly higher at 72 h of capsaicin treatment than the control cells (p < .01, ANOVA followed by Dunnett’s test). Alternatively, the transcriptional activity of VDAC1 increased at 24 and 72 h of capsaicin treatment as compared to the control cells (p < .01, ANOVA followed by Dunnett’s test). However, the membrane expression of TRPV1 did not significantly change throughout the experimental duration (Figure 7(c)).
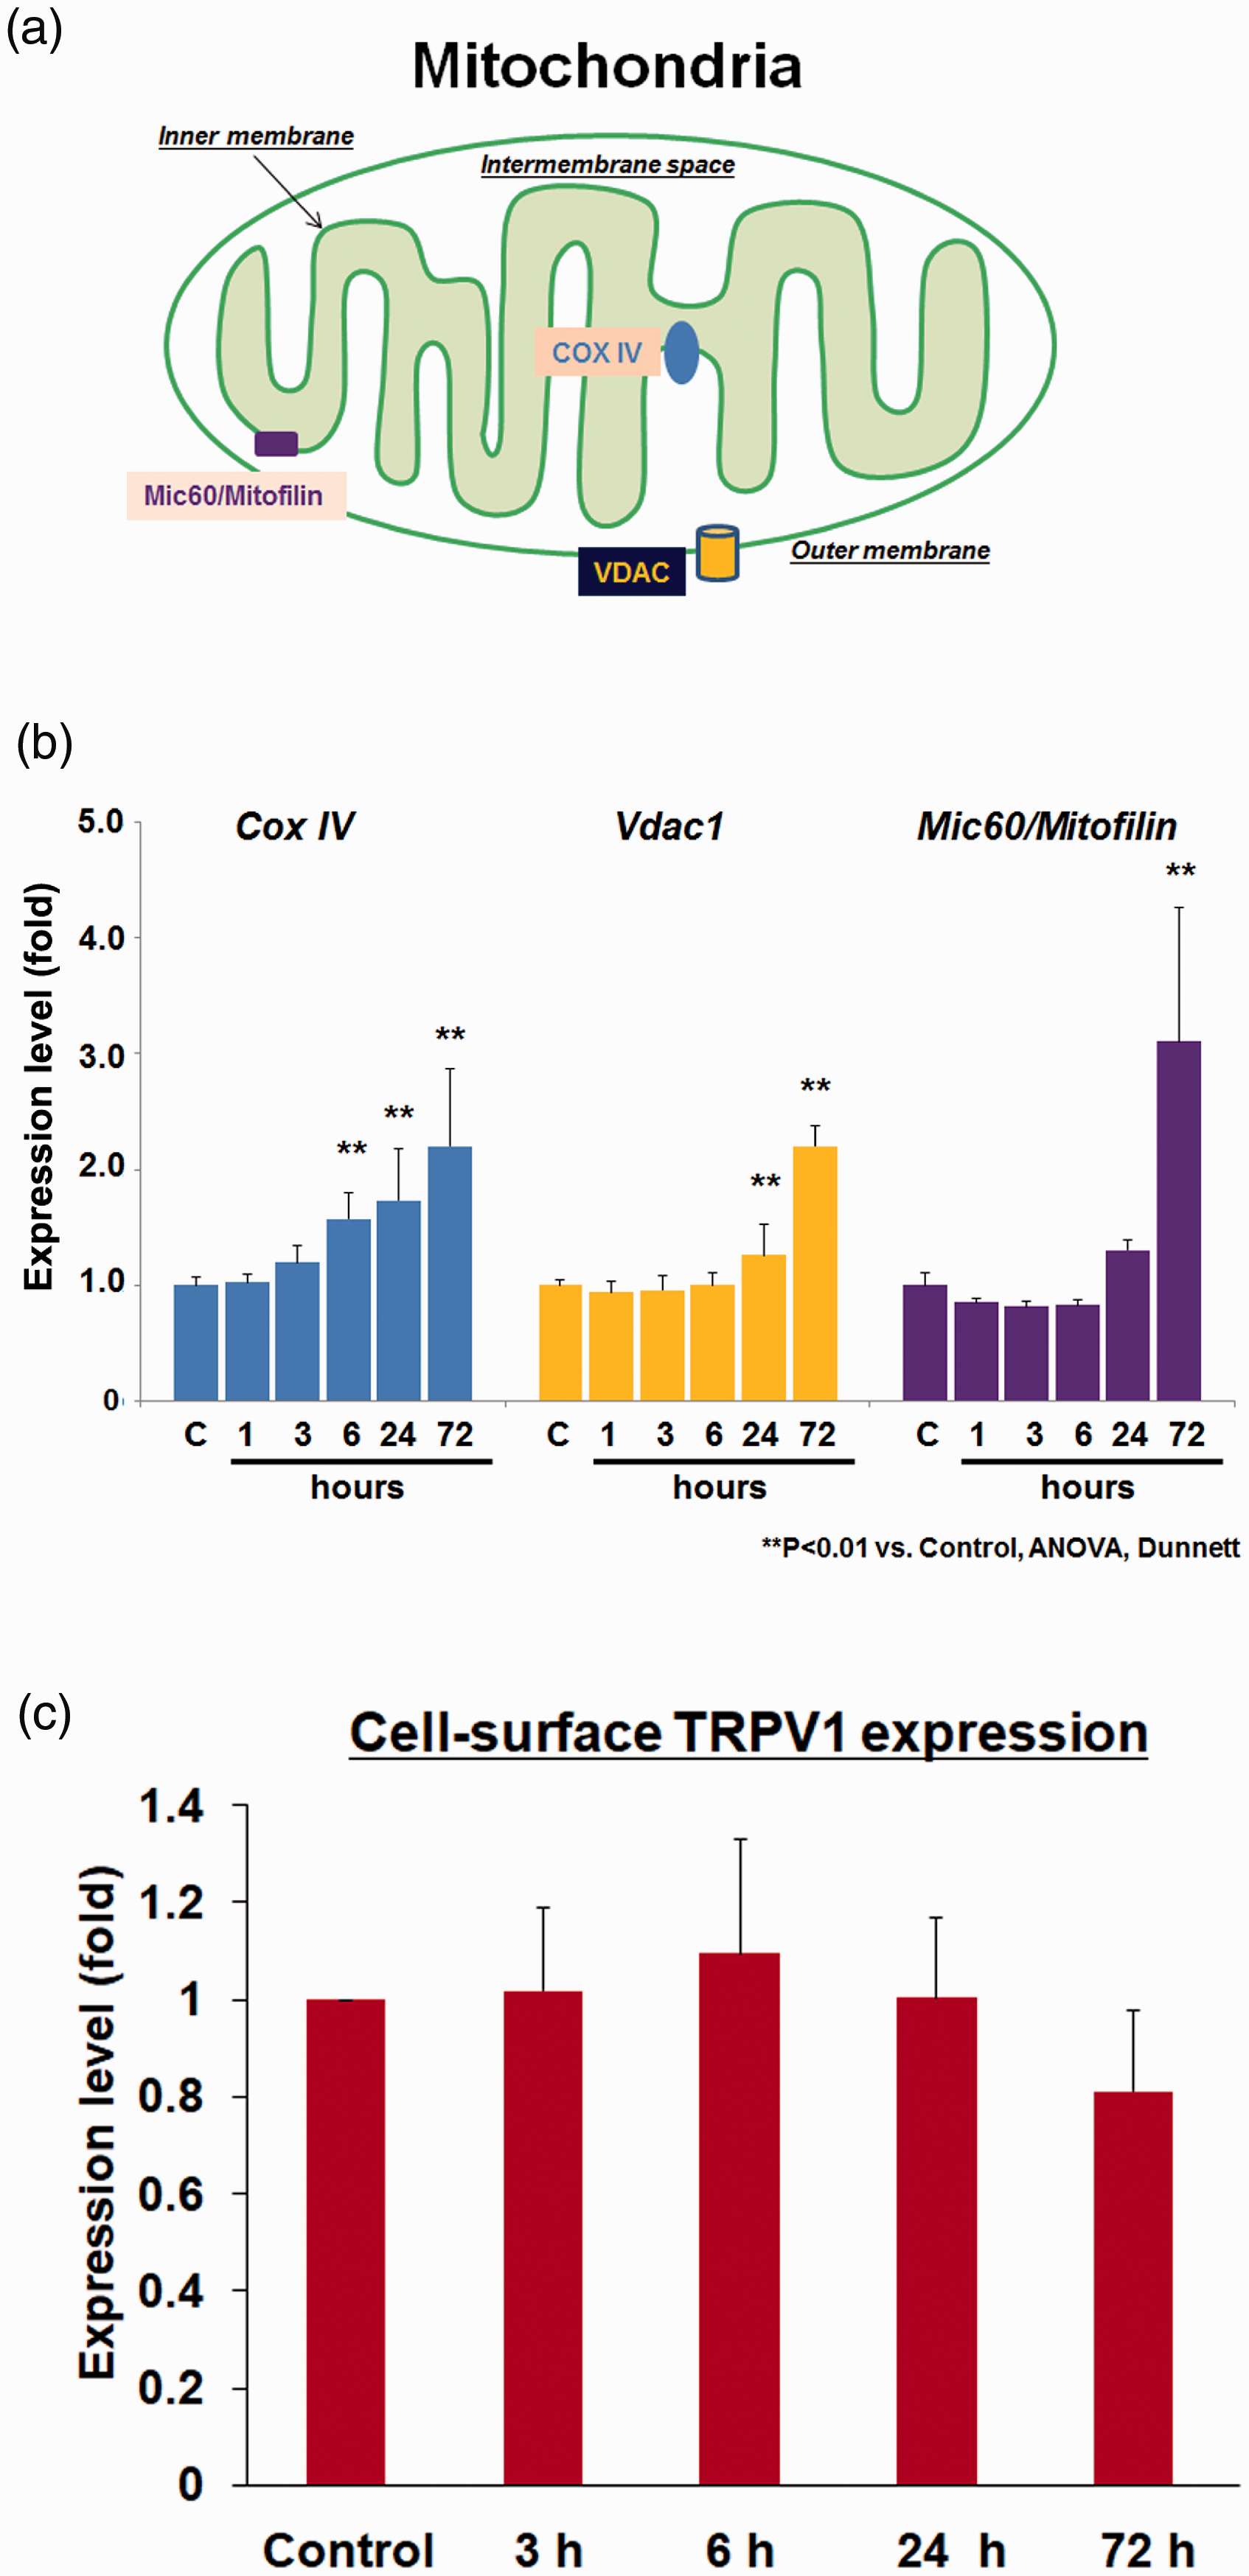
Capsaicin-induced transcriptional upregulation of mitochondrial proteins in TRPV1 High. (a) Schematic representation depicting the distributions of the mitochondria-resident proteins, COX IV, VDAC1, and Mic60/Mitofilin. Capsaicin treatment was performed for the durations indicated in the abscissa. The graphs show the transcriptional expression of these mitochondria-resident proteins. In each graph, the ordinate represents relative gene expression (fold change). Statistical analysis was performed using one-way ANOVA and Dunnett’s test. (b) Cell-surface TRPV1 protein expression. The TRPV1 expression levels were normalized with the expression of Na+/K+-ATPase protein. C: control.
Discussion
Our in vivo study demonstrated that repetitive moderate capsaicin exposure to the facial skin of mice induces mitochondrial toxicity in small-sized TG neurons. Moreover, a normalization of mitochondrial damage was observed between Day 4 and Day 6. The same capsaicin treatment resulted in the development of TRPV1 dysfunction in the face, which also exhibited a recovery trend between Day 4 and Day 6. These observations imply that TG neurons are resilient to capsaicin-induced mitochondrial toxicity. Further, our in vitro data show that capsaicin induces dose-dependent damage to mitochondria in TRPV1-expressing PC12 cells. For instance, capsaicin caused severe mitochondrial swelling without destroying mitochondrial internal architecture at 10 µM. Alternatively, treatment with 50 μM capsaicin led to cristolysis with less pronounced mitochondrial swelling. Concomitantly, morphological alterations of cells, such as rounding and detachment from the culture dish surface accompanied by an augmented autophagic response, were observed. Although a previous study showed that anandamide caused mitochondrial damage in TG neurons in vivo, 19 our results suggested that capsaicin is more toxic to mitochondria than anandamide. Moreover, prolonged treatment with capsaicin was shown to induce dose-dependent loss of mitochondria, mitochondrial membrane depolarization, and mitophagy. Simultaneously, we observed the initiation of mitochondrial regeneration by upregulated transcriptional expression of mitochondria-resident proteins. Based on our study, we postulate that mitophagy and mitochondrial regeneration may play an important role in the repair mechanism of capsaicin-induced mitochondrial damage (Figure 8).
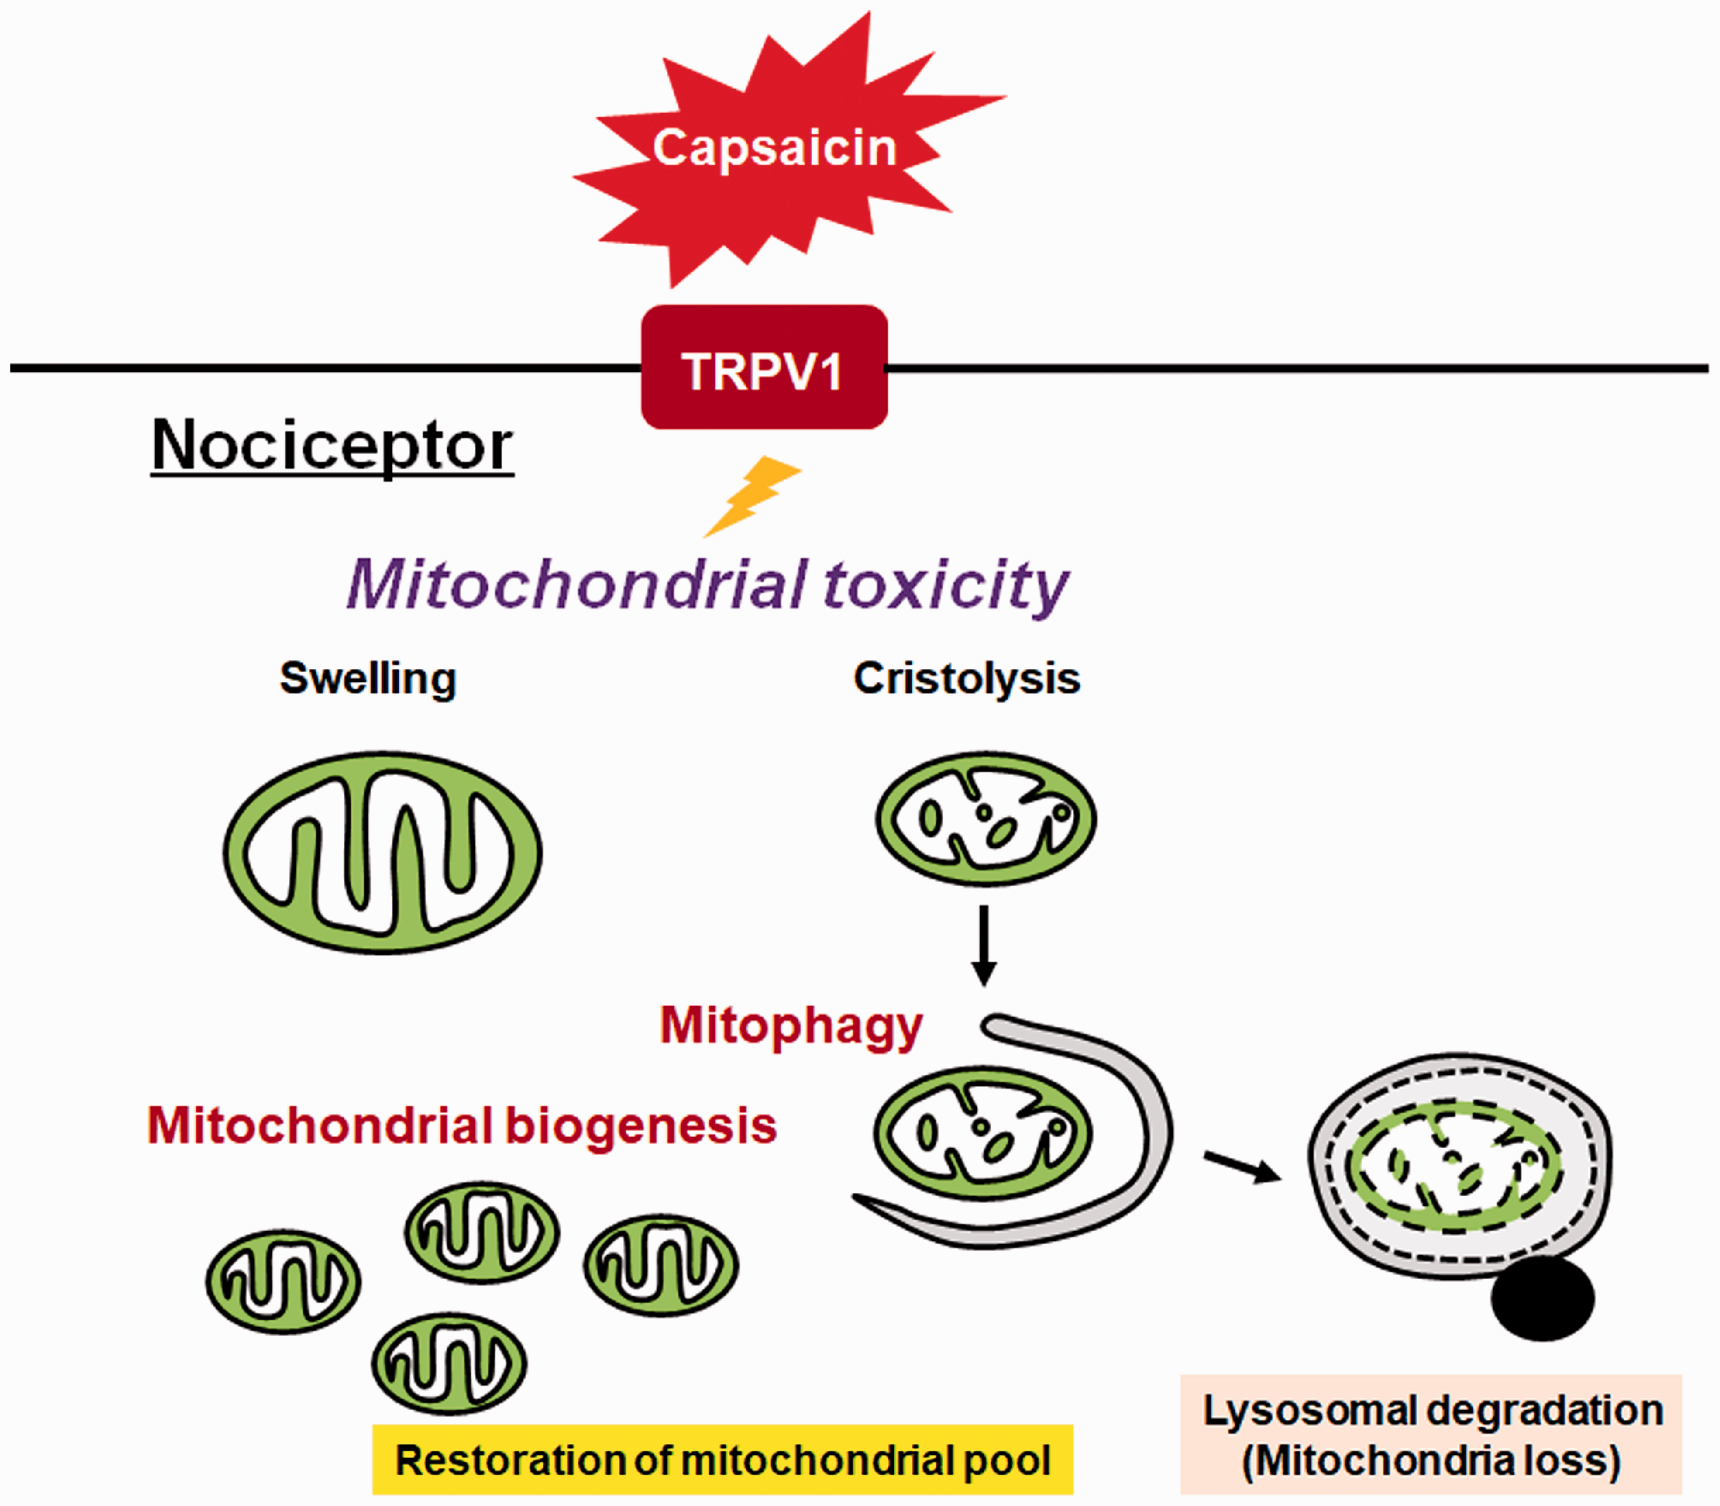
Schematic representation depicting the cellular self-defense mechanism against capsaicin-induced mitochondrial injury. TRPV1 stimulation with capsaicin can lead to various levels of mitochondrial toxicity. In case capsaicin causes severe mitochondrial damage, such as cristolysis, mitophagy is driven to eliminate destructed mitochondria. This process contributes not only to prevention of oxidative stress and release of apoptogenic molecules but also to loss of mitochondria. In parallel, mitochondrial biogenesis replenish the mitochondrial pool, thus normalizing the status of mitochondrial function in the cell.
Capsaicin-induced desensitization is utilized by pain-relieving modalities; for instance, Qutenza® patch is applied to manage the intractable neuropathic pain.9,10 Moreover, a previous study demonstrated that intranasal injection of civamide, a cis isomer of capsaicin, at doses of 20 and 150 µg ameliorated migraine attacks in 55.6% of cases. 34 Potential mechanisms underlying capsaicin-induced antinociception include TRPV1 receptor desensitization through posttranslational modifications,11,12 downregulation of its cell-surface expression,13,35 and nociceptor degeneration.14,15 In rodents, systemic administration of high dose of capsaicin causes long-lasting mitochondrial damage in TG and DRG neurons.16–18,36,37 Accumulated evidence shows that capsaicin-induced mitochondrial damage is mediated by mitochondrial calcium overload and/or reactive oxygen species production.15,38–41 Consistent with the previous reports, the morphological features of damaged mitochondria in our study were characterized by swelling and cristolysis, predominantly in the small dark neurons (B-type neurons). TRPV1 is primarily expressed in small TG neurons23,42,43 and was confirmed by our immunohistochemical results (inset, Figure 1(c)). As stated above, the dose of capsaicin used in our in vivo experiment affects nocifensive behavior,3,22,23 somatosensory thalamocortical activation, 24 and extracellular signal-regulated kinase phosphorylation 25 in the trigeminal system. Since we carried out an intermittent topical application every 24 h, the less stringent experimental conditions likely accounted for the mild observed phenotype in mitochondrial damage characterized by its transient nature. It should be noted that despite the absence of discernible mitochondrial damage, the capsaicin-induced trigeminal sensitivity to noxious stimulation was not completely normalized at Day 6 (Figure 2). This implies that mitochondrial damage is not the only cause of the TRPV1-mediated trigeminal dysfunction.
Western blot analysis of LC3 revealed that autophagy induction was accompanied by severe mitochondrial damage, thereby suggesting a plausible link between mitochondrial damage and autophagy induction. LC3 processing is an early event associated with autophagy induction. 32 Furthermore, our cell-based assay using a mitophagy-specific fluorescent dye demonstrated that prolonged exposure to moderate concentrations of capsaicin was capable of inducing mitophagy, mitochondrial loss, and mitochondrial membrane depolarization. Our fluorescent dye-based mitophagy assay revealed that the fusion of damaged mitochondria with lysosomes increased between 6 h and 24 h following capsaicin treatment (Figure 6(c)). Based on this observation, we opine that mitophagy might be induced to remove damaged mitochondria as a part of the restorative mechanism.
COX IV, a subunit of the complex enzyme essential for aerobic energy generation through ATP formation, is located on the inner mitochondrial membrane. 44 The VDAC1, expressed in the mitochondrial outer membrane, regulates the transport of Ca2+ and cholesterol under physiological conditions and contributes to cytochrome c release during the apoptotic process. 45 The mitochondrial contact site and cristae organizing system (MICOS) complex plays pivotal roles in mitochondrial inner membrane organization, mitochondrial membrane contacts, and cristae structure maintenance.46,47 The Mic60/Mitofilin, an inner mitochondrial membrane protein with its part jutting into the intermembrane space, is a key component of the MICOS complex.48,49 Our results showed that the treatment with 10 µM capsaicin activated the transcriptional activity of these mitochondria-resident proteins, which may reflect increased mitochondrial biogenesis; however, these findings need further validation. It has been demonstrated that COX IV and VDAC1 can be upregulated by a variety of pathological stimuli, such as chemical hypoxia 50 and calorie restriction. 51 On the other hand, the transcriptional activity of Mic60/Mitofilin is highly susceptible to cytotoxic insults, such as oxidative stress 52 and exposure to exogenous dopamine. 53 Our observation that all these proteins were transcriptionally upregulated supports the possibility of mitochondrial biogenesis over an adaptive reaction to cytotoxicity. However, the differential temporal patterns of the transcriptional upregulation remained intriguing. We hypothesize that the early transcriptional upregulation of COX IV could be a metabolic attempt to increase ATP synthesis. Moreover, the later increase in Mic60/Mitofilin transcription could be relevant to the restructuring of mitochondrial cristae. Besides, it is notable that the upregulated transcriptional activity continued during TRPV1 activation in our study. Our results from western blot demonstrated that there was no temporal change in cell-surface TRPV1 expression level. It should be noted that TRPV1 activity is determined not only by its cell-surface expression level but also by the status of receptor modifications, such as phosphorylation/dephosphorylation, SUMOylation, and interaction with adaptor proteins.11,13,49,54–57 However, this study did not explore the TRPV1 modifications, and the same should be deciphered in future studies.
Though our study presents several novel findings, there are also certain limitations that should be noted. First, the concentrations of capsaicin required to induce mitochondrial toxicity differed between our in vitro and in vivo studies. Since direct exogenous addition to culture media and topical facial application account for completely distinct experimental models, most notably due to the tissue penetration of capsaicin in the latter model, we employed unique methods to determine the appropriate concentrations. Titration methods were used to determine the concentrations of capsaicin (10 µM and 50 µM) to accurately assess mitochondrial toxicity in vitro. These concentrations of capsaicin are comparable to those present in hot sauce products 27 . On the other hand, in vivo administration was adopted based on previous reports including ours.3,22–25 Second, our study provides transcriptional data of only three mitochondrial proteins as evidence for mitochondrial biogenesis, whereas more complex processes are involved in mitochondrial biogenesis besides mitochondrial protein synthesis. 58 Third, in the facial capsaicin stimulation study, we could not explain how mitochondrial damage evolved within the primary sensory neurons. We did not perform EM analysis of the trigeminal terminals where robust mitochondrial morphological changes were anticipated. The possibility that mitochondria were damaged by TRPV1 stimulation with capsaicin primarily at the nerve terminals and then transported to the cell bodies cannot be ruled out. This may account for the delayed appearance of damaged mitochondria. Our cell-based experiments were unable to provide relevant information in this regard. Further, the role of mitophagy in clearing damaged mitochondria from TG neurons remained ambiguous. It is, therefore, imperative to identify a selective molecule to implicate the mitophagic mechanism relevant to capsaicin-induced injury, as nonselective inhibition of autophagy (Atg5 knockout, etc.) is expected to disturb neuronal homeostasis.
In summary, the present study provides valuable novel information regarding dose dependency of capsaicin-mediated mitochondrial toxicity, the involvement of autophagy in the removal of damaged mitochondria following capsaicin toxicity, and resilience of mitochondria in TG neurons exposed to moderate capsaicin treatment. Mitochondria play pivotal roles in energy generation as well as cell demise. In this sense, it is particularly important to understand the mechanism by which sensory neurons execute the quality control of mitochondria, when exposed to capsaicin. This may provide an important clue to the development of neuroprotective therapy against TRPV1-related pain disorder.
Footnotes
Author Contributions
MS conceived the research, designed and performed the experiments, and wrote the manuscript. YK, TT, and KI performed the experiments and edited the manuscript. TT, MY, NS, and JN edited the manuscript. MS was involved in the coordination of contributors. All authors read and approved the final manuscript.
Acknowledgments
The authors thank Dr Hitoshi Sato at Department of Oral Surgery, Showa University Graduate School of Dentistry, and Mr Toshihiro Nagai at Electron Microscopy Center, Keio University School of Medicine, for their technical assistance and insightful discussion.
Declaration of Conflicting Interests
The author(s) declared no potential conflicts of interest with respect to the research, authorship, and/or publication of this article.
Funding
The author(s) disclosed receipt of the following financial support for the research, authorship, and/or publication of this article: This study was supported by JSPS KAKENHI (grant numbers 26460706 and 19K07849 to MS), the Takeda Science Foundation to MS, research grants from Pfizer Inc. (grant number WS1878886), and Nippon Zoki Pharmaceutical Co., Ltd. to NS.