
Abstract
Background
Surgery is often accompanied by scar formation, which results in a pathological state called fibrosis. Fibrosis is characterized by the excess deposition of extracellular matrix molecules in the connective tissue, leading to tissue contracture and chronic pain. To understand the molecular mechanisms underlying these processes and their causative relationships, we performed comprehensive analyses of gene expression changes in the hind paw tissue of a mouse model established by generating a scar in the sole.
Results
Subcutaneous tissue was extensively stripped from the sole of the operation group mice, while a needle was inserted in the sole of the sham group mice. Pain threshold, as evaluated by mechanical stimulation with von Frey fiber, decreased rapidly in the operated (ipsilateral) paw and a day later in the nonoperated (contralateral) paw. The reductions were maintained for more than three weeks, suggesting that chronic pain spread to the other tissues via the central nervous system. RNA from the paw and the dorsal root ganglion (L3–L5) tissues were subjected to microarray analyses one and two weeks following the operation. The expressions of a number of genes, especially those coding for extracellular matrix molecules and peripheral perceptive nerve receptors, were altered in the operation group mice paw tissues. The expression of few genes was altered in the dorsal root ganglion tissues; distinct upregulation of some nociceptive genes such as cholecystokinin B receptor was observed. Results of real-time polymerase chain reaction and immune and histochemical staining of some of the gene products confirmed the results of the microarray analysis.
Conclusion
Analyses using a novel mouse model revealed the extensive involvement of extracellular matrix-related genes and peripheral perceptive nerve receptor genes resulting in scar formation with chronic pain. Future bioinformatics analyses will explore the association between these relationships.
Introduction
Epidemiological surveys indicate that most patients suffer from chronic pain, mainly in the lower back, shoulder, and lower extremities. 1 Several etiologies underlie the development and continuation of these chronic pain conditions and surgery (operative intervention) chronic postoperative pain (CPOP) is one of most common complications of surgery. According to previous reports, the incidence of CPOP is anywhere between 5% and 85%, and this kind of chronic pain strongly diminishes the patient’s activities of daily life and quality of life. 2 Currently, however, there is no effective cure, reflecting the poor understanding of the pathology of the symptoms. 3
Surgery in muscles, fingers, shoulders, elbow joints, and peripheral tissues often results in scar formation.4,5 In this process, a reparative or reactive accumulation of fibrous connective tissue results in the pathological accumulation of extracellular matrix (ECM) proteins. The accumulation is termed fibrosis. 6 A case study highlighted the persistence of fibrosis in the muscle of operated lumbar vertebra (25 years in the cited case). 7 We have observed that in surgery involving locomotive tissues such as fingers, shoulders, and elbows, the occurrence of postoperative scar constraint is often associated with motion pain. Therefore, we hypothesized that postoperative fibrosis can obliterate the architecture and function of the underlying organ and the regeneration of nervous and circulatory systems in them, 8 which contributes to the pathogenesis of chronic pain.
In normal tissues, fibrous connective tissue is defined on a tissue-dependent basis by the characteristic tissue architecture and functions. The tissue consists of a variety of ECM proteins that are characteristically different depending on the tissue type and function. Fibrosis, in a reactive, benign, or pathological state of connective tissue, 6 is described as the process of excess deposition of fibrous connective tissue components 9 and results in scarring and thickening of the affected tissue accompanied by tissue contracture, which interferes with normal organ function. 8 Therefore, it is important to define the pathological accumulation of ECM proteins at the molecular and gene expression levels to understand the mechanisms underlying the pathogenesis of chronic pain in fibrotic tissues and explore potential cures.
Painful scar tissue formations in patients involve neuropeptide-containing nerve fibers. Similarly, regenerated nerve fibers in postoperative scars were reported to be positive for calcitonin gene-related peptide (Cgrp) and substance P in rats. 10 These observations suggest that scar formation and accumulation of neuropeptide-containing nerve fibers are parts of the mechanism of chronic pain. 11
We previously developed a rat model of chronic pain and scarring by stripping the subcutaneous tissue of the plantar in the hind paw, which caused hypersensitivity to mechanical stimuli that persisted for over 12 weeks. 12 Histologically, the dermis and the epidermis were thickened and contained a large number of collagen fibers with migrating cells having round- or oval-shaped nuclei. In addition, the boundary between the dermis and the subcutaneous area was less defined. In this study, we used the mouse as the animal model of postsurgical scarring because many gene knockout mice models have already been established. The model was used to assess the gene expression changes during injury and scar formation from multidisciplinary viewpoints, which we believe might be important to understand “pain.” In particular, comprehensive microarray analyses of genes involved in the ECM and pain-associated molecules were performed.
Materials and methods
Mouse model
Ten-week-old male C57BL/6NCrSlc (C57b) mice were purchased from Japan SLC Co. (Shizuoka, Japan). The mice were given water and food ad libitum and were housed in conditions of constant temperature (23°C ± 1°C) and humidity (50% ± 15%) with a 12-h light and dark cycle. Experimental procedures were approved by the Experimental Animal Committee of Aichi Medical University.
Surgical operation
The surgical operation closely followed the protocol previously described. 12 The sole of the left hind paw of mice was punctured using a 19 G needle, followed by insertion of a steel rod through the hole to reach the toe. The subcutaneous tissue of the entire left sole was stripped to generate an adhesive scar (operation group, n = 7). The sole of the left hind paw of mice was punctured without stripping any subcutaneous tissue to generate the control (sham group, n = 7). In all mice, the right hind paw was not altered. An outline of this procedure is depicted in Figure 1.
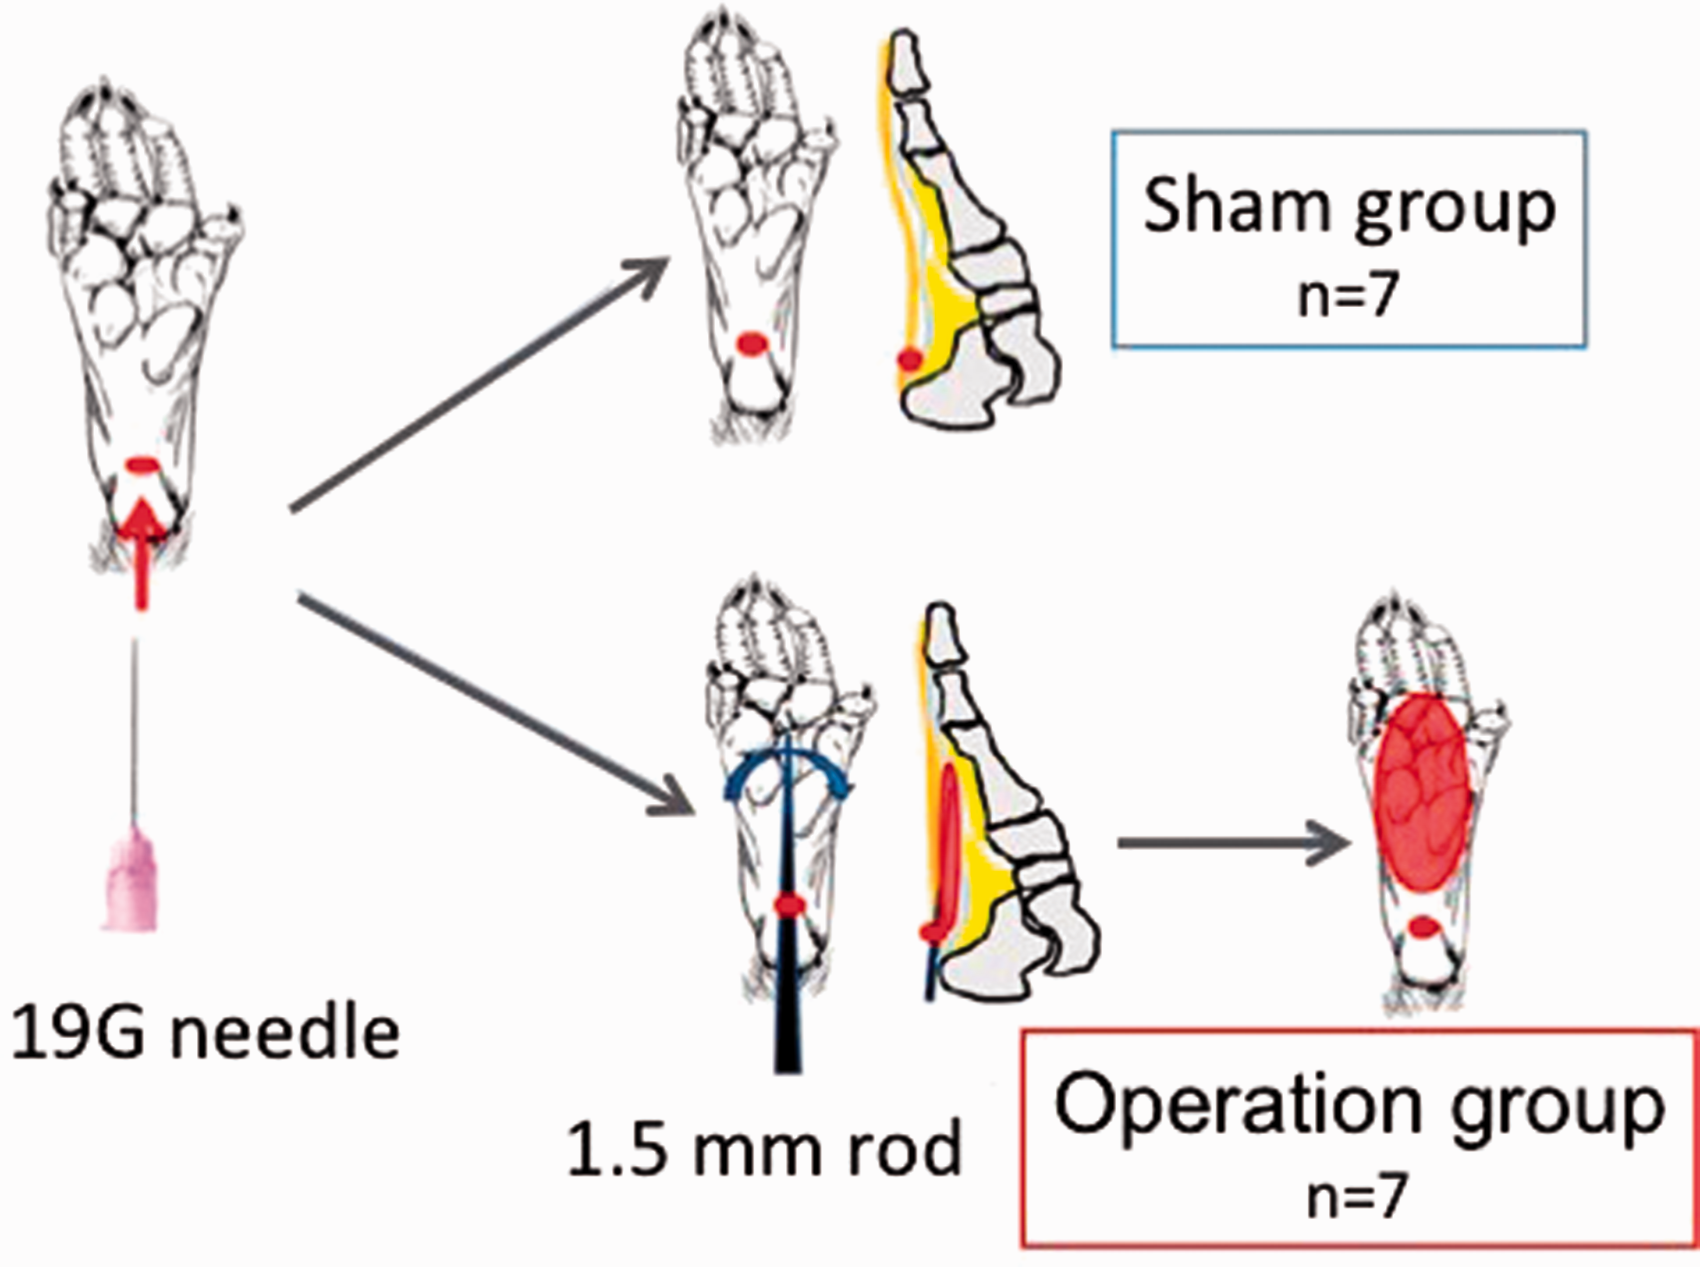
Surgery protocol. Mice were divided into two groups (n = 7 each). In the operation group mice, a pinhole was made in the sole of the left hind paw using a 19G needle and the subcutaneous tissue was stripped through the hole using a steel rod (Φ = 3 mm). In the sham group mice, the pinhole was made in the left heel using a 19G needle. In all mice, the right hind paw was not manipulated.
Measurement of changes in body weight and appearance
Body weight changes were measured to ensure that the surgery had no significant effect on the general health of the mice. The visual appearance of the body, such as the condition of the fur, was examined at the same time for the same purpose. All mice were weighed one and two days before the operation, and 2 h; one, two, and three days; and once a week until 10 weeks after the operation. No significant statistical differences in body weight were observed between the operation and sham group mice. We examined the body appearances at the same time but only in a descriptive manner.
Measurement of hind paw response to mechanical stimuli
Hind paw pain was evaluated by measuring the threshold of mechanical stimuli that induced withdrawal of hind limbs as previously described.12,13 This method has been frequently implemented and is known as the “up-down method.”
14
Mice were allowed to acclimatize on the metal mesh for at least 15 min prior to testing. If necessary, they were gently stroked with a writing brush as a calming action. Mechanical stimuli were then applied to the proximal end of the toes of hind paws using von Frey filaments (0.008, 0.4, 0.6, 1, 1.35, 2, 2.12, 3.14, 4, 5.25, and 8.19 g; Bioseb-In Vivo Research Instruments, Vitrolles, France) from beneath the metal mesh; the lowest stimulus strength was used first and the strength was gradually increased. Enough force was applied in each case to generate a slight bend in the filament. When a filament was able to consecutively induce foot withdrawal or rapid kicking twice, its strength was recorded as the threshold of mechanical stimulus. The test was performed between 10:00 and 13:00 h one and two days before the operation and 2 h, one day, two days, three days, and once a week until 10 weeks after the operation. At each time point, the body weight of each mouse was measured,
14
and any visible difference in body appearance was recorded. Recently, a new mechanosensitivity testing method, termed the simplified up-down (SUDO) method,
15
is being used commonly. In this method, the values of the von Frey filaments are supposed to represent the number of the filament within a complete set of 20 von Frey filaments that span a range of force from 0.008 g to 300 g (Stoelting, Dale Wood, IL, USA). In the original mouse tests, filaments 2 to 9 were used. The test always starts with filament 5 for mice, and the sequence progresses following an up-down sequence where a positive response to a particular filament indicates that the next lower value filament be used in the subsequent test, while a negative response indicates the next higher value filament be used, as in the old method.
14
The test is stopped if a positive response to the lowest possible filament or a negative response to the highest possible filament is observed. For the SUDO method, the paw withdrawal threshold (PWT) estimate was calculated by taking the value of the fifth filament used in each test and adding an adjustment value of ±0.5 stimulus intervals. The adjustment factor was positive if there was no response to the fifth filament of the sequence to generate a PWT slightly higher than the fifth filament value or negative if there was a withdrawal to generate a PWT slightly lower than the fifth filament value. In some cases, the PWT was converted from filament number to force and was expressed in grams using equation (1)


Statistical analyses
Statistical analysis of the difference of PWTs within the groups was performed by the nonparametric Freedman’s test. When the intergroup difference was determined to be significant, post hoc tests were conducted. The difference of PWTs between the operation and sham groups was determined by the Mann–Whitney test.
Tissue sampling for microarray analysis
Mice were euthanized with an overdose of isoflurane anesthesia (Forane; Abbott, Tokyo, Japan). The dorsal skin was incised, the muscles surrounding the spine were removed, and the spine was opened with Luer Bone Rongeurs. The dorsal root ganglion (DRG, L2–L5) was promptly excised under a microscope, immediately frozen in liquid nitrogen, and stored at −80°C until use. The scar tissues of the operated left hind paw were also excised, frozen, and preserved in the same manner. Frozen DRG and scar tissues were ground using the Beads Clasher µT-12 (Taitec, Saitama, Japan). The powders were mixed with 1 ml TRIzol (Invitrogen, Carlsbad, CA, USA) to isolate total RNA in separate 1.5 ml microcentrifuge tubes and homogenized using a hand homogenizer. Total RNA was isolated following the manufacturer’s instruction and quantified using the NanoDrop ND-1000 spectrophotometer (Thermo Fisher Scientific, Waltham, MA, USA). All the samples contained >120 ng/µl RNA for the DRG samples and >250 ng/µl for the hind paw tissue samples. RNA purity was evaluated by the ratio of the optical density at 260/280 nm and 260/230 nm, which were >1.8 and >1.9, respectively, for all samples. The values completely satisfied the conditions required for the microarray analysis of gene expression. In certain samples, changes in gene expression were further confirmed by quantitative real-time polymerase chain reaction (PCR) as described below.
Microarray analysis
Microarray analysis was performed by Oncomics Co. (Hangzhou, Japan) using RNA samples from the hind paw and DRG tissues collected from both operation and sham group mice one and two weeks after the operation (Ope-1w, Ope-2w, Sham-1w, and Sham-2w, respectively, for both hind paw and DRG tissues; a total of eight samples were analyzed). The purity and integrity of the samples were first checked using a model 2100 Bioanalyzer (Agilent Technologies, Tokyo, Japan). The complementary DNA (cDNA) was prepared from 100 ng of total RNA using the Low Input Quick Amp Labeling kit and the One Color and RNA Spike-in kit (Agilent Technologies) in which the poly dT primer was conjugated to a T7 promoter. The cDNA was then amplified with T7 RNA polymerase to generate Cy3-labeled RNA, which was purified using the RNeasy mini kit (Qiagen, Germantown, MD, USA) and used as the probe. The SurePrint G3 Mouse GE microarray kit 8 × 60k (Agilent Technologies), which contains approximately 50,000 sequences derived from roughly 25,000 genes, was hybridized with the RNA probes, and the results were analyzed using GeneSpring GX analyzing software (Agilent Technologies). The microarray slide was washed and scanned using a DNA microarray scanner (Agilent Technologies). The scanned data were quantified using the Feature Extraction software (version 11.0.1.1, Agilent Technologies), and the signal intensities were considered to be raw values. Significant gene expression was defined as a raw signal intensity value >50; genes with signal intensities <50 were generally excluded from the analysis, with some exceptions where the gene expressions increased significantly in tissue samples collected after the operation. Signal intensities were normalized as previously described, 16 along with the background signals. The normalized data in samples of the sham and operation groups were compared at the same time points (one and two weeks). The comparison of expression levels among the four different samples (Ope-1w, Ope-2w, Sham-1w, and Sham-2w) was validated after normalizing the expression level of the representative constitutive gene, glyceraldehyde-3-phosphate dehydrogenase (GAPDH), in each sample (Table 1). Upregulated and downregulated genes were defined as an increase of >2-fold (or 1.5-fold in some cases) and a decrease of <0.5-fold in the operation samples as compared with the sham samples, respectively, although some exceptions were considered when the changes in values were not so high but significant in some tissues and genes (e.g., <0.66 or <0.75).
Real-time PCR
Forty-nine genes that displayed a significant change in their expression levels according to the microarray assay, especially those associated with the ECM and pain, were further analyzed by real-time PCR. The primers for real-time PCR were purchased from Takara Bio (Shiga, Japan). Primer sequences used are shown in Supplemental Materials, Table S1. The remaining portions of total RNA (2 µg) were used to generate cDNA with the High-Capacity cDNA Reverse Transcription kit (Applied Biosystems, Tokyo, Japan). The real-time PCR assay was carried out using SYBR Premix Ex Tag II (Takara Bio) using an ABI Prism 7000 apparatus (Applied Biosystems). The cycling conditions were as follows: denaturation at 95°C for 30 s, 40 cycles of denaturation at 95°C for 5 s, annealing and elongation at 55°C for 30 s, and a final extension at 72°C for 34 s. The mean expression level values determined by comparison to the GAPDH expression level were obtained from three independent PCR runs for each RNA sample (n = 3). The relative expression levels were compared with the expression level of the RNA collected from Sham-1w being designated as 1.
Preparation of tissues for histological survey and immunohistological analysis
One and two weeks after the surgery, three mice from both operation and sham groups were euthanized with an overdose of isoflurane anesthesia. The left hind paw entire tissues including bones, skin, and tendon, and the ipsilateral (operated) and contralateral (nonoperated) sides of L5 DRG were harvested under microscopic guidance as described above. The tissues were immediately dipped and fixed overnight in 4% paraformaldehyde in 0.1M phosphate buffer, pH 7.2. Tissue samples obtained from three different mice in each group were embedded in paraffin (Sakura Finetek Japan, Tokyo, Japan). At least two 5 to 10 µm thick sections from each tissue paraffin block were obtained (n = 6 in each group). Following deparaffinization with alcohol, the sections were incubated in blocking solution (4% Block Ace; DS Pharma Biomedical, Osaka, Japan) for 2 h at room temperature. They were then washed three times in washing buffer (0.4% Block Ace containing 0.1% Tween 20), followed by incubation with rabbit antibody against collagen I, collagen III, substance P, tumor necrosis factor-alpha (TNF-α), transforming growth factor-beta (TGF-β), or c-Fos (1:1000 dilution in phosphate-buffered saline (PBS)) for 24 h at 4°C. After washing the sections three times in washing buffer, they were incubated with goat antirabbit IgG antibody conjugated with horseradish peroxidase (1:500; Invitrogen) at room temperature for 2 h. The samples were then washed with PBS three times and were incubated with 0.05% 3′,3-diaminobenzidine and 0.00006% hydrogen peroxide for color development. Finally, they were washed five times in washing buffer and mounted on coverslips. The sections were observed to examine the stained areas under light microscope (Olympus BX51/52, Tokyo, Japan) for the assessment of target molecule staining. When the statistical comparison of stained areas was needed, the immunoreactive areas on the section were examined using Image J software (National Institutes of Health, Bethesda, MD, USA), and the significance was evaluated using the Mann–Whitney test.
Histochemical analysis
Paraffin sections with a thickness of 5 to 10 µm (n = 6 in each group) prepared as described above were deparaffinized and washed with PBS. All the sections were stained with hematoxylin–eosin (HE; Wako Laboratory Chemicals, Wako, Japan) and Sirius-red (Sigma-Aldrich, St. Louis, MO, USA) for histopathological examination of the collagenous scar formation in the left sole. Staining with Safranin O was also performed for the detection of cartilage, mucin, and mast cell granules on formalin-fixed, paraffin-embedded tissue sections, and Toluidine blue staining was used to identify nucleic acids (blue) and polysaccharides (purple).
Results and discussion
Effects of hind paw surgery on mouse appearance and body weight
Mice in both sham and operation groups demonstrate normal growth after the operation, with no significant change in body weight observed between the two groups (Figure 2). The only apparent visual effect is swelling of the left (operated side) hind paws of mice in the operation group, which continues for at least four weeks. As discussed below in the “Histochemical Analysis” section, this is probably due to inflammation and scar formation.

Body weight changes in the mice. Mice in the sham (n = 7) and operation (n = 7) groups were weighed one and two days before the operation, as well as 2 h, one, two, and three days after the treatments; they were also weighed at weeks 1 to 10 after the treatments. No significant differences in weight between the two groups are detected by the Mann–Whitney Test. PBS: phosphate-buffered saline.
Pain-associated responses to mechanical stimulation following surgery, and comparison between ipsilateral and contralateral hind paws
Pain is evaluated by measuring the PWT of mechanical stimulation with von Frey fibers until 10 weeks after the operation (Figure 3). The mean PWT values were observed to be 4 g before the operation was performed in the ipsilateral paws of both the operation and sham group mice. The values are compared before and after the operation within the same groups (Figure 3(a)) as well as between the two groups (Figure 3(b)) and are found to decrease rapidly after the operation. The PWT values in the operated group mice are maintained at significantly lower levels (1 g) compared with the values in the sham group mice for three weeks (P < 0.05). The PWT values in the operation group mice increase and return to a comparable level with the withdrawal threshold values in the sham group mice seven weeks after the operation. Interestingly, in the operation group mice, sensitivity to mechanical stimulation is also detected in the contralateral hind paw one day after sensitivity is detected in the ipsilateral hind paw; three days later, the PWT values of the contralateral hind paw decrease to values similar to the values of the ipsilateral hind paw and remain comparable for a period of time (Figure 3). These data suggest a possible transmission of pain-associated response signals from the injured left paw to other tissues, possibly through the nervous system of the DRG. The same phenomenon has previously been reported in a rat pain model. 12 Therefore, the DRGs, especially those in L3 to L5 areas, were analyzed for genes involved in the transmission of pain-related response signals.

Changes in response to mechanical stimulation. (a) Withdrawal threshold of the hind paw in response to mechanical stimuli was measured by the von Frey test at the time points indicated before and after the operation. Data are presented as mean values. Preoperation and postoperation values in each hind paw are compared between the operation (op) and sham groups at each indicated time point (*P < 0.05, **P < 0.01). (b) Withdrawal threshold of the treated hind paw is compared with the contralateral side at same time points in both the groups (†P ≤ 0.05, ††P < 0.01).
Histopathological and immunohistological analyses of the injured tissue architecture
Histological analysis shows that the muscles and tendons of the left hind paw in the operation group mice are disordered with a lack of thick bundles and recruitment of fibroblasts and inflammatory cells among the collagen fibers (Figure 4). In addition, the collagen bundles vary in size; fibrous tissues are present under the dermis and the subcutaneous area, and numerous migrating cells with round- or oval-shaped nuclei are observed between the collagen fibers in HE-stained sections (Figure 4(a) to (c)). Furthermore, the tissue sections from the operation group mice exhibit a large number of collagen fibers that ran in random directions in Sirius-red-stained sections (Figure 4(d) to (f)) and show significantly more glycosaminoglycan depositions around fibroblasts in sections stained with Safranin O and Toluidine blue (data not shown) compared with the tissue sections from the sham group mice, suggesting the occurrence of fibrosis in the operation group mice. Immunohistological analysis also reveals the characteristics of fibrosis: the abundant accumulation of collagen type I and III fibers in the extracellular spaces in the operation group mice (Figure 5(a)). Furthermore, significant distribution of substance P (Figure 5(a)) and inflammation-stimulating factors (TNF-α and TGF-β1) are also found in samples from the operation group mice (Figure 5(b)). The paw tissue samples were also stained with anti-c-Fos antibody; no statistical difference was detected in the c-Fos immunoreactive neurons between the operation and sham groups (data not shown). Similar histologically different characteristics were observed in all six sections from three mice in each of the one-week and two-week operation and sham groups.

Histopathological comparisons of paw tissues in the operation and sham groups. Paraffin sections (5–10 µm thick) were deparaffinized and washed with phosphate-buffered saline. All serial sections are stained with hematoxylin–eosin and Sirius-red for the histopathological examination of collagenous scars (n = 6 in each group). Staining with Safranin O was also performed for the detection of cartilage, mucin, and mast cell granules in formalin-fixed paraffin-embedded tissue sections. Nucleic acids and polysaccharides are stained blue and purple, respectively, with Toluidine blue. A representative image is shown.

Immunohistological staining characteristics of paw tissues in the operation and sham groups. Two 5 to 10 µm thick tissue sections were obtained from three individuals of each group (n = 6). The sections were stained for (a) fibrotic and pain-associated molecules, which included collagen I, collagen III, and substance P (1:1000 diluted with phosphate-buffered saline (PBS)), and (b) growth and translational factors, which included TNF-α, TGF-β, and c-Fos (1:500 diluted with PBS). The staining patterns and their intensities in the sections from each group are very similar. As the sections consist of a variety of tissues (muscle, bone, tendon, connective tissue, skin, and other components), it is difficult to quantify staining intensities because the intensities are different in different tissues. Therefore, representative images for each group are shown here to illustrate the staining characteristics of the tissue architectures. TGF-β: transforming growth factor-beta; TNF-α: tumor necrosis factor-alpha.
DRG tissues were also analyzed by histopathological and immunohistological staining. No statistical difference was detected in the staining patterns in the ipsilateral and contralateral sides of DRG L5 level in either group (data not shown).
Microarray analyses of gene expression in hind paws and DRGs of sham and operation group mice after surgery
Samples that were extracted from the DRG and paw samples one and two weeks after surgery were examined by microarray analysis. To validate the microarray analysis, we examined the consistency of gene expressions obtained using microarray analysis by comparing the results with the results from real-time PCR examinations. We chose 49 molecules related with ECM, pain, and signaling for the analysis (Supplemental Materials, Table S1) and synthesized PCR primers for real-time PCR (the forward and backward sequences are shown in Supplemental Materials, Table S1). Using the RNA left after microarray analysis, three independent real-time PCR runs (n = 3) were performed for each RNA sample to determine the gene expression levels. The relative expression levels were compared with the expression level of the RNA collected from Sham-1w being designated as 1. Although only 49 genes were analyzed by real-time PCR, the changes in gene expression were similar between the two quantitative methods. Representative results for six genes are shown in Supplemental Materials, Figure S1. Therefore, only results from the microarray analyses are shown and discussed hereafter.
Genes with raw signal intensity values >50 are evaluated and genes with raw signal intensity values <50 are generally excluded, with the exception of the genes whose expression values increase significantly in tissue samples after the operation. Postoperative gene expressions (upregulation or downregulation) are normalized to the expressions in Sham-1w, the raw value of which is designated as 1.000. As summarized in Table 2, 1419 genes and 407 genes in paw samples are upregulated (fold change ≥2.0) one week and two weeks after the operation, respectively. We also found that 386 genes are continuously upregulated (fold change ≥2.0) for two weeks after the operation. In addition, 1299 genes and 461 genes are downregulated (fold change ≤0.5) one week and two weeks after the operation, respectively, and 219 genes are continuously downregulated (fold change ≤0.5) for two weeks after the operation. In contrast, in the DRG samples, the number of upregulated or downregulated genes is much smaller compared with the number of upregulated or downregulated genes in the paw samples; 104 and 94 genes are upregulated (fold change ≥2.0) one week and two weeks after the operation, respectively, and only 6 genes are continuously upregulated for two weeks after the operation. In addition, 99 genes and 213 genes are downregulated (fold change ≤0.5) one week and two weeks after the operation, respectively, and 82 genes are continuously downregulated for two weeks after the operation. Heatmaps of the upregulated and downregulated genes are constructed to obtain an overall view of gene expression changes using normalized values of each sample with Treeview software (Figure 6). The involved genes in DRG samples were distinct from the involved genes in paw samples.
Comparison of expression level of the glyceraldehyde-3-phosphate dehydrogenase constitutive gene among the four samples.
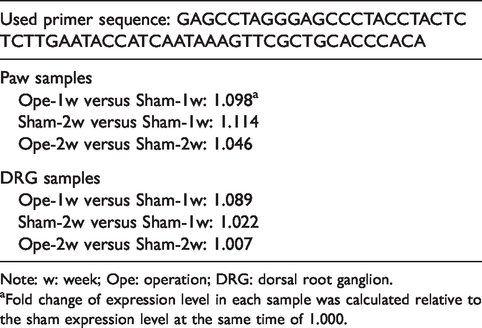
Note: w: week; Ope: operation; DRG: dorsal root ganglion.
aFold change of expression level in each sample was calculated relative to the sham expression level at the same time of 1.000.
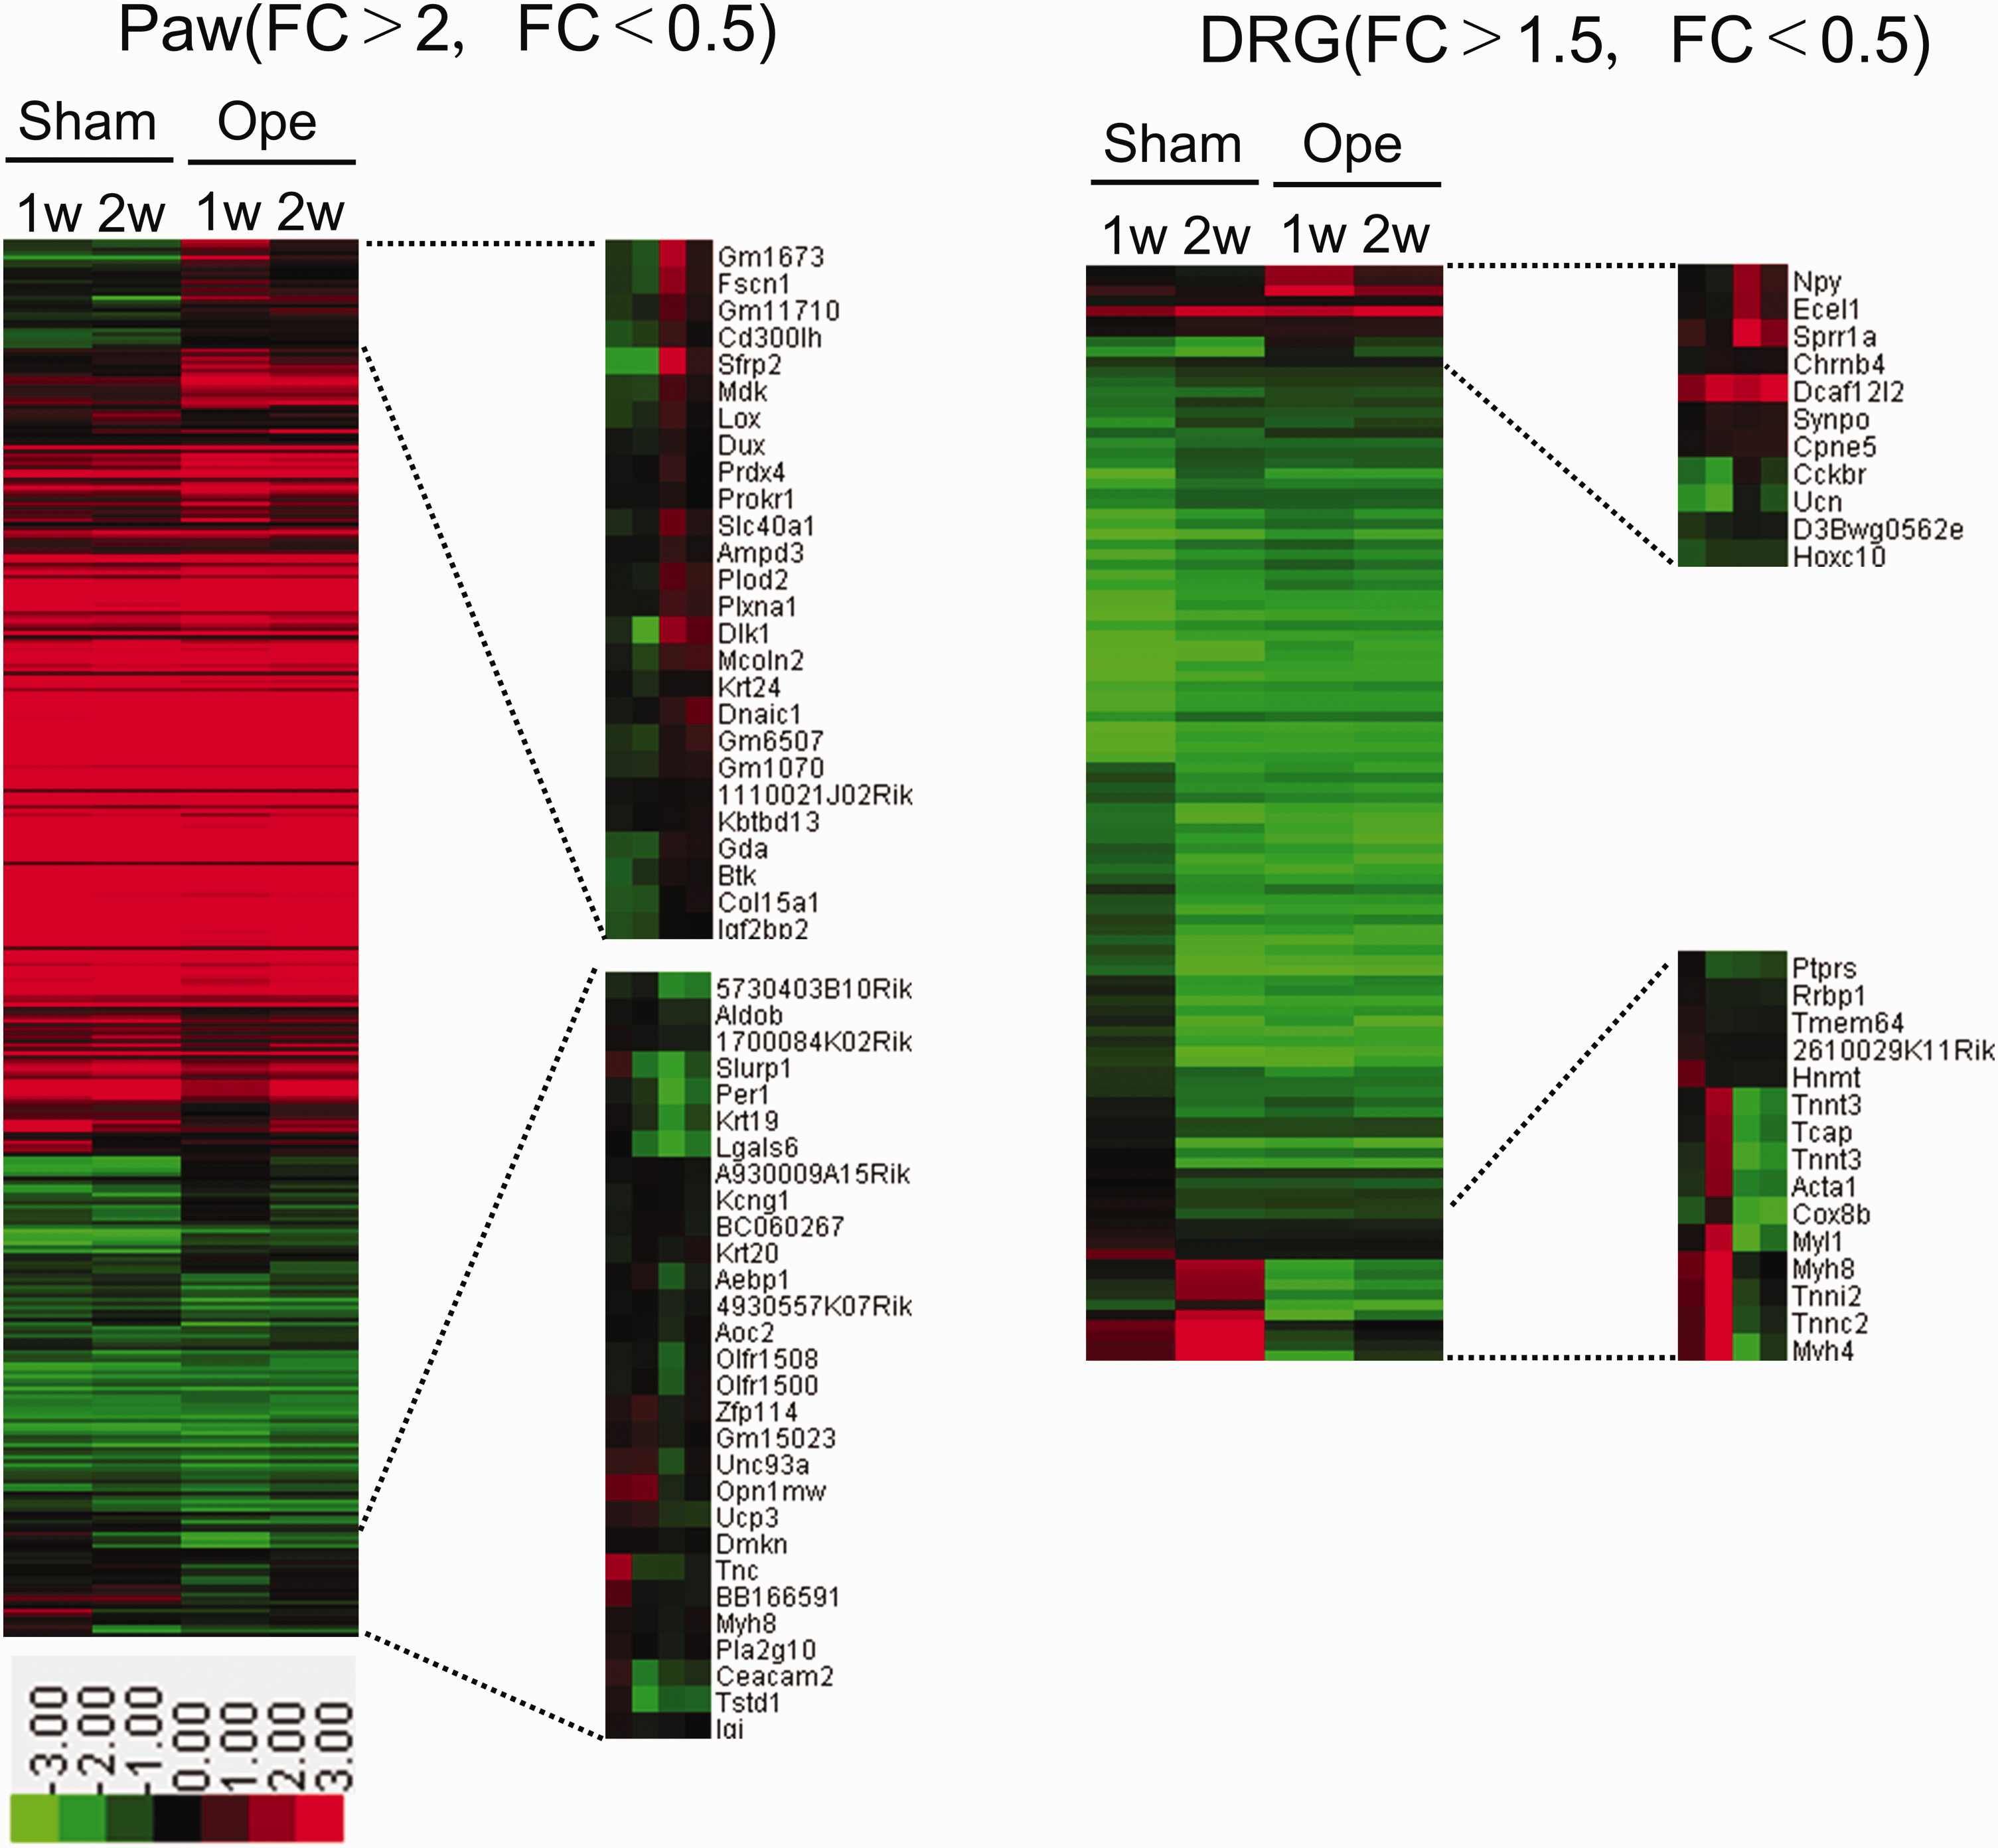
Gene expression profiles in the paw and/or DRG after the operation. Heatmaps of the relative expression of upregulated and downregulated genes in the paw (left) and the DRG (right) in the operation and sham groups. Red indicates upregulated gene expression, and green indicates downregulated expression. The corresponding gene names are mentioned in the right side of the heatmaps. DRG: dorsal root ganglion; FC: fold change.
Number of genes that the expression levels were changed one week, two weeks, and one to two weeks after the operation, respectively, in the foot paw samples and in the DRG samples.

Note: DRG: dorsal root ganglion.
aFold change of the expression level in each sample was calculated relative to a sham expression level at the same time of 1.000.
Selected ECM-related genes in the paw-ECM molecules.
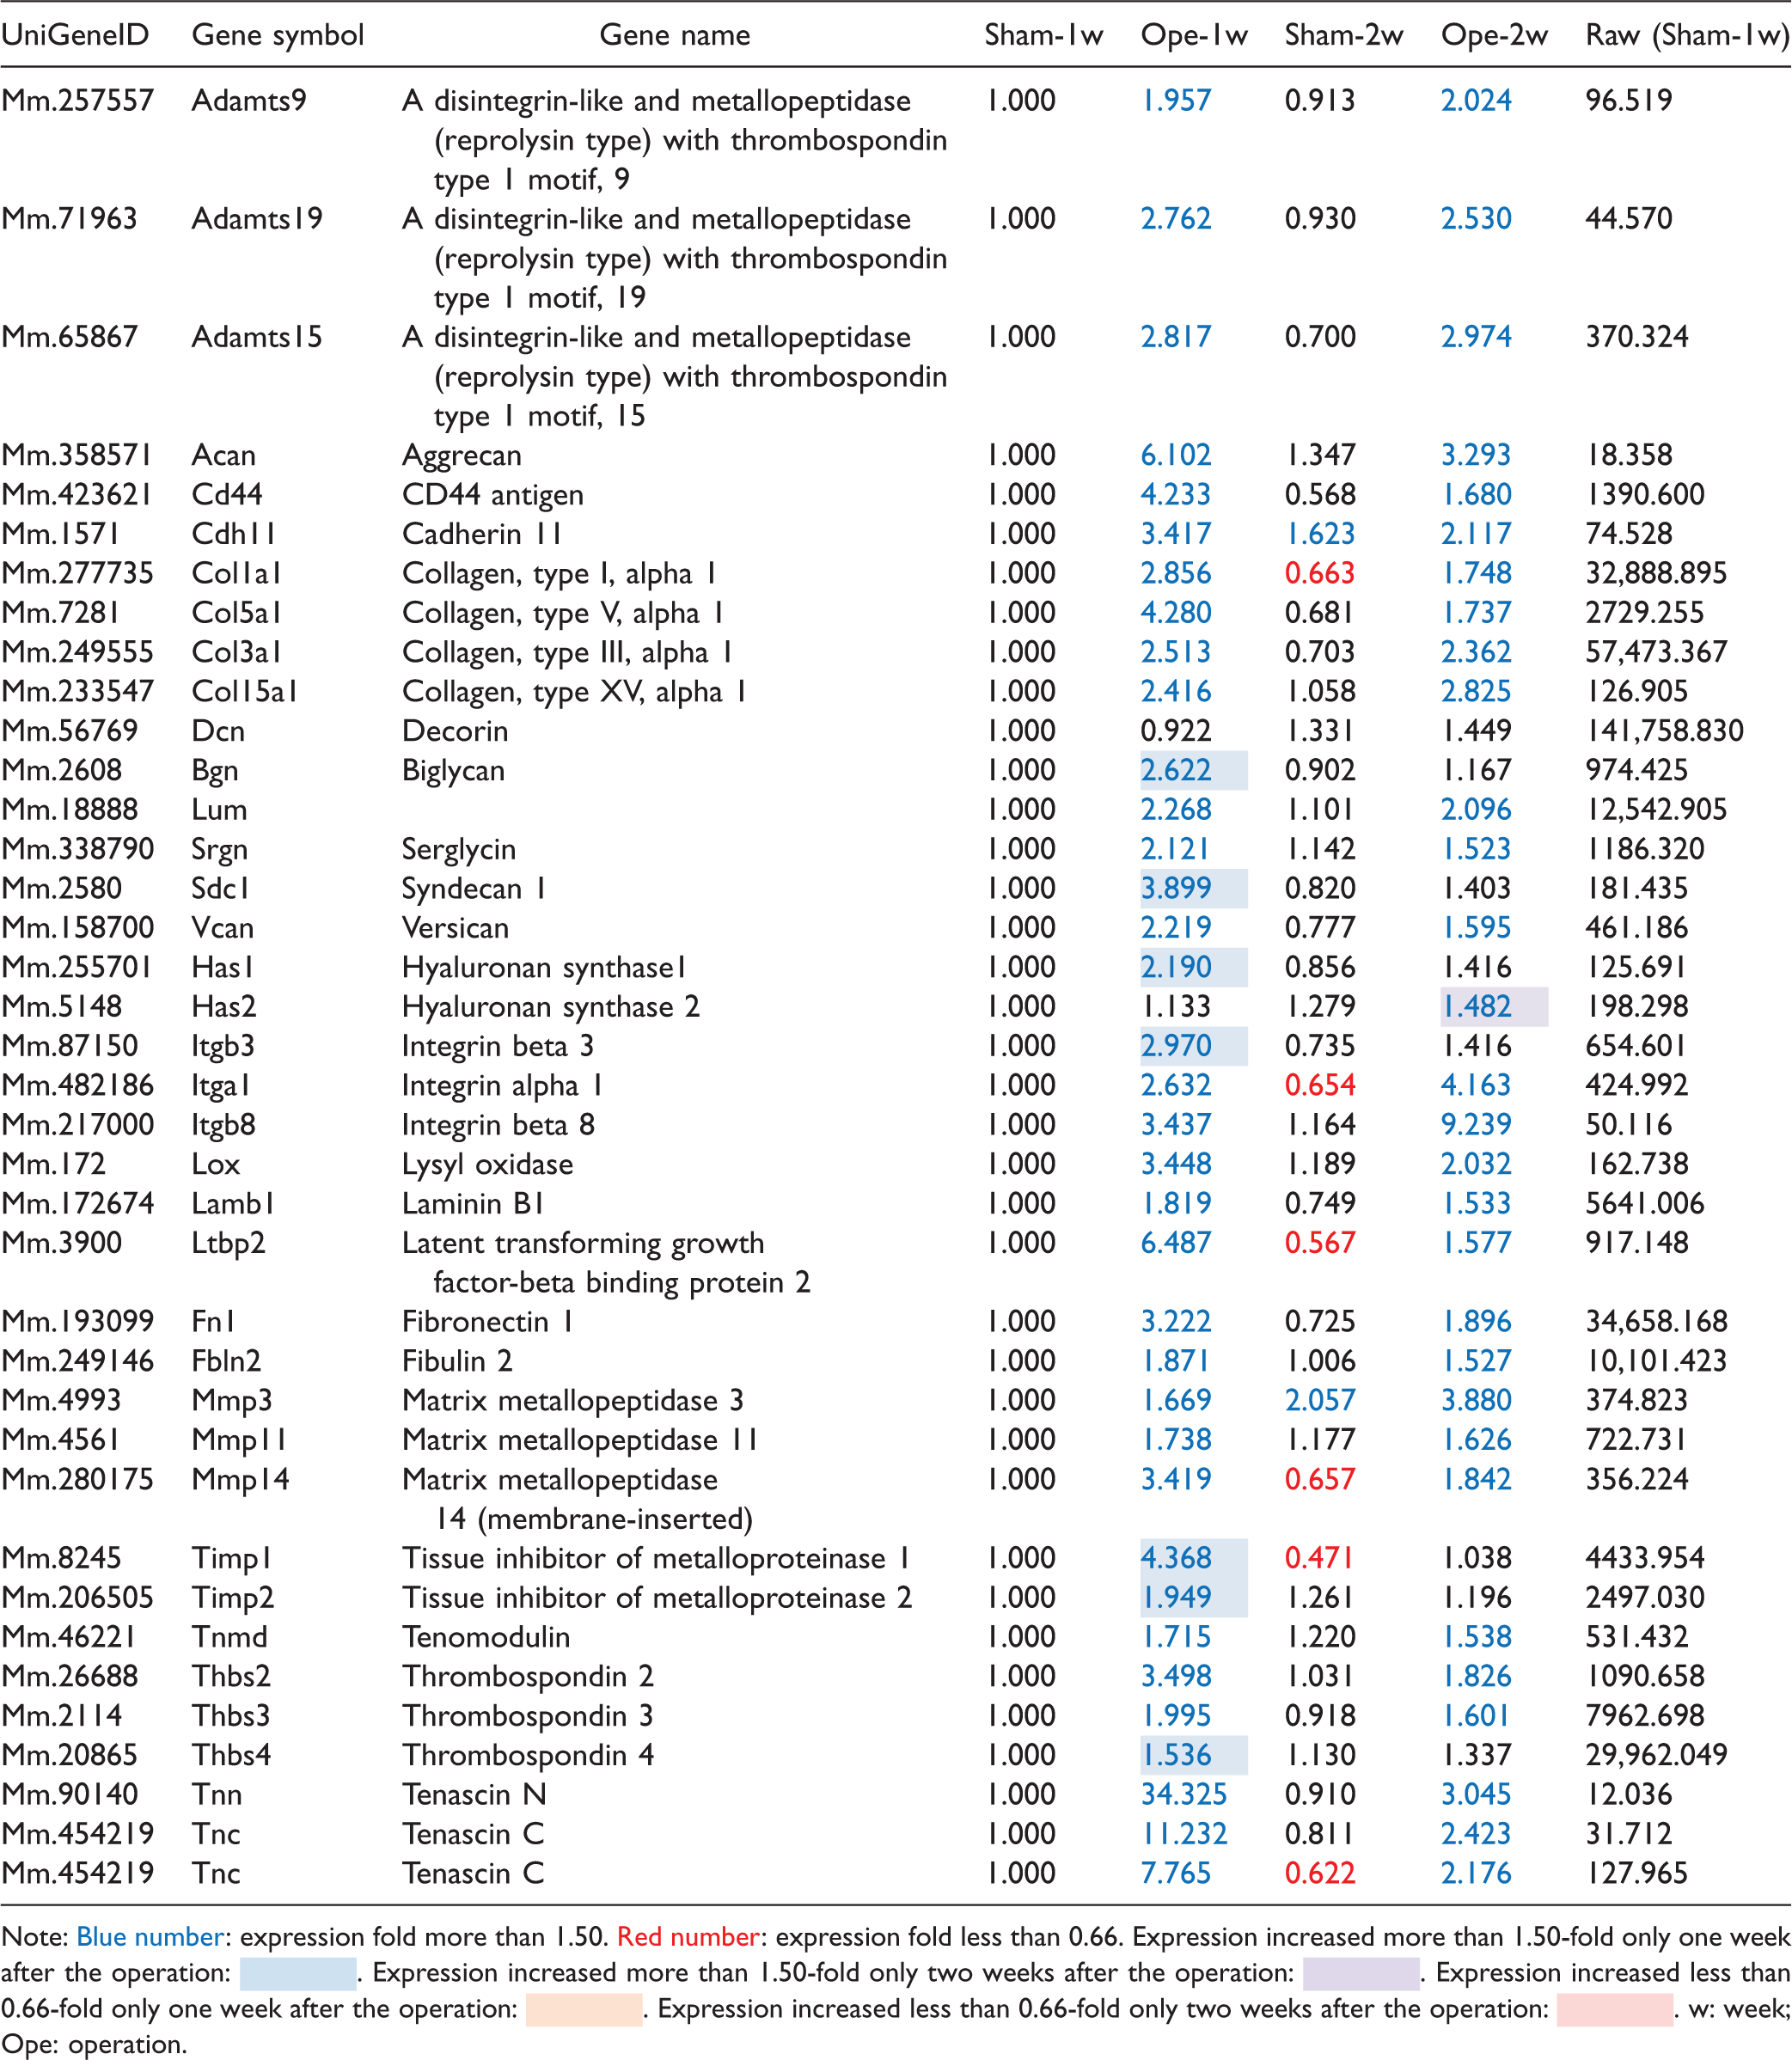
Note: Blue number: expression fold more than 1.50. Red number: expression fold less than 0.66. Expression increased more than 1.50-fold only one week after the operation:  . Expression increased more than 1.50-fold only two weeks after the operation:
  . Expression increased less than 0.66-fold only one week after the operation:
  . Expression increased less than 0.66-fold only two weeks after the operation:
  . w: week; Ope: operation.
We investigated details of the expression level changes in genes involved in scar formation and the accompanying chronic pain. Extensive literature searches were done to identify molecules directly related to tissue fibrosis and chronic pain and potential molecules involved in signaling pathways and regulation of their gene expressions. Based on this information, we chose a number of upregulated and downregulated genes for detailed discussion (see Tables 3 to 11).
Expression of genes encoding ECM and other related proteins
The expression of genes encoding ECM and other associated proteins differ significantly between the paw (Table 3) and DRG samples (Table 6). Molecules expressed at significant levels (>50 in raw values) in both paw (30%, 14/47) and DRG (48%, 32/66) samples are specific to each tissue. Interestingly, molecules commonly expressed in both tissues, such as decorin, lumican, collagen type I alpha 1, and fibronectin, show high expressions with raw values >5000, which may correspond to the level of intrinsic and predominant ECM proteins in both types of tissues. In the paw, upregulation (fold change ≥2.0) of 23 ECM-related genes is detected continuously for two weeks, that of 18 genes is detected one week, and that of 1 gene is detected two weeks after the operation. On the other hand, none of the genes show reduced expressions (fold change <0.66) one week and two weeks after the operation. Notably, expression of Tnn, which encodes Tenascin N protein and is weakly expressed only in the paw samples, is increased significantly continuously for two weeks after the operation. The elevated expression of genes for ECM proteins and the enhanced staining and irregular arrangements of ECM components (Figure 5, Table 3) support the suggestion that molecular processes underlying tissue fibrosis initiate at an early time point within one week after the operation. In the DRG samples, genes encoding many neuronal ECM proteins, such as brevican, neurocan, agrin, haplans, laminin, and fibulin, are significantly expressed (raw values >50), while expression of these genes is very low in the paw samples. In the DRG samples, genes encoding some ECM-modified proteins (enzymes), including genes for matrix metalloproteinase 2, 8, 15, and 17 (Mmp2, 8, 15, and 17), and the tissue inhibitor of metalloproteinase 3 gene (Timp3) are significantly expressed (raw values >50). Interestingly, paw samples exhibit specific expression of Mmp3 and 14. In addition, both Timp1 and 2 genes are highly expressed in both paw and DRG samples, and their expressions are significantly increased in the paw samples one week after the operation. In the DRG samples, only the expression of thrombospondin 2 gene (Tsp2) increases more than 1.5-fold continuously for two weeks after the operation. In addition, expression of three genes encoding aggrecan (Acan), syndecan 1 (Sdc1), and tissue inhibitor of metalloproteinase 1 (Timp1) increases one week after the operation. The increased expressions are not evident two weeks after the operation. On the other hand, expression of four genes encoding inter-α-trypsin inhibitor heavy chain 2 (Itih2), Mmp8, Mmp9, and Mmp13 decreases <0.75-fold continuously for two weeks after the operation. There is no decrease in the expression of any of the genes encoding cell surface receptors for ECM molecules one week after the operation; however, the expression of one gene encoding integrin β3 decreases after two weeks (Table 6). Expression of Timp1 and 2 gene is higher than the expression of other Timp family genes in both paw and DRG samples, and their upregulation is detected only in the paw samples one week after the operation (Tables 3 and 6).
We also examined the expressions of genes encoding growth factors, cytokines, and their receptors (Tables 4 and 7) because these molecules are closely associated with the upregulated and downregulated expressions of the genes encoding the aforementioned ECM molecules. Upregulated expression of inflammation-related genes including bone morphogenetic protein 1 (Bmp1), TNF (ligand) superfamily member 15 (Tnfsf15), TNF-α-induced protein 6 (Tnfaip6), insulin-like growth factor 1 (Igf1), platelet-derived growth factor receptor-beta protein (Pdgfrb), chemokine (C–X–C motif) ligand 12 (Cxcl12), and chemokine (C–C motif) ligands 2, 3, 4, 6, 7, and 8 (Ccl2, Ccl3, Ccl4, Ccl6, Ccl7, and Ccl8) is evident. Genes including mothers against decapentaplegic homolog 3 (Smad3) and TNF (ligand) superfamily member 9 (Tnfsf19) are downregulated in the paw samples continuously for two weeks after the operation (Table 4). In addition, 29 and 6 genes are upregulated one week and two weeks after the operation, respectively, and 6 and 5 genes are downregulated one week and two weeks after the operation, respectively (Table 4). In contrast, none of the genes upregulated in the paw samples are upregulated in the DRG samples one week and two weeks after the operation; however, two genes, Tnfaip2 and Tnfsf25, are continuously downregulated for two weeks after the operation (Table 7). We also found that six genes encoding ECM-related molecules including Src homology 2 domain-containing transforming protein C3 (Shc3), TNF receptor superfamily member 12a (Tnfrsf12a), chemokine (C–C motif) ligands 8 and 17 (Ccl8 and Ccl17), interleulin 6 (Il6), and interleukin 7 (Il7) are upregulated one week after the operation but not after two weeks. Four genes (Cxcl14, Il1b, Il1rl1, and Il6ra) are downregulated two weeks after the operation (Table 7).
Selected ECM-related genes in the paw—growth factors, chemokines, other molecules in ECM, and their receptors and signaling molecules.

Note: Blue number: expression fold more than 1.50. Red number: expression fold less than 0.66. Expression increased more than 1.50-fold only one week after the operation: . Expression increased more than 1.50-fold only two weeks after the operation: . Expression increased less than 0.66-fold only one week after the operation: . Expression increased less than 0.66-fold only two weeks after the operation: . w: week; Ope: operation; MAD: mothers against decapentaplegic; TSG-6, TNF-stimulated gene 6.
Selected ECM-related genes in the paw—changes in glycosyltransferases and sulfotransferases for the synthesis of glycosaminoglycans and sugar chains.

Note: Blue number: expression fold more than 1.50. Red number: expression fold less than 0.66. Expression increased more than 1.50-fold only one week after the operation: . Expression increased more than 1.50-fold only two weeks after the operation: . Expression increased less than 0.66-fold only one week after the operation: . Expression increased less than 0.66-fold only two weeks after the operation: . w: week; Ope: operation.
Selected ECM-related genes in the DRG-ECM molecules.

Note: No apparent changes in glycosyltransferases and sulfotransferases for the syntheses of glycosaminoglycans and sugar chains although their expressions were significant. Although there are high expressions (>500 raw values) in Adamts1, 2, 4, 5, 8, 14, and 15 (especially high in Adamts2 and 15), no significant change was observed among Sham-1w, Ope-1w, Sham 2-w, and Ope-2w groups. Blue number: expression fold more than 1.50. Red number: expression fold less than 0.66. Expression increased more than 1.50-fold only one week after the operation: . Expression increased less than 0.66-fold only two weeks after the operation: . w: week; Ope: operation.
Selected ECM-related genes in the DRG—growth factors, chemokines, other molecules in ECM, and their receptors and signaling molecules.

Note: No apparent changes in glycosyltransferases and sulfotransferases for the syntheses of glycosaminoglycans and sugar chains although their expressions were significant. Although there are high expressions (>500 raw values) in Adamts1, 2, 4, 5, 8, 14, and 15 (especially high in Adamts2 and 15), no significant change was observed among Sham-1w, Ope-1w, Sham-2w, and Ope-2w groups. Blue number: expression fold more than 1.50. Red number: expression fold less than 0.66. Expression increased more than 1.50-fold only one week after the operation: . Expression increased less than 0.66-fold only two weeks after the operation: . w: week; Ope: operation; MAD: mothers against decapentaplegic; SMAD: the fusion of Caenorhabditis elegans Sma genes and the Drosophila Mad, Mothers against decapentaplegic.
Since the paw was the site of the surgery, operation-derived necrosis may have caused the secretion of a high concentration of proteases from the necrotic cells, inducing higher expression of inflammation-related genes than that in the DRG samples. It would be of interest to investigate whether prevention of necrosis-induced inflammation-related gene expression in the paw is related to chronic pain in the mouse model.
Enzymes implicated in ECM saccharide chain synthesis
All ECM molecules bear saccharide chains. Some of the chains are long saccharide chains recognized as glycosaminoglycans, such as chondroitin sulfate (CS). The synthesis of glycosaminoglycans, especially CS, negatively or positively controls plasticity and regeneration of the neuronal network after injury and neurodegenerative diseases.17–19 Therefore, it was of interest to investigate the changes in the expression of genes encoding sugar chain synthases after the injury. In the paw samples, the expression of genes involved in CS synthesis increases by >1.5-fold one week after the operation, which was similar to previous reports. In contrast, the expression of most genes involved in heparan sulfate (HS) synthesis decreases by <0.75-fold, although the expression of two genes involved in HS synthesis, Ext1 and Ext2, increases (Table 5). Changes in the expression of genes involved in other sugar chain synthases are also observed in the paw samples. Interestingly, the expression of genes involved in sugar chain synthases in the DRG samples is very low (raw values <50) and also shows no significant changes after the operation (data not shown), which suggests that changes in the expression of these genes occur only in injured nerve tissues at least during the study period.
Expression of genes for pain-associated molecules; neuropeptides, neurotransmitters, and receptors
Details of molecules involved in nociceptive and neurogenic pain, and effects of the operation on their gene expression levels are described and discussed below.
Genes expressing pain-related neuropeptides, including Tac1 (which encodes tachynin 1, a precursor protein of substance P and neurokinin A) are upregulated in the DRG samples (Table 9). It should be noted that Tac1 expression in the DRG samples is >700-fold higher than that in the paw. However, the operation group mice display a nearly two-fold increase in Tac1 expression in the paw. Cck, a gene encoding a peptide hormone cholecystokinin, is found both in the brain and in the intestine where it acts as a neurotransmitter and a regulator of gastrointestinal functions, respectively. 20 This hormone induces various biological effects such as pathological thermal hyperalgesia, which is mediated by cholecystokinin A and B receptors encoded by Cckbr and Cckar genes, respectively. Mostly, cholecystokinin B receptors are found in the brain and the spinal cord, 20 and cholecystokinin A receptors are found in the peripheral nervous systems.20–23 Cckar is highly expressed in the DRG which is the center of the peripheral neurons; interestingly, Cckbr is also highly expressed in the paw tissues having the peripheral nervous systems (Tables 8 and 9). This observation suggests that Cckbr may also be expressed to function in the peripheral tissues. Cckbr expression increases one week after the operation in the DRG samples, which is almost comparable to that in the paw samples; this change appears to be associated with the operation-induced increase in Cck.
Selected genes of pain-related molecules in the paw (≥1.50).

Note: Blue number: expression fold more than 1.50. Red number: expression fold less than 0.66. Expression increased more than 1.50-fold only one week after the operation: . Expression increased more than 1.50-fold only two weeks after the operation: . Expression increased less than 0.66-fold only one week after the operation: . Expression increased less than 0.66-fold only two weeks after the operation: . w: week; Ope: operation; TRAF: TNF receptor (TNFR) associated factor.
Selected genes of pain-related molecules in the DRG (≥1.50).

Note: Blue number: expression fold more than 1.50. Red number: expression fold less than 0.66. Expression increased more than 1.50-fold only one week after the operation: . Expression increased less than 0.66-fold only two weeks after the operation: . w: week; Ope: operation; TRAF: TNF receptor (TNFR) associated factor; AMPA: α-amino-3-hydroxy-5-methoxazole-4-propionate; NMDA: N-methyl-D-aspartate.
Expression of Npy (which encodes neuropeptide Y) is significantly increased one week after the operation in both paw and DRG samples (Tables 8 and 9). This peptide acts as a neurotransmitter in the brain and the autonomic nervous system 24 and is thought to have several functions, including reduction of pain perception. 25
Neurotensin is a peptide distributed throughout the central nervous system (CNS). It is involved in the regulation of dopamine pathways and induces various effects, including analgesia, hypothermia, and increased locomotor activity. 26 Interestingly, the Nts gene encoding this peptide is also upregulated in both paw and DRG samples after the operation (Tables 8 and 9).
Gal encodes galanin, which is also a neuropeptide widely expressed in the brain, spinal cord, and gut, and signals through three G protein-coupled receptors (Galr1, 2, and 3). It is predominantly involved in the modulation and inhibition of action potentials in neurons and has been implicated in many biologically diverse functions including nociception, cognition, and blood pressure regulation. 27 In addition, it has been reported that the biosynthesis of galanin is increased upon axotomy in the peripheral nervous system. 28 Consistent with these findings, the expression of Gal increases three-fold in the DRG one week after the operation, which seems to correspond to its neuroprotective activity during the acute phase, as reported previously. 28 However, Galr which encodes the Gal receptor is not significantly expressed before and after the operation in both DRG and paw samples (raw values <50), with the exception of Galr1 in the DRG (Tables 8 and 9).
Cd163 encodes the macrophage scavenger receptor, which is a marker of the monocyte/macrophage lineage. 29 Macrophages are critical to injury and repair. Two types of macrophages are found in cells: M1, which secretes inflammatory cytokines that activate nociceptors and promote pain, and M2, which secretes anti-inflammatory cytokines that inhibit nociceptors and promote analgesia. Thus, they may regulate both chronic musculoskeletal pain and analgesia during regular physical activity.30,31 The expression of Cd163 increases approximately two-fold on week 1 and continues two weeks after the operation in both paw and DRG samples. Thus, the elevated expression might play some roles to suppress the scar formation in the paw and the associated pain.
Dbh encodes dopamine beta-hydroxylase, an enzyme involved in the synthesis of norepinephrine. Its expression is significantly increased in the DRG samples but reduced in the paw samples, which may be a neuronal response to the shock of the operation.
The expressions of Ogfr gene encoding the opioid growth factor receptor and Htr gene encoding the serotonin receptor do not show a marked change as a result of the operation in both paw and DRG samples, although their expressions in the DRG samples are higher than the expressions in the paw samples.
Piezo1 and its close homolog piezo2 are genes encoding mechanosensitive ion channel proteins. These genes are expressed in the lungs, bladder, and skin, where mechanosensation has important biological roles, and piezo2 is highly expressed in the sensory neurons. 32 In our study, piezo1 is highly expressed in the paw samples and it increases two-fold continuously for two weeks after the operation, which is similar to previous reports. In contrast, piezo2 is highly expressed in the DRG samples but weakly in the paw samples, although the expression increases after the operation.
Scns encode integral membrane proteins that form ion channels, which facilitate the transport of sodium ions (Na+) through the cell membrane. In excitable cells such as neurons, myocytes, and certain types of glia, the channels are responsible for the rising phase in the action potentials. 33 Scns are highly expressed in the DRG samples but mostly unaffected by the operation. In contrast, their expressions in the paw samples change after the operation albeit their expression levels being less than those in the DRG samples (Tables 8 and 9).
TRP (transient receptor potential) channels are ion channels comprising six protein families. Based on their structural similarities, they are grouped into two broad groups. Group 1 includes TRPC (“C” for canonical), TRPV (“V” for vanilloid), TRPM (“M” for melastatin), TRPN (“N” for no mechanoreceptor potential C), and TRPA (“A” for ankyrin), and group 2 includes TRPP (“P” for polycystic) and TRPML (“ML” for mucolipin). TRPV1/TRPV2/TRPV3 and TRPV4 have recently been found to be clinically significant in their roles as thermoreceptors and mechanoreceptors, respectively. Reduction in chronic pain might be achieved by targeting ion channels involved in thermal, chemical, and mechanical sensations to reduce their sensitivity to stimuli. 34 The present microarray analysis shows that almost all genes for TRPVs and TRPMs are highly expressed in the DRG samples compared with the expressions in the paw samples. Interestingly, expressions of TrpV6 and Trpm1 in the DRG are increased by approximately two-fold one week after the operation. In the paw samples, expressions of Trpv2, Trpv4, and Trmp6 are increased two-fold one week after the operation, and the expressions of Trpv4 and Trpm6 remain elevated two weeks after the operation (although they decrease from the levels at one week). Considering these results and their known functions described above, TRPV4 may be an important factor involved in algesia after the operation.
Grin and Gria, genes for glutamate receptors of ionotropic NMDA (N-methyl-D-aspartate) and AMPA (α-amino-3-hydroxy-5-methoxazole-4-propionate), respectively, are, as expected, highly expressed in the DRG samples compared with the expressions in the paw samples. However, only Gria1 expression in the DRG and Grina expression in the paw samples change significantly after the operation (Tables 8 and 9), suggesting that these receptors do not play significant roles in pain perception. Glutamate receptors are present in CNS glial cells as well as neurons and play a role in modulating the expression of genes involved in glial cell differentiation and brain development. 35 Spinal NMDA receptors are reportedly involved in hyperalgesia and link the pain sensory region to the thalamus, the pain-processing center of the brain. 35 However, we observed the unaltered expression of Grin after the operation and the upregulated expression of Gria1 at one week and two weeks after the operation in the DRG samples (Table 9).
GABA (γ-aminobutyric acid) is the main inhibitory neurotransmitter of the mammalian CNS. It is synthesized from glutamate in the brain. GABA regulates neuronal excitability throughout the nervous system and is directly responsible for regulation of muscle tone via the GABA receptor, which is encoded by Gabr. 36 The Gabr expression is significantly increased in the DRG samples after the operation, as expected from its function (Table 9).
The expression of genes for other neurotransmitter receptors is not significantly changed in the DRG samples by the operation. Altered expressions are observed for only a few neurotransmitter receptor genes (e.g., Ramp1 and Ramp3) in the paw samples.
Expression of genes associated with signaling pathways and molecules involved in muscle fibrosis and associated hyperalgesia
It is important to investigate how the changes in gene expression result in muscle fibrosis and associated hyperalgesia. We first examined changes in the gene expressions of muscle constituents (Table 10). As expected, higher expression of genes involved in muscle components is observed in the paw samples, but expressions of myosin heavy polypeptides (Myhs) are reduced after the operation, which may reflect the loss of muscle differentiation by the operation. Contrary to this, as also expected, there are almost no gene expression changes in the DRG samples (Table 11). Interestingly, the gene encoding myosin 1H (Myo1h, nonskeletal muscle type), which functions in vesicle transport, is highly expressed in the DRG samples.
Selected genes of signaling molecules and differentiation-involved molecules in the paw (≥1.50).

Note: Blue number: expression fold more than 1.50. Red number: expression fold less than 0.66. Expression increased more than 1.50-fold only one week after the operation: . Expression increased more than 1.50-fold only two weeks after the operation: . Expression increased less than 0.66-fold only one week after the operation: . Expression increased less than 0.66-fold only two weeks after the operation: . Raw data, too low to be trusted:  . w: week; Ope: operation; TRAF: TNF receptor (TNFR) associated factor; TYRO: tyrosine kinase; LPA: lysophosphatidic acid; LPC: lysophophatidyl choline; BCL: B-cell lymphoma; MAP: Mitogen-activated protein; MYC: Myelocytomatosis; SRY: sex-determining region Y; Nut 2: negative regulation of upstream regulatory sequence (NRS) 2; AKT: protein kinase B; mTOR: mammalian target of rapamycin; GLI: glioma-associated oncogene; MMTV: mouse mammary tumor virus; POU: the Pituitary-specific Pit-1, the Octamer transcription factor proteins Oct-1 and Oct-2, the neural Unc-86 transcription factor from Caenorhabditis elegans.
Selected genes of signaling molecules and differentiation-involved molecules in the DRG (≥1.50).
Note: Blue number: expression fold more than 1.50. Red number: expression fold less than 0.66. Expression increased more than 1.50-fold only one week after the operation: . Expression increased more than 1.50-fold only two weeks after the operation: . Expression increased less than 0.66-fold only one week after the operation: . Expression increased less than 0.66-fold only two weeks after the operation: . Raw data, too low to be trusted: . w: week; Ope: operation; AKT: protein kinase B; mTOR: mammalian target of rapamycin; TYRO: tyrosine kinase; BCL: B-cell lymphoma; MAP: Mitogen-activated protein; Myc: myelocytomatosis; SRY: sex-determining region Y; RAS: Rat sarcoma; MMTV: mouse mammary tumor virus; GLI: glioma-associated oncogene.
Similarly, the expression of genes related to myogenesis is highly expressed in the paw samples, and a few of these genes are expressed in the DRG samples (Tables 10 and 11). For example, gene expression of Pax7, a transcription factor that plays a role in myogenesis through regulation of muscle precursor cell proliferation, 37 is detected in the paw samples. Interestingly, the expression decreases continuously following the operation.
Wnt and Shh (Sonic hedgehog) signaling pathways function during embryogenesis in processes that include not only cell fate specification, cell proliferation, and cell migration but also control tissue regeneration.38,39 Thus, we expected some involvement of these signaling molecules in fibrosis and associated hyperalgesia. Many genes associated with the Wnt and Shh pathways are expressed in both paw and DRG samples but at distinct expression levels. Wnt1 and Shh expressions significantly increase in the paw samples, after the operation, although their expressions are mostly unaffected by the operation in the DRG samples (Tables 10 and 11). The expressions of Sfrp2 and Sfrp1, which encode secreted frizzled-related protein 2 and protein 1, respectively, increase significantly in the paw samples after the operation. Thus, the Wnt and Shh signaling pathways may play important roles in fibrosis and associated hyperalgesia.
The AKT/mTOR pathway regulates the cell cycle. 39 In many cancers, this pathway is overactive, which reduces apoptosis and allows cell proliferation.40 However, this pathway is important to promote growth and proliferation over differentiation of adult stem cells, specifically neural stem cells. 41 Consistent with these observations, we observed that the genes encoding the molecules involved in this pathway are significantly expressed in both paw and DRG samples but are largely unaltered by the operation (Tables 10 and 11).
The Notch signaling network regulates interactions between physically adjacent cells and development of neurons and somites. 42 Genes encoding the molecules involved in this pathway are highly expressed in both paw and DRG samples, but there are no significant changes in their expressions after the operation (Tables 10 and 11), suggesting no significant involvement in the observed events.
Expression of genes encoding neuronal signaling molecules, protein kinases, and transcription factors
Activating transcription factor 3, encoded by Atf3, is a member of the mammalian activation transcription factor/cAMP responsive element-binding protein family of transcription factors that are specifically expressed in a variety of stressed tissues. 43 The observed four-fold increase in Atf3 expression one week after the operation is consistent with the above report, and this expression in the DRG samples provides confirmation of regenerative response being one of neuronal signaling molecules following injury in DRG neurons. 44 Since the Atf3 protein interacts with several signaling molecules such as c-Jun and Smad3,45,46 knowledge of their interactions can provide a better understanding of the present results.
Significantly high expressions of genes for a variety of mitogen-activated protein kinases (Mapks), MAPK-activated protein kinases (Mapkapk), and Rho GTPase-activating proteins (Arhgap) are observed in both DRG and paw tissues. Interestingly, while the expressions of these genes, especially Arhgap, are significantly affected even two weeks after the operation in the paw samples, they remain constant in the DRG samples. This suggest the frequent occurrence of membrane-involved biological processes, such as endocytic recycling, 47 and their involvement in the fibrotic events in the paw tissues.
Runx1, the gene for a transcription factor that regulates the differentiation of hematopoietic stem cells into mature blood cells, has recently been demonstrated to play a major role in the development of the neurons that transmit pain. 48 However, we observed that Runx1 expression increases only in the paw samples after the operation, while Runx2 and Runx3 expressions increase in the DRG samples (Tables 10 and 11).
The Fos gene family consisting of four members (Fos, Fosb, Fosl1, and Fosl2) that encode leucine zipper proteins can dimerize with proteins of the JUN family, thereby forming the transcription factor complex AP-1 and being implicated in the regulation of cell proliferation, differentiation, and transformation. 49 Fosl1 expression in the DRG samples and Fosl1 and Fosl2 expressions in the paw samples are significantly elevated after the operation. However, their expression values are low (Tables 10 and 11), suggesting less significant involvement in the observed events.
Expression of genes for apoptosis signaling protein
A process of programmed cell death 50 should be stimulated in our mouse model. Expressions of genes encoding apoptosis signaling molecules are at adequate levels to induce signaling in both DRG and paw samples. However, some tissue-specific differences are evident. Significant changes in the expressions of more genes for apoptosis signaling molecules (Casp1, 3, 4, 6, and 8, and Bad, Raf1, Rac2, 3, Tbx3, 18, and 22) are observed in the paw samples, while the expressions of fewer genes (Casp3, Rac2, Tbx1, Tbx2, and Tbx3) significantly change in the DRG samples after the operation (Tables 10 and 11). The results suggest the close involvement of apoptosis in both injury-induced fibrosis and the associated chronic pain, but the processes differ between paw tissues and the DRG.
Expression of genes involved in mirror-image pain
The data (Figure 3(a) and (b)) suggest that chronic pain could spread from the primary somatosensory cortex to other regions. It has been reported that nerve damage induces the production of lysophosphatidic acid (LPA) via the autotaxin (ATX)-mediated conversion of lysophophatidyl choline and LPA signals through six cognate G protein-coupled receptors (LPAR1-6). These receptors are expressed on most cells within the central and peripheral nervous tissues and are linked to many neural processes and pathways. LPA stimulates LPAR3 on activated microglia, resulting in a feed-forward LPA release that can activate LPAR1 on Schwann cells, which leads to the downregulation of myelin proteins, progressive demyelination, and the initiation of neuropathic pain.51,52 Consistent with these reports, Lpar1-6 and Enpp2 (a gene encoding for ectonucleotide pyrophosphatase/phosphodiesterase family member 2, known as ATX) are highly expressed in the DRG samples and their levels remained constant following the operation. On the other hand, the expressions of these genes are low at onset in the paw samples and significantly change, with the expressions of Lpar3 and Enpp2 decreasing, after the operation (Tables 10 and 11).
Ohmichi et al., 13 using the rat chronic postcast pain models, reported that activation of lumbar cord astrocytes is an important factor in widespread mechanical hyperalgesia and that Atf3 may be involved in this activation. Consistent with this suggestion, a >4-fold increase in Atf3 expression, in addition to its high expression levels, is observed one week and two weeks after the operation in DRG and paw samples, respectively. This suggests that Atf3 may also be an important signaling molecule involved in the observed spreading of chronic pain.
Other genes with large changes in expression one and two weeks after the operation
Lrrc16a is a member of the leucine-rich repeat-containing family of proteins that have functions in diverse biological pathways. 53 The expression of Lrrc16a is reduced by half in the DRG samples but is increased 1.7-fold in the paw samples after the surgery (Tables 10 and 11), suggesting some involvement in the present events. Gpnmb which encodes the non-metastatic gene B (NMB) transmembrane glycoprotein has been characterized as osteoactivin in mice. 54 Significant and increased expression of Gpnmb after the operation is detected only in the paw samples (Tables 10 and 11), which is consistent with previous studies demonstrating high Gpnmb expression during chondrogenesis and osteogenesis. 55 Tyrobp which encodes the TYRO protein tyrosine kinase (SYK)-binding protein is a transmembrane signaling polypeptide that contains an immune-receptor tyrosine-based activation motif in its cytoplasmic domain and may bind zeta-chain-associated protein kinase 70 kDa (ZAP-70) and SYK to facilitate signal transduction in bone modeling, brain myelination, and inflammation. 56 It is notable that the expression of Tyrobp is increased almost five-fold one week after the operation in the paw samples (Tables 10 and 11).
General discussion
Our findings using a mouse model confirm that persistent postoperative pain can be established through extensive injury of peripheral tissues. Microarray analyses have revealed that hundreds of genes were involved in the operation-induced fibrosis and the accompanying chronic pain, which lead to muscle fibrosis and associated hyperalgesia. Based on an extensive literature search for molecules implicated in tissue fibrosis and chronic pain, we initially focused on gene expressions related to molecules involved in the syntheses, degradation, and regulation of tissue ECM and pain-associated molecules. Our focus subsequently broadened to include molecules involved in the related signaling pathways and molecules related to transcriptional and translational regulation.
The extent of the gene expression changes and the raw gene expression values can provide an estimate of their involvement in these phenomena. Thus, this report could be the first study to semiquantitatively and comprehensively examine the actual molecules and signal transduction pathways that are implicated in injury of peripheral tissues, subsequently inducing scar formation and chronic pain.
The present study might help elucidate the mechanism of DRG participation in the processes by which the injury of the peripheral tissues sensitizes the CNS to perceive pain. We originally expected that the expression of many genes in the DRG would change, accompanied by a change in the gene expression in the injured tissues. Interestingly, although the expression levels of many genes had not changed, the expression levels of some of the genes in the DRG samples did change (see ECM-related genes in Tables 6 and 7, and see pain-related molecule genes in Table 9). However, it should be noted that there were many cases where significant changes in gene expression occurred in the one-week DRG samples. It should be also noted that higher gene expression levels of pain-related molecules were detected in DRGs, although there were no remarkable changes in the gene expression levels of DRGs after the injury. These data suggest that DRGs can function to mediate neuronal pulse and signals between the peripheral nerve system in the injured tissues and the brain CNS without long-term gene expression changes.
The results obtained in this study indicate that hundreds of genes are involved in and interacted with to result in chronic pain and hyperalgesia, which are caused by tissue fibrosis. Recently developed computer-based comprehensive analyses, such as bioinformatics,57,58 may delineate possible signaling pathways and functional molecules implicated in the above phenomena. In addition, the information gathered may be used to conduct further studies using genetically modified mice, including gene-targeting mice.
Before concluding, it should be noted that we observed similar behavioral and molecular changes in some samples after the sham operations. These changes were significant, albeit less than the changes observed in the operation group, and suggest that the insertion of a 19G needle may itself cause scar formation and chronic pain. Thus, the comparison of the expression levels between the sham and operation groups should be made with prudent consideration. In addition, the gene expression data presented here do not necessarily reflect the protein expression levels. Therefore, protein expressions of the potential genes involved should be confirmed prior to final conclusions.
Supplemental Material
MPX892389 Supplemental Material1 - Supplemental material for Establishment of a mouse model for injury-induced scar formation and the accompanying chronic pain: Comprehensive microarray analysis of molecular expressions in fibrosis and hyperalgesia
Supplemental material, MPX892389 Supplemental Material1 for Establishment of a mouse model for injury-induced scar formation and the accompanying chronic pain: Comprehensive microarray analysis of molecular expressions in fibrosis and hyperalgesia by Yuqiang Li, Hiroki Iida, Koji Kimata, Lisheng Zhuo, Akinobu Ota, Shinya Kimura, Xiaojian Yin, Masataka Deie and Takahiro Ushida in Molecular Pain
Supplemental Material
MPX892389 Supplemental Material2 - Supplemental material for Establishment of a mouse model for injury-induced scar formation and the accompanying chronic pain: Comprehensive microarray analysis of molecular expressions in fibrosis and hyperalgesia
Supplemental material, MPX892389 Supplemental Material2 for Establishment of a mouse model for injury-induced scar formation and the accompanying chronic pain: Comprehensive microarray analysis of molecular expressions in fibrosis and hyperalgesia by Yuqiang Li, Hiroki Iida, Koji Kimata, Lisheng Zhuo, Akinobu Ota, Shinya Kimura, Xiaojian Yin, Masataka Deie and Takahiro Ushida in Molecular Pain
Supplemental Material
MPX892389 Supplemental Material3 - Supplemental material for Establishment of a mouse model for injury-induced scar formation and the accompanying chronic pain: Comprehensive microarray analysis of molecular expressions in fibrosis and hyperalgesia
Supplemental material, MPX892389 Supplemental Material3 for Establishment of a mouse model for injury-induced scar formation and the accompanying chronic pain: Comprehensive microarray analysis of molecular expressions in fibrosis and hyperalgesia by Yuqiang Li, Hiroki Iida, Koji Kimata, Lisheng Zhuo, Akinobu Ota, Shinya Kimura, Xiaojian Yin, Masataka Deie and Takahiro Ushida in Molecular Pain
Footnotes
Acknowledgments
The authors thank Yusuke Ohmichi and Mika Ohmichi, Department of Anatomy, Aichi Medical University for helping them obtain the information necessary to perform this study. The authors appreciate the financial support by Nippon Zoki Company.. The authors would also like to thank Editage (![]() ) for English language editing.
) for English language editing.
Authors’ Contributions
YL and HI contributed to the experiments equally and are listed as cofirst authors, and YL is taking this study forward. TU and KK conceived and coordinated the study and directed the experiments. KK, AO, and LZ wrote and edited the paper. KK and LZ provided technical support for the immunohistochemical and biochemical experiments. AO provided technical information and support for the microarray and contributed to the analysis of the microarray results. MD, XY, and SK evaluated the experiments and the clinical information. All authors reviewed the results and approved the final version of the manuscript.
Declaration of Conflicting Interests
The author(s) declared no potential conflicts of interest with respect to the research, authorship, and/or publication of this article.
Funding
The author(s) disclosed receipt of the following financial support for the research, authorship, and/or publication of this article: This study was supported by a Grant-in-Aid for Scientific Research from Ministry of Education, Culture, Sports, Science and Technology of Japan (No. 15K15557 to T.U., No. 23570148 to K.K.).
Supplemental Material
Supplemental material for this article is available online.
References
Supplementary Material
Please find the following supplemental material available below.
For Open Access articles published under a Creative Commons License, all supplemental material carries the same license as the article it is associated with.
For non-Open Access articles published, all supplemental material carries a non-exclusive license, and permission requests for re-use of supplemental material or any part of supplemental material shall be sent directly to the copyright owner as specified in the copyright notice associated with the article.