
Abstract
Back pain is common and costly. Although lumbar disc degeneration has long been regarded as a major contributor to back pain, how disc degeneration leads to back pain remains unclear. Recent studies observed microglia activation in the spinal cord after disc degeneration, suggesting activated microglia may be involved in discogenic back pain. To determine whether microglia activation participates in disc degeneration-induced back pain, we used a modified disc puncture-induced degeneration-related back pain mouse model to examine the changes in spinal microglia and investigate the potential link between microglia activation and discogenic back pain. In this study, 46 CX3CR1GFP/+ male mice were used in experimental and sham groups. A modified posterolateral retroperitoneal approach was used to expose the L3/L4 disc to induce the needle puncture in the experimental group. Behavioral tests, including grip force and physical function, were used to measure back pain at pre- and postsurgery. The L3 dorsal root ganglions and lumbar spinal cord were obtained at postoperative weeks 1 to 4 followed by immunofluorescence with different antibodies. Micrographs were obtained by confocal microscopy, and morphometric measurements of microglia were analyzed using Imaris. The punctured disc underwent progressive degeneration and mice with disc degeneration showed impaired grip force and physical function. Compared to the control mice, the number of microglia in the lumbar spinal cord was significantly increased in the disc-punctured animals. Moreover, accumulated microglia exhibited larger soma size and lesser ramification in the disc-injured mice. Immunofluorescence demonstrated colony-stimulating factor 1, a cytokine that promotes microglia repopulation, was significantly increased in L3 dorsal root ganglions, whereas its receptor colony-stimulating factor 1 receptor was upregulated on microglia in the disc-injured mice. In summary, lumbar disc puncture caused progressive disc degeneration which induced microglia activation and back pain in mice. Increased colony-stimulating factor 1/colony-stimulating factor 1 receptor signaling is involved in the disc degeneration-induced microglia activation and back pain.
Introduction
Back pain is a worldwide health problem. Back pain-related health care and psychosocial problems are costly, adding a tremendous burden to modern societies. 1 Lumbar disc degeneration is regarded as one of the primary contributors of back pain, particularly for chronic back pain. 2 It is well documented that inflammatory mediators and neurotrophins resulted from disc degeneration, including interleukin-1, brain-derived neurotrophic factor, and nerve growth factors, play a key role in the pathogenesis of back pain.3,4 Yet, how these factors modulate corresponding nociceptive pathway and induce back pain remains unknown.
A reliable animal model is essential for understanding the pathogenic mechanisms of back pain. A commonly used model of back pain is to puncture the lumbar discs in rats, which can lead to disc degeneration and further induce back pain. 5 This procedure was typically performed using a transabdominal approach and surgical disruptions of abdominal organs may lead to gastrointestinal distress and feeding impairment, 6 confounding experimental observations and behavioral assessments. A less invasive approach for disc puncture, therefore, would improve behavioral measurements and facilitate studies on back pain. 7 In addition, most studies used experimental rats. While rats are easy for surgical manipulation, the scarcity of transgenic rats preclude further molecular studies on back pain.8–12 On the other hand, the availability of genetically manipulated mice, which have been widely used for preclinical study of pain models and fit a number of behavioral tests, 13 provides more opportunities to unravel the molecular mechanisms underlying pain. However, surgically inducing disc injury in mice is a challenge, mainly due to the small size of these animals.
Growing evidence indicates that back pain share parallels with neuropathic pain.14,15 Microglia, the tissue-resident immune cells in the central nervous system, play an important role in neuropathic pain by releasing cytokines to promote central sensitization and long-term potentiation in the nociceptive pathway.16–18 Reportedly, a wide range of molecules, including fractalkine, ATP, chemokine (C–C motif) ligand 21, purine substance, and colony-stimulating factor 1 (CSF1), have been involved in microglia activation.19–21 Interestingly, recent studies also observed microglia activation in rodent models of back pain resulting from aging-related disc degeneration.22,23 Yet, the mechanisms underlying disc degeneration-induced microglia activation in back pain remain elusive.
CSF1 is an important cytokine in microglial growth, differentiation, and proliferation. 24 A recent study reported that peripheral nerve injury can quickly upregulate CSF1 in the dorsal root ganglion (DRG) and colony-stimulating factor 1 receptor (CSF1R) in the spinal cord. As both CSF1 and CSF1R involve in microglial proliferation and development, CSF1/CSF1R pathway may be responsible for the activation of microglia in discogenic back pain.
In this study, we modified the surgical approach of lumbar disc puncture to establish a model of back pain in mice with less invasive procedures. Next, we characterized morphological changes in spinal microglia in disc degeneration-induced back pain model. We further found that upregulation of CSF1/CSF1R pathway is involved in the disc degeneration-induced microglia activation in this discogenic back pain model.
Materials and methods
Experimental animals
Forty-six adult male CX3CR1GFP/+ mice (three-month-old, 20–25 g in weight; Jackson Laboratory, Bar Harbor, ME, USA) were used in this study. The CX3CR1GFP/+ mice, which labels the microglia in the central nervous system, allows clearer visualization and better measurement of microglia morphology. 19 Heterozygous transgenic mice were identified according to the protocol. Mice were randomly divided into sham group (N = 21) and disc puncture group (N = 25). Mice were habituated to the environment for at least one week before behavioral assessment. All procedures were approved by the Institutional Animal Care and Use Committee at Zhejiang University and the guidelines of the Committee for Research and Ethical Issues of the International Association for the Study of Pain. 25
Surgical procedure
Mice were anesthetized by an intraperitoneal injection of sodium pentobarbital (0.1 mg/g) and then placed in a right lateral position on a heating pad. The dorsal fur was shaved, and skin was sterilized with 10% iodine tincture solution. Ophthalmic ointment (Lukang Co., China) was used to protect the mouse’s eyes.
Instead of the conventional transabdominal approach, a posterolateral retroperitoneal approach was used to expose the lumbar discs. A 1-cm longitudinal incision, which is 1 cm apart from the lumbar spine, was made between the left 13th rib and iliac wing (Figure 1(a)). Subcutaneous soft tissues were dissected to identify the junction of paraspinal muscles and external abdominal oblique (Figure 1(b)). The intermuscular space was expanded, and abdominal muscles were retracted anteriorly to expose retroperitoneal space. The aorta abdominalis and psoas, which overlie the lumbar spine, were then exposed. The bifurcation of aorta abdominalis typically lays in front of L4 vertebra and iliac vessels cross the ventral surface of the psoas major (Figure 1(c)). Using forceps tips, bilateral psoae major were slightly detached, and the lumbar discs and vertebrae were exposed.

A modified posterolateral retroperitoneal approach was used to perform lumbar disc puncture: (a) Surgical field was sterilized, and palpable bony landmarks were outlined. A 1-cm longitudinal incision (red line) was made along the left side of the spine. (b) The junction of external abdominal oblique muscles (▲) and paraspinal muscles (★) were exposed. The intermuscular space was expanded as appropriate to expose lateral side of the lumbar spine. Care should be taken not to injury the iliac vessels (c). The intervertebral disc (arrow) and diaphragm–vertebra conjunction (*) were exposed (d). Schematic diagram for the custom-made needle used for disc puncture (e): a 25G custom-made needle with a stopper sleeve to restrain the depth in puncture. L3/L4 disc puncture: sagittal view (f) and axial view (g).
Under a surgical microscope (SZX7, Olympus, Japan), the diaphragm–vertebra conjunction at L3 and L4 vertebrae was identified to locate L3/L4 disc (Figure 1(d)). A 25G custom-made needle with a depth limit of 1 mm was used to puncture the L3/L4 disc (Figure 1(e) to (g)). The needle was gently punctured into the disc from the lateral side, with a depth of 1 mm. The needle was rotated 360° and remained in the disc for 30s. 26 After disc puncture, the wound was closed. Mice in the sham group underwent the same surgical exposure of the lumbar discs, but disc puncture was not performed.
Behavioral tests
Back pain in mice can be reflected as behavioral changes that are different from those in classical neuropathic or inflammatory pain models. 27 We used grip force test, tail suspension tests, open-field test, and cold sensitivity test to measure back pain. Schedule for behavioral tests was designed as follows: 8 to 12 a.m. for grip force test, 12 a.m. to 1 p.m. for home cage with food and water, 1 to 4 p.m. for tail suspension and open-field tests, and 4 to 6 p.m. for cold sensitivity test. Behavioral tests were performed two days before disc puncture surgery (baseline), and repeated at postoperative day 3, and weeks 1 to 4.
Tail suspension tests
Tail suspension tests were performed using Magali’s approach. 28 In brief, the mouse was suspended underneath a platform, with its tail attached with adhesive tape. The mouse was first suspended for 2 min to adapt to the suspension position, and then, its behaviors in suspension were recorded with a camera (C615, Webcam, Logitech Inc., Switzerland) for 3 min. The amounts of time spent on immobility, rearing, full extension, and self-supported postures were calculated, respectively, to reflect the degree of back pain. While immobility and full extension indicate resistance to gravity-induced stretching and back pain, rearing and self-supported reflect active escaping behaviors to release stretching-induced back pain. 28
Grip force test
Axial stretch can induce back pain and forelimb grip force in mice with back muscle hyperalgesia is decreased. 29 The forelimb grip force was quantitatively measured using a Grip Force Meter (YS-13A, Dichuang, Luowei Biotech Inc., China). The mouse was adapted on the device for 2 min before each test. A researcher gently lifted the mouse’s tail and passed the mouse over mental bars in the device. The mouse would grab mental bar with its forelimbs to resist dragging but release the bar when the dragging force reaches its threshold. The meter measures the peak force of forelimb grip at the point of release. Each mouse was repeatedly measured for three times at a 3-min interval, and measurements were averaged for analysis.
Open-field test
Open-field test was used to measure the mouse’s physical function. 30 An enclosed box with square bottom (45 cm × 45 cm) and white walls (40 cm in height) was used as a test room. The room was dim, with a 30 Lux light. The mouse’s movement was monitored for 5 min using a camera (C615, Webcam, Logitech Inc., Switzerland). Video was then analyzed using AnyMaze software (Anymaze Technology SA, Stoelting Co., IL, USA) to acquire walking distance.
Cold sensitivity test
Cold sensitivity test was modified from Karashima’s method 31 and was used to measure cold hyperalgesia resulting from back pain. Using a custom-made thermal insulation box and icy water (3°C), the mouse was put on the top of the box which directly interfaces icy water. Cold stimulation will drive the mouse to lift or lip its hind paws. The latency time to positive reactions was recorded to indicate cold sensitivity. Tests were performed three times at a 10-min interval, and measurements were averaged for analysis.
Histological analysis of the disc
At different time points (before and one to four weeks after disc puncture), mice were anaesthetized and perfused with normal saline solution and 4% paraformaldehyde. Tissues of the lumbar spine, spinal cord, and DRGs were collected. The spines were postfixed in 4% paraformaldehyde for 8 h and were decalcified using 10% ethylene diamine tetra-acetic acid for 36 h. After decalcification, spinal segments were extracted and dehydrated in 30% sucrose solution and embedded in optimum cutting temperature compound (Tissue-Tek, Sakura, USA). Axial or coronal sections in 8 µm thickness were acquired using a freezing microtome (CM1850UV, Leica, GER). Histological sections were stained with hematoxylin and eosin (H&E) (G1120, Solarbio, China) using standard protocols and examined under a microscope (BX53, Olympus, Japan). The arrangements of annular fibrosus and nucleus pulposus, cell clusters, and disc space were assessed.
Quantification and morphometric analysis of microglia cells
Spinal cords were collected before (naïve) and at postoperative weeks 1 to 4. With reference to an atlas, 32 the L3 spinal cords were cut axially with a thickness of 35 µm using a microtome. Three tissue sections from each L3 spinal cord were collected and imaged using the confocal microscopy (FV1200, Olympus, Japan). Three observational fields (medial, lateral, and central fields) of 10,000 µm 2 at dorsal horn were defined with Image-Pro Plus (5.0, Media cybernetics, Silver Spring, MD, USA) using Yasui’s approach. 33 The dorsal horn was further divided into superficial (laminae I and II) and deeper (laminae III and IV) layers, and microglia number was quantified for each layer.
Morphometric analysis of microglia
Morphometric analysis of the microglia was performed using Imaris (V7.2.2, Bitplane, Zurich, Switzerland), and the domain region and complexity of microglia were measured using a Sholl analysis model. 34 Morphometric measurements of microglia include volume of the soma, average length of microglial process (the radial distance to the microglial soma), shape index (the ratio between the maximal length and the projection area of the soma), and Sholl analysis of process intersectional number and microglial domain range, as relative to a standard distance (1 µm).
Immunofluorescence in DRGs and spinal cords
We collected the L3 DRGs and L3 lumbar spinal cords at postoperative week 2. After fixation and dehydration, antigen retrieval of slices was carried out using sodium citrate buffer. Then, the slices were permeabilized with 0.05% Triton X-100 in Tris-buffered saline, blocked with 100 mM glycine for 30 min at room temperature. Tissue sections were subsequently incubated with calcitonin gene-related peptide (CGRP) antibody (1:500, Abcam, Cambridge, MA, USA), CSF1 antibody (1:500, R&D systems, Minneapolis, MN, USA), CSF1R antibody (1:1000, Santa Cruz Biotechnology, Dallas, TX, USA), GFP antibody (1:2000, Abcam), neuronal marker NeuN antibody (1:400, R&D systems), and astrocyte marker glial fibrillary acidic protein antibody (1:800, Agilent, Santa Clara, CA, USA), respectively. After all the sections were incubated with first antibody overnight at 4°C, fluorophore-coupled secondary antibodies were performed with Alexa Fluor 488 IgG (1:1000, Invitrogen, San Diego, CA, USA), or Alexa Flour 555 IgG (1:1000, Invitrogen) for 1 h at room temperature. Slides were evaluated under confocal microscopy.
Statistical analysis
Statistical analysis was performed using STATA (Version 12.0, StataCorp, College Station, TX, USA). Data were presented as means ± standard error of mean. Distribution normality was examined using Kolmogorov–Smirnov test. T tests were used to compare behavioral, numbers, and morphological measurements of microglia between sham and puncture groups. Based on the normality of data, one-way analysis of variance (ANOVA) or Kruskal–Wallis ANOVA on ranks were used for multiple comparisons.
Results
Disc puncture induces progressive disc degeneration in mice
We used a posterolateral retroperitoneal approach to expose and puncture the lumbar discs. Following the surgery, we rarely observed visceral discomfort in the mice as seen in the ventral surgical approach. We then carried out the H&E staining to assess the histological changes in the disc. The nucleus pulposus was bulged right after disc puncture, through the annulus breach (Figure 2(a)), followed by annulus loosening and disc space narrowing over time from postoperative weeks 1 to 4 (Figure 2(b)). At postoperative week 4, the annulus was distorted and disorganized, and there was more metaplasia of nucleus cells to chondrocyte-like cells in the punctured disc than in the sham disc (Figure 2(c)). Overall, needle puncture induced progressive disc degeneration.

Histological changes in the disc following puncture. (a) Axial sections of a normal disc and a punctured disc were observed immediately right after surgery (▲ nucleus pulposus; ★ annulus fibrosus; arrow: puncture point; scale bar 200 µm). (b) Needle puncture induced progressive degenerative changes in the intervertebral disc, including annulus disruptions, loss of nucleus pulposus, disc space narrowing, and chondrocyte proliferation (coronal section, scale bar 100 µm). (c) The normal disc constitutes organized nucleus cells and collagen laminae. There were more fibers and remarkable clusters of chondrocyte-like cells in a punctured disc at postoperative week 4 (coronal sections, scale bar 50 µm).
Puncture-induced disc degeneration causes back pain in mice
We further assessed whether disc degeneration causes back pain by different behavioral tests. In the tail suspension tests, mice with punctured disc spent significantly less time in immobility and full extension positions than the sham mice (Figure 3(a), i and ii). However, mice with disc puncture spent more time in rearing their bodies, suggesting more gravity-induced axial pain in this group than the control (Figure 3(a), iii). No difference in self-supported time was observed between the sham and disc puncture groups (Figure 3(a), iv). Starting from postoperative week 1 until the termination of the study (week 4), disc-punctured mice showed less resistance to stretch than the sham mice in the grip force test (Figure 3(b)).

Back pain behavioral tests. (a) Tail suspension tests: mice in disc puncture group spent less time in immobility (i) and full extension postures (ii) but more time in rearing posture (iii), as compared to mice in the sham group. There was no difference in time of self-supported posture between the two groups (iv). Resistant force to stretching (b) was impaired and physical functions (c) decreased in mice underwent disc puncture. (d) No difference in latency time to cold stimuli was observed between two groups. (N = 7 in sham group, N = 11 in puncture group, *P < 0.05; **P < 0.01).
Mice suffering from axial pain retrain their motor activity. To further examine whether disc puncture results in back pain as reflected by reduced mobility, we conducted the open-field test. Three days after the surgery, animals in both groups showed reduced motor activity, with the disc-punctured group exhibiting significantly reduced motility. By first week, the motor activity was recovered in the sham group, whereas the punctured group remains significantly reduced motor activity until full recovery at the fourth week after the surgery (Figure 3(c)). There was no significant difference in cold withdrawal latency time between the sham and puncture groups (Figure 3(d)). Together, these data suggest that the disc injury-induced disc degeneration leads to sustained back pain (up to four weeks) in mice.
Changes in microglia in the spinal cord
To examine whether microglia activation might be involved in the disc injury-induced back pain model, spinal cord slices (L3) were prepared and the number and morphology of microglia were assessed by fluorescent microscopy. One week after disc puncture, microglia started to gather in the dorsal horns of the spinal cord and microglia clustering reached a peak at week 2, followed by, then gradual reduction at later stages (weeks 3 and 4) (Figure 4). Analysis of a longitudinal section of the spinal cord at postoperative week 2 revealed that microglia were accumulated in the lumbar spinal cord but not in the thoracic spinal cord (Figure 5), suggesting that microglia activation induced by lumbar disc degeneration was confined and specific to the lumbar spinal cord.

Microglial activation in the L3 dorsal horn (outlined with dashed lines) over time. (a) The number of microglia increased at postoperative week 1 and reached a peak at postoperative week 2. Thereafter, it gradually dropped but remained increased four weeks after disc puncture surgery, as compared to the baseline. No significant microglia activation was observed in the sham mice (scale bar 100 µm). (b) Changes in microglial density at superior layer of dorsal horn after disc puncture surgery (three-dimensional reconstructions scale bars, x = 20 µm, y = 20 µm, z = 35 µm).
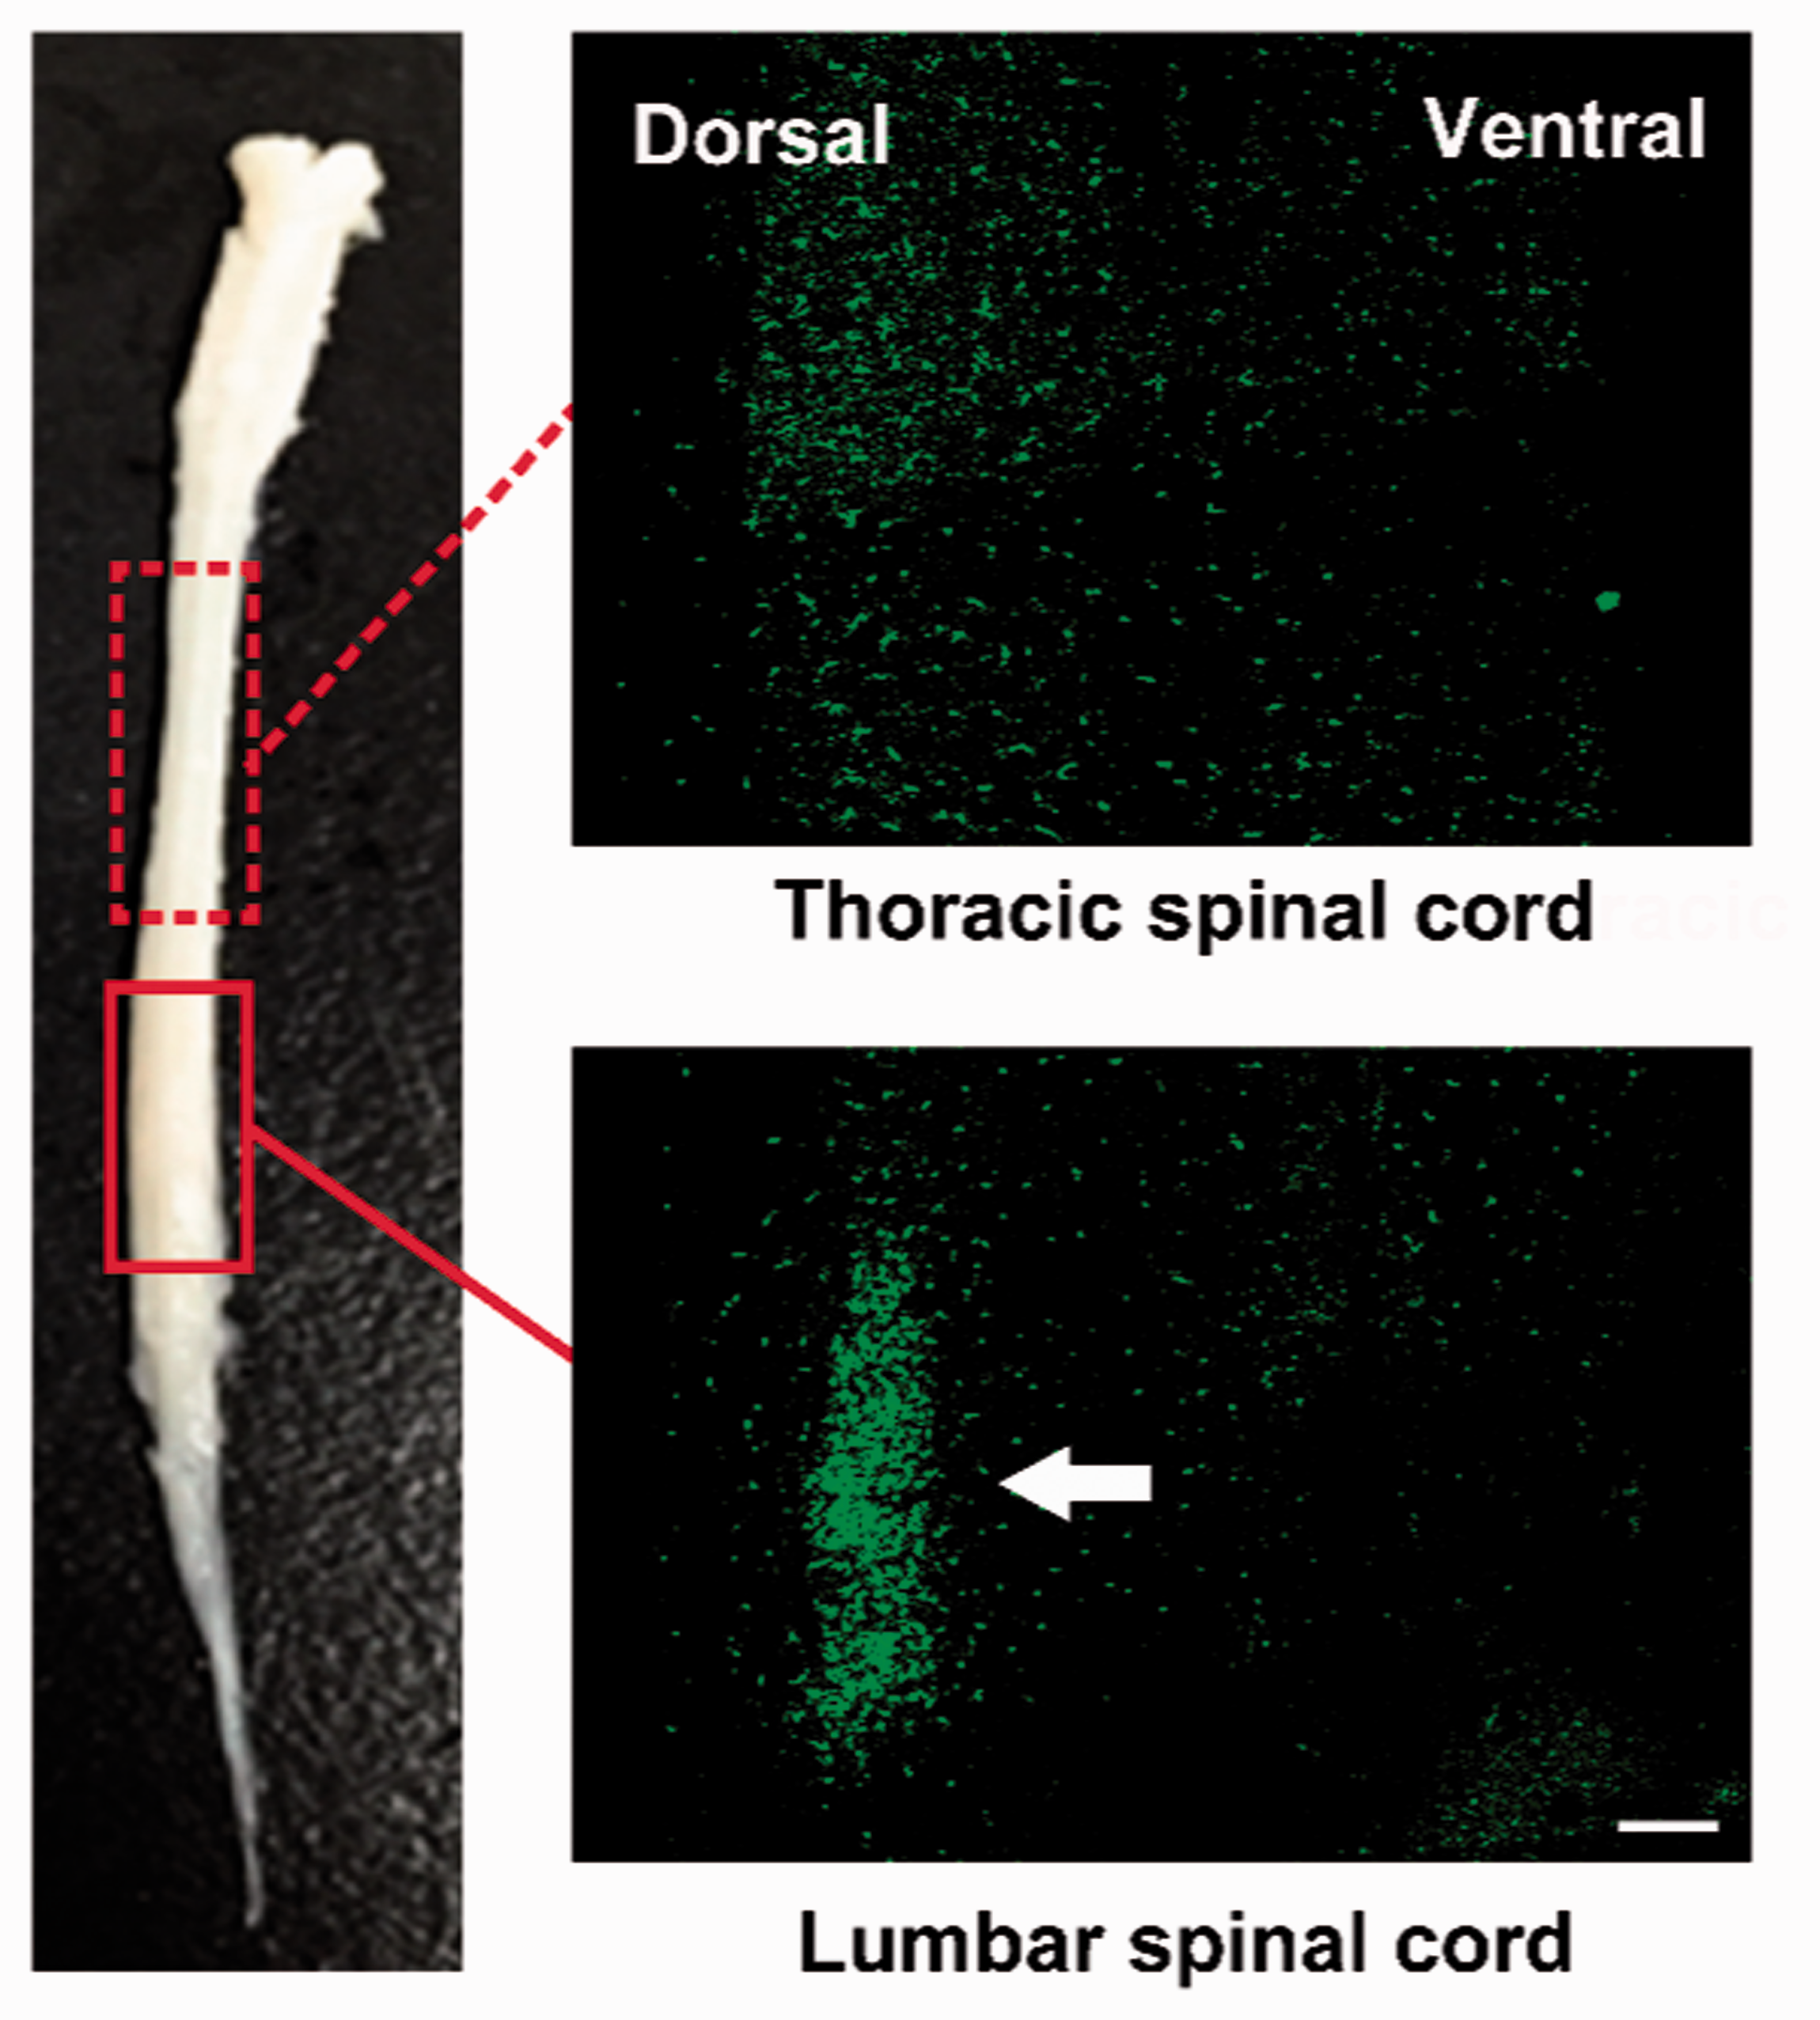
A full spinal cord and its sagittal sections two weeks after L3/L4 disc puncture. Microglia accumulated in the dorsal horn of lumbar spinal cord (arrow) but not in the thoracic spinal cord (dashed box: thoracic spinal cord; solid box: lumbar spinal cord; scale bar = 200 um).
To further determine the feature of microglia clustering, we quantified the number of microglia and performed morphological analysis of microglia in the designated areas of L3 spinal cord (Figure 6(a)). The number of microglia in the dorsal horn of L3 spinal cord increased dramatically one week after disc puncture and peaked at week 2. At postoperative weeks 3 and 4, the number of microglia slightly dropped but remained at a relatively higher level, as compared to that in the sham group (Figure 6(b)). By dividing the dorsal horn into superficial (I and II laminae) and deeper layers (III and IV laminae), we observed prominent microglia accumulation in the superficial layers from postoperative week 1 to week 4, whereas this phenomenon was only evident at weeks 1 to 2 in the deeper layers (Figure 6(c) and (d)).

Quantification of microglial cells in the dorsal horn of L3 spinal cord. (a) An area of 100 µm ×100 µm at medial, central, and lateral regions of superior and deeper layers of dorsal horn laminae was sampled to quantify microglia. Number of microglial cells in dorsal horn (b), superficial (laminae I and II, c), and deeper layers (laminae III and IV, d). Increased number of microglia was observed in the superficial layer throughout the observation period but only for weeks 1 and 2 in the deeper layer. No significant difference in the number of microglial cells was noted over time in the sham group (N = 3 mice for each group at each time point, *P < 0.05; **P < 0.01).
To further quantify morphological changes in microglia followed disc puncture, microglia were three-dimensionally reconstructed to obtain detailed morphometric measurements using Imaris. Compared to the control group, microglia in the disc puncture group underwent significant morphological alterations (Figure 7 and Supplement (Figure 1), with substantially decreased somatic shape index and process length. Sholl analyses further confirmed that microglia had increased somatic volume, decreased microglial domain, and less process intersections (Figure 7). Overall, our data indicate that microglia in the spinal cord are rapidly activated as demonstrated by the significant deramification upon disc puncture.

Morphometric analyses of microglia in the dorsal horn of L3 spinal cord. (a) Schematic diagram explains somatic shape index. Length (L, µm) is the maximal somatic diameter (black arrow), and area (A, µm2) is the somatic projection area. The round microglia had less shape index than the rod-like microglia. (b) Compared with these in sham group, microglia in disc puncture mice had less somatic shape index at postoperative weeks 1 to 3 but not at week 4. In disc puncture mice, the length of microglial process decreased throughout the observation period (c) and microglial somatic volume significantly increased at postoperative weeks 1 to 3 but not at week 4 (d). (e) Three-dimensional Sholl analysis. The degree of microglial ramification was measured by counting the process intersections (arrows). The encompassing radius indicated the ranges of microglial domain. (f) The number of microglial intersections and the radius of microglial domain at each postoperative time point. Microglia in disc puncture group exhibited less domain range at weeks 1 and 2 (g) and less number of process intersections at postoperative weeks 1 to 3 (h) (N = 9 cells from three mice per group at each time point, *P < 0.05; **P < 0.01).
Upregulated CSF1/CSF1R in the model correlates with microglia activation
To further investigate the mechanisms underlying disc degeneration-induced microglia activation, L3 DRGs and lumbar spinal cords were collected at postoperative week 2 when microglia activation was most prominent. Immunostaining analysis revealed that CSF1 was expressed in the L3 DRG neurons that coexpressed CGRP, a marker of small size peptidergic nociceptive neurons (Figure 8), whereas no CSF1 expression was detected in the DRG neurons from the sham mice. Staining of CSF1R revealed restricted distribution on microglia (Figure 9), suggesting that DRG neuron derived CSF1 signaling can activate microglia in the spinal cord in the back pain model.

Expression of CSF1 in CGRP positive neurons in L3 DRG at two weeks after L3/L4 disc puncture (scale bar = 50 µm). CSF1: colony-stimulating factor 1; CGRP: calcitonin gene-related peptide.

CSF1R colocalizes with microglia in the dorsal horns (outlined with dashed lines) of L3 spinal cord. (a) CSF1R was markedly upregulated in disc puncture mice and showed complete overlap of GFP the microglial marker. (b) Upregulated CSF1R in disc puncture mice was not colocalized with neural maker (NeuN) and astroglial marker (GFAP). Yellow square indicates enlarged region (samples were harvested at postoperative week 2, scale bar = 50 µm). CSF1R: colony-stimulating factor 1 receptor; GFAP: glial fibrillary acidic protein; GFP: green fluorescent protein; NeuN: neuronal nuclei.
Discussion
Using a modified surgical approach for lumbar disc puncture, this study established a mouse model of back pain. Disc puncture can trigger progressive disc degeneration and induce back pain in mice, including weakened grip force to resist stretching, reduced tolerance of gravity-induced stretching, and impaired physical function. In addition, disc degeneration led to accumulation and activation of microglia in lumbar spinal cord, particularly in the superficial layer of dorsal horn. Activation of microglia, which persists for two to four weeks after disc puncture, was in accordance with back pain-related behaviors in mice, suggesting that microglia activation play an important role in the pathogenesis of discogenic back pain. Disc puncture and consequent disc degeneration induced upregulation of CSF1 in the sensory neurons of DRGs and CSF1R in spinal microglia, suggesting that upregulated CSF1 signaling is an important pathway underlying disc degeneration-induced microglia activation.
Although disc degeneration has long been regarded as a major cause of back pain, to date, there is no commonly accepted animal model for back pain research, and thus, molecular mechanisms of back pain remain largely unknown. Back pain is difficult to replicate in animals, and measurement and interpretation of back pain are even more challenging. 27 The vast majority of back pain models were established by inducing disc degeneration in rats, 35 such as aging-related disc degeneration model of sand rats 36 and needle puncture-induced disc degeneration model of rats. 26 Lumbar disc puncture in rats is the most commonly used model; however, the disc puncture was performed through a transabdominal approach, which may result in abdominal pain and postoperative gastrointestinal distress, confounding behavioral assessments of back pain. 6 Recently, studies have used gene knockout mice to mimic back pain.30,37 In the present study, we used a less invasive posterolateral approach to perform disc puncture with less interruptions of abdominal organs, less feeding problems, and quicker recovery from the surgery and thus improved back pain assessments.
Back pain evaluation is challenging even in human beings. Although a number of behavioral tests are commonly used to assess pathologic pain in animals of peripheral nerve injury, only a few can be used to assess axial back pain. For example, reportedly mechanical allodynia in foot is common in rat models of back pain, yet barely can it be noticed in patients with back pain. 38 Recently, grip force test and tail suspension test, which are based on the phenomenon that rodents suffering from back pain tended to avoid stretching, were validated to measure back pain in rodents.27,28 As these tests have reasonable sensitivity and specificity,27,30,39 we used these assays to measure the back pain in our models.
Behavioral changes observed after disc puncture suggested that disc degeneration can induce back pain in mice. Impaired grip force was observed as early as one week after disc puncture and remained for three to four weeks thereafter. In addition, mice underwent disc puncture significantly spent less time in immobility and full extension postures but more time in rearing itself up to alleviate gravity-induced back pain, as compared with sham mice. Given the validity 27 and similarity of these tests to clinical back pain symptoms, 28 stretching-induced discomfort, as observed in this study, suggested that disc puncture and resultant disc degeneration led to back pain. On the other hand, physical function was also significantly impaired in mice underwent disc puncture. Yet, there was no difference in cold sensitivity test between mice with and without disc puncture. Clinically, back pain mainly involves the lower portion of the back, typically without radiating pain that goes down the feet.40,41 This back pain model, therefore, is different from other models of radicular pain or peripheral nerve injury model which is with impaired cold hypersensitivity in the hind paws.
Microglia has been extensively studied in the neuropathic or inflammatory pain models, and microglia activation is regarded as a key step in the pathogenesis of chronic pain. 42 To date, however, the role of microglia in back pain remains less studied. In this study, we observed microglia accumulated in the superficial layer (laminae I and II) of dorsal horn of the lumbar spinal cord. Laminae I and II contain fibers from the nociceptive DRG neurons and are important for nociceptive signal transduction.4,35,43 It has been shown that activated microglia release cytokines and neurotrophic factors to sensitize the nociceptive pathway that leads to hypersensitivity of pain. Prominent microglia activation in our model suggests that microglia may promote the pathogenies of back pain through the central sensitization.
Little is known on the mechanism underlying disc degeneration-induced microglia activation. Studies have proposed that excitatory signals from the disc, triggered by inflammatory factors resulted from disc degeneration, may activate microglia in the spinal cord.22,44,45 In this study, we found that CSF1, a key signal for microglia proliferation and activation, was significantly upregulated in the CGRP-positive sensory neurons in the disc degeneration groups. Our data thus provide the evidence that disc degeneration leads to elevation of CSF1 in DRG, which leads to microglia activation in the spinal cord. The increased CSF1 signaling in the back pain model is in accordance with the recent report that CSF1 signaling is involved in the nerve injury-induced neuropathic pain model, suggesting that back pain share some common regulatory machinery with neuropathic pain.
There are some limitations in the study. While lumbar disc degeneration is a chronic process, disc puncture-induced disc degeneration in mice may not be able to fully imitate that in human. Instead of specific biomarkers, we used a diagram to define layers of the dorsal horn. Although a number of behavioral tests were used to measure back pain, none is specific for discogenic back pain. Better measures of back pain are expected to further study back pain using animal models.
Conclusions
This study demonstrated that lumbar disc puncture in adult mice led to progressive lumbar disc degeneration, microglia activation in the spinal cord, and resulted in behavioral signs of back pain. This convenient mice model of back pain can be used for further study of back pain. Our study also demonstrate that CSF1/CSF1R signaling contributes to disc degeneration-induced microglia activation, which may further alter neuroplasticity of central nervous system. Targeting the CSF1 signaling to suppress microglia activation and related inflammation might be a promising strategy to alleviate back pain. Our findings provide new insights in understanding the mechanism of discogenic back pain.
Supplemental Material
Supplemental material for Implication of microglia activation and CSF-1/CSF-1Rpathway in lumbar disc degeneration-related back pain
Supplemental Material for Implication of microglia activation and CSF-1/CSF-1Rpathway in lumbar disc degeneration-related back pain by Ge Yang, Lunhao Chen, Zhihua Gao and Yue Wang in Molecular Pain
Footnotes
Acknowledgments
We would like to thank Prof. Shumin Duan for his generous support. We are grateful to Bin Zhang, Fan Men, Yalin Hu, Zhenjie Zhang, Huifang Lou, Dr.Yijun Liu and Daxiao Chen for technical assistance.
Author Contributions
YW and ZG designed the study. GY and LC performed the biochemical and behavioral experiments. GY analyzed the data. GY, LC, ZG, and YW wrote the manuscript. All authors read and approved the final manuscript.
Declaration of Conflicting Interests
The author(s) declared no potential conflicts of interest with respect to the research, authorship, and/or publication of this article.
Funding
The author(s) disclosed receipt of the following financial support for the research, authorship, and/or publication of this article: This study was supported by Science Technology Department of Zhejiang Province (General non-profit Project, 2016C33G2011213), National Natural Science Foundation of China (NSFC 81772382, 31471308) and the Fundamental Research Funds for the Central Universities, Grant No. 2017FZA7003.
Supplemental Material
Supplemental material for this article is available online.
References
Supplementary Material
Please find the following supplemental material available below.
For Open Access articles published under a Creative Commons License, all supplemental material carries the same license as the article it is associated with.
For non-Open Access articles published, all supplemental material carries a non-exclusive license, and permission requests for re-use of supplemental material or any part of supplemental material shall be sent directly to the copyright owner as specified in the copyright notice associated with the article.