
Abstract
Nociceptive signals originating in the periphery are conveyed to the brain through specific afferent and ascending pathways. The spino-(trigemino-)parabrachio-amygdaloid pathway is one of the principal pathways mediating signals from nociception-specific ascending neurons to the central amygdala, a limbic structure involved in aversive signal-associated emotional responses, including the emotional aspects of pain. Recent studies suggest that the right and left central amygdala play distinct roles in the regulation of nociceptive responses. Using a latent formalin inflammatory pain model of the rat, we analyzed the right–left differences in synaptic potentiation at the synapses formed between the fibers from the lateral parabrachial nucleus and central amygdala neurons as well as those in the c-Fos expression in the lateral parabrachial nucleus, central amygdala, and the basolateral/lateral amygdala after formalin injection to either the right or left side of the rat upper lip. Although the single-sided formalin injection caused a significant bilateral increase in c-Fos-expressing neurons in the lateral parabrachial nucleus with slight projection-side dependence, the increase in the amplitude of postsynaptic excitatory currents and the number of c-Fos-expressing neurons in the central amygdala occurred predominantly on the right side regardless of the side of the inflammation. Although there was no significant correlation in the number of c-Fos-expressing neurons between the lateral parabrachial nucleus and central amygdala in the formalin-injected animals, these numbers were significantly correlated between the basolateral amygdala and central amygdala. It is thus concluded that the lateral parabrachial nucleus-central amygdala synaptic potentiation reported in various pain models is not a simple Hebbian plasticity in which raised inputs from the lateral parabrachial nucleus cause lateral parabrachial nucleus-central amygdala potentiation but rather an integrative and adaptive response involving specific mechanisms in the right central amygdala.
Keywords
Introduction
Chronic pain is characterized by neuroplastic changes in cerebral networks. 1 In animal models of chronic pain, such changes are reported in various structures composing the “pain neuromatrix,” which includes the anterior cingulate cortex, 2 somatosensory, 3 thalamus, 4 accumbens nucleus, 5 insular cortex, 6 medial prefrontal cortex,7,8 and central amygdala (CeA) (reviewed in Neugebauer 9 and Veinante et al. 10 ). The synaptic plasticity in the CeA is of particular interest because this nucleus is strategically well situated to directly link nociception and emotion for the following four reasons. First, the CeA receives direct nociception-related information from the lateral parabrachial nucleus (LPB) on the same side, to which about 95% of the ascending neurons in the superficial layer of the L5 dorsal horn of rats send principal or collateral projections.11,12 The LPB-CeA projections, especially those targeting the capsular part of the CeA (CeC), are excitatory and monosynaptic.13,14 These projections are thus involved in the excitation of most CeC neurons in response to noxious stimulation.15,16 Second, this LPB-CeC connection plays an essential role in aversive signal-induced emotional learning,17,18 indicating that this projection carries aversive information to the CeC. Third, the excitatory synaptic transmission at the LPB-CeC synapse undergoes potent and robust potentiation in various types of semi-acute to chronic pain models, such as those of arthritis pain, 9 visceral pain, 19 muscle pain, 20 nerve injury-associated neuropathy, 21 and painful diabetic neuropathy. 22 Finally, the number of neurons expressing activity- and plasticity-dependent markers (such as c-Fos and phosphorylated extracellular-signal regulated kinase (pERK)) are increased in the CeA of such chronic pain models at various time points.23–26 It is thus likely that the chronic pain-induced activation and subsequent plastic changes in the LPB and CeA networks provide the basis for the progressive pain-related alterations in the emotion-related networks. 27
An intriguing characteristic with regard to this chronic pain-induced plasticity in the CeA is its right hemisphere predominance. For example, unilateral hindpaw injection of formalin, an established model of inflammatory pain, increases the number of cells expressing c-Fos and pERK only in the right CeA, irrespective of the side of injection.23,26,28 Neuronal responses to sensory stimulation are enhanced only in the right CeA in anesthetized rats with arthritis pain in either side of the hind limb. 29 The bilaterally appearing tactile hypersensitivity after formalin injection to either side of the hindpaw is significantly attenuated by an injection of mitogen-activated protein kinase (MAPK) inhibitor into the right CeA but not to the left CeA. 28 Alternatively, hemispheric pharmacological activation of ERK or metabotropic glutamate receptors (mGluRs) alone in the right CeA of naïve animals is sufficient to elicit hypersensitivity in the bilateral hindpaw.23,25 These accumulated lines of evidence point to specific mechanisms underlying specific pain-related hemilateral activation in the right CeA.
Here, we analyzed the left-to-right difference in (1) the LPB-CeC synaptic potentiation and (2) the expression of c-Fos protein in the LPB, CeA, and basolateral amygdala (BLA) in “latent inflammatory pain” models 3 to 6 h after formalin injection to either side of the face. Formalin causes neuropathic pain-like symptoms lasting a few hours to a few weeks after the initial nocifensive behavior when injected to foot pad.30–36 This would also be the case for the orofacial injection and, in addition, the projections from the caudal part of the spinal trigeminal nucleus (SpVc), which receives nociceptive inputs from the maxillary trigeminal nerve, to the LPB are essentially bilateral. 37 These specificities would allow us to explore the lateralization in the activation of parabrachio-amygdaloid pathways.
Methods
The animal manipulation was approved by the Institutional Animal Care and Use Committee of Jikei University (approval number 2016-011, 2016–066 and 2017–008) and conformed to the Guidelines for Proper Conduct of Animal Experiments of the Science Council of Japan (2006) and to the guidelines of the International Association for the Study of Pain. 38
Animals
Male adult Wistar rats (7–9 weeks old) were purchased from Japan SLC Inc. (Hamamatsu, Japan) and housed on a 12-h light/dark cycle. Food and water were freely accessible. The animals were handled daily from three days before the formalin injection.
Inflammatory pain model and its evaluation
After acclimation to a Plexiglas observation chamber for about 30 min, rats were anesthetized with 5% isoflurane (in room air). Immediately after loss of the righting reflex, rats were injected with 50 μL of 5% formalin (37% formaldehyde solution (Nacalai, Kyoto, Japan) diluted with saline (0.9% NaCl)) into either the left or right upper lip (“left injection” or “right injection”, respectively, throughout the text) with a microsyringe with a 30-gauge needle attached. 39 “Saline” groups received an equal volume of the saline into the left or right upper lip. Immediately after the injection, each rat was returned to the observation chamber. The behavior of the rats was monitored and recorded using a web camera (Logicool HD Webcam C525, Tokyo, Japan) up to 45 to 60 min (see Figure 1 for the detail) following the injection and captured on a PC with time stamps for later analysis. Off-line analysis was performed to evaluate the time spent in face rubbing, a typical spontaneous nocifensive behavior observed after orofacial formalin injections, 39 using a handheld time counter by a researcher. The total time spent in rubbing behavior within 3-min windows was calculated. After video capturing for <60 min, rats were returned to the home cage with free access to food and water.

Spontaneous nocifensive behavior and facial swelling after formalin injection to the unilateral upper lip. (a) Summary of the time course of spontaneous nocifensive behavior (face rubbing) after an injection of 5% formalin (red) or saline (blue) to either the left (circle) or right (triangle) upper lip. The total time spent exhibiting nocifensive behavior within every 3-min window is pooled. The face rubbing time of formalin-injected rats (red circles: 0–45 min, n = 27; 45–60 min, n = 4; red triangles: 0–45 min, n = 15; 45–60 min, n = 5) was significantly longer than that of rats injected with saline (blue circles: 0–45 min, n = 28; 45–60 min, n = 4; blue triangles: 0–45 min, n = 15; 45–60 min, n = 4). 0–3 min, F(3,81) = 2.957; 3–6 min, F(3,81) = 6.571; 6–9 min, F(3,81) = 4.064; 9–12 min, F(3,81) = 6.480; 12–15 min, F(3,81) = 6.600; 15–18 min, F(3,81) = 7.383; 18–21 min, F(3,81) = 8.047; 21–24 min, F(3,81) = 8.587; 24–27 min, F(3,81) = 17.95; 27–30 min, F(3,81) = 11.13; 30–33 min, F(3,81) = 13.00; 33–36 min, F(3,81) = 13.49; 36–39 min, F(3,81) = 5.596; 39–42 min, F(3,81) = 2.461; 42–45 min, F(3,81) = 1.998; 45–48 min, F(3,14) = 1.229; 48–51 min, F(3,14) = 0.712; 51–54 min, F(3,14) = 1.138; 54–57 min, F(3,14) = 1.061; 57–60 min, F(3,14) = 1.210; *P < 0.05; **P < 0.01; ***P < 0.001 between formalin- and saline-injected left upper lip groups; #P < 0.05; ##P < 0.01; ###P < 0.001 between formalin- and saline-injected right upper lip groups; one-way ANOVA followed by a post hoc Gabriel test. Mean ± SEM. (b) Typical photographs of ipsilateral swelling caused by unilateral formalin-induced inflammation. The photographs were taken in the supine position under anesthesia 6 h after 5% formalin (upper panels) or saline (lower panels) injection into the left (left panels) or right (right panels) upper lip. Arrowheads indicate the injected side. The scale bar in the top left panel indicates 5 mm. (c) The edema size ratio after unilateral formalin injection. The ratio was calculated based on the measured area of the face in the photograph (area of the injection side/that of the non-injected-side; see “Methods” section). ***P < 0.001 between saline- and formalin-injected rats; Mann–Whitney U test (U = 17.0 and U=0.0 for left and right injections, respectively). Left and right panels show the edema size ratio from the rats with left (formalin, n = 23; saline, n = 24) and right (formalin, n = 11; saline, n = 11) upper lip injections, respectively. Horizontal bars indicate the mean in each group.
A photograph of the rat face was taken immediately before the decapitation under deep isoflurane (5%) anesthesia at 6 h after the formalin or saline injection. The rat was placed in the supine position and the mouth was opened by retracting the front teeth toward the rostral direction. A photograph was taken with a digital camera placed approximately 20 cm above the face (see Figure 1(b)). The area of the face superior to the transverse line at the level of the lower teeth ridge was measured using ImageJ (National Institutes of Health; Bethesda, MD) and divided into that left of the midline (“left area”) and right of the midline (“right area”) (Figure 1(c)). Then, left area/right area for the rats with left injection of formalin and right area/left area for right injection were evaluated as indices of edema formation in the injected area.
C-Fos immunostaining and quantification
After acclimation to an observation chamber for about 30 min, rats were injected with formalin or saline into the left upper lip according to the procedure described in the previous subsection. Three hours after the injection, rats were transcardially perfused with ice-cold phosphate-buffered saline (PBS) followed by 4% paraformaldehyde (PFA) in 0.1 M phosphate buffer (pH 7.4) under pentobarbital anesthesia (50 mg/kg, i.p.). After post-fixation in 4% PFA at 4°C overnight, the brain was cryoprotected through a graded series of sucrose replacements (10% for one day and 20% for two to three days in PBS) at 4°C. The brain blocks of the left and the right hemisphere were separately embedded in optimal cutting temperature compound (Sakura Finetek, Tokyo, Japan) and stored at −80°C.
A series of 25-µm-thick coronal sections containing the CeA, BLA, or LPB was prepared with a cryostat (CM1850, Leica Biosystems, Tokyo, Japan). The sections were collected in 0.1 M PBS. Every four sections were used for c-Fos immunohistochemistry. c-Fos immunohistochemistry for free-floating sections was conducted according to a previous report. 40 The sections were incubated with PBS containing 1% (w/v) NaBH4 for 15 min to minimize aldehyde-induced autofluorescence in the tissue. After rinsing in PBS, the sections were incubated in the blocking solution containing 10% (w/v) bovine serum albumin and 0.3% (v/v) Triton X-100 in PBS for 60 min. Subsequently, the sections were incubated for 20 h with a rabbit polyclonal anti-c-Fos antibody (1:10000, Ab-5, Millipore, Burlington, MA) at room temperature. After rinsing in PBS, the sections were incubated in a solution containing goat anti-rabbit Alexa Fluor 488-conjugated secondary antibody (1:1000, A11008, Invitrogen, Carlsbad, CA) for 1 h at room temperature. The sections were mounted on siliconized glass slides and embedded in anti-fade Aqua Poly/Mount (Polysciences, Warrington, PA) on coverslips.
The c-Fos immunostaining was visualized with an upright fluorescent microscope (BX63, Olympus, Tokyo, Japan). Gray-scale (14-bit) images were captured with a c-MOS camera (20× objective lens, 1360 × 1024 pixels; DP80, Olympus) and saved in TIFF format. Numbers of immunoreactive cells were counted according to a previously described method. 41 First, the CeA, BLA, or LPB was carefully trimmed to obtain images containing only the target region. The target regions were defined according to an atlas (see Figures 2(a.1), 2(b.1), 3(a.1), and 3(b.1)). The BLA was defined as the merged region of the basolateral nucleus and lateral nucleus (BLA + lateral amygdala). Then, the signal intensity in each region was normalized so that the darkest point gave the smallest value (= 1) and the brightest point gave the largest value (= 216). Then, these 16-bit images were binarized by using the “maximum entropy threshold” algorithm implemented in ImageJ. Suprathreshold pixels fulfilling the criteria (size, 40–500 pixels; circularity, 0.40–1.00) were considered to be c-Fos-positive cells; these cells were counted by using the “particle analysis” function in ImageJ. Following these automated detections, all results were visually inspected, and under-counting (e.g., overlapping profiles of multiple cells counted as one cell) and over-counting (e.g., erroneous detection of obvious debris) were detected and corrected appropriately.

The number of c-Fos-positive cells was significantly increased on both sides of the LPB in the formalin-injected rat. (a.1 and b.1) Typical images of c-Fos immunohistostaining in the LPB 3 h after injection of formalin or saline into the left (a) and right (b) upper lip. Upper and lower panels show the results from formalin- and saline-injected rats, respectively. The number of c-Fos-positive cells in the LPB (the area surrounded by the white line) was counted (see Figure 2(a.2) and (b.2)). The scale bars indicate 200 µm. (a.2 and b.2) Summary of the number of c-Fos-immunopositive cells in the LPB after formalin or saline injection to the left (a.2) and right (b.2) upper lip. (a.2: F(3,103) = 12.73; formalin-right LPB, 27 slices from four rats; formalin-left LPB, 27 slices from four rats; saline-right LPB, 26 slices from four rats; saline-left LPB, 27 slices from four rats; b.2: F(3,106) = 24.83; formalin-right LPB, 27 slices from four rats; formalin-left LPB, 27 slices from four rats; saline-right LPB, 28 slices from four rats; saline-left LPB, 28 slices from four rats; NS, not significant). *P < 0.05; ***P < 0.001 (one-way ANOVA followed by a post hoc Gabriel test). Each marker indicates the number of c-Fos-positive cells in each slice. The bars indicate the mean number of c-Fos-positive cells in a slice. Four types of markers (circles, squares, upward, and downward triangles) represent data from four different rats. The same marker in Figures 2(a.2), 2(b.2), 3(a.2), 3(b.2), 4, 5(a.1), and 5(a.2) represents data from the same rat. LPB: lateral parabrachial nucleus; MPB: madial parabrachial nucleus; scp: superior cerebellar peduncle; NS: not significantly different.
The spatial distribution of c-Fos-positive cells within the CeA was analyzed after the detection of the c-Fos-expressing neurons as described above. We defined the three subparts within the CeA as zones C, L, and M, each roughly corresponding to CeC, lateral part of the CeA (CeL), and medial part of the CeA (CeM) 42 : zone C, the area within the CeA between the CeA-BLA border and the line parallel to this border at 200-µm distance; zone L, the area between the medial border of zone C and the line starting from the intersection of this border and the ventral border of the CeA at an interior angle of 30 degrees; and zone M, the whole area within the CeA medial to the medial border of zone L.
From the 25-µm-thick slices, representative slices were selected every four slices (i.e., every 100 µm), and the number of c-Fos-positive cells in each selected slice was counted to estimate the number of c-Fos-positive cells/slice (Figure 2(a.2), Figure 2(b.2), Figure 3(a.2), Figure 3(b.2), Figure 5(a.1), and Figure 5(a.2)). For the BLA and CeA, eight selected slices covered the rostrocaudal extent of these nuclei (approximately from −2.04 mm to −2.92 mm to Bregma) and, for the LPB, seven slices covered its extent (approximately from −8.64 mm to −9.36 mm to Bregma). 42 Data from a few LPB slices were excluded from the analysis due to unsuccessful immunostaining by inappropriate embedding. These analyses were performed in 16 rats (4, formalin injection to the right upper lip; 4, to the left; 4, saline injection to the right upper lip; and 4, to the left). The mean number of c-Fos-positive cells/slice in each rat (Figure 5(b)) was calculated based on the count numbers from that rat, with appropriate compensation for the failed LPB slices.
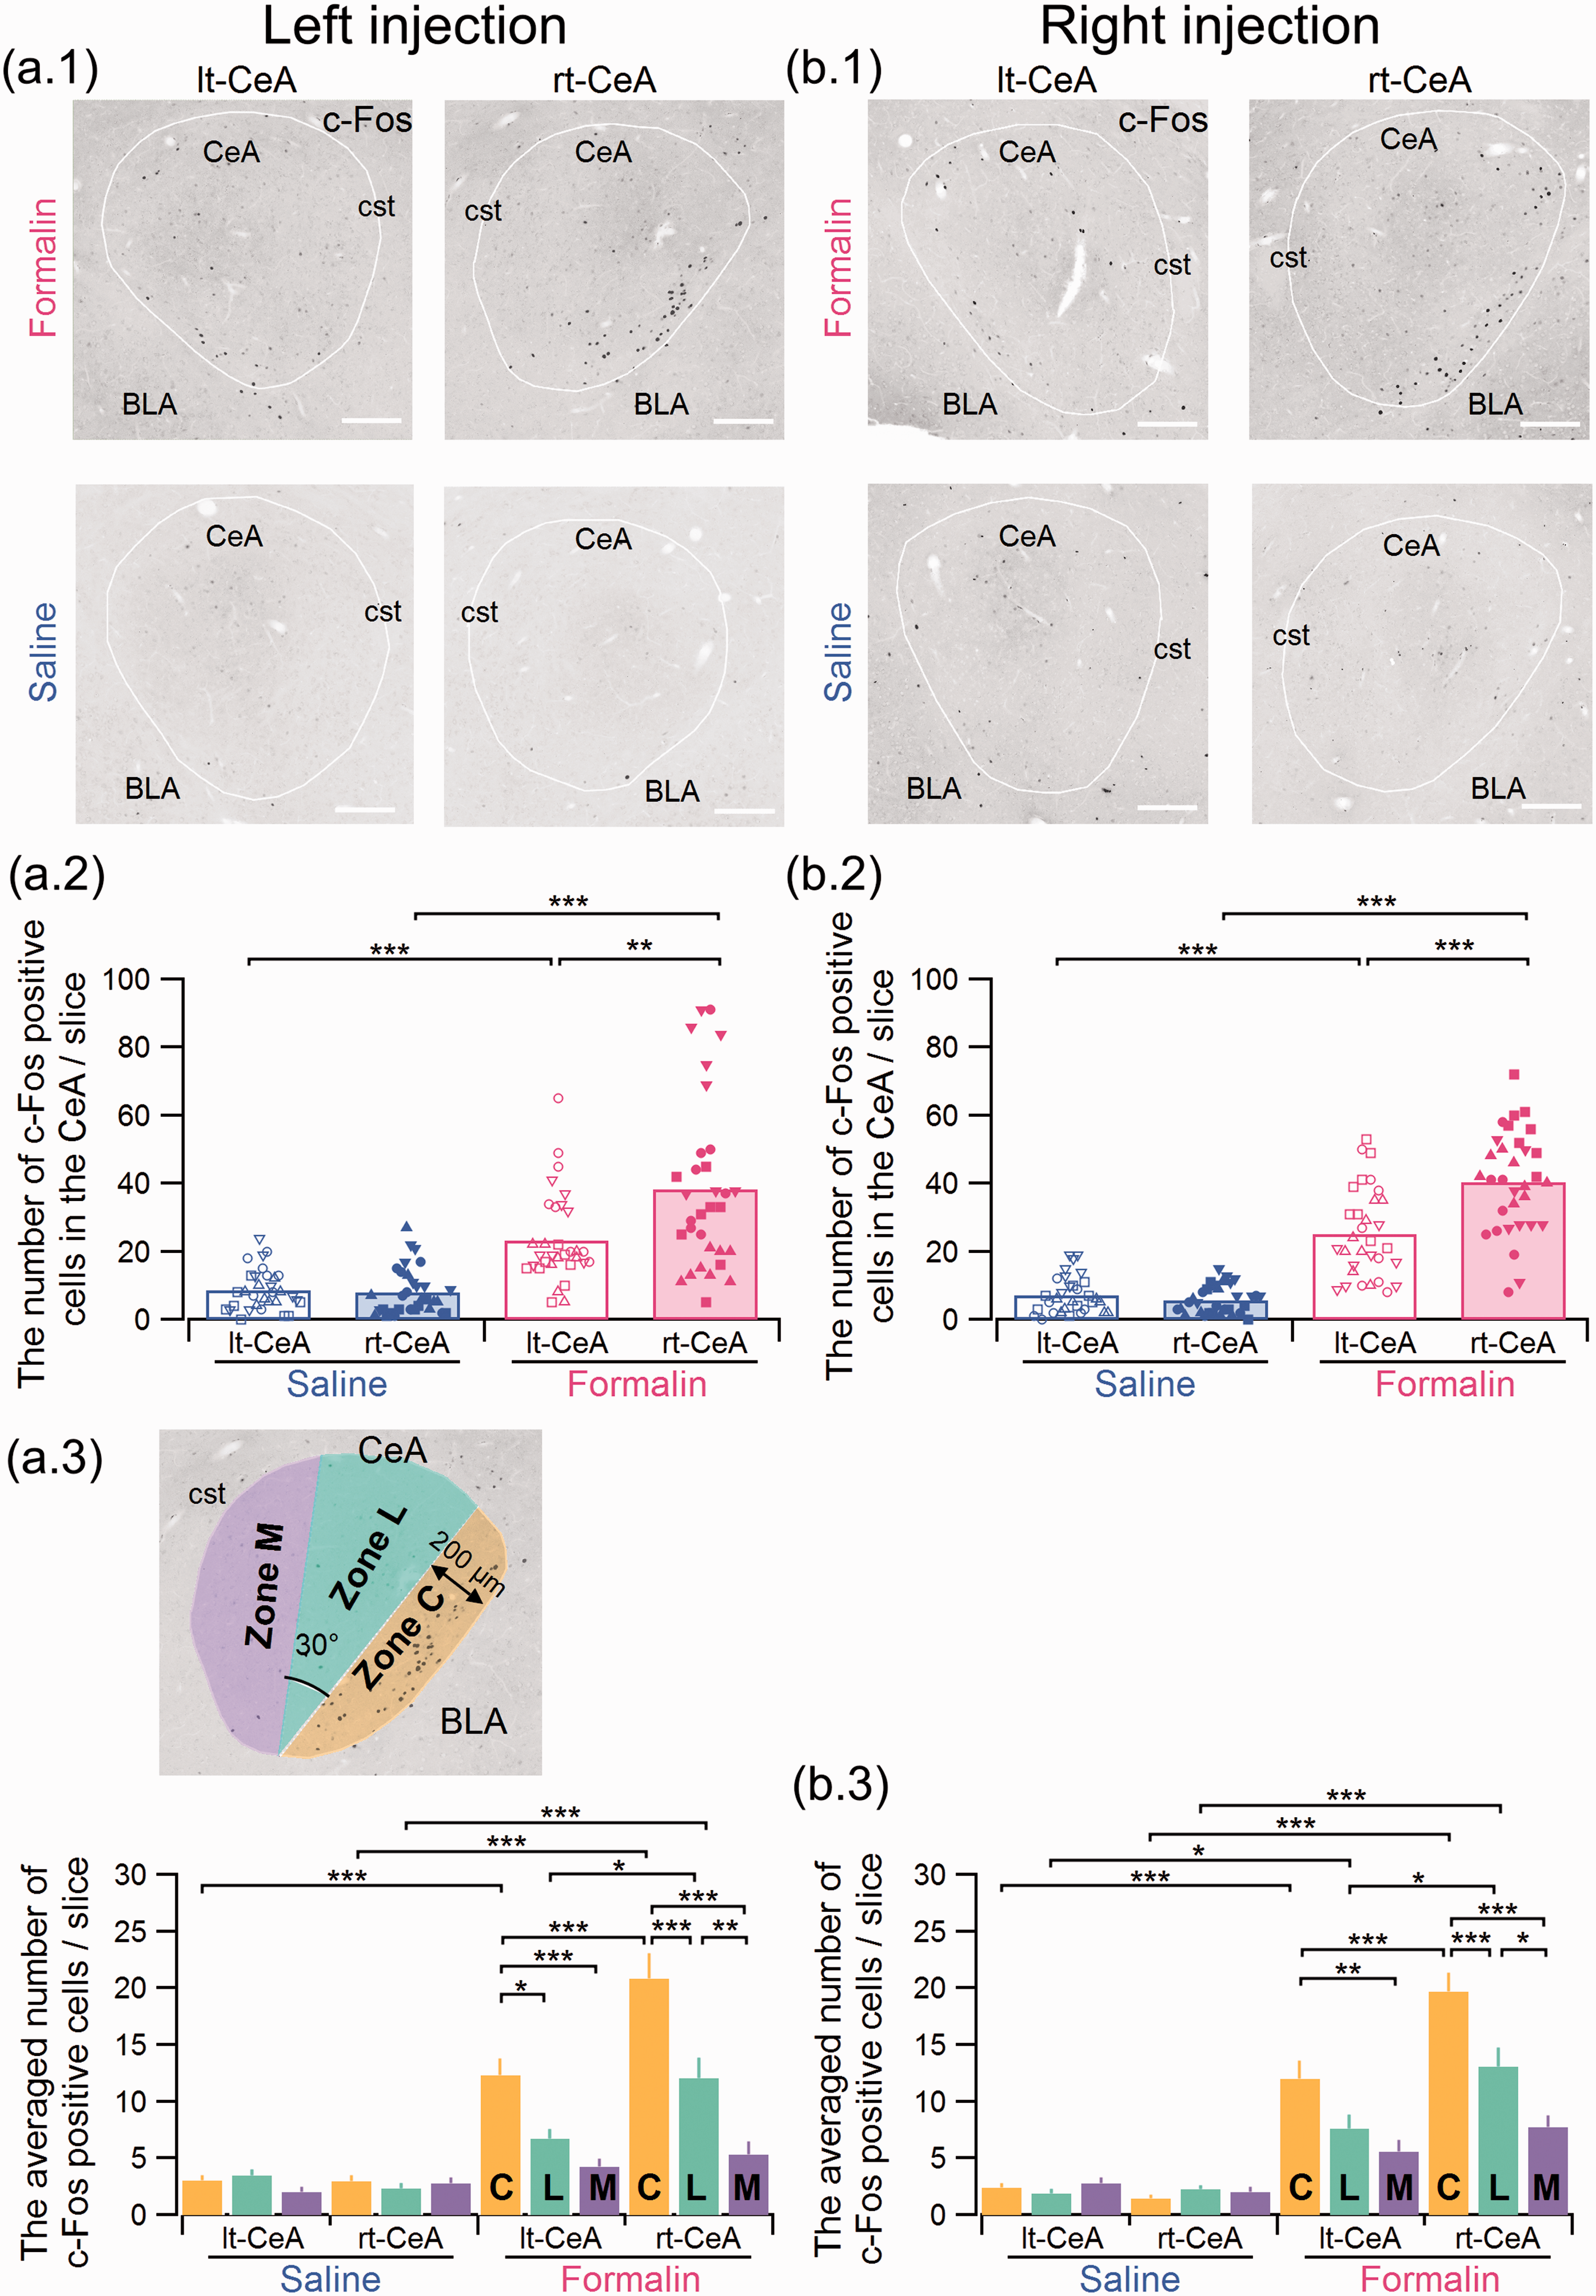
The number of c-Fos-positive cells in the right CeA(rt-) was significantly increased in formalin-injected rats versus the left CeA(lt-). (a.1 and b.1) Representative images of c-Fos immunohistostaining in the CeA 3 h after formalin or saline injection into the left (a) and right (b) upper lip. Upper and lower panels show the results from formalin- and saline-injected rats, respectively. The number of c-Fos-positive cells in the CeA (the area surrounded by the white line) was counted (see Figure 3(a.2) and (b.2)). Scale bars indicate 200 µm. (a.2 and b.2) Summary of the number of c-Fos-immunopositive cells in the CeA after formalin or saline injection to the left (a.2) and right (b.2) upper lip (a.2: F(3,124) = 29.94; formalin-right CeA, 32 slices from four rats; formalin-left CeA, 32 slices from four rats; saline-right CeA, 32 slices from four rats; saline-left CeA, 32 slices from four rats; b.2: F(3,124) = 79.12; formalin-right CeA, 32 slices from four rats; formalin-left CeA, 32 slices from four rats; saline-right CeA, 32 slices from four rats; saline-left CeA, 32 slices from four rats). **P < 0.01; ***P < 0.001 (one-way ANOVA followed by a post hoc Gabriel test). Each marker indicates the number of c-Fos-positive cells in each slice. The bars are the mean of the number of c-Fos-positive cells in a slice. Four types of markers (circles, squares, upward, and downward triangles) represent data from four different rats. The same marker in Figures 2(a.2), 2(b.2), 3(a.2), 3(b.2), 4, 5(a.1), and 5(a.1) represents data from the same rat. (a.3 and b.3) The upper left panel shows the schema indicating the definition for zones C, L, and M (see “Methods” section for details). (*P < 0.05; **P < 0.01; ***P < 0.001; a.3: F(11,372) = 27.52; b.3: F(11,372) = 32.08 (one-way ANOVA followed by a post hoc Gabriel test)). BLA: basolateral amygdala; CeA: central amygdala; cst: commissural stria terminalis.
Preparation of transverse brain slices for electrophysiological recording
Coronal brain slices from formalin- or saline-injected rat were prepared 6 h after injection. The coronal brain slices containing the amygdala were prepared as described previously. 13 In brief, the rats were anesthetized with 5% isoflurane (100% O2) and transcardially perfused with ice-cold cutting artificial cerebrospinal fluid (ACSF) composed of (in mM) 2.5 KCl, 0.5 CaCl2, 10 MgSO4, 1.25 NaH2PO4, 2 thiourea, 3 sodium pyruvate, 92 N-methyl-D-glucamine, 20 HEPES, 12 N-acetyl-L-cysteine, 25 D-glucose, 5 L-ascorbic acid, and 30 NaHCO3 (pH 7.1 adjusted with HCl and then equilibrated with 95% O2 + 5% CO2 pH ∼7.3; osmolality, approximately 280 mOsm/kg). Two to three minutes after the perfusion, the brain was dissected out and cut at the midline to make two blocks of the right and left hemispheres. One of these hemispheres was secured on the cutting stage of a vibrating blade slicer (DSK-1000, Dosaka EM, Kyoto, Japan) with the rostral end upward. Coronal slices of 400-µm thickness containing the amygdala were cut in the ice-cold cutting ACSF and stored in a holding chamber marked as “right” or “left” according to the side of the hemisphere. Then, the other hemisphere was set on the cutting stage, and the slices were sectioned in the same way as with the first hemisphere and stored in the other holding chamber. The order of slice making for the right and left hemispheres was randomized to minimize any time-dependent differences in slice quality. The slices in the two separate chambers (from the right and left hemispheres) were maintained with a constant flow of cutting ACSF at 35.5°C for 10 to 15 min. The slices were then transferred to another set of two holding chambers for each hemisphere containing standard ACSF composed of (in mM) 125 NaCl, 3 KCl, 2 CaCl2, 1.3 MgCl2, 1.25 NaH2PO4, 10 D-glucose, 0.4 L-ascorbic acid, and 25 NaHCO3 (pH 7.4 bubbled with 95% O2 + 5% CO2; osmolarity, ∼310 mOsm/kg) and kept at room temperature (20°C–25°C) until electrophysiological recordings.
Patch-clamp recordings from CeC neurons
Each slice was transferred to a recording chamber (∼0.4-mL volume) and fixed with nylon grids attached to a platinum frame. The slice was submerged in and continuously superfused at a rate of 2 mL/min with standard ACSF. To isolate excitatory synaptic inputs, 100 µM picrotoxin (Sigma-Aldrich, St. Louis, MO) was dissolved in ACSF. CeC neurons were visually identified under an upright microscope (BX-50WI, Olympus) with infrared differential interference video microscopy. Images were captured using a chilled charge-coupled device camera (C5985-02, Hamamatsu Photonics, Hamamatsu, Japan) and stored digitally on a computer. The whole-cell transmembrane current was recorded from neurons in the left and right CeC. The patch-clamp electrodes were made from borosilicate glass pipettes (1B120F-4; World Precision Instruments, Sarasota, FL). The composition of the internal solution was (in mM) 120 potassium gluconate, 6 NaCl, 1 CaCl2, 2 MgCl2, 2 ATP Mg, 0.5 GTP Mg, 12 phosphocreatine Na2, 5 EGTA, 5 QX-314, and 10 HEPES hemisodium (pH 7.3 as adjusted with KOH; osmolarity, ∼300 mOsm/kg). In the experiments for evaluating the NMDA/AMPA ratio, the composition of intracellular solution was (in mM) 136 CsCl, 1 CaCl2, 2 ATPMg, 12 phosphocreatine Na2, 5 EGTA, and 10 HEPES hemisodium (pH 7.3 adjusted with CsOH, osmolarity; ∼300 mOsm/kg). The tip resistance of the electrode was 3 to 8 MΩ. eEPSCs were recorded at a holding potential of −60 mV unless otherwise stated. The membrane currents were recorded using a MultiClamp 700B amplifier (Molecular Devices, San Jose, CA), low-pass filtered at 2 kHz, and sampled at 10 kHz with a PowerLab interface (ADInstruments, Sydney, Australia). The order of recordings from the right and left amygdala was randomized to avoid side-dependent differences due to changes in the viability of neurons during the time from slice preparation to recording. All recordings were made at room temperature (20°C–25°C). All compounds except those noted above were purchased from Sigma-Aldrich or Nacalai Tesque.
Afferent pathway stimulation and eEPSC analysis
To activate afferent fibers arising from the LPB, we carefully located the bipolar concentric steel electrode (interpolar distance, approximately 100 μm; Unique Medical, Tokyo, Japan) on the fiber tract dorsomedial to the CeA (LPB tract) under microscopic control as previously reported.19,21,43 In the experiments for input–output relationships of eEPSCs, the stimulation intensity was set at 50, 100, 200, 400, 600, 800, and 1000 μA. To obtain the PPR of EPSCs as a measure of changes in presynaptic release properties, 44 double pulses with an inter-stimulus interval of 100 ms were delivered. The PPR was calculated as the amplitude of EPSC2 normalized to that of EPSC1. For the PPR measurement, stimulation intensity was fixed at 1000 μA. For measurement of aEPSCs, extracellular CaCl2 was replaced with 5 mM SrCl2. The decay phase of the EPSC in the presence of Sr2+ was fitted with a mono-exponential curve to estimate the decay time constant (τ) and asynchronous events appearing within a time window of 400 ms following twice of the decay time constants (2τ) were evaluated. After the replacement of Ca2+ with Sr2+ over 10 min, 50 asynchronous events were collected from each neuron to construct collective histograms for aEPSC amplitude distribution. When NMDA receptor-mediated EPSCs were recorded, 10 μM 6-cyano-7-nitroquinoxaline-2,3-dione (CNQX) was bath applied to block AMPA-type glutamate receptor-mediated EPSCs, and the holding potential was kept at +40 mV.
Data and statistical analysis
The recorded membrane current was analyzed off-line by an Igor Pro 6 or 7 (WaveMetrics, Lake Oswego, OR) using programs written by FK, Peak amplitude was measured based on the averaged waveform of eEPSCs (eight consecutive trials). Values are expressed as the mean ± standard error of the mean (SEM). Differences in the values were compared using one-way ANOVA followed by a post hoc test (Gabriel) for multiple comparisons of normally distributed values or the Mann–Whitney U test for values with an unknown distribution. Differences in the value distribution were compared using Kolmogorov–Smirnov test with Bonferroni correction for multiple comparisons. Effects of the rostrocaudal level and the side of the CeA on the number of c-Fos-positive cells were examined using two-way ANOVA test. The Spearman’s rank correlation test was used to examine non-parametric correlations between values. Differences with a P value less than 0.05 were considered significant.
Results
Formalin injection to the upper lip causes spontaneous nocifensive behavior
A total of 85 male rats received injections of formalin (5%, 50 µL) or saline (50 µL) into the left or right upper lip. The rats receiving formalin to the upper lip of either side showed spontaneous behavioral responses characterized by intense rubbing of the face around the injection site. This face rubbing started immediately after the recovery from the anesthesia administered during the facial injection and peaked about 30 min after the formalin injection (Figure 1(a)). There was no significant difference in the rubbing time between the rats with left and right injections at any time point observed. The face rubbing behavior faded away about 60 min after the formalin injection. The rats with saline injection did not show such intensive face rubbing (Figure 1(a)). After this 1-h observation period of spontaneous behavior, the rats did not show apparent signs of spontaneous pain in the home cage. However, swelling of the regions around the injected site remained evident until 6 h after the formalin injection (Figure 1(b)). The degree of swelling was evaluated as an “area” using photographs taken from above the face (Figure 1(b)). The ratio of the area of the injected side to the contralateral side was significantly increased by formalin injection compared with the saline injection (Figure 1(c); P < 0.001 and P < 0.001 for the left and right upper lip injections, respectively; Mann–Whitney U test). This ratio did not significantly differ between the left and right formalin injections (1.52 ± 0.05 and 1.40 ± 0.04; P = 0.17; U=89.0; Mann–Whitney U test), indicating that unilateral formalin injection to the upper lip causes the swelling to be restricted to the ipsilateral orofacial region. Altogether, formalin injection into either the left or the right upper lip resulted in similar behavioral and pathological consequences regardless of the side of injection.
The number of c-Fos-expressing neurons is increased in the LPB 3-h post-injection with injection side preference
We counted the number of neurons expressing c-Fos in the bilateral LPB 3 h after formalin injection to the left or right upper lip (Figure 2). Figure 2(a.1) and (b.1) shows representative images of c-Fos immunostaining in the LPB 3 h after formalin (upper panels) or saline (lower panels) injection to the left (Figure 2(a)) and right (Figure 2(b)) upper lip. Regardless of the injection side, formalin injection resulted in the appearance of numerous c-Fos-positive cells in the left as well as in the right LPB (upper panels in Figure 2(a.1) and (b.1)). Based on the similar evaluation made in eight formalin-injected rats (four rats with left-side (Figure 2(a.2))) and another four rats with right-side injections (Figure 2(b.2))), we concluded that there is no significant left–right difference in the formalin-induced activation of the LPB neurons 3 h after the injection with only a slight but nonsignificant projection-side dependence (P = 0.12 between the left and right LPB in the group with left formalin injection (Figure 2(a.2)) and P = 0.06 for that with right injection (Figure 2(b.2)); post hoc Gabriel test). We also counted the number of c-Fos-positive cells in another eight saline-injected rats (four rats with left-side injections (Figure 2(a.2)) and four rats with right-side injections (Figure 2(b.2)). Only a few c-Fos-positive cells could be found in the animals treated with saline regardless of the injection side (lower panels in Figure 2(a.1) and (b.1)).
The number of c-Fos-expressing neurons is increased in the CeC but with potent right-side dominance, unlike that in the LPB
Using the same cohorts of animals receiving left and right injection of formalin or saline into the upper lip, the number of neurons expressing c-Fos in the bilateral CeA was evaluated (Figure 3). Regardless of the injection side, the right CeA showed more c-Fos-positive neurons than the left CeA in the formalin-, but not in the saline-, treated animals (Figure 3(a.1) and (b.1)).
The number of c-Fos-positive neurons was significantly higher in each slice from the right CeA than in those from the left CeA in both treatment groups for rats with both left (Figure 3(a.2)) and right (Figure 3(b.2)) formalin injections (P = 0.001 between the left and right CeA in the group with left formalin injection (Figure 3(a.2)) and P < 0.001 for that with right injection (Figure 3(b.2)); post hoc Gabriel test). As expected, most of the c-Fos-positive neurons were observed in the formalin-treated groups in the most lateral part of the CeA, that is, the capsular part (CeC) (Figure 3(a.1) and (b.1)). To compare the sub-CeA localization of c-Fos-expressing cells, we roughly divided the CeA into three regions: zone M, zone L, and zone C, which roughly correspond to the CeM, CeL, and CeC, respectively, as shown in the inserts in Figure 3(a.3) (see the “Methods” section). In the right CeA of the rats receiving formalin injection to either the right or left upper lip, the c-Fos expression in zone C was significantly higher than that in zones L and M (Figure 3(a.3) and (b.3)) in the formalin-treated rats (P < 0.001 between zone C and zone L and P < 0.001 between zone C and zone M in the group with left formalin injection (Figure 3(a.3)) and P < 0.001 and P < 0.001 for these zones in the right injection group, respectively (Figure 3(b.3)); post hoc Gabriel test).
Right predominance in c-Fos expression in the formalin group does not depend on rostrocaudal position
The summary shown in Figure 3 is based on the results of c-Fos-positive neuron counting in coronal slices taken every 100 μm. The characteristics of the CeA network differ depending on the rostrocaudal axis. 45 To confirm whether the right-predominant expression of c-Fos in the CeA after formalin injection depends on the rostrocaudal position of each slice, we plotted the number of c-Fos-expressing neurons in the left and right CeA in serially sectioned transverse slices (Figure 4). The number of c-Fos-expressing cells was consistently higher in the right CeA than in the left CeA at all rostrocaudal levels examined. The two-way analysis of variance (ANOVA) test indicated that, in rats with formalin injection to either side of the face, there was a significant effect of the side of the CeA (P = 0.005, F(1,48) = 8.54 for the formalin injection to the left upper lip; P < 0.001; F(1,48) = 16.01 for that to the right upper lip) but no significant effect of the rostrocaudal position (P = 0.51, F(7,48) = 0.90 for the formalin injection to the left upper lip; P = 0.94, F(7,48) = 0.32 for that to the right upper lip) on the number of c-Fos-positive cells without significant interaction between the side and the rostrocaudal position (P = 0.73, F(7,48)=0.62 for the left injection; P = 0.97, F(7,48) = 0.24 for the right injection). For the rats with saline injection, there was no significant effect of the side of CeA (P = 0.78, F(1,48) = 0.08 for the saline injection to the left upper lip; P = 0.29; F(1,48) = 1.14 for that to the right upper lip) and no significant effect of the rostrocaudal position ((P = 0.78, F(7,48) = 0.57 for the saline injection to the left upper lip; P = 0.57; F(7,48) = 0.83 for that to the right upper lip) without significant interaction between the side and the rostrocaudal position (P = 0.14, F(7,48)=1.68 for the left injection; P = 0.98, F(7,48) = 0.22 for the right injection). These results indicate that the right-side predominance is a feature observed in rostrocaudal extent of the CeA and does not depend on a specific rostrocaudal location.

Rostrocaudal distribution of c-Fos-positive cells in the right and left CeA. Rostrocaudal distribution of c-Fos-positive cells in formalin (upper)- and saline (lower)-injected left (a) or right (b) upper lips 3 h after injection. The bars indicate the mean values of c-Fos-positive cells (left injections: formalin, n = 4; saline, n = 4; right injections: formalin, n = 4; saline, n = 4). Slices no. 1 and no. 8 approximately correspond to −2.04 mm and −2.92 mm, respectively, from Bregma. The same marker in Figures 2(a.2), 2(b.2), 3(a.2), 3(b2), 4, 5(a.1), and 5(a.1) represents data from the same rat. CeA: central amygdala.
The number of c-Fos-expressing neurons in the CeA is correlated with that in the BLA but not with that in the LPB
The above results indicate that, as far as the number of c-Fos-expressing cells is concerned, the right-side predominance found in the CeA after formalin injection is not clear in the LPB, which showed a bilateral increase in c-Fos-expressing cells. Because the number of c-Fos-positive cells in the LPB and CeA varied among the animals, we examined the hypothesis that higher expression of c-Fos-positive cells on either side of the CeA coincides that on either side of the LPB. In addition, we also compared these numbers between the bilateral BLA and the bilateral CeA. First, we compared the number of c-Fos-expressing cells in the right and left BLA after injections of either formalin or saline into the left or right upper lip (Figure 5(a.1) and (a.2)). Although the mean number of c-Fos-positive cells was slightly higher in the formalin-treated rats, we failed to find any significant difference in the number of c-Fos-expressing cells between the right and left BLA after either formalin or saline injection to either the left or right upper lip (Figure 5(a.1) and (a.2)) (P = 1.00 between the left and right BLA in the group with left formalin injection and P = 0.18 between left formalin- and left saline-injected rats in the right BLA (Figure 5(a.1)) and P = 0.99 between the left and right BLA in the group with right formalin injection (Figure 5(a.2)) and P = 0.33 between right formalin- and saline-injected rats in the right BLA; post hoc Gabriel test). However, as shown in Figures 2, 3, and 5, the number of c-Fos-expressing cells in the LPB, CeA, and BLA varied considerably among the rats.

The number of c-Fos-expressing neurons in the CeA was correlated with that in the BLA but not with that in the LPB. (a) The number of c-Fos-immunopositive cells in the BLA (a.1: F(3,124) = 2.827; formalin-right BLA, 32 slices from four rats; formalin-left BLA, 32 slices from four rats; saline-right BLA, 32 slices from four rats; saline-left BLA, 32 slices from four rats; a.2: F(3,124) = 3.286; formalin-right BLA, 32 slices from four rats; formalin-left CeC, 32 slices from four rats; saline-right CeC, 32 slices from four rats; saline-left BLA, 32 slices from four rats; ANOVA followed by a post hoc Gabriel test). The bars are the mean of the number of c-Fos-positive cells in a slice. The data are obtained from the same animals in Figure 3(a.2) and (b.2) marked with the same symbols. (b) Correlation of the number of c-Fos-positive cells between the two sides of the CeA, LPB, and BLA. Each marker indicates the value from rats injected with formalin (red) and saline (blue) into the right (triangles) and left (circles) upper lip. Spearman’s rank correlation coefficients (ρ values) for the formalin and saline groups are shown using red and blue characters, respectively (*P < 0.05; **P < 0.01). (c) Summary of the ρ value of the Spearman’s correlation coefficient between the two sides of the CeA, LPB, and BLA in the formalin-injected group. The thickness of the lines indicates the magnitude of the correlation coefficient between the pairs (scale shown in the bottom). Positive and negative ρ values are drawn as orange and green lines, respectively. *P < 0.05 between the right CeA and left BLA, right and left CeA, and right and left BLA; **P < 0.01 between the left CeA and right BLA. BLA: basolateral amygdala; LPB: lateral parabrachial nucleus; CeA: central amygdala.
Therefore, we examined whether the numbers of c-Fos-expressing cells in these structures were correlated in the preparations with formalin or saline injection. We plotted the data from each slice from rats with right and left injections of formalin and saline to the upper lip of both sides (Figure 5(b); each plotted marker in Figure 5(b) represents the mean number of c-Fos-positive cells/slice detected in specified regions in a rat). Using the data from these different experimental conditions, we calculated the Spearman’s rank correlation between all possible pairs to examine whether the number of c-Fos-positive cells in a region (shown on the X-axis) is higher when that in another region (Y-axis) is higher. We did not find any significant correlation between the LPB and CeA or between the LPB and BLA in the number of c-Fos-expressing cells regardless of the side. In contrast, the numbers of c-Fos-positive cells in the right CeA and left BLA and those in the left CeA and right BLA were significantly correlated (P = 0.047 and P = 0.002, respectively; Spearman's rank correlation). Although the results were not significant, the correlations between the right CeA and right BLA and between the left CeA and left BLA were consistently higher than +0.66, unlike the correlations between the CeA and LPB or between the BLA and LPB, which were consistently low, between −0.36 and +0.21. Figure 5(c) indicates and summarizes the degree of correlation between all possible pairs described in Figure 5(b) using the color and thickness of the linking lines. The results of this analysis unexpectedly indicate that the activity of neurons in the CeA is more related to that of BLA than that of LPB, despite only limited activation of the BLA neurons.
LPB-CeC transmission is specifically potentiated in the right CeC, but not in the left, regardless of the side of the inflammation
As projections from the SpVc to the LPB are essentially bilateral37,46 and those from the LPB to the CeA are mostly unilateral, 14 it is expected that CeA neurons on either side receive inputs from both the ipsilateral and contralateral trigeminal afferents. To examine whether the LPB-CeC synaptic transmission is asymmetrical with respect to the side of origin (i.e., LPB) and the side of inflammation, we performed voltage-clamp recordings of evoked excitatory postsynaptic currents (eEPSCs) in CeC neurons in slices prepared from rats 6 h after formalin or saline injection to either side of the upper lip.
We recorded 189 visually identified neurons (left upper lip injection: formalin (n = 65), saline (n = 71) and right upper lip injection: formalin (n = 29), saline (n = 24)) in the CeC (Table 1). We did not find any apparent differences in the number of neurons with healthy appearance (e.g., smooth cell surface and clear border) in each slice from rats with different treatments as observed with videomicrograph and in the success rate of stable recording between the groups. In addition, there were no differences in the resting membrane potential or whole-cell capacitance between neurons from the formalin- and saline-treated groups (Table 1). We placed a stimulation electrode in a region dorsomedial to the CeM and immediately dorsal to the commissural stria terminalis (Figure 6(a)), which would stimulate fibers mostly arising from the ipsilateral LPB.21,43 Figure 6(b.1) shows representative traces of the eEPSCs by LPB pathway stimulation at increasing intensities in CeC neurons from the formalin (above, red traces) and saline (bottom, blue traces) injected into the left upper lip of rats. When the stimulation intensity was gradually increased, LPB tract stimulation gave rise to eEPSCs of larger amplitude with lower intensity in the right CeC (red thick traces) than in the left CeC (red thin traces) in the formalin-injected group (Figure 6(b.1), top). The eEPSC amplitude in the right CeC of the formalin-injected group was also larger than that in the bilateral CeC in saline-injected rats (Figure 6(b.1), bottom).

Synaptic transmission of the LPB-CeC synapse is potentiated only in the right CeA 6 h after formalin injection regardless of the side of the inflammation. (a) Representative IR-DIC image from an acute coronal brain slice containing the central amygdala. CeC, CeL, and CeM denote the capsular, lateral, and medial parts of the central amygdala, respectively. (b.1 and c.1) The eEPSCs evoked by LPB tract stimulation in the CeC of rats with injection of formalin or saline into the left (b) or right (c) upper lip. Averaged (n = 8) waveforms of eEPSCs evoked by LPB tract stimulation at different intensities (0.05–1 mA) recorded at a holding potential of −60 mV. The thick and thin traces indicate the recordings from right (rt-CeC) and left (lt-CeC) CeC neurons, respectively. (b.2 and c.2) Relationship between stimulation intensity (horizontal axis) and eEPSC amplitude (vertical axis). (b.2: 50 µA, F(3,132) = 3.301; 100 µA, F(3,132) = 4.724; 200 µA, F(3,132) = 9.699; 400 µA, F(3,132) = 11.987; 600 µA, F(3,132) = 12.243; 800 µA, F(3,132) = 11.141; 1 mA, F(3,132) = 11.089; formalin-right CeC, n = 32; formalin-left CeC, n = 33; saline-right CeC, n = 38; saline-left CeC, n = 33; c.2: 50 µA, F(3,49) = 1.795; 100 µA, F(3,49) = 3.499; 200 µA, F(3,49) = 4.439; 400 µA, F(3,49) = 6.463; 600 µA, F(3,49) = 6.931; 800 µA, F(3,49) = 6.958; 1 mA, F(3,49) = 9.35; formalin-right CeC, n = 15; formalin-left CeC, n = 14; saline-right CeC, n = 12; left CeC, n = 12). *P < 0.05; **P < 0.01; ***P < 0.001 between formalin- and saline-injected rats in the right CeC neurons (one-way ANOVA followed by a post hoc Gabriel test). #P < 0.05; ##P < 0.01; ###P < 0.001 between right and left CeC neurons in the formalin-injected rats (one-way ANOVA followed by a post hoc Gabriel test). There was no significant difference between formalin- (red triangle) and saline- (blue triangle) injected rats in left CeC neurons (b.2, P = 0.999; c.2, P = 0.998; one-way ANOVA followed by a post hoc Gabriel test). Error bars indicate SEM. cst: commissural stria terminalis; stim: stimulation electrode; rec: recording pipette; EPSC: excitatory postsynaptic current.
Basic properties of CeC neurons from saline- or formalin-injected rats.

Values were measured immediately after establishment of the whole-cell mode. Data are expressed as the mean ± SEM. There was no significant difference in the RP, IR, or CC between neurons from the right and left CeA in the formalin and saline groups with left or right injection (left injection: RP, F(3,132) = 0.140, P = 0.936; IR, F(3,132) = 0.731, P = 0.535; CC, F(3,132) = 0.491, P = 0.689; right injection: RP, F(3,49) = 1.610, P = 0.199; IR, F(3,49) = 0.646, P = 0.589; CC, F(3,49) = 0.545, P = 0.654; one-way ANOVA). RP: resting potential; IR: input resistance; CC: cell capacitance; ANOVA: analysis of variance.
Figure 6(b.2) summarizes the input–output relationship between the stimulation intensity (horizontal axis) and eEPSC amplitude (vertical axis) of 65 neurons (32 right CeC neurons and 33 left CeC neurons) from formalin-injected (left upper lip) rats and of 71 neurons (38 right CeC neurons and 33 left CeC neurons) from saline-injected (left upper lip) rats. The eEPSC amplitude of the right CeC neurons (red circles in Figure 6(b.2)) was significantly larger than that of the neurons belonging to other groups (50 µA, P = 0.152 and P = 0.032; 100 µA, P = 0.035 and P = 0.003; 200 µA, P = 0.001 and P < 0.001; 400 µA, P < 0.001 and P < 0.001; 600 µA, P < 0.001 and P < 0.001; 800 µA, P < 0.001 and P < 0.001; 1 mA, P < 0.001 and P < 0.001 for right CeC in the formalin injection group vs. left CeC in the formalin injection group and right CeC in the formalin injection group vs. right CeC in the saline injection group, respectively; post hoc Gabriel test). There was no significant difference between neurons in the left CeC in the formalin-injected group (red triangles) and those in the bilateral CeC in the saline-injected groups (right CeC, blue circles; left CeC, blue triangles) at any stimulation intensity in the range of 50 to 1000 µA (Figure 6(b.2)) (50 µA, P = 0.999; 100 µA, P = 1.000; 200 µA, P = 1.000; 400 µA, P = 1.000; 600 µA, P = 1.000; 800 µA, P = 1.000; 1 mA, P = 1.000 for left CeC in the formalin injection group vs. left CeC in the saline injection group; post hoc Gabriel test).
These results indicate that the LPB-CeC transmission is potentiated only in the right CeC after formalin injection to the left upper lip (Figure 6(b)). Therefore, we next examined whether the LPB-CeC synaptic transmission in the left CeC is potentiated after formalin injection to the right upper lip (Figure 6(c)). Surprisingly and contrary to our expectation, but in line with the aforementioned right specificity in c-Fos expression in the CeC, the eEPSC amplitude was also larger in the right CeC (red thick traces) than that in the left CeC in rats with right-side formalin injection (Figure 6(c.1)). Figure 6(c.2) summarizes the input–output relationship between the stimulation intensity and eEPSC amplitude of 29 neurons (15 right CeC and 14 left CeC) from formalin-injected (right upper lip) rats and 24 neurons (12 right CeC and 12 left CeC) from saline-injected (right upper lip) rats. The eEPSC amplitude of the right CeA neurons (red-filled circles in Figure 6(c.2)) was significantly larger than that of the neurons belonging to other groups (50 µA, P = 0.278 and P = 0.363; 100 µA, P = 0.053 and P = 0.159; 200 µA, P = 0.031 and P = 0.045; 400 µA, P = 0.007 and P = 0.012; 600 µA, P = 0.004 and P = 0.007; 800 µA, P = 0.005 and P = 0.003; 1 mA, P = 0.001 and P < 0.001 for right CeC in the formalin injection group vs. left CeC in the formalin injection group and right CeC in the formalin injection group vs. right CeC in the saline injection group, respectively; post hoc Gabriel test), whereas there was no significant difference between other groups at any stimulation intensity examined. These results support the conclusion that formalin injection results in manifest synaptic potentiation of the LPB-CeC synaptic transmission only in the right CeC regardless of the side of injection.
Synaptic potentiation in the right CeC involves both pre- and postsynaptic changes
We analyzed the mechanism underlying the synaptic potentiation in detail. First, we analyzed the short-term plasticity of LPB-CeC transmission. The LPB tract was stimulated twice at an interval of 100 ms (Figure 7(a.1)) to calculate the paired-pulse ratio (PPR: the amplitude of the second EPSC2 normalized to that of the first EPSC1). As shown above, only the neurons in the right CeC showed a larger amplitude eEPSC in response to LPB-CeC fiber stimulation in the rats with right as well as left formalin injections (Figure 7(a.1) and (b.1)). Analysis of the PPR revealed that the larger amplitude in the right CeC was accompanied by a significant decrease in the PPR for both left and right formalin injections compared with the left CeC (Figure 7(a.2)) (P = 0.02 for right CeC vs. left CeC in the group with left formalin injection (Figure 7(a.2)) and P = 0.02 for that in the right injection group (Figure 7(b.2)); post hoc Gabriel test), suggesting an increased release probability from the presynaptic terminals after formalin injection only in the right CeC.

LPB-CeC synaptic potentiation is accompanied by a decreased paired-pulse ratio in formalin-injected rats. EPSC evoked by paired-pulse stimulation of the LPB tract in the CeC of rats injected with formalin or saline into the left (a) or right (b) upper lip. (a.1 and b.1) Representative average traces of eEPSC from eight responses to eight paired-pulse stimuli (interval, 100 ms; intensity, 1 mA). Upper (red) and lower (blue) panels were recorded from formalin- and saline-injected rats, respectively. lt-CeC and rt-CeC traces were recorded from the left and right CeC, respectively. Thick and thin waves indicate the recordings from rt-CeC and lt-CeC neurons, respectively. The dashed lines indicate the level at the peak of each EPSC1. (a.2 and b.2) Mean of PPR (the amplitude of EPSC2 normalized to that of EPSC1) at 1 mA in the LPB-CeC synapse of rats injected with formalin or saline into the left (a.2) or right (b.2) lip. (a.2: F(3,132) = 5.125; formalin-right CeC, n = 32; formalin-left CeC, n = 33; saline-right CeC, n = 38; saline-left CeC, n = 33; b.2: F(3,49) = 7.155; formalin-right CeC, n = 15; formalin-left CeC, n = 14; saline-right CeC, n = 12; left CeC, n = 12). *P < 0.05; **P < 0.01; ***P < 0.001 (one-way ANOVA followed by a post hoc Gabriel test). Each marker represents the PPR value from each neuron. PPR: paired-pulse ratio.
We performed two additional analyses to compare the properties of the LPB-CeC synaptic transmission between the right and left CeC in the left formalin-treated rats. First, we examined whether the responses caused by monovesicular release at the LPB-CeC synapses are affected by formalin injection and are different between right and left CeC (Figure 8(a)). Because CeC neurons receive inputs of various origins, we selectively analyzed the synaptic transmission from the LPB fibers by causing “asynchronous” release by replacing extracellular Ca2+ with Sr2+. In the presence of Sr2+, frequent and small-amplitude inward events (asynchronous EPSCs (aEPSCs)) followed larger amplitude eEPSC evoked by LPB fiber stimulation (Figure 8(a.1)). The amplitude distributions of these aEPSCs in these four groups were significantly different (P < 0.001, Kolmogorov–Smirnov test with Bonferroni correction for multiple comparisons; Figure 8(a.2)). Therefore, the aEPSCs recorded in the right CeC of the rats with formalin injection showed more frequent larger amplitude aEPSCs than those in the left CeC and than those from the right and left CeC in saline-injected rats. This result suggests that the glutamate released through monovesicular release from the LPB terminals caused larger responses in the right CeC of the formalin-treated rats.
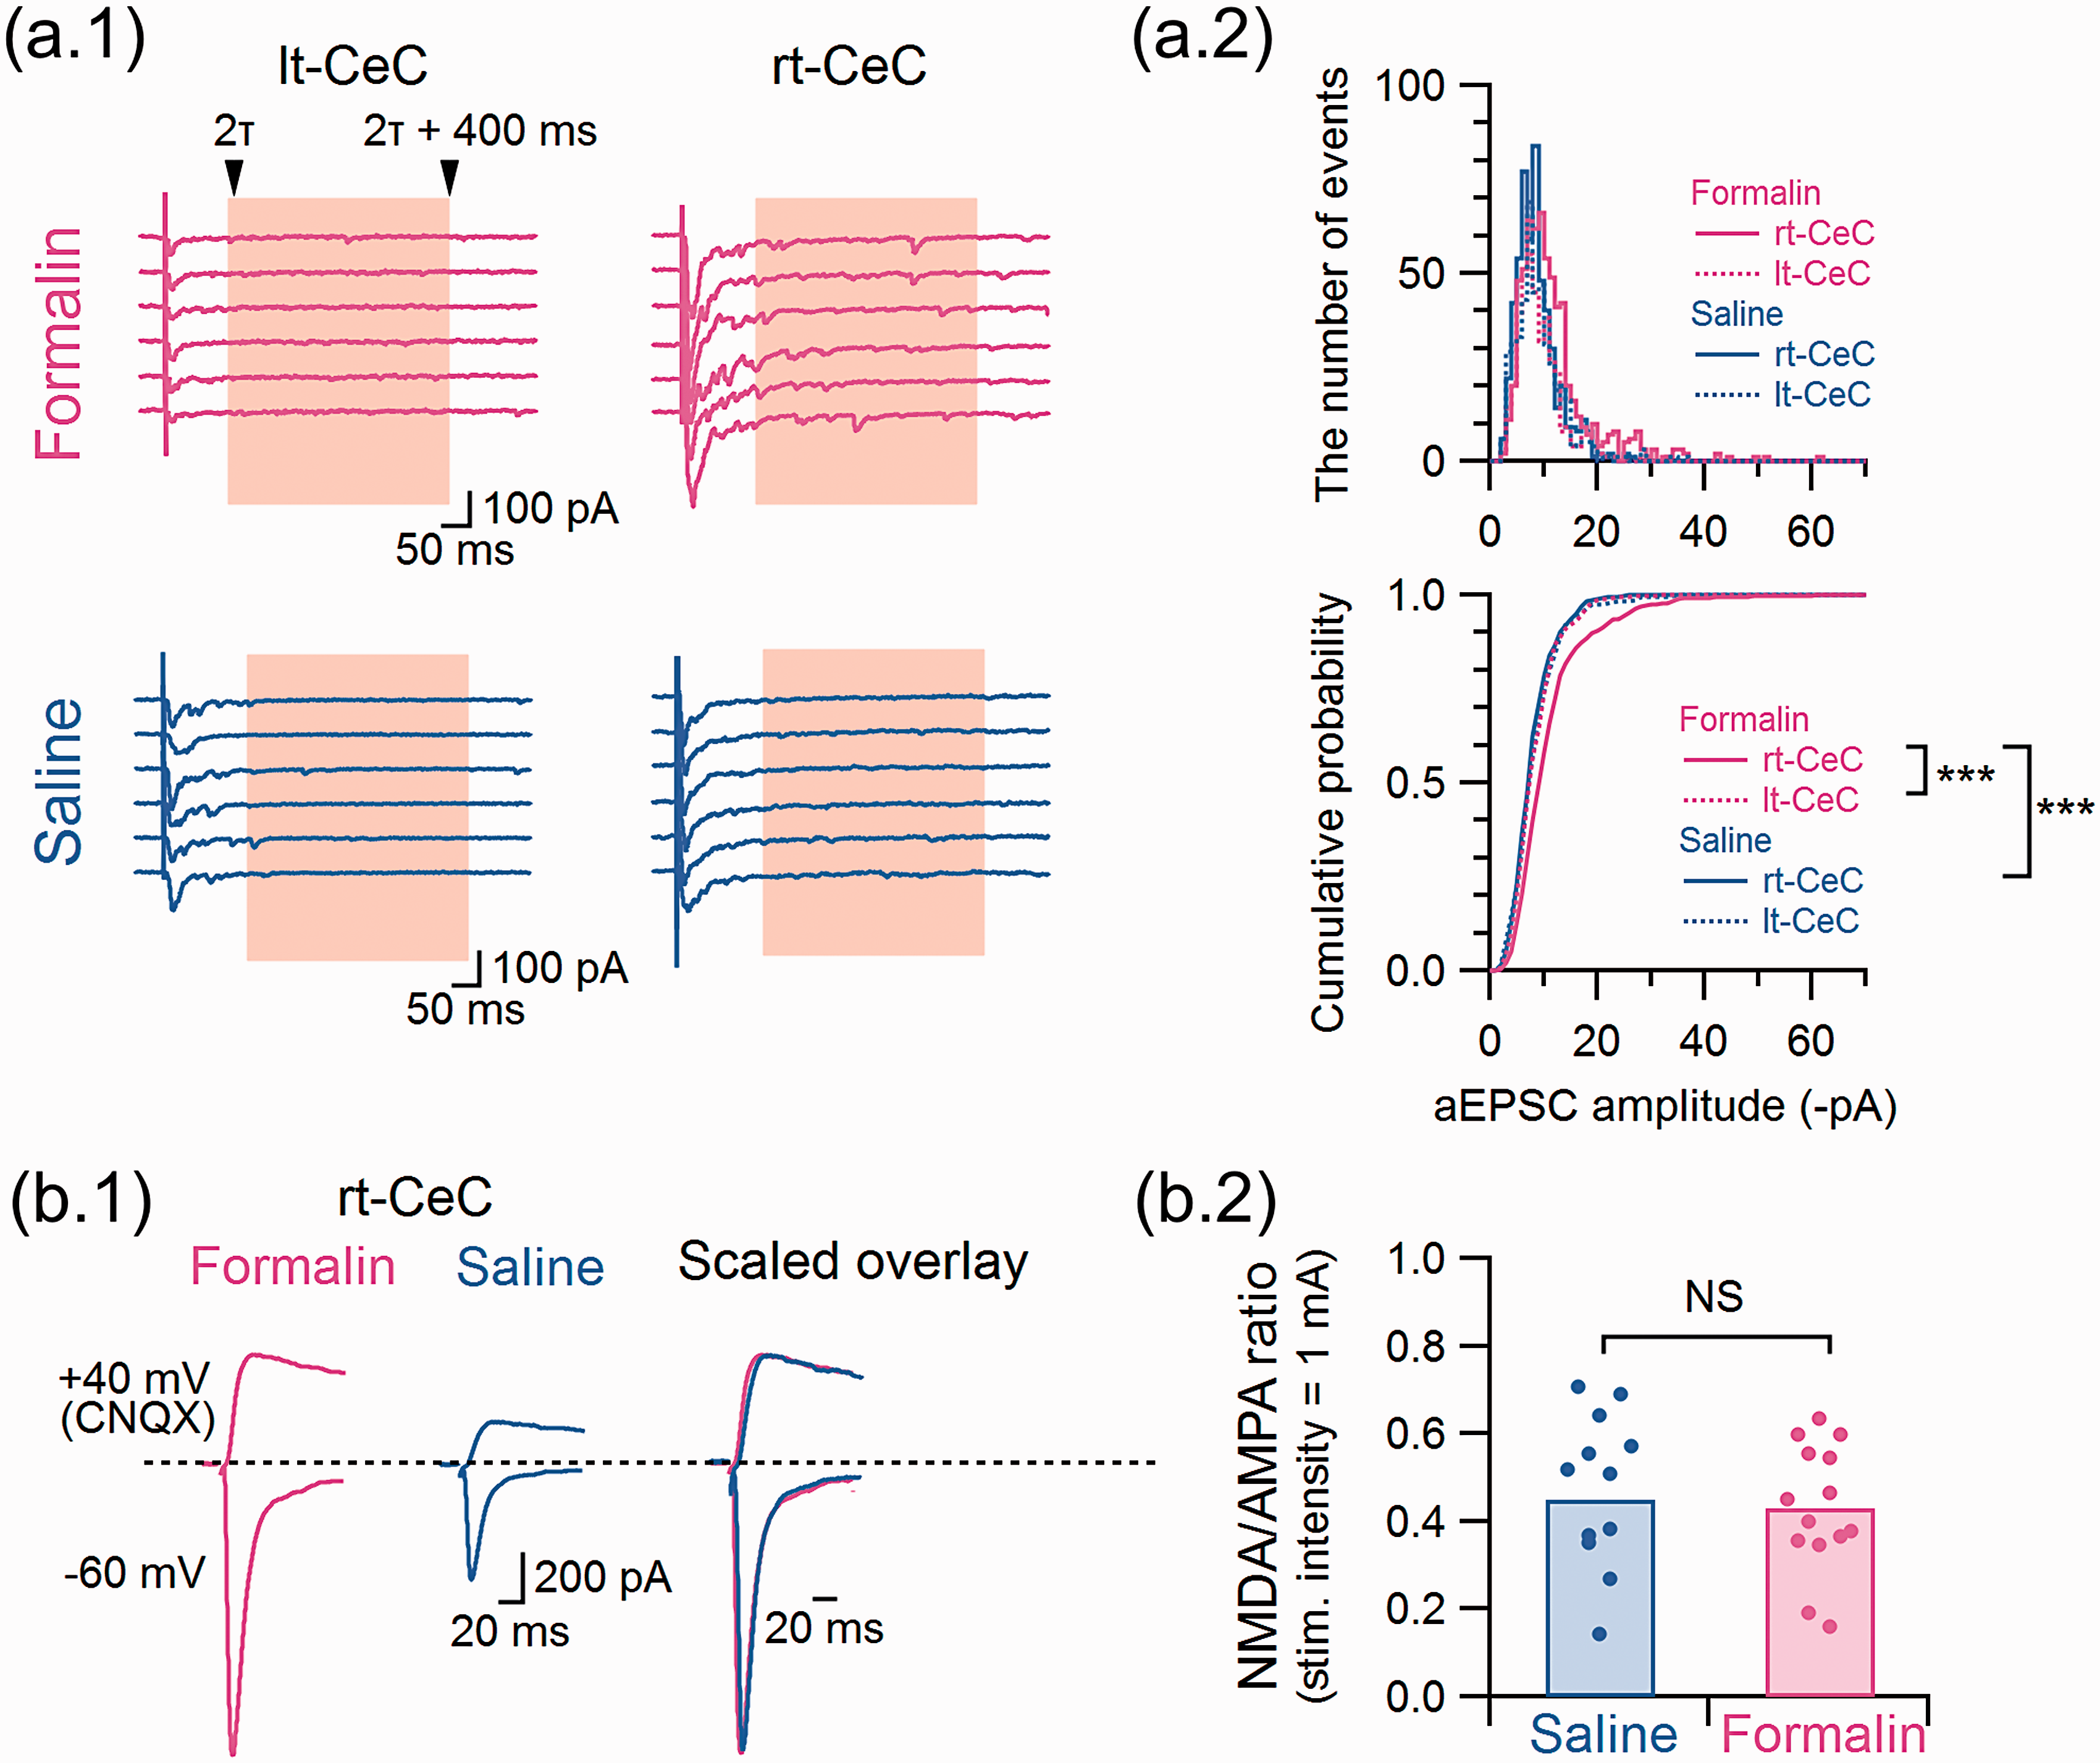
LPB-CeC synaptic potentiation in formalin-injected rats is accompanied by a significant change in the monovesicular response size but not by a change in the NMDA/AMPA ratio. (a.1) Asynchronous release recorded in the presence of 5 mM Sr2+ instead of 2 mM Ca2+. Six representative responses in the presence of Sr2+. The decay of the evoked synchronous release in the presence of Sr2+ was fitted with a mono-exponential decay curve and the events appearing within 400 ms after twice of the decay time constant (2τ) were used for evaluating aEPSC amplitude. (a.2) Histograms and cumulative curves of the aEPSC amplitude recorded from the right (lines) and left (dashed lines) CeC of formalin- (red) or saline- (blue) injected rats. A total of 50 subsequent events from each neuron were used to construct the histograms (formalin-right CeC, 650 events from 13 neurons; formalin-left CeC, 400 events from 8 neurons; saline-right CeC, 550 events from 11 neurons; saline-left CeC 450 events from 9 neurons). *** P < 0.001 (Kolmogorov–Smirnov test with Bonferroni correction for multiple comparisons). (b.1) NMDA/AMPA ratio calculated with the eEPSC amplitude recorded from the right CeC of formalin- (red) or saline- (blue) injected rats. Representative traces of eEPSCs at −60 mV without CNQX (AMPA-component) and +40 mV with CNQX (NMDA-component). The right traces are a scaled overlay of the left (formalin) and middle (saline) traces. (b.2) Summary of the NMDA/AMPA ratio in the right CeC from the rats injected with formalin or saline into the left upper lip (formalin-right CeC, n = 14; saline-right CeC, n = 12). The bars show the mean value, and each circle indicates a value from a neuron. (Mann–Whitney U test; U = 83.0). The data in Figure 8 were obtained from the rats with formalin or saline injection to the left upper lip. NS: not significantly different.
We next analyzed the ratio of N-methyl-D-aspartate (NMDA) receptor-mediated postsynaptic responses to that mediated by α-amino-3-hydroxy-5-methyl-4-isoxazolepropionic acid (AMPA) receptors (NMDA/AMPA ratio) of the LPB-CeC transmission by electrophysiological and pharmacological isolation (Figure 8(b.1)). Despite a marked difference in the AMPA receptor-mediated eEPSC amplitude, we failed to find any significant difference in the NMDA/AMPA amplitude ratio of the right CeC between formalin- and saline-injected rats (Figure 8(b.2); P = 0.98; Mann–Whitney U test). These additional analyses suggest that, not only the increased release probability from the LPB terminals, but also the postsynaptic properties that determine the magnitude of postsynaptic responses are affected, albeit slightly, in the right CeC after formalin injection.
Discussion
Here, we have demonstrated that hemilateral inflammation on either side of the face results in (1) synaptic potentiation of the LPB-CeC synaptic transmission exclusively in the right CeC and (2) an increased number of c-Fos-expressing cells in the bilateral LPB and predominantly in the right CeA. These findings are novel for the following reasons. First, this is the first study to describe the pain-associated synaptic potentiation at the LPB-CeC synapse caused by trigeminal nociceptive/inflammatory inputs. Second, this is the first study to demonstrate the right CeA predominance in the synaptic potentiation in pain models. Third, this is the first study to describe significantly augmented c-Fos expression in the bilateral LPB, in contrast to the right-predominant expression in the CeA, in the animals with latent inflammation on either side of the face. All of these points are discussed below.
LPB-CeC synaptic potentiation in the trigeminal inflammation model
Accumulated lines of evidence indicate that synaptic transmission from the LPB to the CeC neurons is markedly potentiated in persistent pain models, such as those of arthritis, 47 nerve ligation-induced neuropathic pain,21,43 colitis-induced visceral pain, 48 acid-induced muscle pain, 20 and latent formalin-induced inflammatory pain.13,49 The synaptic potentiation in these models is likely to occur through activation of the spinal primary afferents and subsequent sustained excitation of the spino-parabrachial ascending pathway.11,50,51 The LPB is the major target of the lamina I nociception-specific neurons. 11 This specific projection of nociceptive signal to the LPB is also a feature shared by inputs through the facial nerve/trigeminal ganglia. For example, in a similar manner to the superficial layer of the dorsal horn, the neurons in the SpVc project almost predominantly to the LPB.52,53 This study clearly demonstrates that the synaptic potentiation of the LPB-CeC synaptic potentiation also occurs in response to the persistent nociceptive inputs of trigeminal nerve origin, in a similar manner to those through the spinal nerves.
The right CeC predominance in the LPB-CeC synaptic potentiation
In addition, this study is also the first to demonstrate the right CeC predominance in the synaptic potentiation in persistent pain models. The predominant activation of the right CeA compared with the left has been already described using the number of neurons expressing c-Fos 26 and pERK 23 after right or left intraplantar formalin injection as well as an augmented unitary discharge in response to mechanical stimulus at the knee joint in an arthritis model 29 or at the hindpaw after spinal nerve ligation. 54 In addition, injection of MAPK/ERK kinase inhibitors or antagonists of the mGluR type 1 or 5 into the right CeA, but not the left CeA, mitigates formalin-induced hypersensitivity in the hind paw.25,28 These lines of evidence clearly point to the predominant role of the right CeA in the persistent nociception and establishment of a semi-chronic pain state. Our results extend these findings by adding an important example that the synaptic transmission between the LPB and CeA is also predominantly potentiated in the right CeA. This result in our trigeminal pain model is of particular interest because (1) the SpVc neurons have bilateral projections to the LPB, unlike the spinal superficial dorsal horn neurons that have mostly contralateral projections,37,46 and (2) we compared the expression of c-Fos and synaptic transmission between the bilateral CeAs in rats with formalin injection either to the left or right upper lip. It is thus likely that the predominant activation of the right CeA in the persistent pain models does not result from a specific asymmetrical projection pattern of the nociceptive projections arising from either side of the trigeminal inputs. At decapitation, the rats still showed edema in the upper lip that was limited to the side ipsilateral to the formalin injection, clearly indicating that the side of the inflammation is not the primary determinant of the right-specific activation of the CeA. In support of this, a recent paper demonstrated that a part of trigeminal afferents project directly to the LPB with an ipsilateral preference. 55 In addition, the LPB neurons activated through this direct pathway by trigeminal persistent pain also activate the ipsilateral CeC. These results indicate again that the discrepancy between the side of trigeminal nociception and the right-side predominance in c-Fos expression and plastic changes in the CeA cannot be attributed solely to the lateralized projections. Rather, it could be generalized that, regardless of the parts and side of the body of the primary injury or inflammation, the right CeA plays a specific role in the pain-associated plastic changes in the central nervous system.
An important finding of this study is thus that the inflammatory pain-associated synaptic potentiation shares this right-side dominance with the lateralized c-Fos expression in the same model, making it likely that they share common mechanisms or that one of them is a consequence of the other. The most straightforward interpretation is that the potentiation in the excitatory synaptic transmission resulted in more frequent excitation of the postsynaptic neurons, leading to higher c-Fos expression. In this context, the synaptic potentiation would have been upstream of the c-Fos expression in the CeA. The observation that the c-Fos expression was most intense in the right CeC (Figure 3), a subnucleus predominantly receiving direct inputs of LPB origin, 13 supports the notion that the augmented c-Fos expression is a consequence of the increased excitability of CeC neurons to LPB inputs due to increased synaptic efficacy. On the other hand, it is also likely that the asymmetric synaptic potentiation was a consequence of the increased c-Fos expression in the right CeA that precedes the synaptic changes. In the auditory cortex of mice, for example, learned plasticity is a consequence of c-Fos expression after specific sensory inputs. With only the present observation of c-Fos expression at 3 h and synaptic potentiation at 6 h, it was not possible to identify the causal link between these phenomena. The difference in time points complicates the interpretation of the results and neuronal activity measured with these different approaches may reflect different mechanisms. This issue needs to be addressed through experiments involving artificial inhibition of the CeC neuron excitation in response to LPB inputs with opto- or chemogenetic approaches.
Time-dependent consequences in the latent formalin inflammatory pain model
In this study, we analyzed the expression of c-Fos in the right and left LPB, CeA, and BLA sampled from the same rats 3 h after formalin injection. With this approach, it was possible to compare and correlate the bilateral level of c-Fos expression in these three nuclei in the same sets of rats. In general, expression of c-Fos protein is detected in the central nervous system (CNS) 60 to 120 min after elevated neuronal activities, suggesting that the initial nocifensive behaviors within 1 h post-formalin (Figure 1(a)) would cause c-Fos expression at around 60 to 120 min. Indeed, Hermanson and Blomqvist reported that the number of c-Fos-expressing LPB cells peaks at 60 to 70 min after orofacial injection of 5% formalin. 56 However, the elevated number of c-Fos-expressing neurons after aversive foot shock remained high at 1.5 h and 3 h in the mouse CeM, suggesting that the expression of c-Fos protein is maintained for several hours after the peak. 57 In accordance with this, Motojima et al. showed that a significant post-formalin increase in the number of c-Fos-positive cells in the spinal cord, paraventricular nucleus, and supraoptic nucleus could be observed at both 1.5- and 3-h post-formalin. 58 This suggests that an increased expression of c-Fos protein in the CNS could be detected at 3-h post-formalin. In the CeA, the number of c-Fos-positive neurons is significantly increased at 2 h and remains increased at 24 h in mice receiving intraplantar formalin injection in the left hind limb. 59 This significant increase in c-Fos-positive neurons is accompanied by an increase in the number of cells expressing pERK, which is first detected at 2-h post-formalin but not at 25 min in the CeA and also remains significantly increased at 24 h.23,59 Based on these previous results, we analyzed and compared the number of c-Fos-positive cells in the LPB, CeA, and BLA of the same rats at 3-h post-formalin.
We have already demonstrated that, in mice receiving intraplantar injection of formalin, the LPB–CeC synaptic transmission is significantly potentiated and the mechanical paw withdrawal threshold is significantly lowered bilaterally at 6-h post-formalin. 30 Adedoyin et al. 49 reported that the LPB-CeC synaptic transmission is not potentiated at 1 h but at 6-h and 24-h post-formalin. Although they did not compare the potentiation between the left and right CeC, our results that the synaptic transmission in the right CeC is potentiated at 6 h are in line with their observation. As discussed above, the single time point observations of c-Fos expression and synaptic potentiation in this study are not sufficient to identify the causal link between these pain-related phenomena. Recently accumulated lines of evidence indicate that subcutaneous formalin injection leads not only to acute nocifensive behaviors lasting 1 h but also to long-lasting (e.g., days to weeks) neuropathic pain-like consequences in nociceptive, behavioral, and emotional phenotypes.59–61 It remains to be clarified whether the right-side specific potentiation in the CeC and specific correlation with the BLA found in this study is a feature also observed at later stages. 49 It is thus expected that our present findings would provide a key to understanding how nociception and inflammation trigger the neuronal plasticity in the higher centers that would lead to central sensitization, a hallmark of chronic pain-associated symptoms. 27
Mechanism underlying the right-side dominance in CeA activation
Importantly, while there was clear right-side dominance in the c-Fos expression and synaptic potentiation in the CeA regardless of the inflammation side, such asymmetry was not evident in the activated LPB. Rather, the activation of LPB in the formalin-treated rats was mostly symmetric with a slight but nonsignificant projection-side dependence. This symmetric activation might be attributed to symmetric fiber projections from the periphery to the LPB37,61 and/or symmetric rubbing behavior using bilateral forelimbs observed in all animals. As indicated in Figure 1(b) and (c), the edema of the face remained even at 6-h post-formalin only in the injected side, suggesting that bilateral projections, rather than the bilateral scratching, would be the primary cause for the bilateral activation of LPB neurons. This indicates that the activation pattern of the LPB following inflammation could not directly be the primary determinant of the CeA asymmetry.
Moreover, it is unlikely that the LPB neurons on both sides have more projections to the right CeA or stronger synaptic contact with right CeA neurons because there was no significant difference in the eEPSC amplitude between left and right CeC in the saline-injected rats (Figure 6 (b.2) and (c.2)). In support of this, there was no significant rank-order correlation between any pairs between the right and left CeA and LPB in formalin-treated rats, suggesting that the increase in c-Fos expression after formalin injection occurred through independent mechanisms for the CeA and LPB.
One of the possibilities is that this CeA asymmetry reflects asymmetric mechanisms intrinsic to the CeA. For example, Kolber et al. attributed the predominant role of the right amygdala in pain-like behavior to right-specific expression of mGluR type 5. 25 Another possibility is that this CeA asymmetry depends on the right–left difference in extrinsic inputs to the CeA other than those from the LPB. For example, the neurons in the CeA receive inputs from the BLA,21,62 which carry more integrated information from higher structures. In support of this, the rank order of the number of c-Fos cells in the right or left CeA was significantly correlated with that in the left or right BLA (Figure 5(c)), despite the lack of a significant increase in the number of c-Fos-expressing neurons after formalin in either the right or left BLA (Figure 5(a)). These results might indicate that the BLA and CeA are under the lateralized influence of common extrinsic sources. It remains to be determined whether the right and left BLA send a similar number of fibers to the CeA and evoke a similar postsynaptic response in CeA neurons. At least in neuropathic pain models, the BLA to CeA synaptic transmission is also potentiated but mainly symmetrically. 21 Altogether, (1) augmented LPB inputs in response to sustained nociceptive/inflammatory signaling are necessary for the synaptic potentiation and/or c-Fos expression in the right CeA regardless of the side of the inputs, and (2) when this synaptic potentiation and/or c-Fos expression in the CeA happens, an asymmetrical influence of undetermined origin is shared by the CeA and BLA, resulting in the right-side dominance correlated between these nuclei in the inflammatory pain model. A possible mechanism for this “priming” by the LPB input is the release of calcitonin gene-related peptide (CGRP) and subsequent activation of CGRP receptors in the CeA, which enhances NMDA receptor activities without affecting AMPA receptors.26,63,64 In this regard, the synaptic potentiation at the LPB-CeC synapses would not be a simple result of Hebbian plasticity but rather a complex and integrated outcome of the pain-associated activities in the network connecting the amygdaloid complex in which the functions are asymmetrically distributed.
Implications of the present results
The LPB-CeA circuits underlie various types of aversive signaling and adaptive emotional responses. Accumulated lines of evidence support the notion that the functional role of the CeA in pain depends on the side in rodent models and human patients. 27 The present study provides further evidence indicating that this asymmetry in the regulation of pain-related responses and synaptic plasticity do not depend on the side of origin of nociception and the asymmetry in the trigemino-parabrachial pathway. A recent study using optogenetic activation of either right or left CeA in a bladder pain model demonstrated that, while excitation of the right CeA is pronociceptive, that of the left CeA actually inhibits nociceptive responses, suggesting that the bilateral CeA plays opposite roles in the regulation of nociception sensitivity. 65 Functional and morphological asymmetry has been reported for various structures in the rodent, fish, and human brain.66–71 Although the functional and cellular mechanisms underlying such asymmetry remains largely undetermined (but see Ukai et al. 67 ), this would imply asymmetric ontogenic mechanisms during network formation in the embryonic stage. 72 Importantly, the present results do not mean that the left CeA does not receive nociceptive information. In contrast, there was no right–left difference in the amplitude of postsynaptic responses to LPB afferent stimulation in saline-injected rats. The present results and the evidence from other research groups indicate that the right CeA is predominant in both nociception-associated plasticity and pro-nociceptive influence. As such, the right CeA should be called the “nociceptive-adaptive amygdala.” Whatever the mechanism, it should be noted that, particularly in studies dealing with the nociceptive and aversive role of the amygdala, researchers hereafter should clearly describe which side of the amygdala they used based on the present findings.
Footnotes
Authors’ contributions
YM and YT carried out all experiments and data analyses based on discussions with AMW and FK using the homemade programs written by FK, YM, YT, and FK designed the study and wrote the text. All authors participated in discussion and read and approved the final manuscript.
Declaration of Conflicting Interests
The author(s) declared no potential conflicts of interest with respect to the research, authorship, and/or publication of this article.
Funding
The author(s) disclosed receipt of the following financial support for the research, authorship, and/or publication of this article: This work was supported by Grant-in-Aid for Exploratory Research from the Ministry of Education, Culture, Sports, Science and Technology (MEXT) to FK (No. 23650208), the MEXT-Supported Program for the Strategic Research Foundation at Private Universities (No. S1311009) to FK, Grants-in-Aid for Scientific Research (B) to FK (Nos. 25293136 and 18H02722), the Strategic Research Program for Brain Sciences to AMW and FK, the Japan Science and Technology Agency, PRESTO to AMW, a Grant-in-Aid for Scientific Research (C) to AMW (No. 16K07004), a Grant-in-Aid for Young Scientists (B) and Grant-in-Aid for Scientific Research (C) to YT (Nos. 15K19194 and 17K09042).