
Abstract
This study presents the findings of an investigation into the self-reported TV habits of adults with an intellectual disability, where time watching TV was used as a proxy for sedentary behaviour (SB). Risk factors identified for the general and intellectual disability populations and standard covariates of age, sex, level of intellectual disability, living circumstances and BMI were explored to determine their viability as contributors to increased TV viewing and SB. Missing data was imputed using Multiple Imputation Chained Equation (MICE). Multinomial logistic regression and Chi-squared Automatic Interaction Detector Analysis (CHAID) analyses of risk factors for increased TV viewing were explored and compared. The Systems of Sedentary Behaviour (SOS) framework was used to structure results. Novel risk factors for increased TV viewing were identified.
Introduction
This study examined the self-reported TV habits of adults with an intellectual disability, where TV time was used to represent sedentary behaviour (SB). Sedentary behaviour is defined as ‘any waking behaviour characterized by an energy expenditure of ≤1.5 METs while in a sitting, lying or reclining posture’ for example watching television or working on a computer (Tremblay et al, 2017, pp1-17). Until recently, most studies have focussed on TV viewing as the primary proxy measure for SB because it is the predominant SB across all age groups which people regularly engage in, often for extended periods, with Irish and US adults watching 2.5 and 3.5 hours/day respectively (TV Audience Measurement (TAM) Ireland, 2023; Chang et al., 2008; Clark et al., 2009; Dunstan et al., 2005; Gershuny et al., 2005; Healy et al., 2008; Veerman et al., 2012; U.S Bureau of Labor Statistics, 2021). In 1993 an activity compendium for the metabolic requirements for everyday activities from sitting quietly to vigorous exercise was published which found that watching TV had the lowest metabolic output of all sitting activities for example knitting or reading (Ainsworth et al, 1993). An additional study found that one’s metabolic rate actually decreased when watching TV (Klesges et al, 1993). Concerningly watching more than 2 or 3-hours TV a day has been reported to reduce life expectancy by 1.38 years and 2 years respectively; while watching an average of over 6 hours TV per day reduced life expectancy by almost 5 years (Katzmarzyk and Lee, 2012; Veerman et al, 2012). An increase of one hour TV viewing per day reduced life expectancy by over 20 minutes for over 25s, similar to the effect of smoking two cigarettes (Veerman et al, 2012). A significant dose-response relationship was observed between watching TV in excess of two hours per day and increased systolic blood pressure and waist circumference and increased odds of sarcopenia occurred in older adults (Healy et al, 2008; de Souza et al, 2022). Increased time spent watching TV has been shown to increase cardiovascular disease (CVD), diabetes and metabolic syndrome (MetS), with significant weight gain associated with watching more than five hours per day as opposed to less than three hours per day (Dunstan et al, 2005; Wijndaele et al, 2009; Wijndaele et al, 2010; Pereira et al, 2012). A Japanese study on older adults found that increased TV viewing was associated with higher levels of obesity/overweight irrespective of activity levels (Inoue et al, 2012).
However, some propose that TV viewing may not be the most accurate measure of overall SB as it is only one potential aspect in this evolving and complex area (Crawford et al, 1999). With the growth of mobile telephones as multidimensional devices, streaming services and the increase of computer and IPAD use, TV viewing alone may be insufficient to capture all relevant data meaning SB levels may be underestimated. For example, a Brazilian study found that younger adults engage in more diverse screen activities (Silva et al, 2021).
Extended TV viewing has been found to substantially displace energy expenditure from physical activity (PA), especially moderate-to-vigorous (MVPA) exercise, perhaps meaning that negative health effects associated with TV viewing may actually be an association with inactivity (Matthews et al, 2018). TV viewing appears to be an autonomous contributor and risk factor for MetS in adults, irrespective of activity levels or types (Chang et al, 2008). If adults spend more than four hours per day (excluding working) watching TV or on a computer, twice the odds of having MetS was observed and the health benefits of meeting the minimum MVPA was attenuated (Ford et al, 2005). Similarly, an Australian cross-sectional study found that for each one hour increase in TV viewing there was a 12% and 26% increase in MetS in men and women respectively. Conversely, at least 30 minutes of MVPA per day reduced the prevalence of MetS by 11% and 28%; an activity level that exceeds the minimum activity recommendation for health benefits recommended by the WHO (Dunstan et al, 2005; WHO, 2020). A “couch potato” syndrome in respect to TV viewing posits that increased calorific intake occurs when watching TV and several studies suggest that increased snacking of energy-dense, high-fat, low-nutritional food ensues (Brown and Witherspoon, 2002; Snoek et al, 2006; Thomson et al, 2008). Mindless eating of such snacks could be partially explained by exposure to the widespread advertising of unhealthy snack foods on TV which is suggested as further contributing to more food consumption in adults and children, especially in those who were overweight or obese (Powell et al, 2007; Harris et al, 2009; Kemps et al, 2014). It is unknown if obesity is a predictor of TV viewing habits and SB or a result of this SB; but a contributor to obesity could be the reduced energy expenditure while watching TV and/or an increased calorific intake while engaging in TV watching or a combination of both. There is limited evidence on the prevalence of the screen behaviour of adults with intellectual disability and its associations with their health outcomes (Hsieh et al, 2014; 2017; Mikulovic et al, 2014; Melville et al, 2018). The aim of this study was to examine the self-reported TV habits of older adults with intellectual disability to determine modifiable and non-modifiable contributors.
Methods
Framework
The Systems of Sedentary Framework (SOS) was used to structure the results of this study in a concise and adaptable manner (Chastin et al, 2016). The SOS model groups multiple levels of influence on health behaviours into six clusters. These different levels of influence ranged from environment and policy to social, individual and interpersonal factors.
Literature review
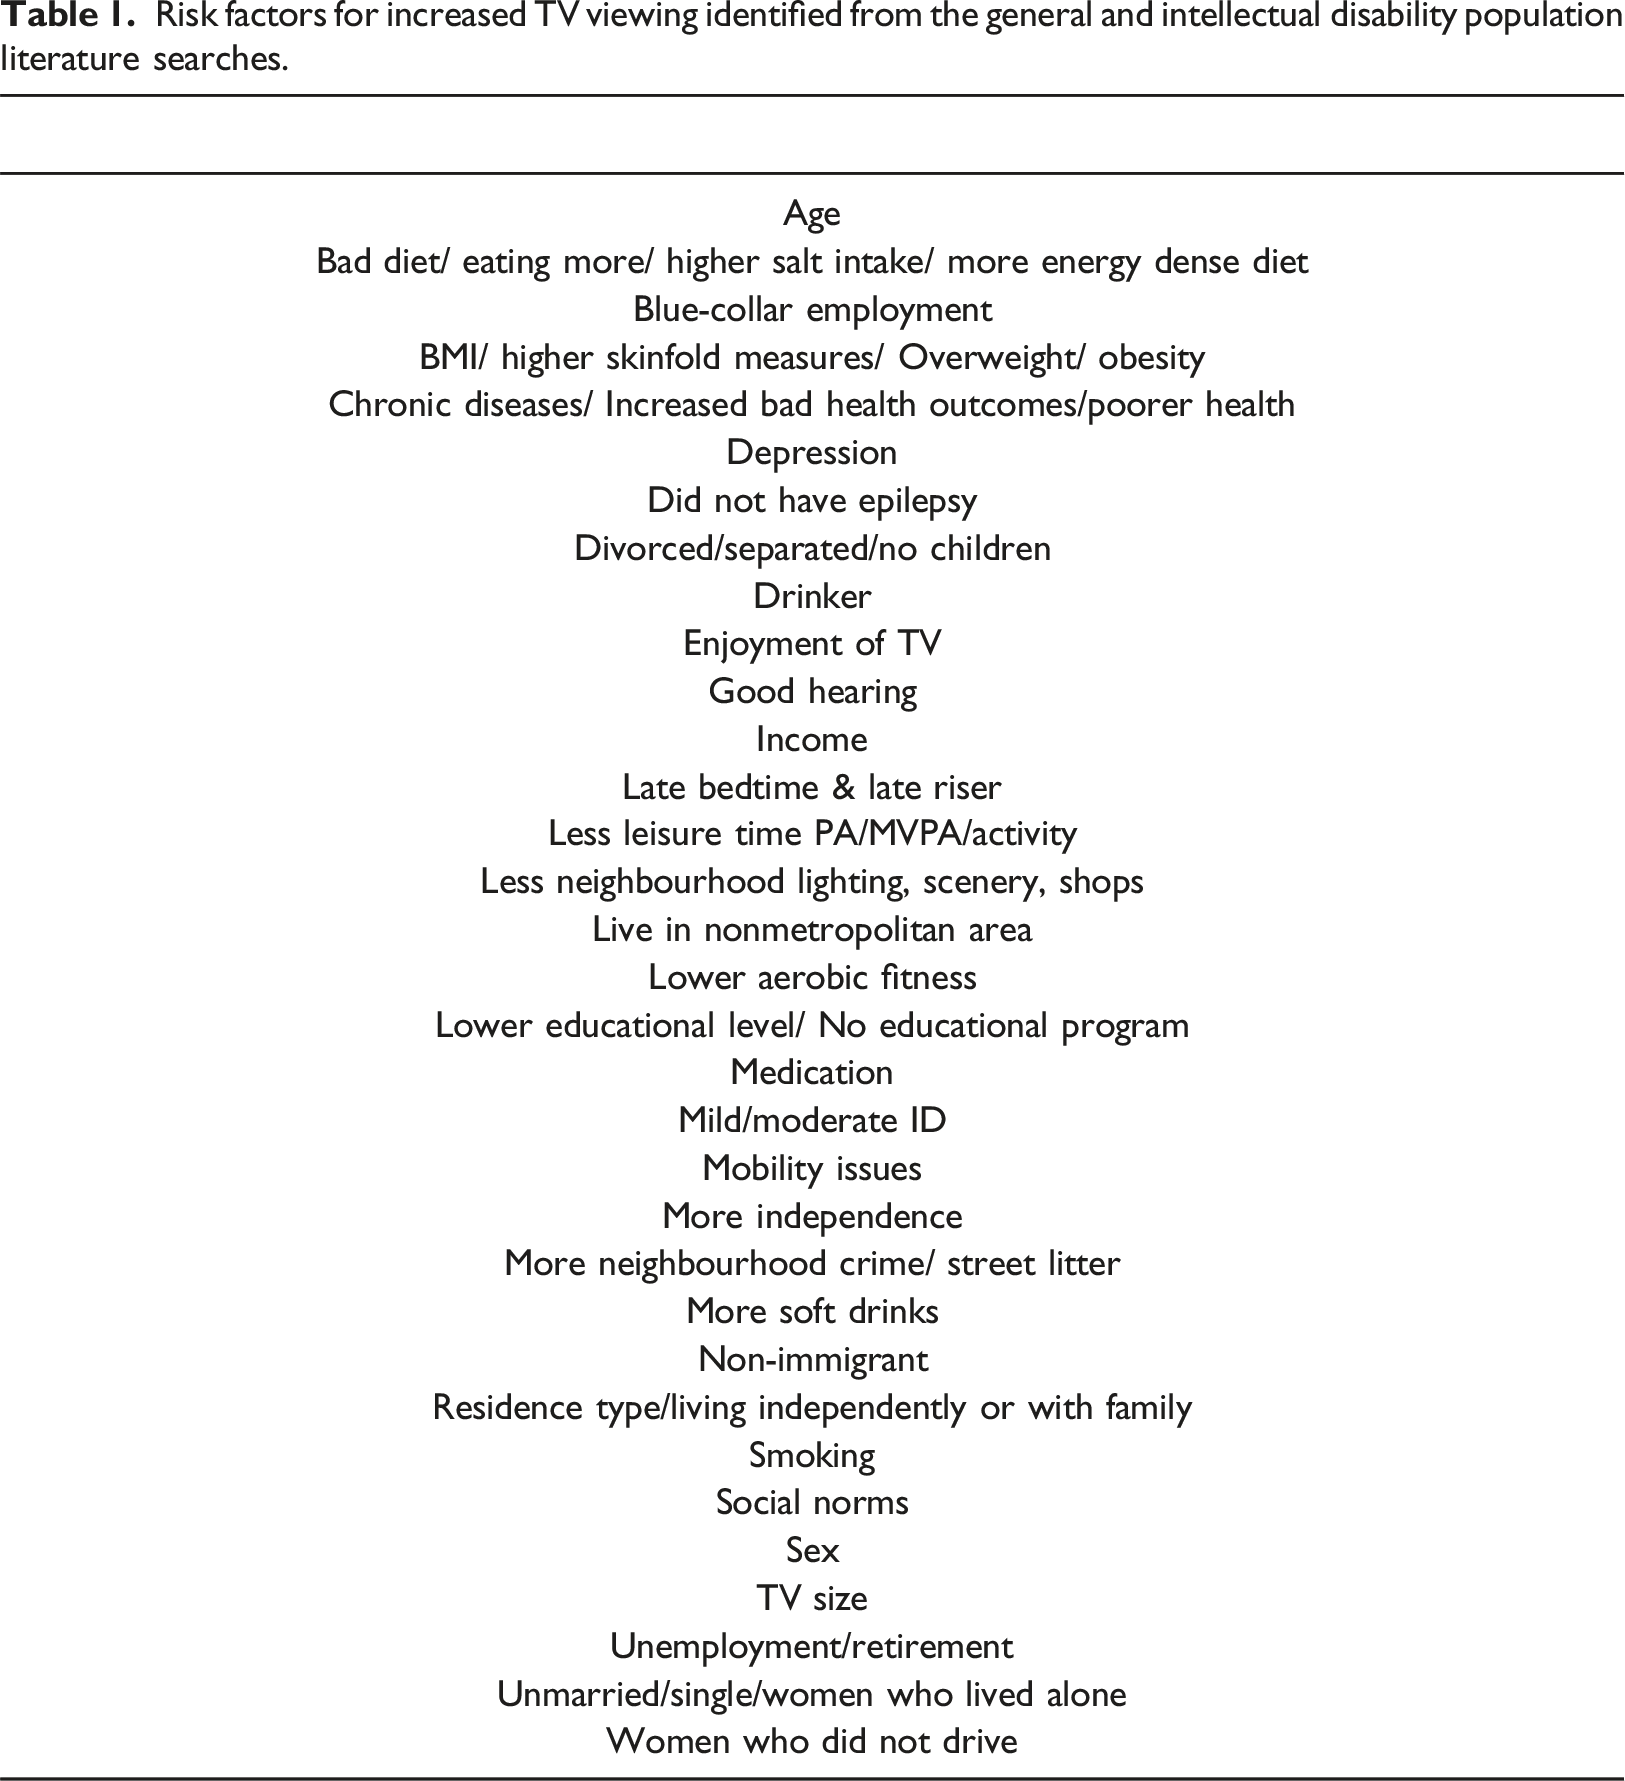
Risk factors for increased TV viewing identified from the general and intellectual disability population literature searches.
Study design and participants
This study was positioned within a longitudinal study on aging, from which a random sample of adults aged over 40 years, of all levels of intellectual disability and living circumstances were selected. Recruitment details are available elsewhere (McCarron et al., 2022). All participants with an intellectual disability who were registered on the National Ability Support System were eligible to participate. Data collection occurred every three years, called a wave. This study draws upon three waves of data. Ethical approval was obtained from the Faculty of Health Sciences of the university and from service providers involved in the study. Given that direct longitudinal comparisons were necessary, only individuals with an intellectual disability who participated in all three waves were included in the analyses: 603 for Wave 1, 576 for Wave 2 and 601 for Wave 3. Differences in numbers reflect some not answering every relevant question in each wave. Written informed consent or proxy consent by carers who knew the participant more than six months was obtained from all participants. Almost 32% of responses were proxy respondents.
Outcome measure
The TV watching habits of participants was garnered by asking the following TV question: ‘Over the past 30 days, on average, how many hours per day did you sit and watch TV or videos? Response categories ranged from none, <1, 1-3, 3-5 and >5 hours TV/day (five categories). The five category TV question answers were used for some analyses, while in others, there were recodes into two categories: less than and greater than three hours TV viewing. The decision reflected three-hour sitting threshold to classify SB was based on evidence that sitting for more than three hours/day had detrimental effects specifically for CVD and diabetes (Clark et al, 2009; Patel et al, 2010; Periera et al, 2012).
Statistical analysis
Relationships were explored initially using crosstabulation, and subsequently by either a binary or multinomial regression to examine the overall model fit, explain the contribution of each of the independent variables and explore any further significant associations. Pearson chi-square was used to explore bivariate associations between time watching TV and the standard covariates sex, age, level of intellectual disability, aetiology, living circumstances and body mass index (BMI) as well as identified through literature reviews and mapped to study variables. Values of less than 0.05, to ensure 95% confidence in results, were used to identify significant associations. The dependant variable of how many hours TV/videos were watched and the significant independent variables from bivariate comparisons were used in the regression models. Results for all standard covariates were computed on a wave-by-wave basis and for direct comparison the same participants were examined longitudinally.
Wave 3 data was used for the complete analysis for all risk factors and adjustments were made for significant variables. Multiple Chained Imputation Equation (MICE) was used to impute missing data. Both the two- and five-category TV watching variables were explored initially but only the five-category analysis yielded consistent significant results and was carried forward to the regression analyses. The dependent TV variables and independent variables were grouped as categorical variables in all statistical models. Multicollinearity was investigated to ensure no inter-variable dependencies were present.
Sample size
A power analysis showed the minimum sample size required to provide meaningful results for this investigation was 122. The actual study sample size was 576 participants.
Missing data
All missing values were thoroughly investigated. Before a missing value imputation was computed, a missing data pattern analysis was completed. Multivariate Imputation by Chained Equations (MICE) dealt with variables with up to 20% missing data, specifically Missing At Random (MAR) and Missing Completely at Random (MCAR) (Azur et al, 2011; Tabachnick and Fidell, 2014). Post-MICE the missing data was zero.
Results
Participant demographics
Wave 1-3 participant demographic profile for the same 609 participants & the mean number of TV hrs watched per day stratified by demographic characteristics.
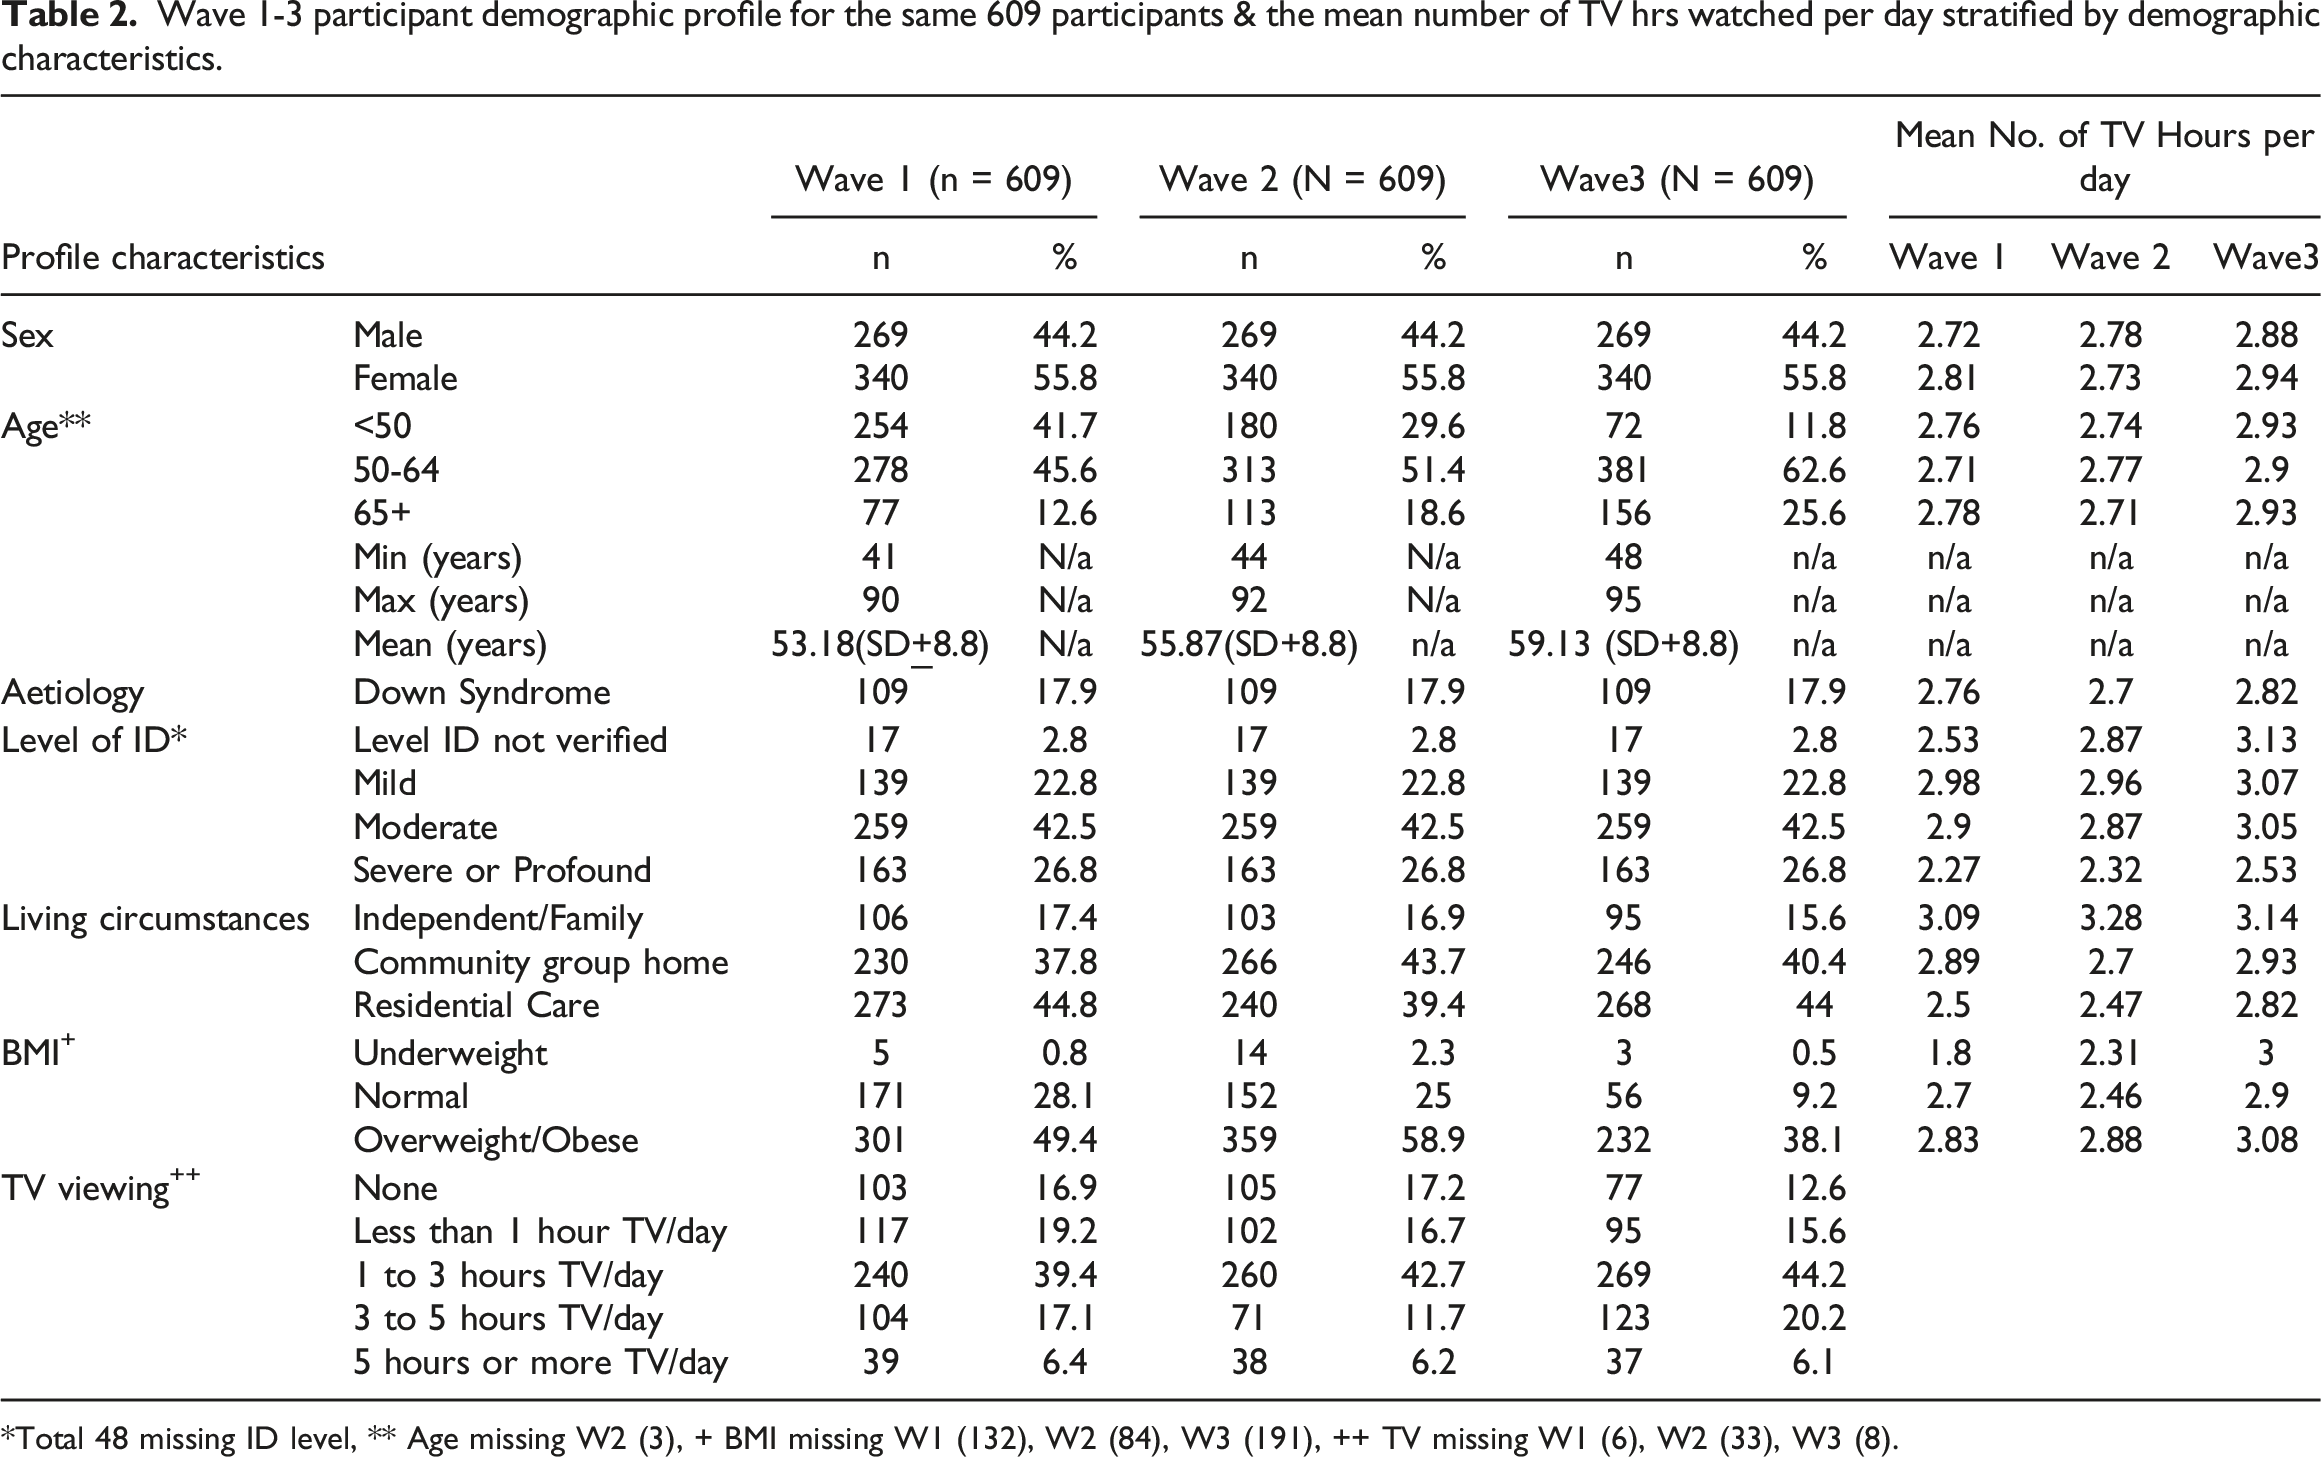
*Total 48 missing ID level, ** Age missing W2 (3), + BMI missing W1 (132), W2 (84), W3 (191), ++ TV missing W1 (6), W2 (33), W3 (8).
TV habits examined across two- and five-categories
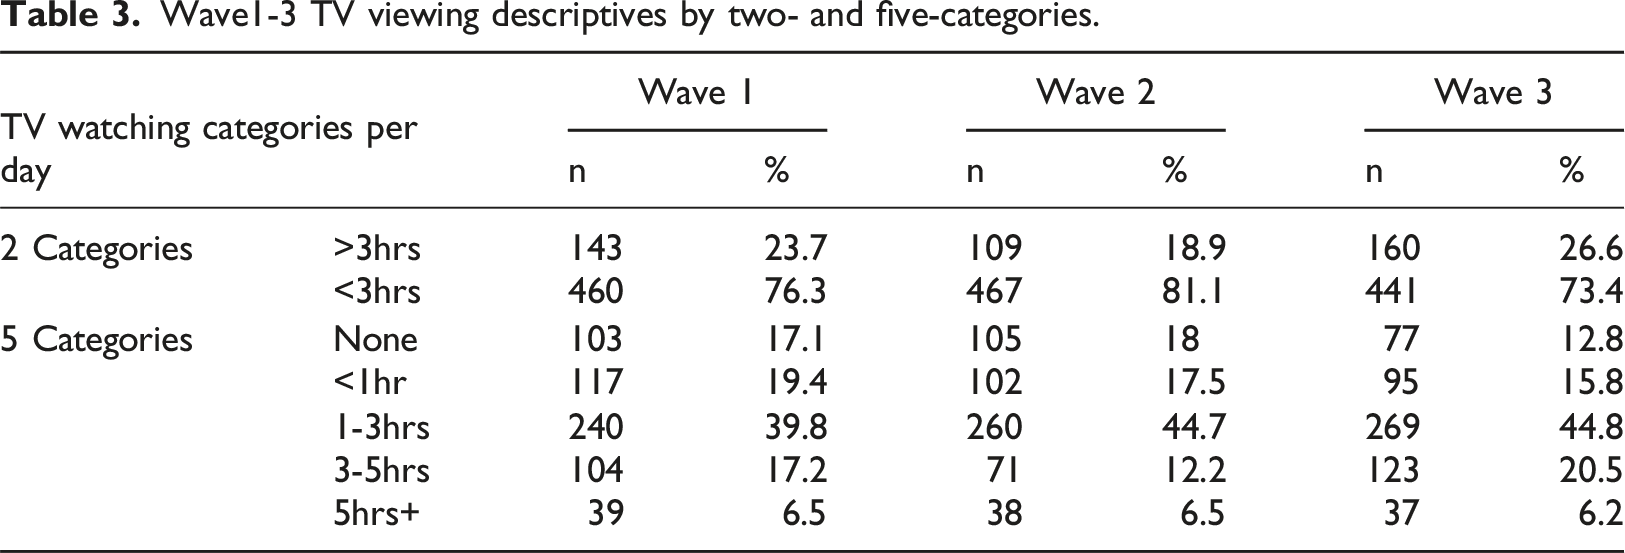
Wave1-3 TV viewing descriptives by two- and five-categories.
Risk factor exploration
Examinations of risk factors for increased TV viewing were completed in two phases. The first phase involved bivariate examination of the covariates of sex, level of intellectual disability, aetiology, residence, age and BMI and the second phase examined the risk factors identified from the literature review. • Phase 1: standard co-variates
Wave 1-3 Pearson chi-square p-values for independent factors & TV categories.
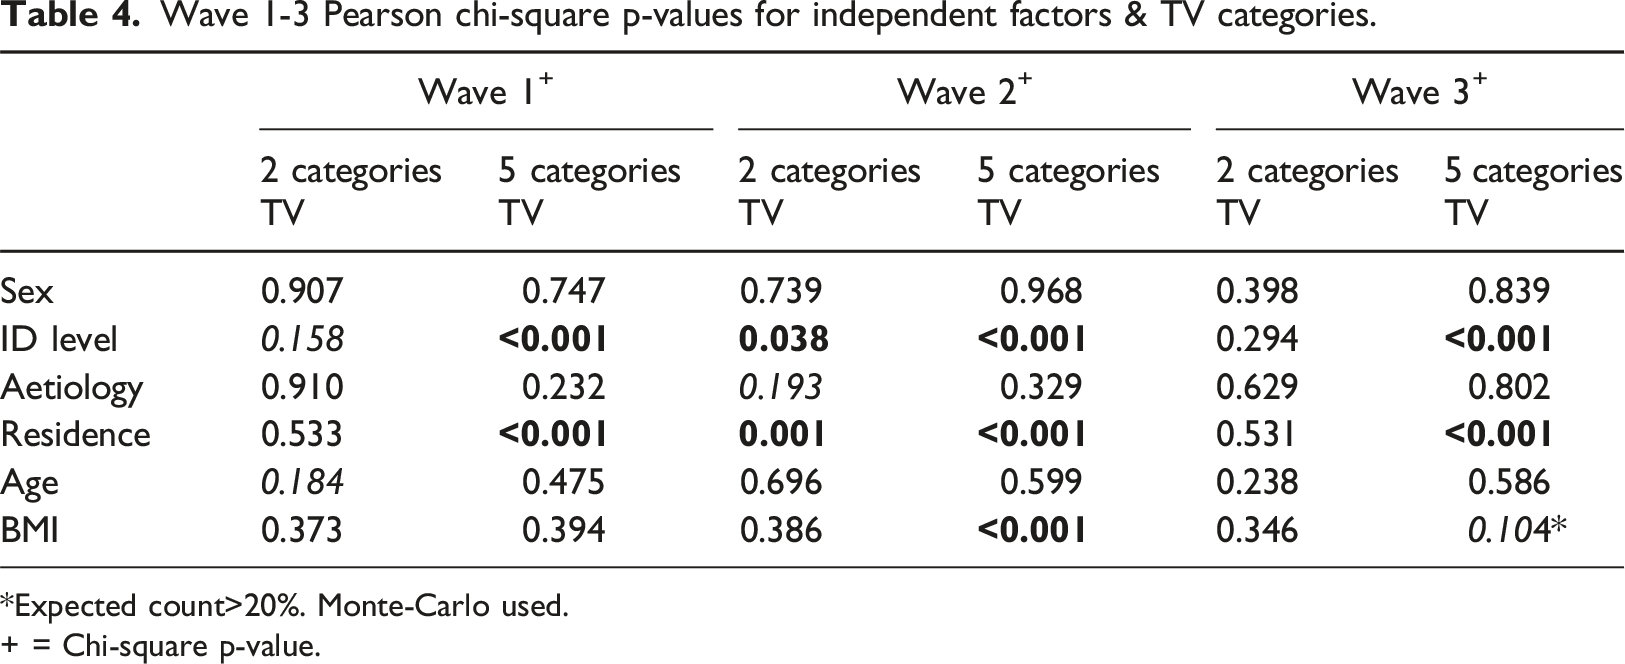
*Expected count>20%. Monte-Carlo used.
+ = Chi-square p-value.
For all three waves, those with a severe/profound intellectual disability were approximately 4-6 times less likely to watch TV across all categories from 1 hour to > 5 hours [COR=5.9; p<0.001, 95%CI 2.9-11.9; COR=5; p<0.001, 95%CI 2.1-10.4; COR=4.5; p=0.005, 95%CI 1.5-12.3]. In addition those with a moderate level were 3 times more likely to watch < 1hour TV/day [COR=3; p=0.019, 95%CI 1.2-7.7]. Although there was no missing living circumstance data some TV data was missing so the multinomial regression was executed with imputed data. Those in residential settings were approximately 2-4 times less likely to watch 1 to up to >5 hours TV/day compared to those who lived independently/with family [COR=4.3; p=0.001, 95%CI 1.8-11; COR=2.8; p=0.037, 95%CI 1.1-7.9; COR=3.8; p=0.021, 95%CI 1.2-12.4]. Furthermore those in CGH were almost 4 times less likely to watch >5 hrs TV/day [COR=3.8; p=0.041, 95%CI 1.1-14.7]. Those who were underweight had a p value <0.2 so BMI progressed to the next analysis stage. • Phase 2: literature review risk factors
TV viewing correlates Pearson chi-square p-values for 5 category TV.
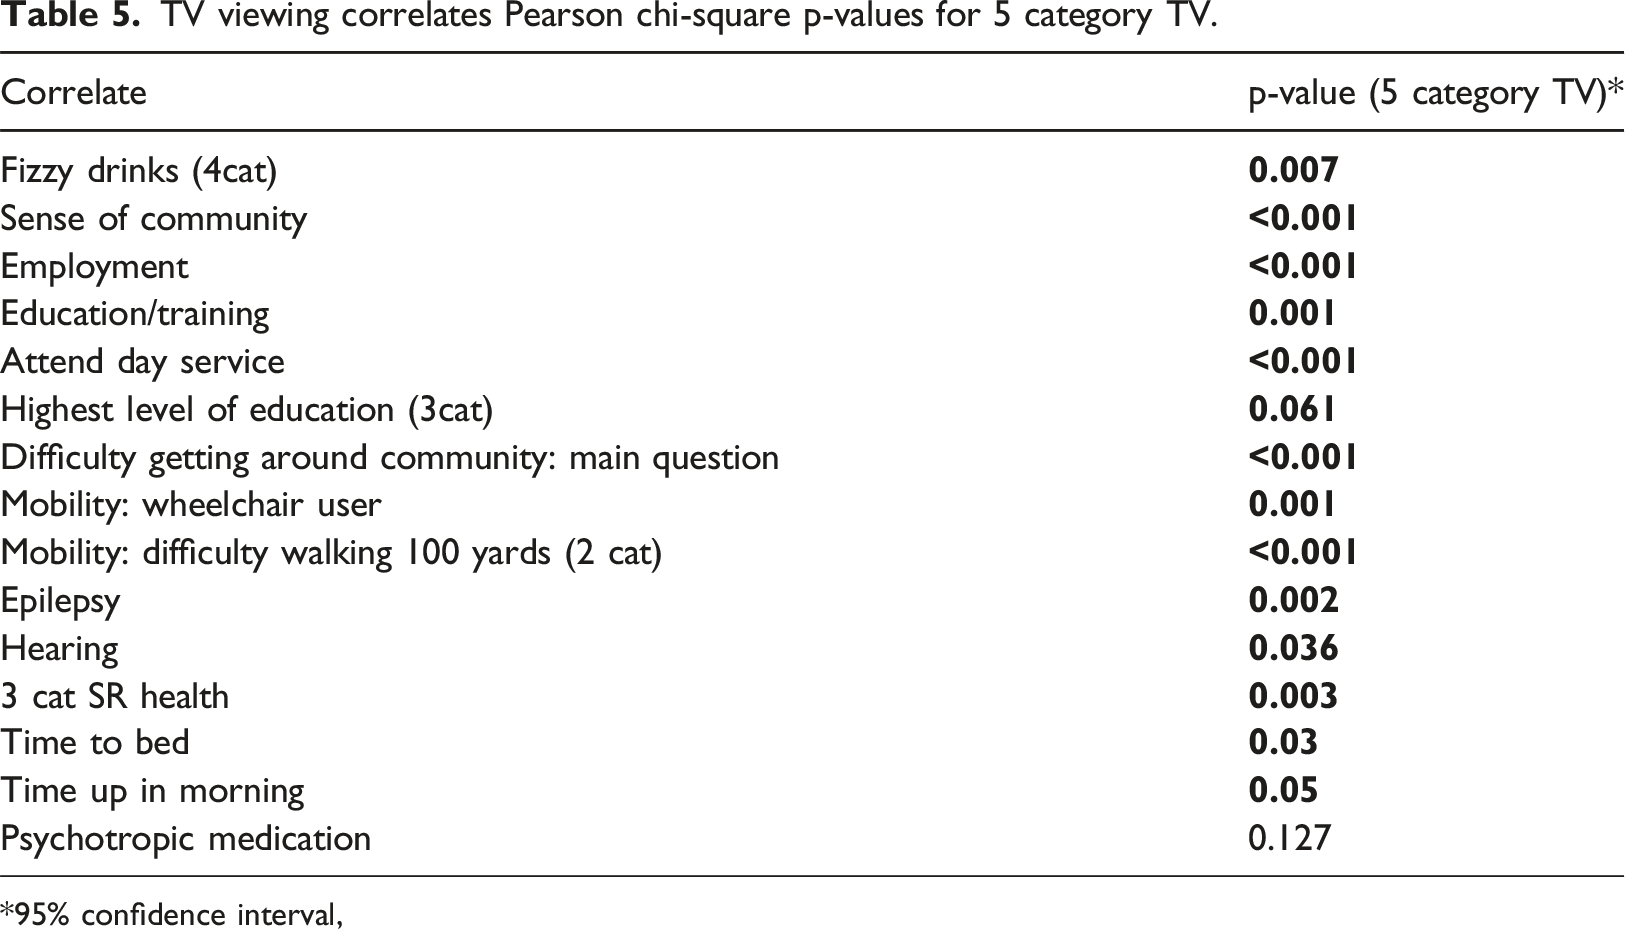
95% confidence interval,
Multicollinearity
Multicollinearity was investigated using Tolerance and Variance Inflation factor (VIF). All VIF values were less than two and the minimum tolerance was 0.68 indicating minimal inter-variable correlation.
Multinomial regression with five categories of TV viewing and significant variables
Adjusted odd ratios (AOR) controlled for all the predictor variables in models. A total of fifteen variables had significant relationships with TV viewing and were carried forward to the full model: alcohol, fizzy drinks, wheelchair, part of the community, employment, education/training, day service attendance, difficulty getting around community, difficulty walking 100yards, epilepsy, self-rated health, up after 7am, smoker, psychotropic medications and hearing excluding the standard covariates. Wheelchair use was covered in the walking 100yards variable while alcohol and fizzy drink consumption were deemed as consequences and not causes of TV watching so removed (Engels et al, 2009). The covariates of age, sex, living circumstances, intellectual disability level and aetiology were forced back into the model for a final model consisting of sixteen variables. The education/training variable was removed as it could not be consolidated without errors. The Nagelkerke for the model was 30.2%.
There were three significant risk factors found for increased TV viewing. Those with a moderate intellectual disability were approximately 3-4 times more likely to watch less than one-hour and up to five-hours TV/day [AOR=4, p=0.008, 95%CI 1.4-11.4; AOR=2.5, p=0.043, 95%CI 1-6.3; AOR=2.9, p=0.030, 95%CI 1.1-7.6]. Participants who rose later than 7am were 4-times more likely to watch 3-5hours TV/day [AOR=4.1, p=0.011, 95%CI 1.4-11.8]. Finally those who had difficulty walking 100yards were 3-times more likely to watch over 5-hours TV/day [AOR=3.1, p=0.026, 95%CI 1.2-8.3].
A Chi squared automatic interaction detector (CHAID) decision tree was also used to investigate the predominant risk factors for increased TV viewing. The algorithm determined three terminal nodes for TV watching prevalence. The average TV time per day was approximately 2.9-hours for all 609 participants [p<0.001]. Intellectual disability was the only significant predictor for high TV time. Over 72% of participants with a mild/moderate intellectual disability watch on average 3.05-hours TV/day while almost 28% with a severe/profound intellectual disability watched on average 2.5-hours/day.
Adapted Systems of Sedentary Behaviour (SOS) model
The risk factors identified from the multinomial regression and CHAID analyses were summarised in an SOS model. Figure 1 shows the adapted SOS model with the significant correlates of increased TV viewing in the intellectual disability population, as identified by CHAID and multinomial logistic regression. The final model addressed two out of the proposed six clusters i.e. physical health and well-being and psychology and behaviour. Only three significant factors (highlighted in red) were identified for increased TV viewing. Systems of sedentary behaviour framework showing total final correlates of increased TV viewing for intellectual disability population.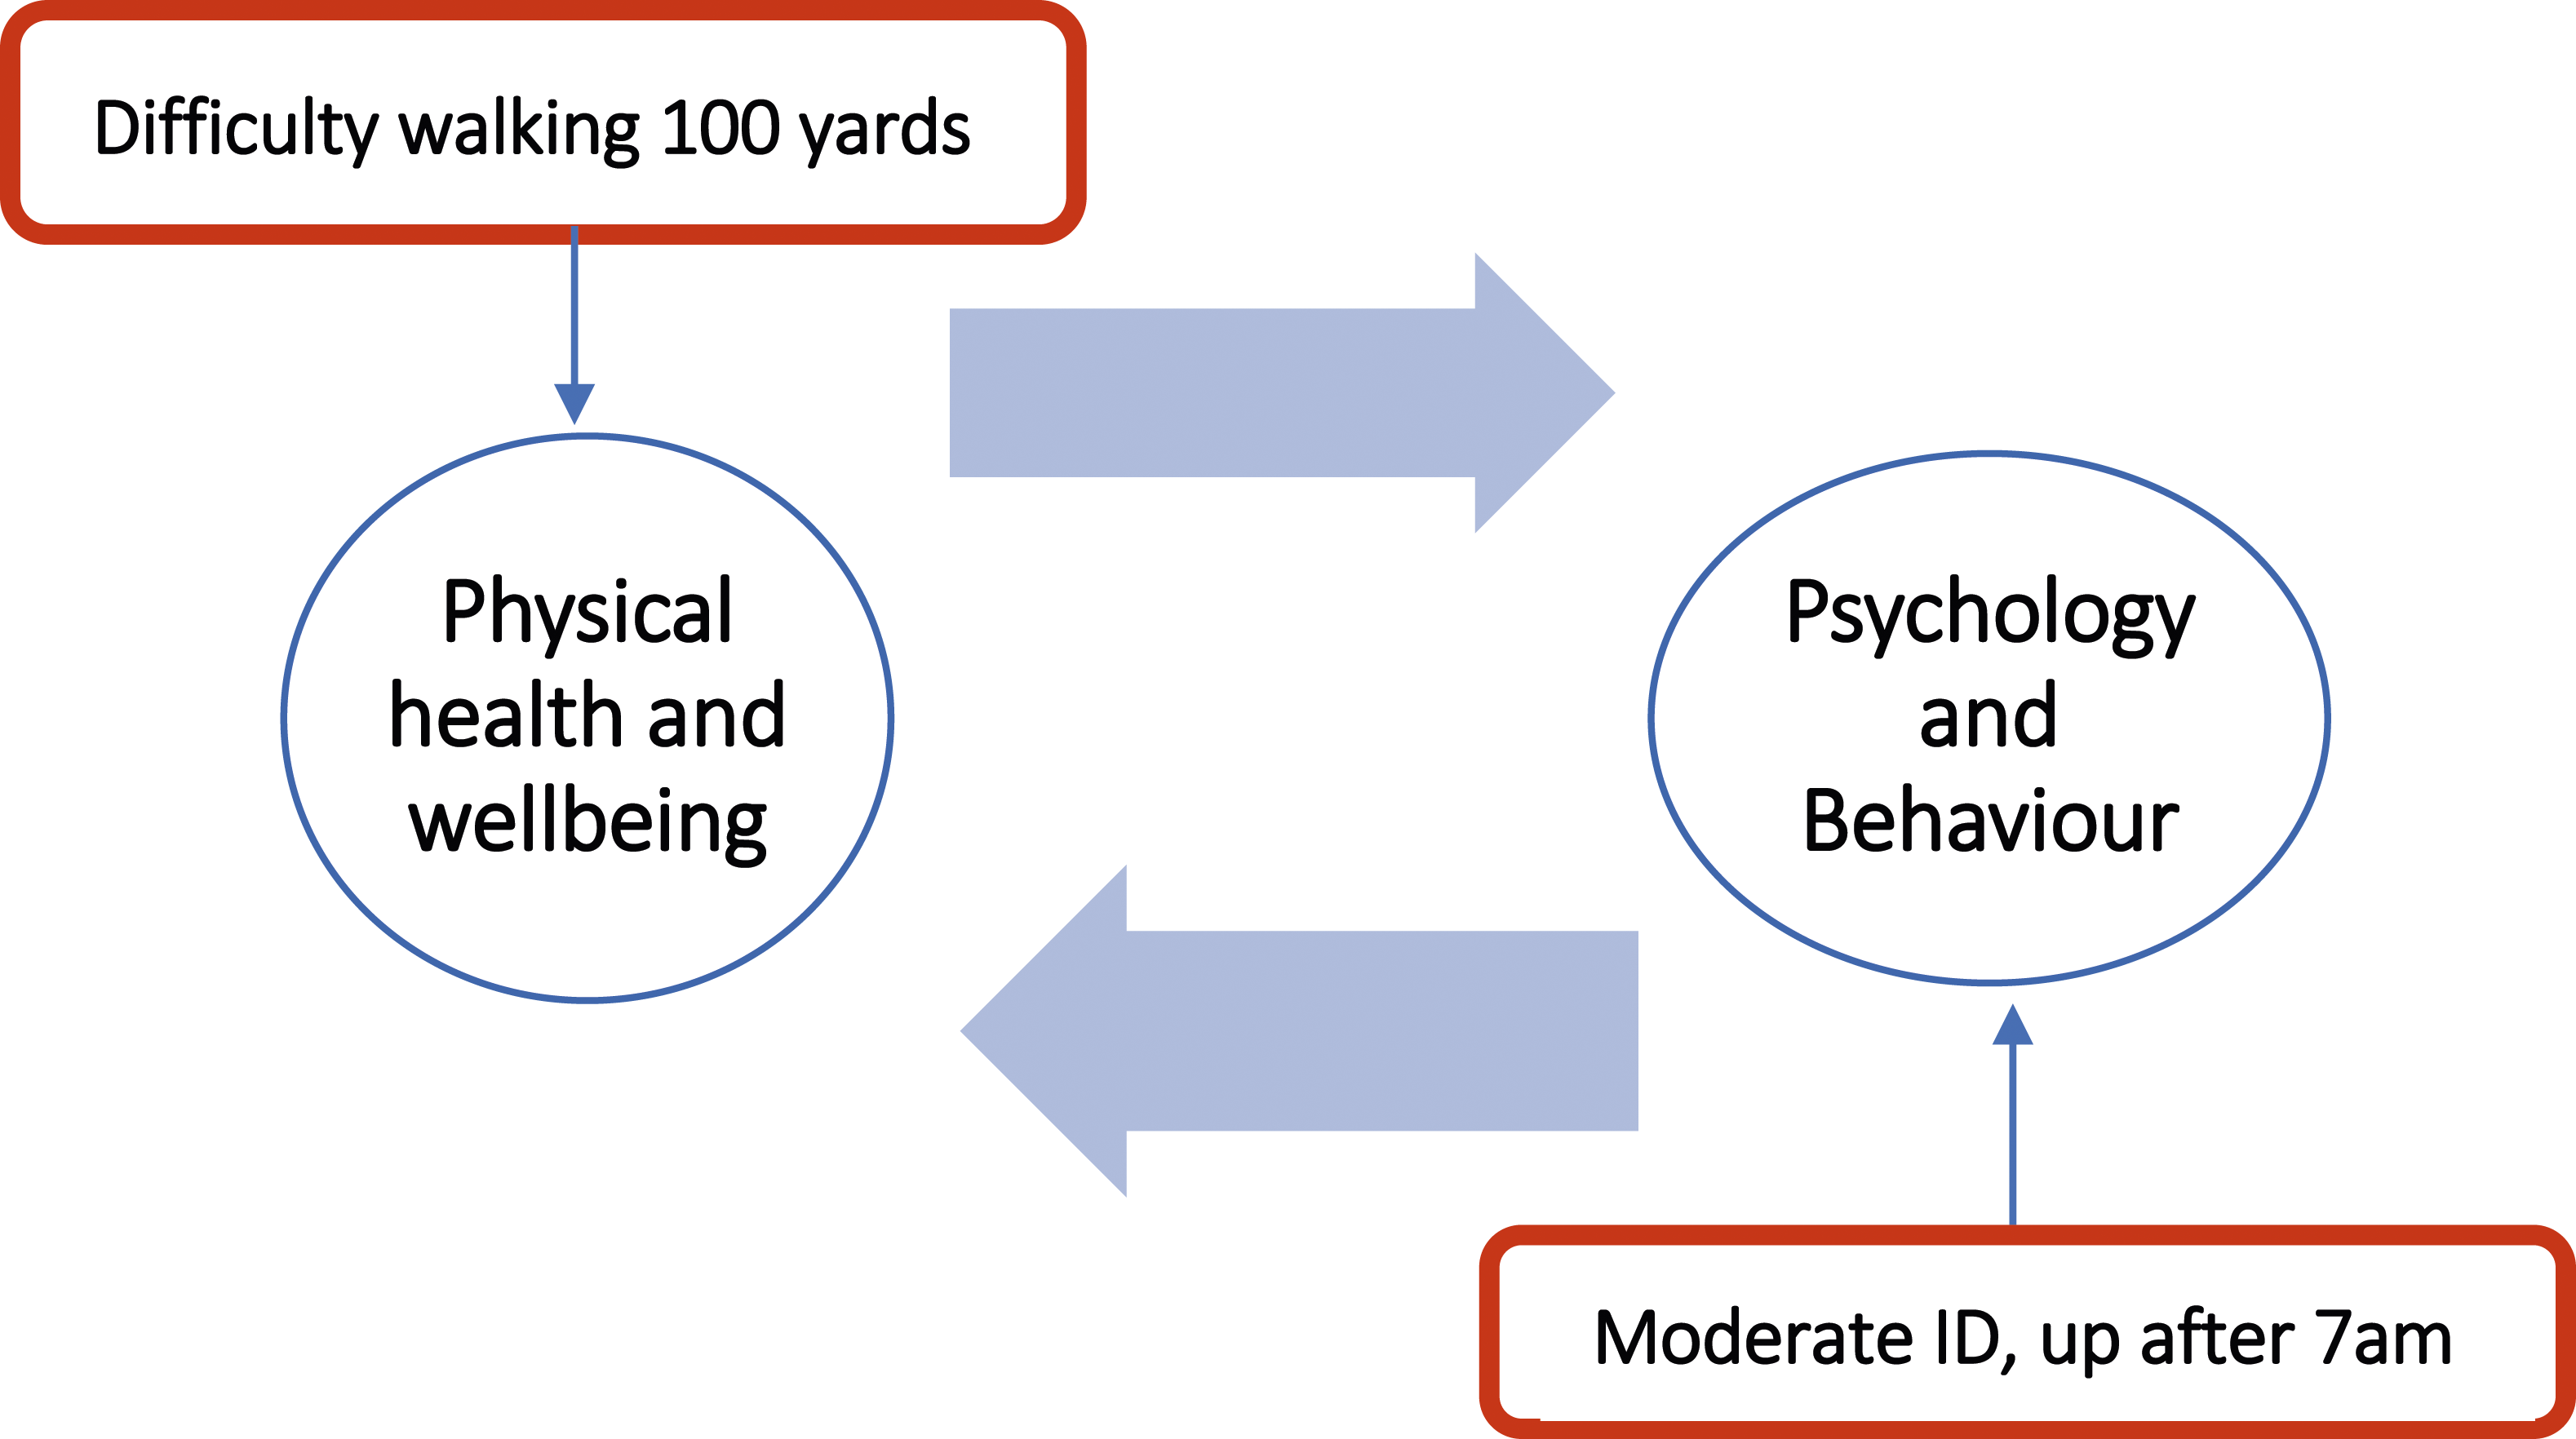
Discussion
The objective of this analysis was to determine significant risk factors that contributed to increased TV viewing among older adults with an intellectual disability, where TV was used as a surrogate for SB. In addition to the standard covariates, other potentially contributing factors were examined and framed using the SOS framework for a total of 31 variables of interest. Over 40% of participants watched between 1-3 hours of TV/day. The existing intellectual disability literature suggests that lower PA levels are related to higher TV time and this was confirmed by this study, where those who did no or minimal PA were more likely to watch more TV (Hsieh et al, 2017). Although obesity is highlighted in other studies (Hsieh et al, 2014, 2017; Melville et al, 2018), here only the wave 2 bivariate investigation supported that those who were overweight/obese were more likely to watch more TV than those of normal BMI. Consistent with other studies intellectual disability level was as a significant contributor to increased TV time across all three waves (Hsieh et al, 2017; Melville et al, 2018). Those with a more severe/profound intellectual disability were less likely to watch TV and consequently were found to be less sedentary, than those with a mild/moderate level but this reduced TV time may be due to increased sensory, communication and cognition impairments (Oppewal et al, 2018). Carers in roles to guide an individual’s activities may be constant across the life course and critical to reducing TV watching (Buys et al, 2012) and there should be increased education to encourage the reduction of SB and integrate PA as a vital part of everyday life (Cartwright et al, 2017).
Living circumstance has been highlighted as a significant correlate to TV viewing time in some literature (Hsieh et al, 2017). This was supported in this study where higher TV levels were observed in those who resided independently/with family and the lowest levels of TV viewing in those living in residential care. This is possibly because people living independently may have more control over the TV, have more choice or simply are the only one watching so there are no disputes over what is on. This study found a moderate positive relationship between level of intellectual disability and living circumstance. Hence those living in some settings may be less likely to have control over the TV or with greater health needs were more likely to depend on others to support their TV watching. Furthermore, those living independently may have more difficulty integrating into the community and TV may provide a convenient entertainment option (McCausland et al, 2018). These issues require further research. However, in the final model living circumstance did not emerge as a predictor to increased TV viewing.
Drinking more fizzy drinks has previously been noted as associated with increased TV time in the general population (Silva et al, 2021) and similar was seen in this study, with participants who reported watching more than five-hours TV/day, being ten times more likely to drink three fizzy drinks/day. As noted previously watching more TV may itself result in drinking more fizzy drinks, whether that is due to advertising or choices in refreshment or treat whilst watching TV. Nevertheless, an association was observed and mindless snacking, a factor in modern society may play a role in a sedentary lifestyle, something that carers and support staff need to be aware of.
While only 40% (n=247/600) of participants drank alcohol, alcohol consumption was seen as a significant correlate to watching more than five-hours of TV a day confirming general population findings (Alpers et al, 2021) and may reflect trends within the population of relaxing with a drink watching TV in the evening, a trend reported to have increased many-fold during COVID lockdowns (Werneck et al, 2018). Another factor noted in this study was that late risers watched more TV, also found in other intellectual disability literature (Mikulovic et al, 2014). Perhaps this reflects people living more independently or unemployment or having more flexible schedules meaning no need to get up early and having more free time to dedicate to watching TV. Again such increases in TV watching may be attributed to having more free time and lacking the resources, motivation or confidence to do other activities. Watching TV at night has been shown to affect sleep quality which may lead to disrupted sleep and sleeping in later (Xie et al, 2020). Leaving home to go to work or service was not seen as a significant contributor to TV viewing in this study but those not attending day service and who were unemployed were less likely to watch excessive TV.
Participants who had epilepsy were less likely to watch TV in this study which confirmed results reported in the literature (Hsieh et al, 2017; Melville et al, 2018) which may be due to sensitivity to fast-moving, flashing images. Taking psychotropic medication has also been seen as a contributor to less TV in the literature (Hsieh et al, 2017) and this was confirmed in the bivariate analysis in this study. This could be explained by side-effects of psychotropic medications which may cause drowsiness. No intellectual disability studies were found which looked at self-perceived health status and TV habits but in the general population this has been found to be inversely related to TV hours watched (Granner and Mburia-Mwalili, 2010). Conversely, this study showed that those who rated themselves as having poor or fair self-rated health were less likely to watch TV compared to those with excellent self-rated health. Self-rated health can be an indicator of morbidity and functional status of older adults in the general population, as well as an independent indicator of the body’s inflammatory status (Ocampo, 2010; Christian et al, 2011). Those with low self-rated health may have more health issues and higher levels of intellectual disabilities and a consequent inability to watch more TV.
While Ding and colleagues (2012) in a general population study found a marginal link between having a sense of community and reduced TV viewing, this study found that those who felt less a part of their community were less likely to watch TV. This could be due to the presence of mental health conditions like loneliness and depression. An enhanced sense of community and strong social support has been reported for the general population to have a protective effect for mental health problems like loneliness (Prieto-Flores et al, 2011; Chung and Kim, 2022). Mental health problems like loneliness are often present in those with an intellectual disability (Wormald et al, 2019), and requiring assistance and their reduced physical and health abilities have impaired their community integration (McCausland et al, 2018).
In addition, general population studies found that community settings like safety and walkability were significant contributors to TV viewing habits but to date this has not been investigated in the intellectual disability literature (King et al, 2010; Kozo et al, 2012; O’Donoghue et al, 2016). In this study those who had difficulty getting around the community were less likely to watch TV, the largest contributor of this difficulty coming from reduced independence and requiring assistance to travel. People with intellectual disabilities and mobility issues were previously reported to watch more TV (Melville et al, 2017). This study showed that those in a wheelchair were less likely to watch TV, with similar findings for those who had difficulty walking 100 yards. However, wheelchair use and level of intellectual disability were positively correlated and those with a more severe/profound intellectual disability level were more likely to have mobility issues. More research is needed to better understand the role of mobility issues in level of TV watching.
Both the CHAID and multinomial regression analyses concurred that intellectual disability level, specifically moderate level, was a significant contributor to increased TV viewing. However the multinomial regression highlighted difficulty walking 100yards and rising later as further significant risk factors. This difference between analyses was not entirely unexpected (Sata and Elkonca, 2020) because in CHAID for each split the sample size reduced so other significant variables may be excluded from the final model while multinomial logistic regression had no such restrictions and gave a tabular output highlighting the contribution of each variable by means of odds ratio. Overall the results of both methodologies concur which has previously been noted (Rudolfer et al, 1999; Shiran et al, 2021). The final SOS model highlighted three variables: moderate intellectual disability level, rising after 7am and difficulty walking 100yards. This was the first time that difficulty walking 100 yards was identified as a significant contributor to increased TV viewing, providing a simple guide for identifying those most at risk.
Conclusion
This analysis of TV habits generally agrees with the limited literature available on the correlates of increased TV viewing time among those with an intellectual disability. The levels of TV watching may be an indicator of elevated SB among persons with an intellectual disability population but further investigation using other tools and objective measurement is warranted. This study provided novel insights into correlates of TV viewing for the intellectual disability population. A strength of the study was the adaptation of the SOS framework to structure the risk factors for TV viewing. Intellectual disability level, specifically those with a mild or moderate level, appeared to be the most significant independent contributor to TV viewing and consequent SB among older adults with an intellectual disability but including a focus on difficulty walking 100 yards and rising after 7am, as additional significant contributors is also necessary.
Limitations
While TV viewing may not the most accurate representation of SB for people with a more sever/profound intellectual disability level, this is not to say that they are not sedentary. Inaccuracies in self-reported behaviours have been observed in other studies.
Footnotes
Declaration of conflicting interests
The author(s) declared no potential conflicts of interest with respect to the research, authorship, and/or publication of this article.
Funding
The author(s) disclosed receipt of the following financial support for the research, authorship, and/or publication of this article: The authors are part of a study which is funded by the Health Research Board (IDS-TILDA-2021-001) and the Department of Health.