
Abstract
This article reports the variations in volatile organic compound (VOC) emission rates from Scots pine wood under varying relative humidity (RH) conditions. The experiment encompassed both heartwood and sapwood, involving recently sawn (“new”) wood, and aged (“old”) wood that had been stored indoors for 15 years. Individual specimens were placed in climate chambers, wherein specific RH levels were maintained in the following sequence: 20%, 40%, 60%, 80%, 60%, 40%, and 20%, 1 month each. VOC samples were systematically collected at the end of each RH period and analyzed using TD-GC-MS system. The results demonstrate a direct relationship between RH levels and VOC emission rates in all specimen categories. Old wood indicated significantly lower emission rates compared to new wood, with distinct differences in emitted compound composition. As the experiment progressed, the initial differences between old and new specimens diminished, reaching minimum difference by the last measurement. Aldehydes were among the two most prevalent compound groups in all sample types. Terpenes were the most abundantly emitted group during the first VOC collection. However, their emissions subsequently declined, followed by an increase in all main chemical groups at 80% RH. Additionally, more polar compounds were emitted as RH increased. This study contributes to the discussion regarding the suitability of standard emission tests performed in fixed 50 ± 5% RH for hygroscopic materials. More attention should be given to the influence of RH on VOC emissions to ensure a comprehensive understanding of wood material’s emission behavior.
Introduction
Indoor air quality (IAQ) is a complex function of immediately perceptible attributes, such as relative humidity, temperature, odor, dustiness, and draft, as well as attributes that cannot be instantly noticed or perceived by all occupants of the space. The latter encompasses micro-particle content and concentration of chemical compounds. Particles and chemicals can be introduced into the air from the outdoors through ventilation or released from sources such as structural materials, furniture, paints, glues, textiles, foodstuff, electronic appliances, detergents, pets, or human activities.
Volatile organic compounds (VOCs) are organic chemicals characterized by their low boiling points and high vapor pressures at relatively low temperatures. These compounds may be detectable by their odors and may have beneficial or detrimental influences on human and animal health, as well as the environment. In Europe, the VOC levels within indoor environments are governed by the indoor air quality standard EN 16798-1 (2019) and its corresponding technical report TR 16798-2 (2019). It is well known that poor IAQ is linked to adverse health outcomes, diminished comfort, and the impairment of cognitive functions and productivity (Horr et al., 2016; Tsakas et al., 2011; Wolkoff, 2018). Due to the complexity of indoor air chemistry and physics, understanding the effects of building methods and materials on IAQ is essential.
Emission testing of materials uses standardized procedures such as M1 (RTS, 2020), EN 16516 (2018), and the ISO 16000-6 and 16000-9 standards. To produce comparable results, the specified conditions within these standards involve maintaining a relative humidity (RH) of 50 ± 5% and a temperature (T) of 23 ± 1°C. Yet it does not take into account the variations in actual indoor environments. Indoor relative humidity is inherently dynamic, influenced by factors including ventilation rates, daily activities (such as cooking, showering, and laundering), and seasonal variations in outdoor air. In Finland, the variation in indoor RH is substantial due to changing of water content in outdoor air; typically ranging from 10% during the heating period up to 70% during the late summer and early fall, however, RH may exceed the range occasionally (Kalamees et al., 2006). To create a healthy indoor environment, it is also important to consider the interaction between the surrounding air properties and the material.
Wood is a hygroscopic material, which means that it adsorbs and desorbs moisture according to the RH of the surrounding environment. If a wooden member is exposed to fluctuations in RH, which is the case seasonally in indoor air conditions, the moisture content (MC) of wood’s surface slowly follows the RH variations. Wood’s MC correlates positively with the changes in surrounding air RH and negatively with T (Hoadley, 2000; Shmulsky and Jones, 2019), but its ability to follow the changes per unit of time is limited. Only seldom are the RH and T conditions stable for long enough to allow a thicker wooden member to reach its equilibrium moisture content (EMC) thoroughly. The seasonal indoor RH variations follow a pattern in areas where central heating is applied: during the heating season (winter, spring) the indoor RH decreases down to 15%–20%, whereas during the moist and warm season – typically late summer or early autumn before the start of central heating – the RH may momentarily (e.g. partly due to daily activities) be as high as 80% (Kalamees, et al., 2016; Raunima et al., 2023; Sundström et al., 2011). The driest and the most humid periods typically last no more than a few weeks to a month, thus not allowing the wooden members to reach their EMC thoroughly. However, the MC of wooden surfaces down to a depth of several millimeters, at least, may change at room temperature between 5% and 15% in RH conditions similar to extreme ends of seasonal indoor RH fluctuations (Simpson, 1998). The magnitude of MC variations is relative to the distance from the surface: only minor changes take place in the innermost parts of thick members, while either adsorption or desorption of water molecules takes place practically all the time on wood surfaces, resulting in a moisture gradient between the inner and surface parts of a member.
Movement of water molecules in and out is also associated with extraction of some VOCs. Hydroxyl groups of wood polymers can form hydrogen bonds with water molecules and thus attract them (Engelund et al., 2013). As MC inside the wood increases, the polar water molecules can reduce the adsorption capacity of VOCs by competing from the same hydroxyl groups, known as hydrophilic sorption sites, and displacing them (Lin et al., 2009; Liu et al., 2020; Shmulsky and Jones, 2019). This leads to inhibiting or increasing the VOC emissions due to changes in the MC of wood resulting from variations in its use conditions. Hence, VOC emissions are expected to be affected by indoor RH conditions (Englund, 1999; Lin et al., 2009). Therefore, VOC emissions documented under standard conditions may not offer a comprehensive understanding of VOC emissions from hygroscopic materials like wood.
Wood has been considered to promote health and well-being as an indoor furnishing material (e.g. Alapieti et al., 2020; Burnard and Kutnar, 2015). In Finland, building materials meeting the requirements of good indoor air quality criteria are classified to the best category M1 (RTS, 2020) and the Classification of Indoor Environment (FISIAQ, 2018) considers untreated softwood building materials as low-emitting products. Although the emissions from new wood material can be higher than the actual limit values set for M1 classified materials, they can be treated like products in the emission class M1 when designing indoor environments. The most common VOCs found from untreated softwood species, for example, Norway spruce and Scots pine, are terpenes, aldehydes, organic acids, and alcohols (Czajka et al., 2020; Englund, 1999; Granström, 2005; Hyttinen et al., 2010; Manninen et al., 2002; Risholm-Sundman et al., 1998; Sassoli et al., 2017). Apart from positive health effects (Ikei et al., 2016; Lee et al., 2012), these compounds may also cause headache, tiredness, eye irritation, or respiratory effects such as airway inflammation or allergic asthma symptoms (Huang et al., 2016; Jensen et al., 2011; Nøjgaard et al., 2005; Patocka and Kuca, 2014; Skulberg et al., 2019).
VOC emissions from wood have been studied extensively (e.g. Czajka et al., 2020; Englund, 1999; Hyttinen et al., 2010; Manninen et al., 2002; Markowicz and Larsson, 2015;Risholm-Sundman et al., 1998; Roffael, 2006; Sassoli et al., 2017). Even if the effect of RH on VOC emissions is well known, most emission studies are carried out in a constant RH condition (e.g. 50% RH). Previously, the effect of RH has been addressed in wood-based products in very distinct RH conditions, for example, 50% and 80% (Lin et al., 2009), or 40% and 85% (Markowicz and Larsson, 2015), or has concentrated on very few compounds, like formaldehyde, or acetaldehyde (Chen et al., 2024; Huang et al., 2016; Parthasarathy et al., 2011; Suzuki et al., 2014) . Therefore, previous studies have not fully captured the effects of dynamic indoor RH on VOC emissions from wood. The heterogeneous chemical composition of wood materials results in significant variations in VOC emissions. In addition to the wood properties, the emissions are affected by material’s storage conditions and storage time. Previous studies have shown that variations in VOC emissions can be seen not only between and within wood species but also within an individual tree (Czajka et al., 2020; Englund, 1999; Sassoli et al., 2017; see also: Harju et al., 2021). For example, heartwood has more volatile extractives than sapwood (Shmulsky and Jones, 2019). A list of the confounding factors is presented by Adamová et al. (2020). Furthermore, while it is known that VOC emissions from new materials decrease after 6–8 months (Brown, 2002; Fürhapper et al., 2020; Järnström, 2007), the long-term effects of fluctuating RH on wood emissions are less studied. Sassoli et al. (2017) found out that only a few moisture cycles might be enough to change the VOC spectra of different wood species. One can expect that wood’s VOC emissions decrease as a function of time, also since the number of annual RH cycles increases. Thus, it can be hypothesized that the fluctuation in indoor RH has both short-term and long-term effects on their VOC emissions.
There is a lack of studies addressing the effects of changing indoor RH on VOC emissions from different types of wood in the whole range of indoor RHs. An experiment with aged and new wood and different structural parts exposed to realistic range of RH conditions in indoor environments helps to understand wood’s emission dynamics better.
The purpose of this study was to examine the effect of varying indoor relative humidity conditions on VOC emissions from both recently sawn and 15-year-aged Scots pine (Pinus sylvestris L.) heartwood and sapwood. Scots pine was selected as a study material because it is commonly used indoors and because its wood material is rich in volatile extractives, which is favorable when studying the dependence of VOC emissions on RH. The RH conditions were tailored to correspond with the seasonal variations in indoor RH.
Materials and methods
Design
VOC emissions from different types of Scots pine specimens were measured in chamber settings in different RH conditions. The experiment design was a repeated measures study with TVOC emission rate as dependent factor and condition (seven levels) and sample type (four groups) as independent factors. Note: Condition is a combination of RH and time as the effect of conditioning order was not counterbalanced, that is all specimens were exposed to each RH condition in the same order (see Procedure and Experimental Conditions Section).
Wood materials
Sample types
Four different Scots pine wood types were tested: (1) recently sawn and industrially kiln dried Scots pine sapwood (later referred to as “new sapwood”); (2) recently sawn and industrially kiln dried Scots pine heartwood (“new heartwood”); (3) Scots pine sapwood that was stored indoors approximately 15 years (“old sapwood”); and (4) Scots pine heartwood stored indoors approx. 15 years (“old heartwood”). The indoor storage room for old materials had a constant room temperature of ca. 21°C, and RH fluctuated between approximately 20% and 70% between the seasons.
Material preparation
Five replicates were prepared for each of the four material types, resulting in 20 test specimens in total. The dimensions of the old material defined the specimen size. The area of freshly cut surface was minimized and the 100 mm × 20 mm dimension planks were just crosscut into a length of 240 mm. Thus, the old materials had only one freshly cut surface, which was sealed with aluminum foil tape to prevent emissions from it. The new materials were sawn into the same dimensions, and one crosscut surface was also sealed from them to equalize the emitting surface area. Four steel screws were added to the bottom faces (pith-side) of the specimens as 20 mm long “legs” at 50 mm from the end and 20 mm from the edge, to allow air circulation around all emitting surfaces during the chamber test.
Before the experiment, the specimens were conditioned for approx. 1.5 months (around 50 days) at 20% RH and 21°C in a Memmert climate chamber. Equilibrium moisture content was considered to have been reached after the mass difference between two consecutive weekly weighings was less than 0.01%. After conditioning, the specimens were wrapped in aluminum foil and stored in plastic bags until they were installed in the exposure chambers later that same day.
Material characterization
Heartwood-sapwood ratio for each specimen was determined visually under UVB excitation, which induces bright blue fluorescence on Scots pine heartwood containing phenolic stilbene compounds (Antikainen et al., 2012; Belt et al., 2021) Proportions of heartwood are presented in Table 1. All sapwood specimens were pure sapwood except for one plank containing some heartwood on the pith side (37%). There was some variation in the proportions of heartwood. Two of the heartwood specimens had 100% heartwood on both sides and one specimen had heartwood only on the pith side.
Proportion of heartwood in Scots pine specimens under UVB excitation.
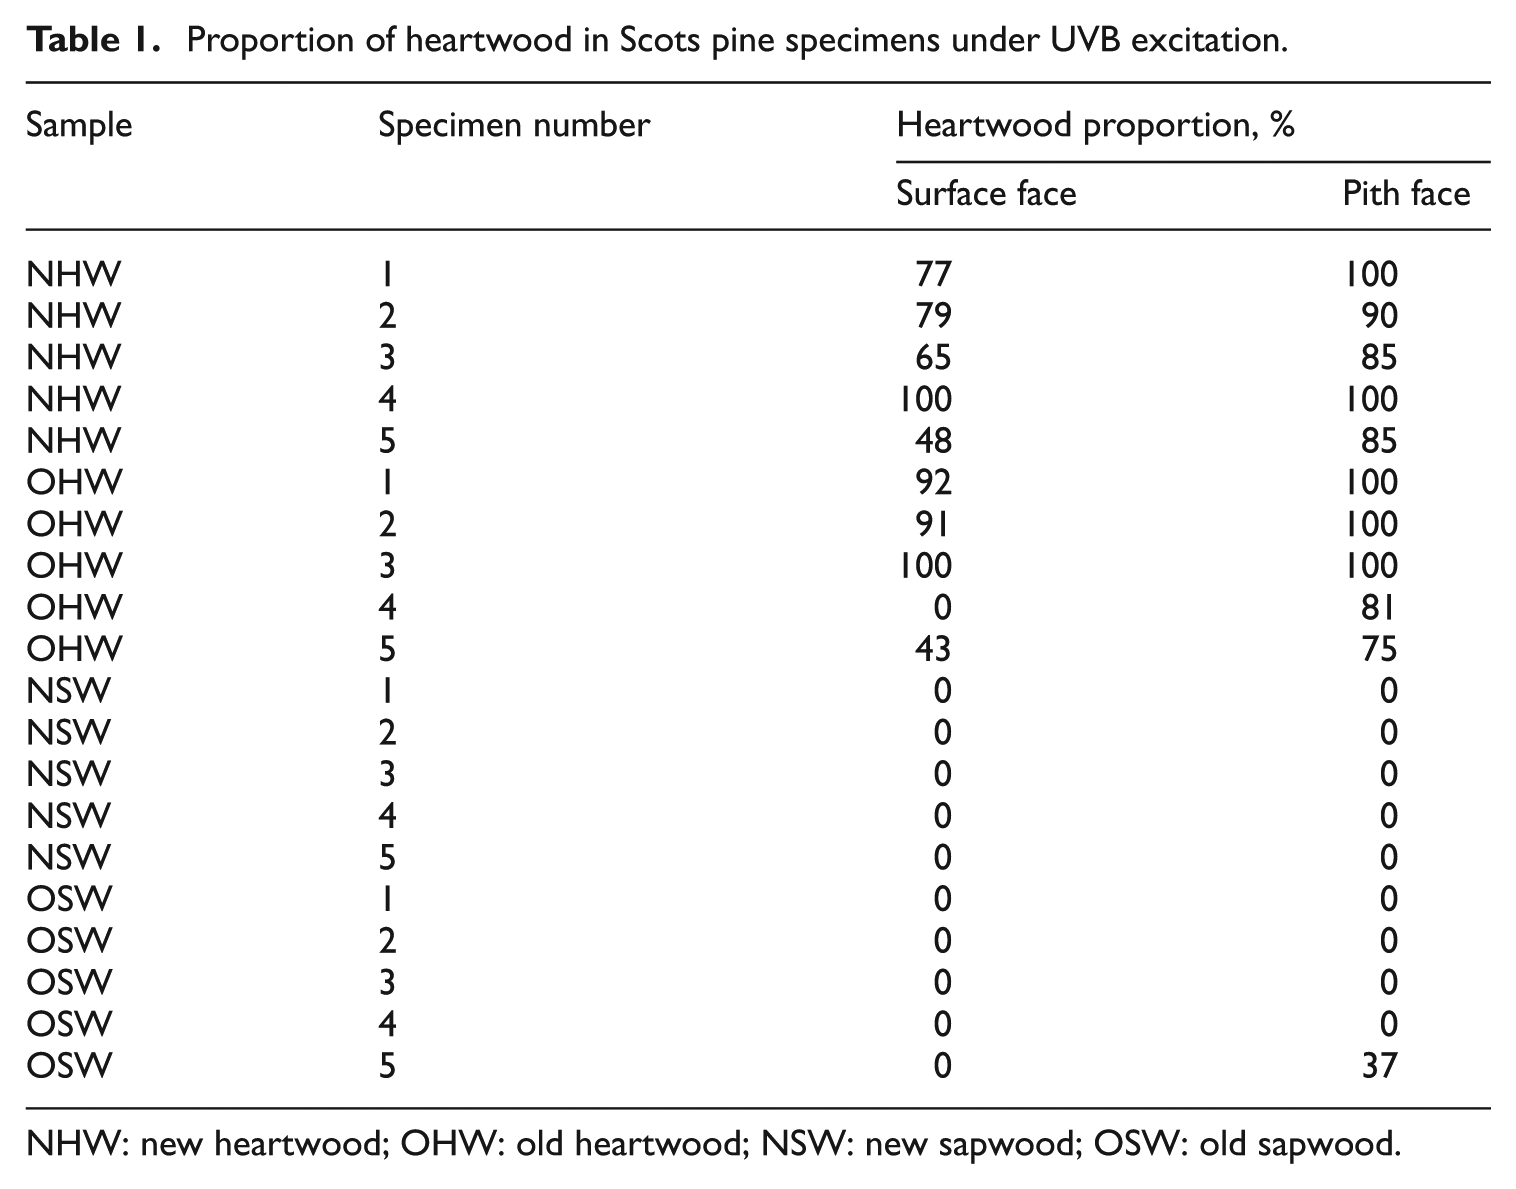
NHW: new heartwood; OHW: old heartwood; NSW: new sapwood; OSW: old sapwood.
Experimental setup
Exposure chambers
Metal framed airtight glass chambers with dimensions of 400 mm × 300 mm × 200 mm (24 L) were used in this experiment. This resulted in a loading factor of 2.48 m2/m3, which corresponds roughly to a real indoor wood in a room with wooden surfaces and furniture. The metal-glass joints were sealed with low-emission 3M Scotch-Weld DP490 Liquid Epoxy Adhesive. Klinger Sealex 7 × 2.5 PTFE joint sealant was used between the lid and the chamber frame. The chamber lid was closed and sealed with aluminum foil tape.
The glass chambers were placed on two 5-story shelves and protected from direct sunlight. One wood specimen was placed in each of the 20 chambers. The specimen was set standing on the four metal screws in the middle of the chamber floor. Ruuvi Tag environmental sensor (±0.5°C; ±3% RH) was inserted inside each chamber to measure the T and RH conditions. The sensors sent the information to Raspberry Pi 3 computer via Bluetooth.
Chamber climate control
The chambers were over-pressurized to prevent transmission of impurities from the laboratory air into the chambers. Purified and humidified air entered and exited each chamber through two holes in the lid, one for air inlet and another for outlet, both plugged with rubber septum and pierced with 1.2 mm (inlet) and 0.4 mm (outlet) needles. The air was supplied from the laboratory compressed air outlet through silicone tubing. Air was purified with an activated carbon filter and humidified using humidification flasks by adjusting the air flow passing through the bottles (Figure 1). The air flow was kept at a constant rate of approximately 0.2 L/minute (air-exchange rate 0.5 hour−1) with flow rate regulators and valves, and it was regularly verified using a mini-Buck Calibrator M-5 (A. P. Buck Inc., Orlando, FL, USA). The air T inside the chambers could not be adjusted and was dependent on the T of the laboratory.
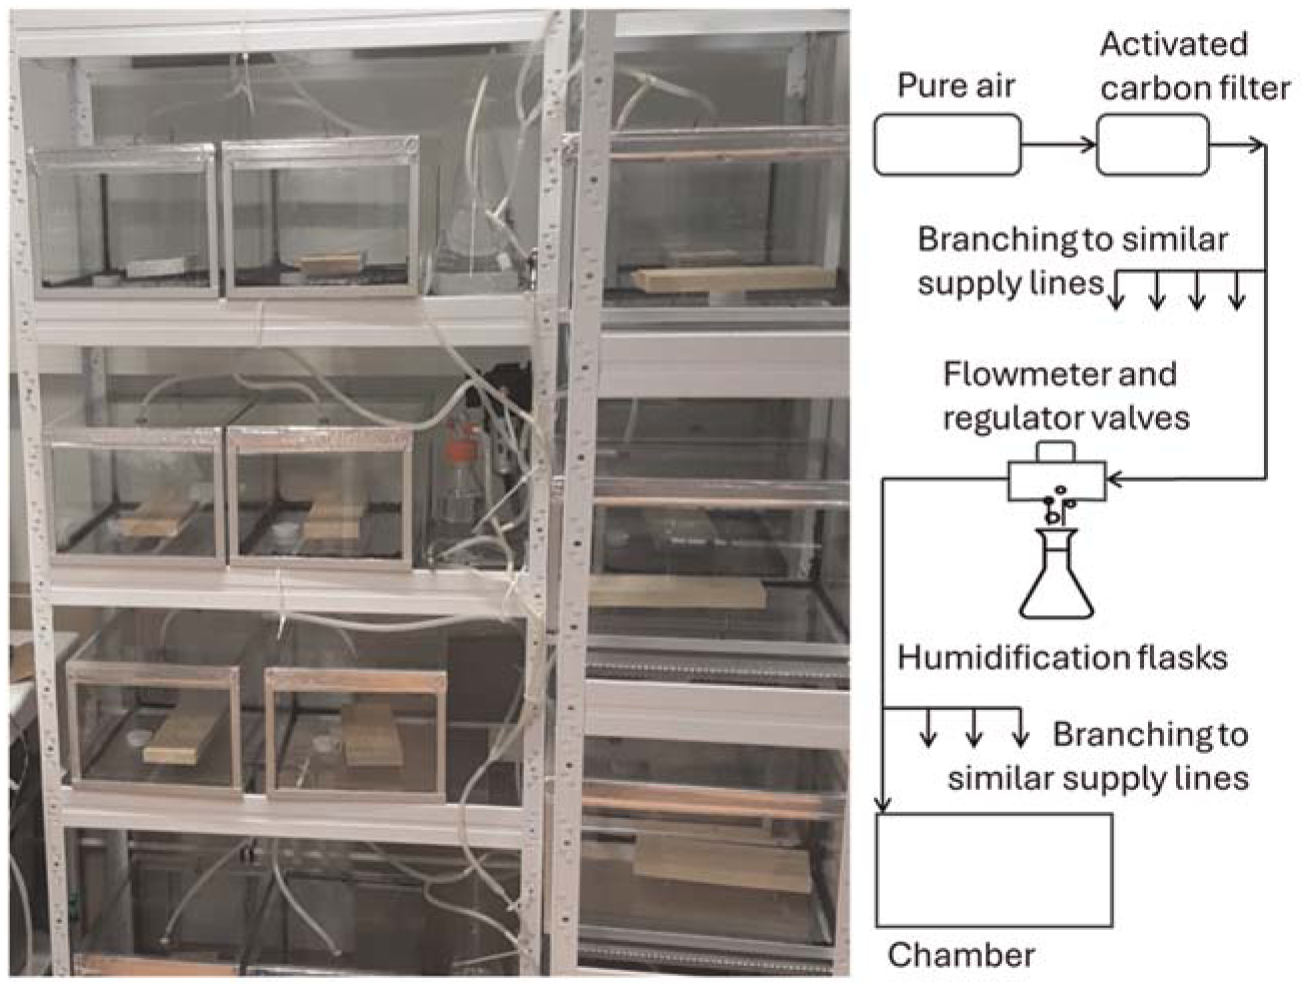
Experimental setup. On the left, chambers with wooden specimens and RuuviTag sensors inside. Humidified air was supplied through the tubing (on top of the chamber). The chambers were over-pressurized to avoid contamination.
Procedure and experimental conditions
This experiment was conducted in a laboratory setting in the University of Eastern Finland in Kuopio, between February and August 2020. The timeline and the procedure are presented in Figure 2. Individual specimens placed in the chambers were exposed to specific RH levels for 1 month at a time. One month was deemed to be close to a time that allows the specimens to reach close to their EMC. During the 7-month period, the RH inside the chambers was changed monthly by 20 percentage point steps, first increasing the RH in the following sequence from 20% to: 40%, 60%, and 80%; and then decreasing it back to: 60%, 40%, and 20%. The seven experimental conditions and the measured temperature and relative humidity conditions during the experiment are shown in Table 2.
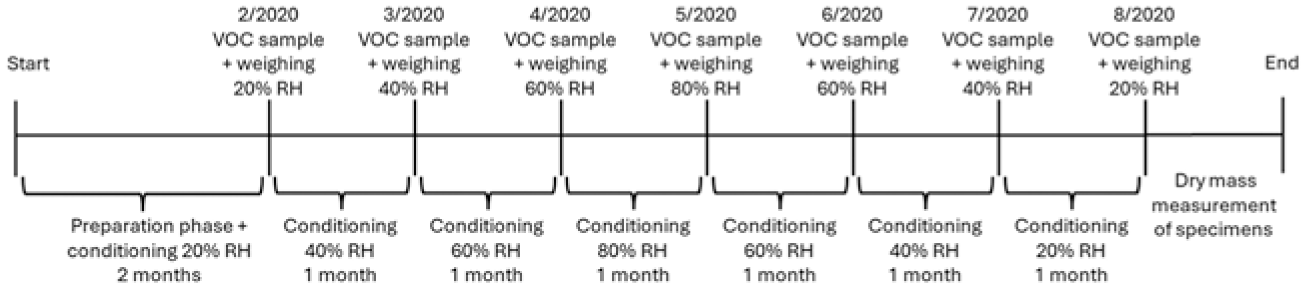
The timeline and the procedure of the experiment. Date is presented as month/year, RH is relative humidity.
Mean values ± standard deviation (N = 20) of the environmental conditions inside the chambers during the conditioning periods (1 month).
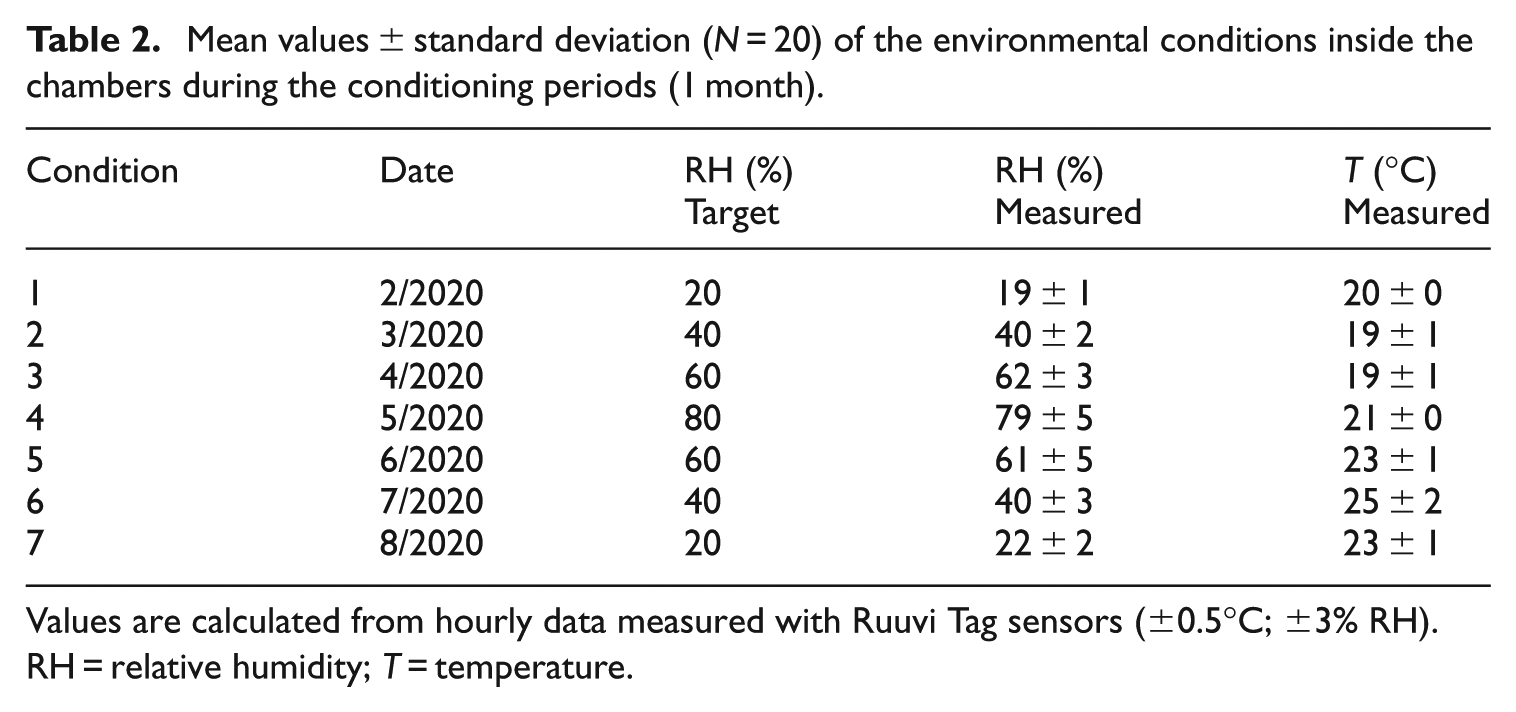
Values are calculated from hourly data measured with Ruuvi Tag sensors (±0.5°C; ±3% RH).
RH = relative humidity; T = temperature.
VOC samples were collected from chamber air at the end of each conditioning period (see Sampling and Analysis of VOCs Section), after which the specimens were weighed (see Wood Moisture Content Section). After this the RH was changed by 20% and the specimens were left to condition for a month before the next VOC measurement and weighing. The experiment continued in the same way according to the order of RH sequence mentioned.
Wood moisture content
The MC of the specimens at the time of VOC collection was assessed by repeated weighing. Specimens were weighed each month after the VOC samples were collected, using Precisa XT-1220M scale (Precisa Gravimetrics AG, Switzerland; accuracy 0.001 g). Each specimen was taken from their chamber, weighed, and immediately returned to their chamber. The time the specimens were outside their chambers was kept as low as possible to minimize the effects of the surrounding environment. After the experiment, the specimens were oven-dried, and their dry mass was measured. Masses of screws and sealant tapes were subtracted from the respective weighing results before the calculations. The MC at the time of VOC collection was calculated using equation (1), in which the wet mass refers to the mass at the time of each VOC collection:
Sampling and analysis of VOCs
The VOC sampling was performed after each month-long conditioning period to specific RH. Since the seven different conditions for 20 specimens already produce 140 VOC samples, we decided to concentrate only on VOC emissions that can be captured with Tenax® TA adsorption tubes. Variety of sampling and analysis techniques (e.g. using DNPH-coated silica gel cartridges and multisorbent tubes) would have been needed to effectively cover most of the other emissions known to be emitted from wood, for example, VVOCs (Very volatile organic compounds; Granström, 2005; Hyttinen et al., 2010; Risholm-Sundman et al., 1998; Schieweck, 2021). Since previous studies have shown VVOCs, that can’t be captured with Tenax® TA, to exhibit dependence on RH (Chen et al., 2024; Huang et al., 2016; Suzuki et al., 2014), the actual emissions from wood are likely greater than those captured in this experiment.
The VOC samples were collected from the chamber outlet air to Tenax® TA adsorption tubes (Markes Inc. and Supelco) via active pumping (SKC AirChek 3000 and SKC 222; SKC Inc., Eighty Four, PA, USA). The sampling time was 30 minutes, and the flow rate was 110–150 mL/minute. Air flow was calibrated with Buck Calibrator (Buck Calibrator Model M-5 A. P. Buck Inc., USA). Reference VOC samples were collected from the laboratory room air each month.
The samples from the tubes were analyzed using TD-GC-MS system: TD-100 thermal desorber (Markes International Ltd., UK) with subsequent 7890A gas chromatograph (Agilent Technologies Inc., Santa Clara, CA, USA) with Agilent 19091S-436UI HP-5MS column (60 m length, 250 µm inner diameter, 0.25 µm film thickness; 5% Diphenyl/95% Dimethylpolysiloxane stationary phase) and coupled with Agilent 5975C mass selective detector.
Thermal desorption temperature was 280°C for 10 minutes and 180°C for 10 minutes. The GC oven temperature program was used as follows: 38°C initial temperature + hold for 4 minutes; increased at 5°C/minute to 210°C, no hold; increased 20°C/minute to 280°C + hold for 6.5 minutes.
Analyses were carried out in SCAN mode and data was processed using MSD ChemStation® software. The compounds were identified by their retention times using mass spectral library NIST11 (National Institute of Standards and Technology, Gaithersburg, MD, USA). The concentrations of the identified compounds and Total VOC (TVOC) were calculated between 6- and 36-minute (hexane and hexadecane) retention times as toluene equivalents using equations (2) and (3). Four-point standard curves were produced from reference compound (HC48 Component Indoor Air Standard 40353-U, Supelco Inc., Bellefonte, PA, USA) diluted to include 50 ng/µL of each compound (including toluene) by injecting standard solutions (1, 2, 3, and 4 µL) into Tenax TA tubes using a micro syringe.
Where M c is the mass of the compound, A c is the chromatogram peak area of a compound, K is the slope of the standard curve, C is the concentration of a compound (µg m−3), and V is the volume of the sample (m3). The area specific emission rate (SER, µg m−2 hour−1) was calculated using equation (4):
Where a is the air exchange rate (hour−1), V c is the volume of the chamber (m3), and A s is the emitting surface area of the specimen (m2). The TVOC emission rate for each sample type was calculated as mean values of the calculated SER values of the five replicates in given conditions.
During the analysis, two out of the 140 VOC samples were lost due to a GC malfunction. Both lost samples were from new sapwood in the first measurement. Thus, the mean of new sapwood from the first measurement is presented as a mean of three replicates. One of the five replicates from new heartwood in 60% RH could only be analyzed between 6 and 26 minutes. The remaining minutes constituted only around 2% of the total emissions in the other samples. Therefore, the sample was deemed representative. The losses are not expected to affect the overall conclusions notably.
Before the experiment, the chambers were cleaned with distilled water and VOC samples were collected (with Ruuvi Tag environmental sensor inside) at 20% RH. After the experiment, the chambers were cleaned with distilled water and VOC samples were collected from randomly selected chambers at RHs of 40%, 60%, and 80%. The chambers (with only Ruuvi Tag sensors inside) exceeded the VOC background limit set in ISO 16000-9, especially at higher RHs. Therefore, background VOCs identified in the experimental set-up were subtracted from the TVOC. These included 2-ethyl-1-hexanol (co-eluted with cymene, both subtracted), 1,3-dioxolane, diethoxymethane, siloxanes, and tetrachloroethylene. No wood-derived compounds were detected in notable concentrations. Multiple factors like air-exchange rate, presence and concentrations of other compounds, T, and RH affect the fate of the chemicals (Hänninen et al., 2013; Liu et al., 2020; Uhde and Salthammer, 2007; Weschler and Schields, 1997). The formation of reaction products from the studied material and chamber emissions at different RHs is possible but not considered severe.
Statistical analysis
The statistical analysis was carried out using IBM SPSS Statistics version 29 software (IBM Corp., Armonk, NY, USA). The missing values for new sapwood from the first measurement were replaced with the mean value of the sample type. The data was assessed for normality using Shapiro-Wilks test and Q-Q plots (for the residuals). Due to departure from normal distribution, Log-transformation was carried out and outliers were removed. Mauchly’s Test of Sphericity indicated that sphericity was not violated χ2(2) = 31.127, p = 0.064. A repeated measures analysis of variance (ANOVA) was then used to analyze the effect of RH (within-subject variable) and sample type (between-subjects variable) on TVOC emissions. The significance level was set to p < 0.05. Post-hoc pairwise comparisons were made (with Bonferroni correction) after significance was found. Homogeneity was tested with Tukey’s test. The analysis was rerun with outliers and with exclusion of the missing values. The inclusion of outliers and replacing of the missing values (five replicates in all sample types) did not significantly influence the results; therefore, these results were used.
Results and discussion
The effect of RH change on MC and TVOC emission rates
This study examined the effects of RH on VOC emission rates from new and old untreated Scots pine sapwood and heartwood. The special feature of our data is that it follows the VOC emission rates from untreated wood specimens during gradual conditioning in different RHs as a function of time.
Figure 3 shows the mean moisture contents of the specimens after each conditioning period of 1 month. All sample types responded similarly to the changes in RH. The MC of the specimens followed the changes of RH logically, that is, the MC increased and decreased together with the increase and decrease in RH. The MC exhibited sorption hysteresis (Fredriksson and Thybring, 2019) up until the last measurement, which indicated a lower MC than the first one in the same RH condition. The reason for the difference between the first and last MCs is uncertain as both were reached through desorption. A part of it may be due to higher T during the RH decrease phase (Table 2), but the effect is probably small. For comparison, Ahmet et al. (2000) made a rough estimate that the mean reduction in wood MC (for all wood species employed) at 55% RH is 0.1 percentage points per 1°C increase in temperature. The effect of hysteresis would likely be large enough to mask the small effect of T in 40% and 60% RH. Another possibility is sensor related uncertainties, for example, decrease in sensitivity in RH sensors due to drift. Differences between wood types were small. New wood types had slightly higher mean MCs than their aged counterparts, and sapwood types had higher mean MC compared to heartwood counterparts. This agrees with the knowledge that ageing reduces the hygroscopic response in wood, and that extractives, which are more abundant in heartwood, reduce the hygroscopicity and EMC (Feilke et al., 2011; Vahtikari et al., 2017).
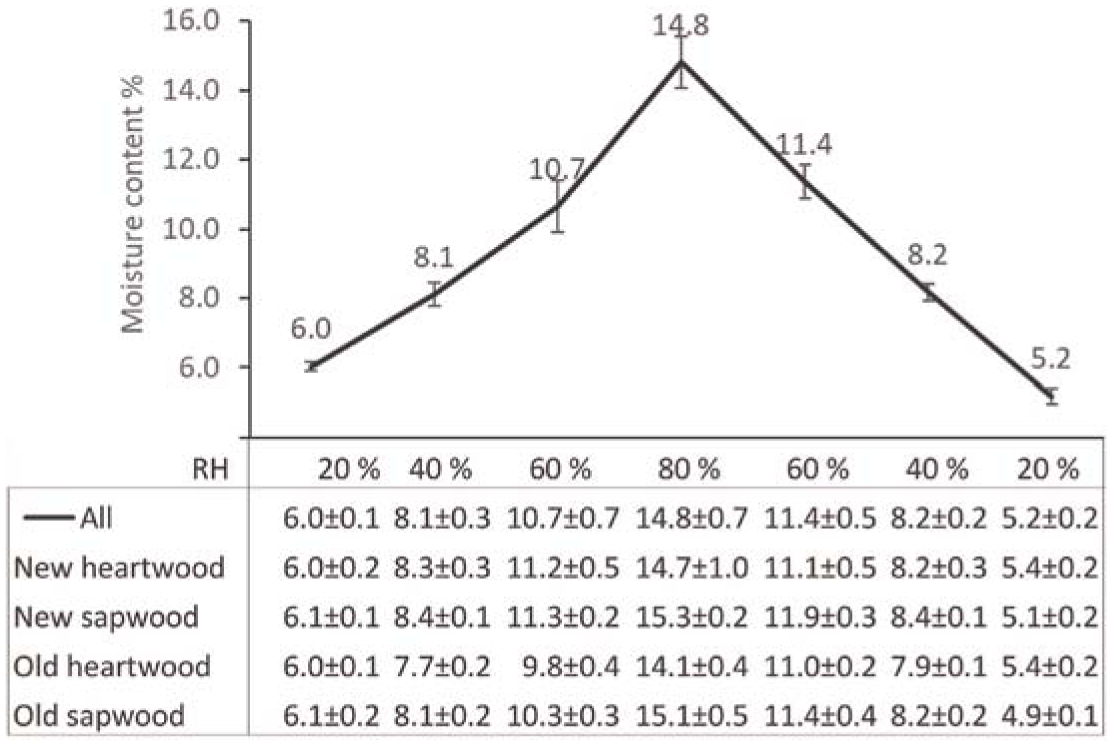
Mean moisture content (%) and ±standard deviation of all specimens (N = 20a) and sample types (N = 5b) in different relative humidity (RH) conditions at room temperature.
The measured mean MC values are not unusual compared with sorption isotherms of Scots pine found in the literature (e.g. Vahtikari et al., 2017). However, we observed that the mass of the specimens decreased slightly even after 1 month during material preparation (see Material Preparation Section). Thus, we are not certain that the relatively large specimens reached their EMC thoroughly during each conditioning period. If the conditioning was incomplete in the inner parts of the specimens, a moisture gradient might have existed at the time of VOC sampling. Since the VOCs emit mostly from the surface parts of the specimen, a slight moisture gradient is not a critical problem. We expect that the moisture gradient more likely tempers VOC emissions than intensifies them, thus the findings should not at least be overestimates. Longer than 30-day conditioning periods would also be extraordinary in real life conditions. Despite the possibility of slight moisture gradient to exist in the specimens at the time of VOC sampling, we believe that the emissions were reliably detected as a function of surrounding air RH.
The TVOC emission rates from different sample types in each condition of RH are presented in Figure 4 as five-specimen mean SER-values. The TVOC emission rates from all sample types increased and decreased along with the increase and decrease of RH. The difference in TVOC emission rates in different conditions of RH was statistically significant (F(6, 96) = 46.4, p < 0.001). Our results are in line with studies that have shown a positive correlation between RH and VOC emissions (Huang et al., 2016; Lin et al., 2009; Markowicz and Larsson, 2015; Suzuki et al., 2014). The emission rates increased significantly (p < 0.001) at 80% RH and were two to threefold compared to emission rates at 60% RH, and two to five times higher than the emission rates at 40% RH. This agrees with the results of, for example, Markowicz and Larsson (2015), who found that the increase of RH from 40% to 85% in climate chamber increased TVOC emissions from wood by four times.
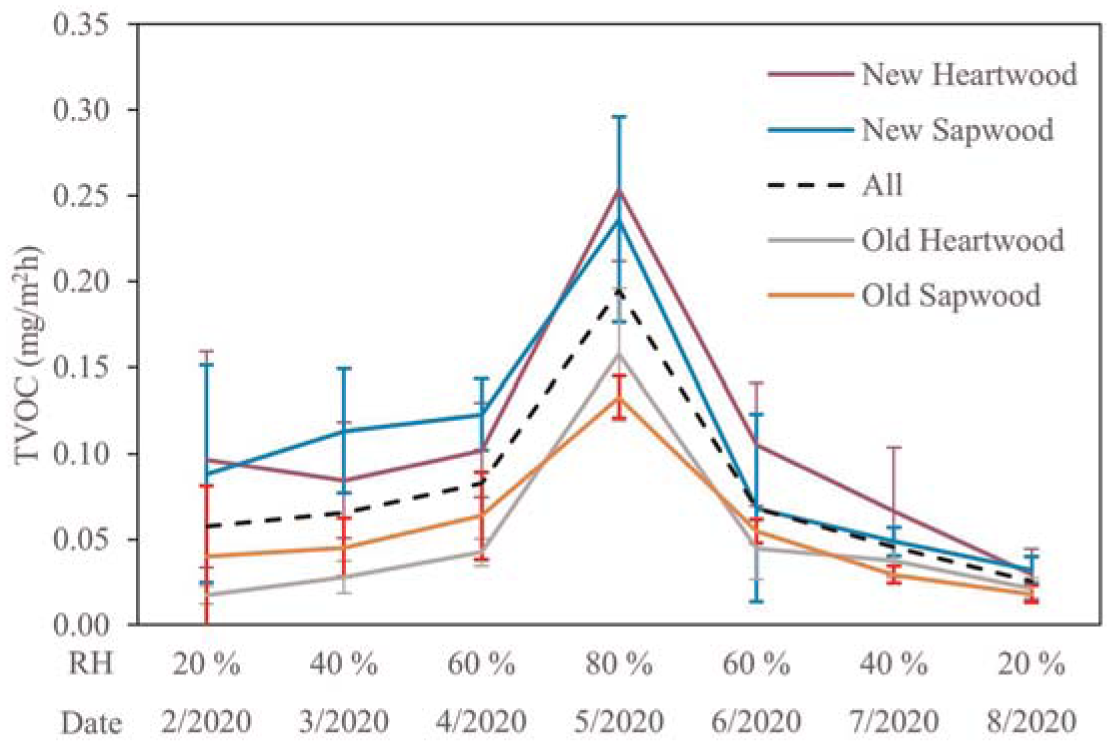
Material emission rates (mg/m2 h) of four different pine wood sample types, each presented as a mean of 5a specimens in different RH conditions. The dotted line represents the mean of all sample types (N = 20b).
There was a significant effect for sample type (F(3, 16) = 29.8, p < 0.001); and a significant interaction between condition (RH and time) and sample type (F(18, 96) = 2.1, p < 0.05). These were due to differences between new and old sample types. Figure 4 shows that the TVOC emission rates from new sapwood and heartwood were initially higher than those from the old sapwood and heartwood, but the difference decreased and disappeared by the end of the experiment. The difference between old and new sample types was significant in the increasing RH but not in the decreasing RH (p < 0.05 for old heartwood at 20%–80% RH; p < 0.05 for old sapwood at 40% and 60% RH compared to new sapwood, and at 80% RH compared to both new sample types). The decrease in TVOC emission rates found in our study is consistent with the knowledge that high initial emissions from new wood products decrease in buildings after 6–8 months (Brown, 2002; Fürhapper et al., 2020; Järnström, 2007) first rapidly during early months due to primary emissions, followed by a more gradual decline (affected by T, RH, etc.) until a steady state is reached (Holøs et al., 2018; Wolkoff, 1999). During the steady state secondary VOCs formed in degradation processes of the woods main polymers are emitted at lower rates and for much longer. One of the strengths of our experiment was the reuse of old specimens (that had been stored indoors for 15 years, thus experiencing the annual RH fluctuations in indoor climate) to control the effect of material ageing. Previously, Sassoli et al. (2017) found that emissions from different wood species decreased already after a couple of moisture cycles. Our findings indicate that already one moisture cycle might be enough for new Scots pine wood to reach the low TVOC emission levels comparable to 15-year-aged pine wood. In this context, if RH had no effect, contrary to our results TVOC emission rates from new wood should decline throughout the experiment and the emissions from old wood should stay relatively stable. Evidently this did not happen, as the increase of RH increased the TVOC emission rates from both new and old wood. It is noteworthy that even 15 years of storage did not eliminate the emissions at high RHs. The difference in emission rates at 80% RH was significant compared to all other conditions for both old sapwood (p < 0.05) and old heartwood (p < 0.001). For new heartwood, the difference in emission rates at 80% was significant (p < 0.05) compared to all other conditions but the first measurement. For new sapwood the difference in emission rates at 80% was significant compared to the first measurement (p < 0.05), and to the last three measurements (p < 0.001). It would have been of great interest to follow the emission profiles throughout each month to find out if and how fast the VOC emission rates reach a new steady state in changed RH conditions.
There was no clear trend in the TVOC emission rates between heartwood and sapwood types. This was rather unexpected due to the high extractives content of heartwood compared to sapwood (Shmulsky and Jones, 2019). In previous studies, differences even as large as 8:1 (Czajka et al., 2020) in TVOC emissions between heartwood and sapwood has been reported. Initially new heartwood had the highest TVOC emission rates. After the first measurement, both sapwood types had slightly higher emission rates compared to their heartwood counterparts during the RH increase phase up to 80% RH, where the opposite was true. Thereafter, TVOC emission rates from new heartwood continued to be the highest until the final measurement, but the differences between sample types in decreasing RHs were not significant. The TVOC emission rates from new sapwood decreased more than 80% (p < 0.001) during the decreasing RHs and emission rates were closer to the levels emitted from the old sample types already after the RH was decreased to 60%. The old sample types did not show similar differences in the decrease phase. The small but rather unexpected increase in emission rates from old heartwood at 40% RH might be temperature related. As TVOC is comprised of a wide variety of chemicals with different properties that decay at different rates and with different mechanisms (Hyttinen et al., 2021), it may not be the best indicator to differentiate between the two structurally different material types.
The increase in TVOC emission rates as RH increases, as demonstrated in our study, can be linked to interactions of water molecules inside the material promoting the release of VOCs. The significant increase in TVOC emission rates from all sample types in very high RH is most likely related to RH and temperature of the chamber environment being stable for long enough to allow the specimens to reach closer to EMC deeper than the surface layers of the wood. In high RH water vapor causes swelling that opens the wood’s structure thus increasing the area of available adsorption sites. This allows water molecules to remove VOCs ever deeper inside the material. It also allows for degradation of wood’s main components which might change the availability of these sorption sites (Engelund et al, 2013). It is probable that in high RH the accelerated hydrolysis increased the evaporation of secondary emissions from both new and old specimens. Regarding the old specimens, some of the degradation products were likely already formed from hydrolytic reactions during the storage period, whereas in high RH especially more polar compounds were removed and evaporated into air due to the increased competition for sorption sites. Recently, Hall et al. (2021) found that emissions of some VOCs can be significantly elevated in dynamic RH compared to static RH. Rapid drying of surface can cause accumulation of some compounds at the surface and volatilization of others. When the surface is re-moistened, volatilization of surface bound compounds continues. It is also possible that the old specimens were rarely exposed to these conditions for extended periods of time before this experiment, which then led to the release of not only the more polar compounds bound to the surface but also compounds from deeper in the wood, as the RH remained high for a sufficiently long time.
The decreasing TVOC emission rates as a function of RH decrease from 80% to 20% toward the end of the experiment can be attributed to the same mechanism of constant competition of adsorption and desorption in the wood. In contrast, as water evaporates from the surface of the wood when RH is decreased, the bound water and water vapor from the inner parts starts slow movement toward the surface as drying continues (Engelund et al., 2013; Shmulsky and Jones, 2019). This leaves sorption sites open for compounds to adsorb back to material both from the air and those free inside the material.
Contrary to our results, Alapieti et al. (2021) found TVOC emission rates to be lower from uncoated Scots pine wood with higher MC (16% MC compared to 10% MC). The authors concluded that the moister specimens desorbed moisture until they reached their lower EMC in chamber conditions of 50% RH. Our findings support this view as we found MC of wood to change several percentages during a month-long conditioning after the chamber RH was changed (on average, MC decreased by 3.4 percentage points when RH decreased from 80% to 60%, see Figure 3). In our experiment, the emission rates from new sapwood, as an example, were much lower after RH decreased from 80% to 60%. These factors may have contributed to the lower emission rates from higher MC specimens in the experiment by Alapieti et al. (2021).
The effects of RH on compound groups
Main chemical groups
Our data indicated a typical composition of TVOCs for Scots pine and other softwoods (Czajka et al., 2020; Czajka and Fabisiak, 2012; Englund, 1999; Granström, 2005; Hyttinen et al., 2010; Manninen et al., 2002; Risholm-Sundman et al., 1998; Roffael, 2006; Sassoli et al., 2017). The most abundant groups of VOCs were terpenes (including terpenoids), aldehydes, organic acids, and alcohols. Overall, the emission rates of aldehydes, organic acids, and alcohols increased and decreased along with the increase and decrease of RH, while the emission rates of terpenes, RH 80% notwithstanding, seemed to be more related to the specimen age as seen in Figure 5. The proportions of different compounds in TVOC emissions varied depending on the RH condition, VOC sample collection date, and the sample type, but also within individual specimens.
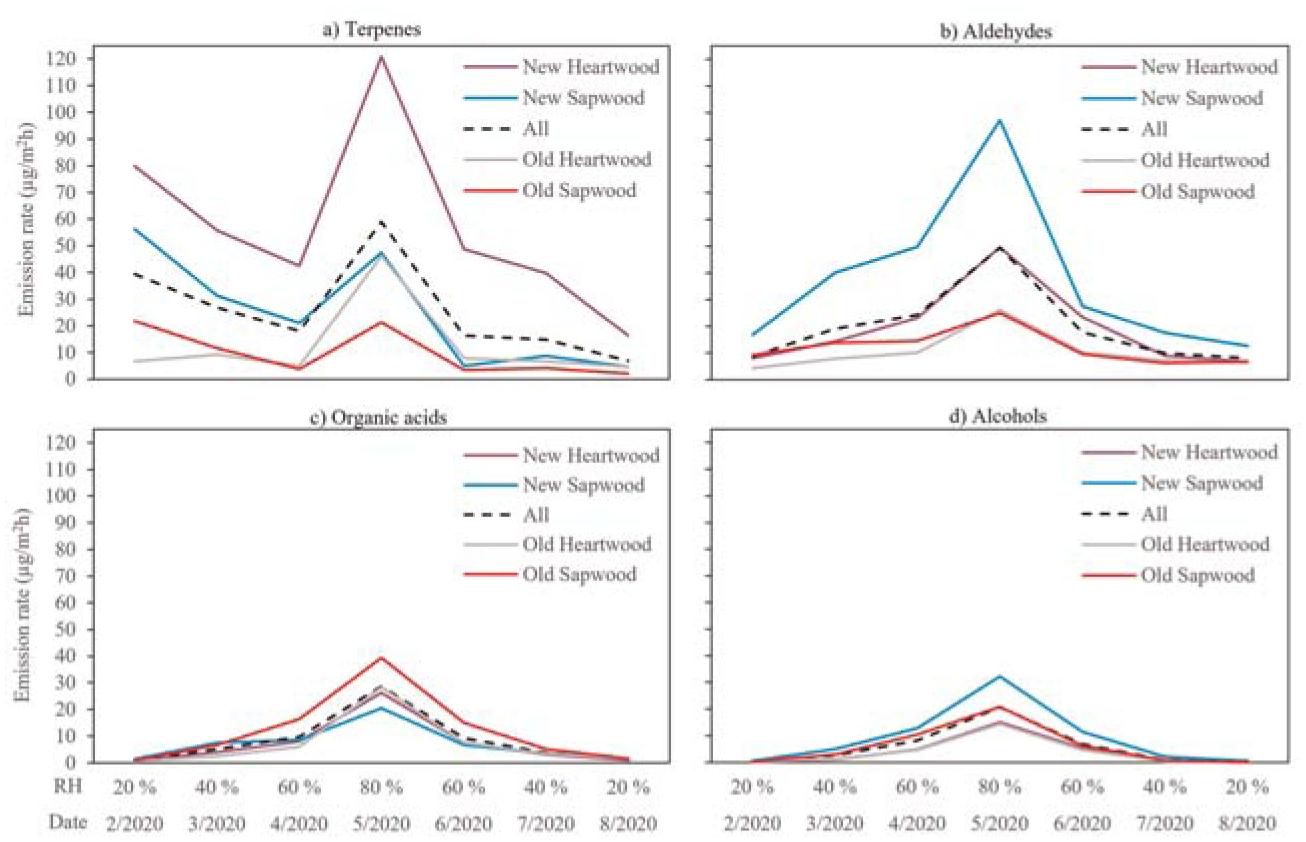
(a–d) Emission rates (µg/m2 h) of the four main groups of VOCs from different pine wood sample types, each presented as a mean of 5a specimens in different RH conditions. The dotted line represents the mean of all sample types (N = 20b).
Terpenes were the highest emitting chemical group in all sample types during the first VOC collection. Then their emissions decreased before increasing again considerably at 80% RH. Aldehydes were among the two most emitted compound groups in all sample types. Hence, aldehydes and terpenes were emitted most abundantly from all sample types, but especially from the new ones. New sapwood was a strong emission source of aldehydes (19%–41% of TVOC), mainly hexanal, whereas new heartwood emitted terpenes (42%–83% of TVOC), like α-pinene. Higher terpene emissions from pine heartwood compared to sapwood, and higher aldehyde emissions from sapwood compared to heartwood have also been reported in other studies (Czajka et al., 2020; Jann et al., 2012).
Only the compound groups emitted from new heartwood were emitted in the same order of abundance throughout the experiment. None of the chemical groups characterized the TVOC emissions from old heartwood or sapwood as clearly as in new sample types. Both old sample types emitted all four main chemical groups, but their relative proportions of TVOC emissions changed with the change of RH and VOC sample collection date. Parallel to our findings, Sassoli et al. (2017) observed a considerably changed spectra of VOC emissions in wood that had gone through multiple moisture cycles.
We found that the increase of RH led to more diverse groups of compounds emitted in all sample types. Multitude of compounds, many of which in small concentrations, were identified in 80% RH but not in lower RHs. Markowicz and Larsson (2015) also reported that compounds below the detection limit in 40% RH were found in 85% RH. However, they did not report differences in the emission patterns between polar and non-polar VOCs. This can be due to the large increase in RH in their experiment, masking the trend visible in our study. We found a notable increase in more polar compounds as RH and, thus, the MC of the wood increased gradually (see Figure 5 and Table A1). In low RHs alcohols and organic acids were either found in low quantities or were below the detection limit, whereas in higher RHs the emissions were noticeably higher in all sample types. The increase was the highest at 80% RH, where also the emissions of nonpolar terpenes increased significantly. This phenomenon may have affected the conclusions made by Markowicz and Larsson (2015). It is to be noted that toluene response tends to underestimate polar compounds, but assumably the underestimation is similar in different RH conditions. For more accurate results, all compounds and concentrations should be determined with their own response factor instead of just MS database. Furthermore, the use of only Tenax TA tubes and GC/MS method may not have captured all VOCs in the gas phase effectively.
The significant difference between emission rates at 20% and 80% RHs indicates that more attention should be paid to the influence of RH in emission studies. Particularly when considering the emissions of more polar compounds at elevated RH levels. This consideration is crucial to ensure a comprehensive understanding of the emission processes, because TVOC values may contain individual compounds that are potentially harmful even in lower concentrations. If the concentration of these compounds increases as the RH increases, so does the risk for occupant exposure.
Terpenes
The high initial TVOC emission rates from new sample types consisted mainly of monoterpenes like α-pinene and 3-carene, but also in smaller quantities of β-pinene and d-limonene (see also Table A1). This was expected, as monoterpenes are wood’s primary emissions with high vapor pressure and known to be emitted abundantly from new wood products (Gabriel et al., 2015; Jann et al., 2012; Roffael, 2006). Previous studies (e.g. Manninen et al., 2002; Risholm-Sundman et al., 1998) show that more than 70% of TVOC emissions from softwoods can consist of terpene emissions. In our study this was true only for new Scots pine heartwood during the first measurement (83%). In general, terpene emissions were more affected by time than RH, but interestingly, at 80% RH terpene emission rates increased considerably in all sample types irrespective of the nonpolar nature of monoterpenes. Moreover, terpene composition was much richer in higher RHs. Many terpenes and terpenoids not found in low RHs were detected especially at 80% RH. Increase in more polar terpenoids was also detected in higher RHs. For example, increased emissions of verbenone, an oxidation product of α-pinene, was observed at 60%–80% RH, especially from new sample types. The difference in terpene emission rates at 60% and 80% RH was interesting. Terpene emission rates decreased already at 60% RH by more than 80% from those emitted at 80% RH in all sample types except new heartwood. It seems that water vapor is effective in removing terpenes from Scots pine.
New heartwood had the highest terpene emission rates throughout the experiment. At 80% RH terpene emission rates increased considerably more in both heartwood types. Interestingly, the emission rates from old heartwood increased to similar levels with those of new sapwood. The higher terpene emission rates from heartwood can be explained by structural differences between sapwood and heartwood. Terpenes are an essential part of the extractive oleoresin inside of many softwood species, including Scots pine, and are stored in the resin canals (heartwood, sapwood) but also in parenchyma cells in sapwood (Back, 2002; Björklund Jansson and Nilvebrandt, 2009). The resins in heartwood are not only more abundant than in sapwood but also partly distributed throughout the tissue (Back, 2002; Sjöström, 1993). The unexpectedly high increase in terpene emission rates especially from old heartwood at 80% RH can thus be linked to movement of water molecules deeper inside the wood. Though, the mechanisms for increased terpene emission after movement of water vapor deeper inside is probably more complex and affected by the anisotropy of wood structure. Increase in terpene emissions in high MC has also been linked to added pressure inside resin canals due to swelling of wood (Cabrita, 2018; Rissanen, 2019). Lin et al. (2009) suggested that the adsorption of water vapor from air to cell wall would release heat, thus increasing the VOC emissions. Water adsorption is an exothermic reaction and indeed studies have found the surface T of wood to increase by few degrees when MC is increased (Dupleix et al., 2018; Kraniotis et al.,2016). The desorption of water needs more energy than adsorption and thus as postulated by Lin et al. (2009) the drying of wood could also inhibit VOC emissions as the cooling effect of water evaporation would decrease the temperature in the wood. Most likely reason is the movement of water into interior of wood causing the removal of VOCs through sorption mechanisms. Movement of hydrophobic terpenes can happen more freely after adsorbed water has increased the hydrophilicity of the wood’s structure (Banerjee, 2001; Su et al.,1999).
Aldehydes
Hexanal and pentanal were the main aldehydes emitted from new wood types, and the lowest RH not included from all sample types. Other aldehydes emitted were, for example, nonanal, decanal, and in high RHs, 2-octenal. In line with other studies (e.g. Fechter et al., 2006; Huang et al., 2016; Parthasarathy et al., 2011), aldehyde emission rates showed dependence on RH, but also on time. Toward the experiment’s end, their emission rates decreased below the levels emitted at the beginning. The increase in aldehyde emission rates in our study was considerable at 80% RH compared to lower RHs, especially in new sapwood. In general, sapwood emitted more aldehydes than heartwood, which is in agreement with previous findings (Czajka et al., 2020; Englund, 1999; Jann et al., 2012). Interestingly, this was the case for old sapwood only during the early phases of the experiment (20%–60% RH). Higher aldehyde emission rates in old sapwood during the increasing phase of RH compared to the decreasing phase might be due to evaporation of compounds adsorbed to the surface of the specimen during storage. The difference in aldehyde emission rates between new heartwood and sapwood, as was the case in our study, can be explained with the composition differences between the two sample types. Compared to heartwood, a higher content of polyunsaturated fatty acids is stored in the parenchyma cells of sapwood and in the transition zone between sap- and heartwood (Myronycheva et al., 2018). Aliphatic aldehydes are formed from oxidation products of these polyunsaturated fatty acids. The most abundant aldehydes in our study, hexanal and pentanal, are oxidation products of linoleic acid (Salthammer et al., 1999; Xu et al., 2017).
Increase in aldehyde emission rates can be linked to their ability to form hydrogen bonds with water molecules, thus making them soluble to water and enabling transfer inside the wood. Also, in higher MCs, as in our experiment, the subsequent hydrolysis of hemicellulose can form aldehydes. An increase in emissions when moisture is present is, thus, somewhat expected. The lower emissions of polar compounds at lower RHs can be explained by their stronger hydrogen bonding with wood polymers.
Organic acids
Organic acid emissions were dominated by the same two compounds, acetic acid and hexanoic acid, found in other pine wood emissions studies (Englund, 1999; Risholm-Sundman et al., 1998). The emission rates of organic acids increased and decreased together with the RH. At 80% RH the emission rates from old sample types were approximately 40 times higher than at 20% RH. The increase was more modest in new sapwood, in which the emission rates increased approximately 12 times higher. In general, the highest organic acid emission rates originated from old sapwood. The higher emission rates (mainly composed of acetic acid) from old samples are probably due to more oxidative cleavage of acetyl groups from woods polymers, mainly hemicellulose forming acetic acid (Englund, 1999; Sandberg and Kutnar, 2015). Emission rates of hexanoic acid (an oxidization product of hexanal) were less related to specimens’ age and more on wood type, as sapwood had higher emission rates. This can be expected as sapwood had also higher emission rates of hexanal.
There are uncertainties related to the detection of emissions of acetic acid with the methods used in our study. Acetic acid is classified as VOC but can be classified also as a very volatile organic compound (VVOC). The use of Tenax TA adsorbent with GC is not compatible with the collection and analysis of VVOCs, thus affecting the analysis of acetic acid (other VVOCS known to be emitted from wood and wood-based products include, for example, formaldehyde, formic acid, and alcohols, like methanol and ethanol (Granström, 2005; Hyttinen et al., 2021, Risholm-Sundman et al., 1998; Schieweck, 2021). While polar water can increase the emission rates of more polar acetic acid, also the recovery of acetic acid to Tenax has been found to increase at 80% RH compared to 50% and 25% RHs (Trabue et al, 2005). However, in line with our results, a positive correlation between RH and acetic acid emission rates from softwood (trapped on silica gel tubes) has been reported previously (Smedemark et al., 2020). In our study acetic acid, and to a lesser extent, hexanoic acid, produced multiple chromatographic peaks. At high RH’s the peaks of acetic acid were also wider. In some of the samples from old wood at 80% RH, the peak area of acetic acid overlapped that of 1,3-dioxolane, which may cause error in the peak’s area and thus to the calculated emission rates. However, it has been suggested (Schieweck et al., 2018; Smedemark et al., 2020) that portions of acetic acid may pass through Tenax tubes, and therefore the emissions of acetic acid could be greater than observed in our experiment.
Alcohols
While the emissions of methanol or ethanol could not be measured, we found that as RH increased, emissions of some detectable alcohols, consisting mainly of 1-pentanol (but also 1-butanol), increased noticeably. Both compounds have been reported from Scots pine wood in other studies (Alapieti et al., 2021; Fürhapper et al., 2011), but the origin of 1-butanol could also be from the chamber itself. Due to their polarity, alcohols are expectedly dissolved by increasing MC. Previously, Markowicz and Larsson (2015) found that increasing the RH in the climate chamber caused emissions of 1-butanol from moisture affected wood to increase from 2 μg/m3 at 40% RH to 43 μg/m3 at 85% RH. Contrary to our results, Alapieti et al. (2021) did not report any increase in 1-pentanol emissions from uncoated wood with higher MC. Their specimens, however, might not have represented the differences in MC as consistently/systematically as in our experiment, as explained in The Effect of RH Change on MC and TVOC Emission Rates Section.
Overall, alcohol emission rates increased and decreased in line with the changes in RH. At 20% RH the emission rates were below detection limit, but as RH increased to 80% the emission rates were approximately 18 (heartwood) and 10 (sapwood) times higher than average alcohol emission rates at 40% RH. Alcohol emission rates were slightly higher at increasing RH compared to the same conditions at decreasing RH. The difference can be placed within uncertainty related to the methods used and thus, no time relation to alcohol emissions could be confirmed within sample types. No clear difference was detected between sample types until very high RH conditions. The highest alcohol emission rates, especially at 80% RH, were from new sapwood, followed by old sapwood. 1-pentanol is derived from linoleic acid (Ghorbani Gorji et al., 2019), which can explain the difference in emission rates between sample types. Higher alcohol emissions from sapwood have been reported previously at least by Czajka et al. (2020). However, at least some of the difference might be due to uncertainties related to quantification of alcohols, as both 1-butanol and 1-pentanol eluted closely with benzene and toluene, respectively. Some overlapping of the chromatographic peaks might have happened. For example, in heartwood samples, both 1-pentanol and toluene was detected at high RH, whereas in sapwood, only 1-pentanol was detected and the emission rates were higher than those in heartwood. Problematically, the quality of library search identification remained high for 1-pentanol when no toluene was detected. Therefore, chromatographic peaks of alcohols in sapwood samples may include aromatic compounds, partly explaining the higher alcohol emissions from sapwood.
Other compounds
Other compounds found in our study were mostly unidentified compounds. Aromatic compounds, and small quantities of alkanes, alkenes, and ketones were also present. The compounds most likely emitted from the experimental set-up were subtracted from the TVOC as mentioned in chapter 2.5. Two of the most emitted aromatic compounds were toluene and benzaldehyde. Interestingly, their emissions were much higher in chambers containing heartwood specimens (two-threefold to those containing sapwood). Toluene and benzaldehyde emissions from Scots pine heartwood have been reported by at least Czajka et al. (2020), but overall, aromatic compounds have been reported more from heat treated wood (Hyttinen et al., 2010; Manninen et al., 2002; Sivrikaya et al., 2019). Toluene has also been observed to emit from Scots pine under physical stress (Heiden et al., 1999). However, their origin in increased quantities was left unclear as both can also originate from the epoxy adhesive used in the chambers. Benzaldehyde is also a degradation product of Tenax tubes (Clausen and Wolkoff, 1997; Lee et al., 2006). For reference, the emissions of both compounds increased as RH increased while the presence of benzaldehyde and BTEX compounds overall in laboratory air samples remained low.
Strengths and limitations
This study gave an insight into VOC emission rates from untreated Scots pine exposed to fluctuations of RH typical in seasonally changing indoor RH conditions. The strength of this study is that it follows the VOC emission rates from untreated wood specimens during gradual conditioning first to higher and then to lower MCs as a function of time. Another strength of our experiment was the use of both new and old specimens (that had been stored indoors for 15 years and thus exposed to annual indoor RH fluctuations). This allowed us to study whether the effects of historical changes in RH are affecting the emissions from old materials. This is a relevant addition to real-life applications compared to emission tests of new materials only. This approach can add value to the scientific discussion regarding the emissions from aged (but also reused) materials.
The deviation from standard emission test protocols (e.g. different RH conditions) makes it difficult to compare the results to limit values set for TVOC and individual compounds, or other emission test results found in the literature. However, this experimental setup can also be considered as a strength, as it allows us to contribute to the scientific discussion regarding the suitability of standard emission tests performed at fixed 50 ± 5% RH for hygroscopic materials such as wood.
Furthermore, we are not certain that the specimens reached their EMC thoroughly during each conditioning period. Given that the VOCs primarily emit from the surface of the specimen, a slight moisture gradient is not considered a critical problem. We anticipate that the moisture gradient more likely inhibits VOC emissions than intensifies them, thus our findings should not at least be overestimates.
Another limitation of this study was the rather small sample size, which means that individual specimens contributed strongly to the mean values presented. As the main objective of the experiment was to generate better understanding on the emission behavior in gradually changing indoor RH and not to determine exact VOC concentrations from uncoated pine wood, we believe our results improve the understanding of the emission behavior of different types of Scots pine wood in gradually changing RH conditions.
Conclusions
This study addresses the knowledge cap regarding how wood VOC emissions respond to gradual changes in indoor RH. Main conclusions from the study were:
Indoor relative humidity (RH) variations and subsequent wood moisture content changes had significant effects on Scots pine wood VOC emissions. VOC emissions increased and decreased along with the increase and decrease of RH.
VOC emissions were at their greatest at the highest RH conditions. More polar compounds were emitted as RH increased. At a very high RH (80% in this study) emissions increased regardless of their polarity.
Old specimens, which had undergone several seasonal indoor RH cycles, emitted less and the composition of the emissions was different from that of new specimens that represented recently sawn Scots pine wood.
The terpene and aldehyde emissions from recently sawn Scots pine heartwood and sapwood, respectively, were higher than those of other wood types, independently of the RH conditions.
Our study highlights the importance of considering different factors, particularly the relative humidity, when planning healthy indoor environments. The information can also be useful in product development – emissions from old wood are clearly lower than those from new wood. Due to the diversity of physical parameters affecting wood’s VOC emissions from different species, more research is needed. Future research should be devoted to the emissions from recycled and reused (old) materials, especially those with an unknown history of use. Furthermore, a range of wood species is commonly used indoors, sometimes uncoated, and there are reasons to believe that their VOC emissions differ from each other greatly. Moreover, research about the effects of RH on compounds that are known to be emitted from wood, but that were not in the scope of this study, for example, VVOCs, could add further value. Better understanding of the potentially low-emitting wood materials is beneficial when designing and deciding solutions contributing to indoor air quality. Our results show that (re)use of old wood instead of new wood could cut off some of the emissions that are initially high in spaces where wood is widely applied.
Footnotes
Appendix A1
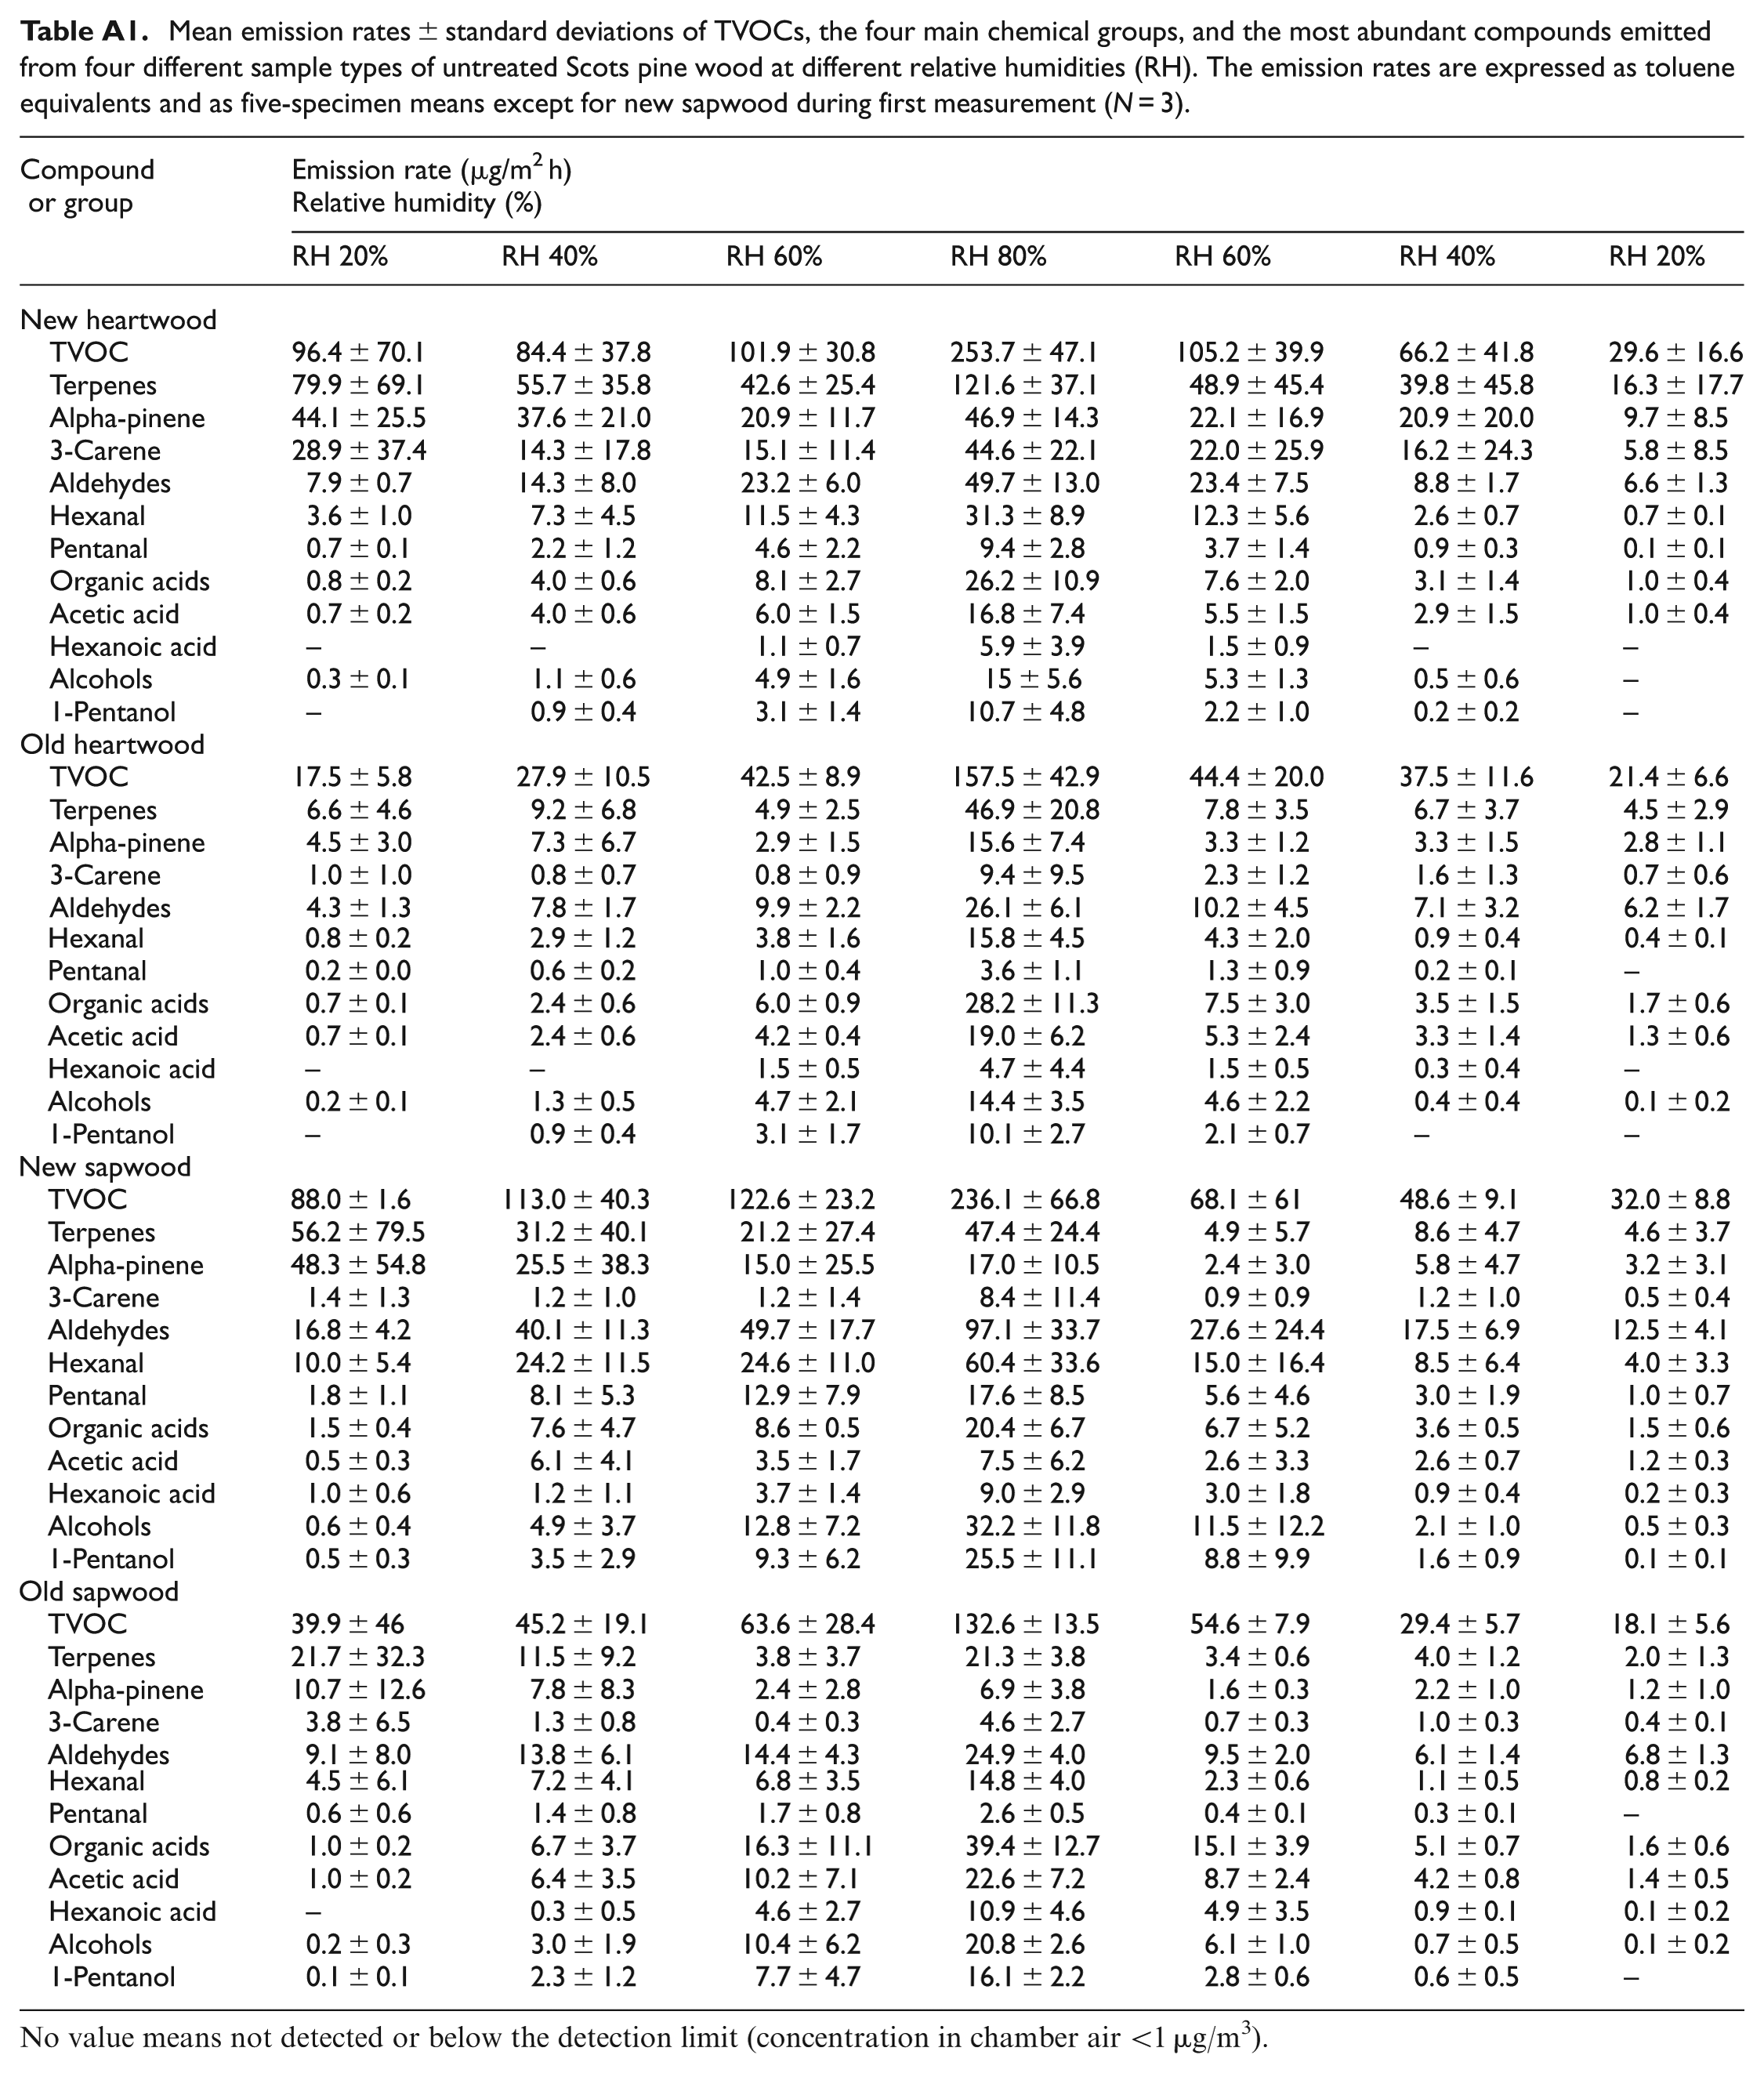
Mean emission rates ± standard deviations of TVOCs, the four main chemical groups, and the most abundant compounds emitted from four different sample types of untreated Scots pine wood at different relative humidities (RH). The emission rates are expressed as toluene equivalents and as five-specimen means except for new sapwood during first measurement (N = 3).
| Compound or group | Emission rate (µg/m2 h) |
||||||
|---|---|---|---|---|---|---|---|
| RH 20% | RH 40% | RH 60% | RH 80% | RH 60% | RH 40% | RH 20% | |
| New heartwood | |||||||
| TVOC | 96.4 ± 70.1 | 84.4 ± 37.8 | 101.9 ± 30.8 | 253.7 ± 47.1 | 105.2 ± 39.9 | 66.2 ± 41.8 | 29.6 ± 16.6 |
| Terpenes | 79.9 ± 69.1 | 55.7 ± 35.8 | 42.6 ± 25.4 | 121.6 ± 37.1 | 48.9 ± 45.4 | 39.8 ± 45.8 | 16.3 ± 17.7 |
| Alpha-pinene | 44.1 ± 25.5 | 37.6 ± 21.0 | 20.9 ± 11.7 | 46.9 ± 14.3 | 22.1 ± 16.9 | 20.9 ± 20.0 | 9.7 ± 8.5 |
| 3-Carene | 28.9 ± 37.4 | 14.3 ± 17.8 | 15.1 ± 11.4 | 44.6 ± 22.1 | 22.0 ± 25.9 | 16.2 ± 24.3 | 5.8 ± 8.5 |
| Aldehydes | 7.9 ± 0.7 | 14.3 ± 8.0 | 23.2 ± 6.0 | 49.7 ± 13.0 | 23.4 ± 7.5 | 8.8 ± 1.7 | 6.6 ± 1.3 |
| Hexanal | 3.6 ± 1.0 | 7.3 ± 4.5 | 11.5 ± 4.3 | 31.3 ± 8.9 | 12.3 ± 5.6 | 2.6 ± 0.7 | 0.7 ± 0.1 |
| Pentanal | 0.7 ± 0.1 | 2.2 ± 1.2 | 4.6 ± 2.2 | 9.4 ± 2.8 | 3.7 ± 1.4 | 0.9 ± 0.3 | 0.1 ± 0.1 |
| Organic acids | 0.8 ± 0.2 | 4.0 ± 0.6 | 8.1 ± 2.7 | 26.2 ± 10.9 | 7.6 ± 2.0 | 3.1 ± 1.4 | 1.0 ± 0.4 |
| Acetic acid | 0.7 ± 0.2 | 4.0 ± 0.6 | 6.0 ± 1.5 | 16.8 ± 7.4 | 5.5 ± 1.5 | 2.9 ± 1.5 | 1.0 ± 0.4 |
| Hexanoic acid | – | – | 1.1 ± 0.7 | 5.9 ± 3.9 | 1.5 ± 0.9 | – | – |
| Alcohols | 0.3 ± 0.1 | 1.1 ± 0.6 | 4.9 ± 1.6 | 15 ± 5.6 | 5.3 ± 1.3 | 0.5 ± 0.6 | – |
| 1-Pentanol | – | 0.9 ± 0.4 | 3.1 ± 1.4 | 10.7 ± 4.8 | 2.2 ± 1.0 | 0.2 ± 0.2 | – |
| Old heartwood | |||||||
| TVOC | 17.5 ± 5.8 | 27.9 ± 10.5 | 42.5 ± 8.9 | 157.5 ± 42.9 | 44.4 ± 20.0 | 37.5 ± 11.6 | 21.4 ± 6.6 |
| Terpenes | 6.6 ± 4.6 | 9.2 ± 6.8 | 4.9 ± 2.5 | 46.9 ± 20.8 | 7.8 ± 3.5 | 6.7 ± 3.7 | 4.5 ± 2.9 |
| Alpha-pinene | 4.5 ± 3.0 | 7.3 ± 6.7 | 2.9 ± 1.5 | 15.6 ± 7.4 | 3.3 ± 1.2 | 3.3 ± 1.5 | 2.8 ± 1.1 |
| 3-Carene | 1.0 ± 1.0 | 0.8 ± 0.7 | 0.8 ± 0.9 | 9.4 ± 9.5 | 2.3 ± 1.2 | 1.6 ± 1.3 | 0.7 ± 0.6 |
| Aldehydes | 4.3 ± 1.3 | 7.8 ± 1.7 | 9.9 ± 2.2 | 26.1 ± 6.1 | 10.2 ± 4.5 | 7.1 ± 3.2 | 6.2 ± 1.7 |
| Hexanal | 0.8 ± 0.2 | 2.9 ± 1.2 | 3.8 ± 1.6 | 15.8 ± 4.5 | 4.3 ± 2.0 | 0.9 ± 0.4 | 0.4 ± 0.1 |
| Pentanal | 0.2 ± 0.0 | 0.6 ± 0.2 | 1.0 ± 0.4 | 3.6 ± 1.1 | 1.3 ± 0.9 | 0.2 ± 0.1 | – |
| Organic acids | 0.7 ± 0.1 | 2.4 ± 0.6 | 6.0 ± 0.9 | 28.2 ± 11.3 | 7.5 ± 3.0 | 3.5 ± 1.5 | 1.7 ± 0.6 |
| Acetic acid | 0.7 ± 0.1 | 2.4 ± 0.6 | 4.2 ± 0.4 | 19.0 ± 6.2 | 5.3 ± 2.4 | 3.3 ± 1.4 | 1.3 ± 0.6 |
| Hexanoic acid | – | – | 1.5 ± 0.5 | 4.7 ± 4.4 | 1.5 ± 0.5 | 0.3 ± 0.4 | – |
| Alcohols | 0.2 ± 0.1 | 1.3 ± 0.5 | 4.7 ± 2.1 | 14.4 ± 3.5 | 4.6 ± 2.2 | 0.4 ± 0.4 | 0.1 ± 0.2 |
| 1-Pentanol | – | 0.9 ± 0.4 | 3.1 ± 1.7 | 10.1 ± 2.7 | 2.1 ± 0.7 | – | – |
| New sapwood | |||||||
| TVOC | 88.0 ± 1.6 | 113.0 ± 40.3 | 122.6 ± 23.2 | 236.1 ± 66.8 | 68.1 ± 61 | 48.6 ± 9.1 | 32.0 ± 8.8 |
| Terpenes | 56.2 ± 79.5 | 31.2 ± 40.1 | 21.2 ± 27.4 | 47.4 ± 24.4 | 4.9 ± 5.7 | 8.6 ± 4.7 | 4.6 ± 3.7 |
| Alpha-pinene | 48.3 ± 54.8 | 25.5 ± 38.3 | 15.0 ± 25.5 | 17.0 ± 10.5 | 2.4 ± 3.0 | 5.8 ± 4.7 | 3.2 ± 3.1 |
| 3-Carene | 1.4 ± 1.3 | 1.2 ± 1.0 | 1.2 ± 1.4 | 8.4 ± 11.4 | 0.9 ± 0.9 | 1.2 ± 1.0 | 0.5 ± 0.4 |
| Aldehydes | 16.8 ± 4.2 | 40.1 ± 11.3 | 49.7 ± 17.7 | 97.1 ± 33.7 | 27.6 ± 24.4 | 17.5 ± 6.9 | 12.5 ± 4.1 |
| Hexanal | 10.0 ± 5.4 | 24.2 ± 11.5 | 24.6 ± 11.0 | 60.4 ± 33.6 | 15.0 ± 16.4 | 8.5 ± 6.4 | 4.0 ± 3.3 |
| Pentanal | 1.8 ± 1.1 | 8.1 ± 5.3 | 12.9 ± 7.9 | 17.6 ± 8.5 | 5.6 ± 4.6 | 3.0 ± 1.9 | 1.0 ± 0.7 |
| Organic acids | 1.5 ± 0.4 | 7.6 ± 4.7 | 8.6 ± 0.5 | 20.4 ± 6.7 | 6.7 ± 5.2 | 3.6 ± 0.5 | 1.5 ± 0.6 |
| Acetic acid | 0.5 ± 0.3 | 6.1 ± 4.1 | 3.5 ± 1.7 | 7.5 ± 6.2 | 2.6 ± 3.3 | 2.6 ± 0.7 | 1.2 ± 0.3 |
| Hexanoic acid | 1.0 ± 0.6 | 1.2 ± 1.1 | 3.7 ± 1.4 | 9.0 ± 2.9 | 3.0 ± 1.8 | 0.9 ± 0.4 | 0.2 ± 0.3 |
| Alcohols | 0.6 ± 0.4 | 4.9 ± 3.7 | 12.8 ± 7.2 | 32.2 ± 11.8 | 11.5 ± 12.2 | 2.1 ± 1.0 | 0.5 ± 0.3 |
| 1-Pentanol | 0.5 ± 0.3 | 3.5 ± 2.9 | 9.3 ± 6.2 | 25.5 ± 11.1 | 8.8 ± 9.9 | 1.6 ± 0.9 | 0.1 ± 0.1 |
| Old sapwood | |||||||
| TVOC | 39.9 ± 46 | 45.2 ± 19.1 | 63.6 ± 28.4 | 132.6 ± 13.5 | 54.6 ± 7.9 | 29.4 ± 5.7 | 18.1 ± 5.6 |
| Terpenes | 21.7 ± 32.3 | 11.5 ± 9.2 | 3.8 ± 3.7 | 21.3 ± 3.8 | 3.4 ± 0.6 | 4.0 ± 1.2 | 2.0 ± 1.3 |
| Alpha-pinene | 10.7 ± 12.6 | 7.8 ± 8.3 | 2.4 ± 2.8 | 6.9 ± 3.8 | 1.6 ± 0.3 | 2.2 ± 1.0 | 1.2 ± 1.0 |
| 3-Carene | 3.8 ± 6.5 | 1.3 ± 0.8 | 0.4 ± 0.3 | 4.6 ± 2.7 | 0.7 ± 0.3 | 1.0 ± 0.3 | 0.4 ± 0.1 |
| Aldehydes | 9.1 ± 8.0 | 13.8 ± 6.1 | 14.4 ± 4.3 | 24.9 ± 4.0 | 9.5 ± 2.0 | 6.1 ± 1.4 | 6.8 ± 1.3 |
| Hexanal | 4.5 ± 6.1 | 7.2 ± 4.1 | 6.8 ± 3.5 | 14.8 ± 4.0 | 2.3 ± 0.6 | 1.1 ± 0.5 | 0.8 ± 0.2 |
| Pentanal | 0.6 ± 0.6 | 1.4 ± 0.8 | 1.7 ± 0.8 | 2.6 ± 0.5 | 0.4 ± 0.1 | 0.3 ± 0.1 | – |
| Organic acids | 1.0 ± 0.2 | 6.7 ± 3.7 | 16.3 ± 11.1 | 39.4 ± 12.7 | 15.1 ± 3.9 | 5.1 ± 0.7 | 1.6 ± 0.6 |
| Acetic acid | 1.0 ± 0.2 | 6.4 ± 3.5 | 10.2 ± 7.1 | 22.6 ± 7.2 | 8.7 ± 2.4 | 4.2 ± 0.8 | 1.4 ± 0.5 |
| Hexanoic acid | – | 0.3 ± 0.5 | 4.6 ± 2.7 | 10.9 ± 4.6 | 4.9 ± 3.5 | 0.9 ± 0.1 | 0.1 ± 0.2 |
| Alcohols | 0.2 ± 0.3 | 3.0 ± 1.9 | 10.4 ± 6.2 | 20.8 ± 2.6 | 6.1 ± 1.0 | 0.7 ± 0.5 | 0.1 ± 0.2 |
| 1-Pentanol | 0.1 ± 0.1 | 2.3 ± 1.2 | 7.7 ± 4.7 | 16.1 ± 2.2 | 2.8 ± 0.6 | 0.6 ± 0.5 | – |
No value means not detected or below the detection limit (concentration in chamber air <1 µg/m3).
Acknowledgements
The authors wish to express their thanks for the support of Stora Enso, Uimaharju Sawmill for providing the materials.
Ethical considerations
Not applicable.
Consent to participate
Not applicable.
Consent for publication
Not applicable.
Funding
The authors disclosed receipt of the following financial support for the research, authorship, and/or publication of this article: This work was supported by Ministry of the Environment of Finland [funding decision VN/2899/2019].
Declaration of conflicting interests
The authors declared no potential conflicts of interest with respect to the research, authorship, and/or publication of this article.
Data availability statement
Data will be made available on request.