
Abstract
The study comprises three laboratory tests in which typical Finnish highly insulated (HI) walls were exposed to concentrated leakages of indoor air under steady outdoor temperatures of 1–5°C. Airflows with a relative humidity of 50% and at rates of 1–3 L/min were directed close to the wooden frames inside the walls. The thermal resistance ratios between the exterior sheathing(s) and the whole wall (Γ) were 20%–22% and 1%–10% for the HI and baseline (BL) walls. The HI walls that presented Γ values of at least 20% were observed to be resistant to air exfiltration, and their durability was not affected by the addition of a gypsum sheathing outside the wooden frame or a more permeable vapor retarder. This is related to the negative linear correlation that exists between the moisture accumulation rate in wood-based material and the dew point depression (DPD) value. The developed approach, called the DPD method, shows that a significant degree of moisture accumulation does not occur even for DPD values of as low as −2°C if the exterior sheathing is vapor permeable. The airflow does not penetrate into the rigid mineral wool sheathing, which helps to avoid interstitial condensation. Regardless of thermal transmittance, the HI and BL walls with maximum Γ values of 1% were exposed to a high relative humidity and even interstitial condensation because the DPD values were often below −2°C. For these walls, the mold index analysis and visual observations confirmed the local risk for mold growth on the opposite side of the leakage point. In practice, long-term mold growth may be limited if the seasonal periods during which the outdoor temperature is 1–5°C last for a maximum of about 1 month every year.
Introduction
In climates with cold seasons, modern houses have to be thermally well insulated. For example, in Finland, the benchmark value for the thermal transmittance (U) of an external wall is 0.17 W/m2K. However, even lower values such as 0.12–0.14 W/m2K are widely used to minimize the energy consumption of buildings and meet strict energy efficiency requirements. The performance of highly insulated (HI) structures has been studied by, for example, Vinha et al. (2013), Gullbrekken et al. (2015), Pihelo et al. (2016), Nelson (2017), Gradeci et al. (2018), Viljanen and Lu (2019), and Viljanen et al. (2021). Such studies have typically focused on the diffusion of water vapor to the colder outer parts of a HI structure. In lightweight external assemblies, the role of the effect of convection on hygrothermal performance is essential (Ojanen and Kohonen, 1989), but a hermetic external envelope is prone to errors in execution (Hens, 2016). Air may typically flow through penetrations, cracks, joints, and junctions in the building structures (Desmarais et al., 2000; Kalamees, 2007). The ingress of indoor air into the structure and its flow out to the outdoor air is called indoor air exfiltration, which may lead to interstitial condensation during cold periods, whereas infiltration from the outdoor air has a similar effect in hot climates (American Society of Heating, Refrigerating and Air-Conditioning Engineers [ASHRAE], 2017).
Airflow may arise from the buoyancy force produced due to the temperature difference that generates an overpressure in the indoor air, which affects roofs and the upper sections of external walls, whereas internal buoyancy occurs in the roofs and walls. Generally, internal buoyancy typically has a pronounced impact on the thermal conductivity of granular loose-fill insulation as the associated air permeability is higher than, for instance, mineral wool (MW) boards, but Langmans et al. (2012) also found that internal buoyancy may affect the moisture redistribution inside an MW insulated wall. By pressurizing an HI test wall using a fan, the authors induced moisture accumulation in the upper parts of the exterior sheathing, highlighting the existence of natural convection that was probably exacerbated by the open gaps located at the bottom and upper part of the interior sheathing. The ventilation of a building has a significant effect on air leakages. In Finland, buildings are typically slightly depressurized because of mechanical ventilation that extracts more air from the building compared to the amount of air supplied. Furthermore, the wind creates a fluctuating pressure difference (PD) over external walls. On the windward side of a building, the ventilation cavity of a wall may be pressurized to induce simultaneous infiltration and exfiltration, whereas exfiltration is dominant in other areas of the envelope (TenWolde et al., 1995).
The structural factors that promote uncontrolled airflows can be mitigated through meticulous workmanship, as indicated by Kalamees and Kurnitski (2010), because such airflows may require there to be significant defects in the airtightness of a structure. Langmans et al. (2012) focused on the effect of exterior airtightness on the hygrothermal performance of HI walls that had a leaky wallboard without a vapor barrier and a 300-mm-thick cavity insulation. The water vapor diffusion equivalent air layer thickness (Sd) of the exterior bituminous impregnated soft fiber board (SFB) was below 0.23 m. The moisture content (MC) of the SFB increased when the outdoor temperature was 3°C and the indoor air pressure was 5–10 Pa higher than that in the outdoor chamber. The parameter of exterior airtightness proved crucial, as the highest levels of MC and mold growth were observed in the SFB that did not have any external air barrier foil. The benefit of exterior airtightness was also discovered by Kalamees and Kurnitski (2010); in their study, a film-coated sheathing with taped joints was found to be superior to a wood fiberboard one. For HI assemblies, achieving both interior and exterior airtightness is usually a design objective, which is justified based on the above findings.
Further, Ojanen and Simonson (1995) studied the effect of airflows between an old wall and additional insulation placed inside the wall. The moisture accumulation was found to be the highest in two structures that had expanded polystyrene (EPS) insulation surrounded by vapor retarders. The third, otherwise similar wall had an MW insulation, which probably helped redistribute the moisture (Ojanen and Simonson, 1995). Having foam insulation on the outside of the structure may also cause moisture accumulation in the exterior sheathing if the temperature on the warm side of the sheathing drops below the dew point of the indoor air (Desmarais et al., 2000). It is obvious that the water vapor permeability of the structural layers affects the hygric performance of a wall subjected to exfiltration.
Product imperfections and implementation errors that induce local airflows inside the structures are one of the most important factors that affect this performance (Ojanen and Kohonen, 1989). Derome (2005) experimentally studied the hygrothermal performance of flat roofs that had cellulose insulation and air exfiltration. The results suggested that having a thicker insulation mitigated the changes in MC in the insulation. Ge et al. (2019) found that, with cellulose insulation, the relative humidity (RH) in the framing cavity of a wall during an air leakage rose to 65%, whereas, with MW insulation, the RH reached a level of over 90%.
Ge et al. (2019) focused on the thermal resistance (R) value of the materials outside the wall frame and found that moisture accumulation in the oriented strand board (OSB) was less in HI walls that had a 50–76-mm-thick exterior insulation than the baseline (BL) wall or the deep cavity walls that had only an OSB sheathing. The most vapor-open exterior insulation made of MW performed the best in these tests, with a leakage rate of 18.9 L/min. Trainor et al. (2016) obtained similar results using lower air leakage rates of 1.2–4.8 L/min per square meter of the wall representing values for airtight buildings. The MC of the OSB sheathing was over 35 weight percent (wt%) in the walls that had low exterior R values, whereas, in the wall that had a 140-mm-thick MW and a 76-mm-thick exterior MW, the MC increased to only 11–13 wt% (Trainor et al., 2016). Ojanen and Kumaran (1995) simulated air leakages with 48% indoor RH to find that a 25-mm-thick exterior sheathing of MW reduced the rate of moisture accumulation in a wall that had a 145-mm-thick cavity insulation. The potential disadvantages of exterior insulation include increased detailing at windows and doors in addition to the decreased drying potential with a vapor-tight exterior insulation.
Desmarais et al. (2000) mapped air leakage patterns inside wood framed walls that had an 89-mm-thick MW insulation to observe that not only is the temperature distribution affected by air leakage but also moisture accumulation follows the airflow field inside the wall assembly. The authors classified certain typical leakage paths using the adjectives “long,”“concentrated,” and “distributed.” A long leakage path is represented by, for example, a leaky joint of a vapor barrier or a gap between the wallboard and the adjacent structure. A point defect in the vapor barrier or exterior sheathing enables a concentrated airflow, whereas an evenly distributed airflow may arise when air permeable materials have been used. Derome (2005) observed the airflow patterns in flat roofs in which the moisture had accumulated in the vicinity of the leakage points, resulting in the “caking” of the cellulose insulation.
The evaluation of the indoor humidity level is also necessary, as the moisture risks related to the air leakages of indoor air with a small moisture excess (ME) are low (e.g. Ferrantelli et al., 2019). This is justified because the moisture accumulation from exfiltration may be evaluated by comparing the indoor vapor concentration to the vapor concentration of the saturated air at the condensation plane (Wang and Ge, 2017). The study by Ferrantelli et al. (2019) was conducted in a Finnish school building, where the indoor ME was only 0.1 g/m3 in September. Their numerical studies on exfiltration implied moisture accumulation in a floor junction when the indoor ME is 5 g/m3. Kalamees and Kurnitski (2010) studied the effect of exfiltration in wall-roof joints of wood framed structures through a laboratory experiment considering the joints of a vapor barrier as a leakage path into the roof. They identified that a leakage rate of 6–12 L/min per meter of the joint could be used as a performance criterion when the ME between the indoor and outdoor air was 4 g/m3 during a cold period. In Finnish lightweight detached houses, the ME is typically 1.8 g/m3 in the cold season (Kalamees et al., 2006), which results in uncomfortably dry indoor air (20%–25%) as the optimal range in terms of human health and living comfort is about 30%–50% (Wolkoff, 2018). Humidification of the indoor air may, however, increase the risks affiliated with exfiltration. The indoor ME levels reported by Ferrantelli et al. (2019) and Kalamees et al. (2006) suggest that the exfiltration-related moisture risks are higher in residential buildings compared to service buildings.
The simulations carried out by Ojanen and Kumaran (1995) also showed that the temperature inside a wall rises with higher leakage rates, and, eventually, interstitial condensation is no longer possible—an aspect that complicates the analysis of exfiltration. With airflow rates of 0.04–4 L/m2min, the impact of airflow on temperature distribution was relatively small; but with airflow rates of 22 L/m2min and more, the impact was pronounced (Ojanen and Kumaran, 1995). Such a temperature increase was also reported by Belleudy et al. (2014), who studied the cellulose insulation of an attic space.
Trainor et al. (2016) evaluated the impact of climate on the probability of moisture accumulation. The higher the heating degree days (HDD) of the three Canadian cities considered were, the more moisture accumulated in the walls analyzed. The authors (and, later, Lee et al. (2019)) suggested that, in colder climates, a thicker exterior insulation may be used to reduce the condensation risk created by air leakages. The only wall that was virtually unaffected by HDD values ranging between 2900 and 5800 was the one that had vapor-permeable exterior thermal insulation (Trainor et al., 2016). Such HDD values are typical for climates with cold seasons. For example, in Finland, the HDD values in Helsinki and Sodankylä were, on average, 3500 and 5700, respectively, in the last decade, which is a decrease of roughly 400 units from the values for the years 1981–2010 (Finnish Meteorological Institute, 2021a).
The hygrothermal performance of HI external envelopes subjected only to diffusion of indoor humidity has been found acceptable in several studies (Airaksinen et al., 2017; Fedorik et al., 2021; Gradeci et al., 2018; Radon et al., 2018). In the current study, the performance of HI external walls is tested with considerable amount of moisture load caused by air exfiltration, which may produce even two orders of magnitude higher moisture flux compared to diffusion (Ojanen and Kumaran, 1995). The study focuses, thus, on the impact of poor construction practice to the moisture safety of building envelopes. Possible impacts of deficient thermal insulation installation to the exfiltration performance are also examined. The research objective is to ensure the durability of HI external walls by analyzing whether such construction defects may impair the otherwise acceptable functionality of HI building components. The study consists of three tests, whose experimental approach is justified in considering the challenges related to the numerical modeling of air leakages (e.g. Hens, 2015).
As the literature survey highlights the complicated nature of exfiltration, it is difficult at a general level to determine the consequences of air leakages for the functionality of structures. In order to simplify the analysis, the study focuses only on low-hygroscopic walls insulated with mineral wool. In addition, the studied walls are vapor open toward the exterior environment, and the type of defect considered in the air barrier is a concentrated fault.
In the three tests, HI and BL walls are exposed to controlled airflows from indoor air into the walls, and controlled leaking to outdoor air is brought about. Low airflow rates in the range of 1–3 L/min are employed next to the wood frames of the walls to identify the least amount of exfiltration that is detrimental to the performance of the wall and to maintain the heating effect of the airflow at a moderate level. Trainor (2014) emphasized the need to study such lower air leakage rates compared to the rate of 14.4 L/min, which he used as the value expected at the high end of the range for dwelling houses.
The airflow pattern inside HI walls with air-permeable, open-porous cavity insulation, and exterior sheathing has not been sufficiently studied even though it affects the hygric risks affiliated with exfiltration. Hence, the first test evaluates the airflow pattern and moisture transfer inside a HI wall assembly, and targets to clarify whether the air may flow directly to the facing of sheathing board. The assessment of the impact of poorly installed cavity insulation to the hygrothermal performance is also included in the test.
In the two other experiments, the main focus is on the durability and moisture safety of HI external walls that are subjected to air exfiltration. The impact of the U-value on the wall performance is analyzed by also studying the performance of less insulated BL walls. In the second experiment, the air leakage is made to affect the warm and cold sides of the frame separately to evaluate the effect of the insertion point of the convective moisture load. This test also evaluates the structural factors that allow significant local air leakage through the walls and the importance of the indoor RH with respect to the risks of exfiltration. The third test focuses on the performance of modified HI walls; the exterior MW sheathing is replaced by the combination of a gypsum sheathing and a MW sheathing, and in the other alternative, the vapor barrier is more permeable compared to the base case.
The hygrothermal response, moisture accumulation rate, and calculated mold growth potential of the structures are used to evaluate the performance of the walls. Based on the observed performance of the walls, recommendations for realizing HI external walls are made to ensure the durability of the structures to air leakages. To ease practical design work, this study also proposes a simple method for evaluating the amount of moisture accumulation in lightweight external assemblies from indoor air exfiltration.
Materials and methods
Hygrothermal equations and assessment of mold growth
Equations for analyzing air leakage
The relative distribution of the thermal insulation over the width of an external assembly affects the consequences of the humidity transferred by airflows inside a wall. The exterior insulation significantly increases the relative contribution of the outer parts to the thermal resistance of the walls, whereas the increase by thin, rigid sheathing boards (e.g. gypsum and plywood) is only theoretical. Following the concept of the drying potential index (Lehtinen and Lehtonen, 1997) that describes the distribution of thermal resistance in a wall, we define the exterior insulation ratio as follows:

Where, Rext denotes the thermal resistance outside the wood frame (m2K/W), and Rt is the total thermal resistance of an assembly (m2K/W). In BL walls, the Γ value is typically lower than that of HI walls. However, HI walls with low Γ values have also been widely implemented in Finland. Equation (1) was also used by Lee et al. (2019), who replaced the denominator in the equation with the total thermal resistance inside the exterior sheathing.
The dimensionless temperature (DT) at the observation point i is defined as follows in the analysis of the measurement results:

Where,
The convective moisture transport rate (kg/s) directed into a structure can be estimated using the following equation (adapted from the book of Hagentoft (2001)):

Where, Qv represents the volume of airflow going into the structure (m3/s), vin represents the absolute humidity (AH) in the indoor air (kg/m3), and vi represents the AH at an observation point i. The AHs were calculated by multiplying the AH of saturated air, which is calculated using equation (4) given by Björkholz (1997), with the RH expressed as values between 0 and 1:

Where, the temperature

Where, D is the diffusivity of water vapor in air (m2/s), vout is the AH in the outdoor air (kg/m3), μ is the water vapor diffusion resistance factor (−), and dx is the thickness of the material (m). The analysis utilized equation (6) to calculate the dew point temperature (°C) from the temperature and the RH (Schoen, 2005):


Where, a is 17.27, b is 237.3 (°C), T denotes the temperature (°C), and the RH is expressed in percentage. The maximum error in the calculated Tdew using equation (6) is ±0.4°C. The Tdew of the indoor air can be compared to the temperature at an observation point that is typically located at the colder outer parts of an external assembly. This temperature difference can be expressed as the dew point depression (DPD) (°C):

Where,
The evaluation of the hygric performance of a structure and the rate of moisture accumulation obtained using equation (7), called the DPD method, is justified because it includes the two most important factors regarding exfiltration, which is otherwise a complex phenomenon: (a) the level of indoor humidity and (b) the thermal conditions at the cold side of the structure. The feasibility of the method can be analyzed by determining the linear correlation coefficient between the rate of change in the moisture content of a material and the DPD value in the wall near this material. For this purpose, the DPD values for the test structures subjected to concentrated air leaks were calculated according to the average boundary conditions, and the corresponding MC changes of wood-based materials were selected from the results. The temperatures at the exterior sections of the structures were determined by assuming steady state temperature distribution across the structures.
Determination of exterior thermal resistance
As the thermal conditions in the exterior parts of building envelopes depend mostly on the outdoor temperature, steady-state calculations were performed, where the expected DPD values were evaluated depending on the outdoor temperature, the Γ value, and the indoor RH (25%–50%) and using a constant indoor temperature of 21°C. The Γ values, which produce low DPD values that enable moisture accumulation for a maximum of 2.5 months annually, were determined using the charts that included the cumulative percentages of the yearly outdoor temperature in Espoo and Pudasjärvi (Finnish Meteorological Institute, 2019).
Assessment of mold growth
The effect of the mold found in buildings on indoor air quality can be evaluated, for example, with the environmental relative moldiness index (ERMI) (Vesper et al., 2007). The problems can originate from mold growth inside the building envelope, particularly if air flows from the walls to the rooms. Several models have been developed for describing such mold growth (Gradeci et al., 2017). In the current study, we use the Finnish mold growth model (Lähdesmäki et al., 2008; Viitanen et al., 2008) as a performance indicator for the walls. The model is based on the original VTT model (Hukka and Viitanen, 1999), the basis for which was developed by Viitanen and Ritschkoff (1991). The critical RH values needed for mold growth, provided by the mold models, differ by only 3%–4% within the temperatures of 0–5°C at which the mold risk is evaluated in this study (Gradeci et al., 2017). Regardless, the mold models should be considered only as an indicative method for determining the likelihood of mold development (Brischke and Thelandersson, 2014; Gradeci et al., 2017).
The Finnish mold model combines the effect of temperature and RH at an observation point on the sensitivity of specific materials to mold growth. The lower limit for the temperature at which mold growth is initiated is 0°C, which indicates that the outdoor temperatures used in the tests allowed mold growth. The equation that describes the temperature-dependent minimum level of RH required for mold growth (Hukka and Viitanen, 1999) was used to evaluate the severity of the observed RH levels. The values of the material parameters depended on the point for which the probability for mold growth was evaluated. The sensitivity classes for mold growth speed and maximum amount of mold are 1 (very sensitive), 2 (sensitive), 3 (medium resistant), and 4 (resistant). The classification of mold growth recession speed is 1 (strong), 0.5 (significant), 0.25 (relatively slow), and 0.1 (almost no decline). The used model parameters are displayed in the result figures of the mold index (MI). The model evaluates the mold growth potential with MI values of 0–6, which are defined as follows: 0 (no mold growth), 1 (small amounts of microscopic mold), 2 (distinct microscopic growth), 3 (growth visible to the naked eye), 4 (distinct growth visible to the naked eye), 5 (abundant growth visible to the naked eye), and 6 (highly abundant mold growth).
Experimental arrangements
Studying the exfiltration phenomenon and wall performance in separate tests
The first test evaluated the airflow pattern and moisture transfer inside a HI test wall that had a sheathing made of MW. The objective was to evaluate the area that is affected by a local air leakage, and to evaluate if the airflow can directly reach the facing of the exterior MW board. If the exfiltrating air could penetrate into the exterior sheathing, condensation might occur despite the thermal insulation properties of the sheathing. On the other hand, the size of the area within the wall which moisture transfers to reflects ability of the wall to equalize the moisture content in the materials that are exposed to the convective humidity. The first test was used to analyze the results of the other tests. As the flow distribution was determined using MC as a measured value, the first test was named moisture content mapping (MCM).
The second part of the study regarding the durability and hygrothermal performance of walls was divided into two tests focused on different performance-influencing factors. The second test, called MCON1, studied the long-term performances of a HI and a BL wall that were subjected to a small amount of air leakage, the structural factors that promote exfiltration, and the impact of the direct transfer of moisture to the exterior sheathing. The objective of the third test, called MCON2, was to evaluate the durability and exfiltration performance of three different HI walls and a BL wall with improved thermal insulation. These two tests were focused on the measured hygrothermal conditions inside the walls and utilized the mold growth model as a performance indicator for the functionality of the walls. In the MCON2 test, the MC of studs was also monitored to evaluate the moisture accumulation rate alongside with the temperature conditions, the results of which were used to analyze the feasibility of the DPD method. The test setups and the location of the measurements in the three tests are shown in Figures 1 to 3, and the measurements are further described in Appendix 1.
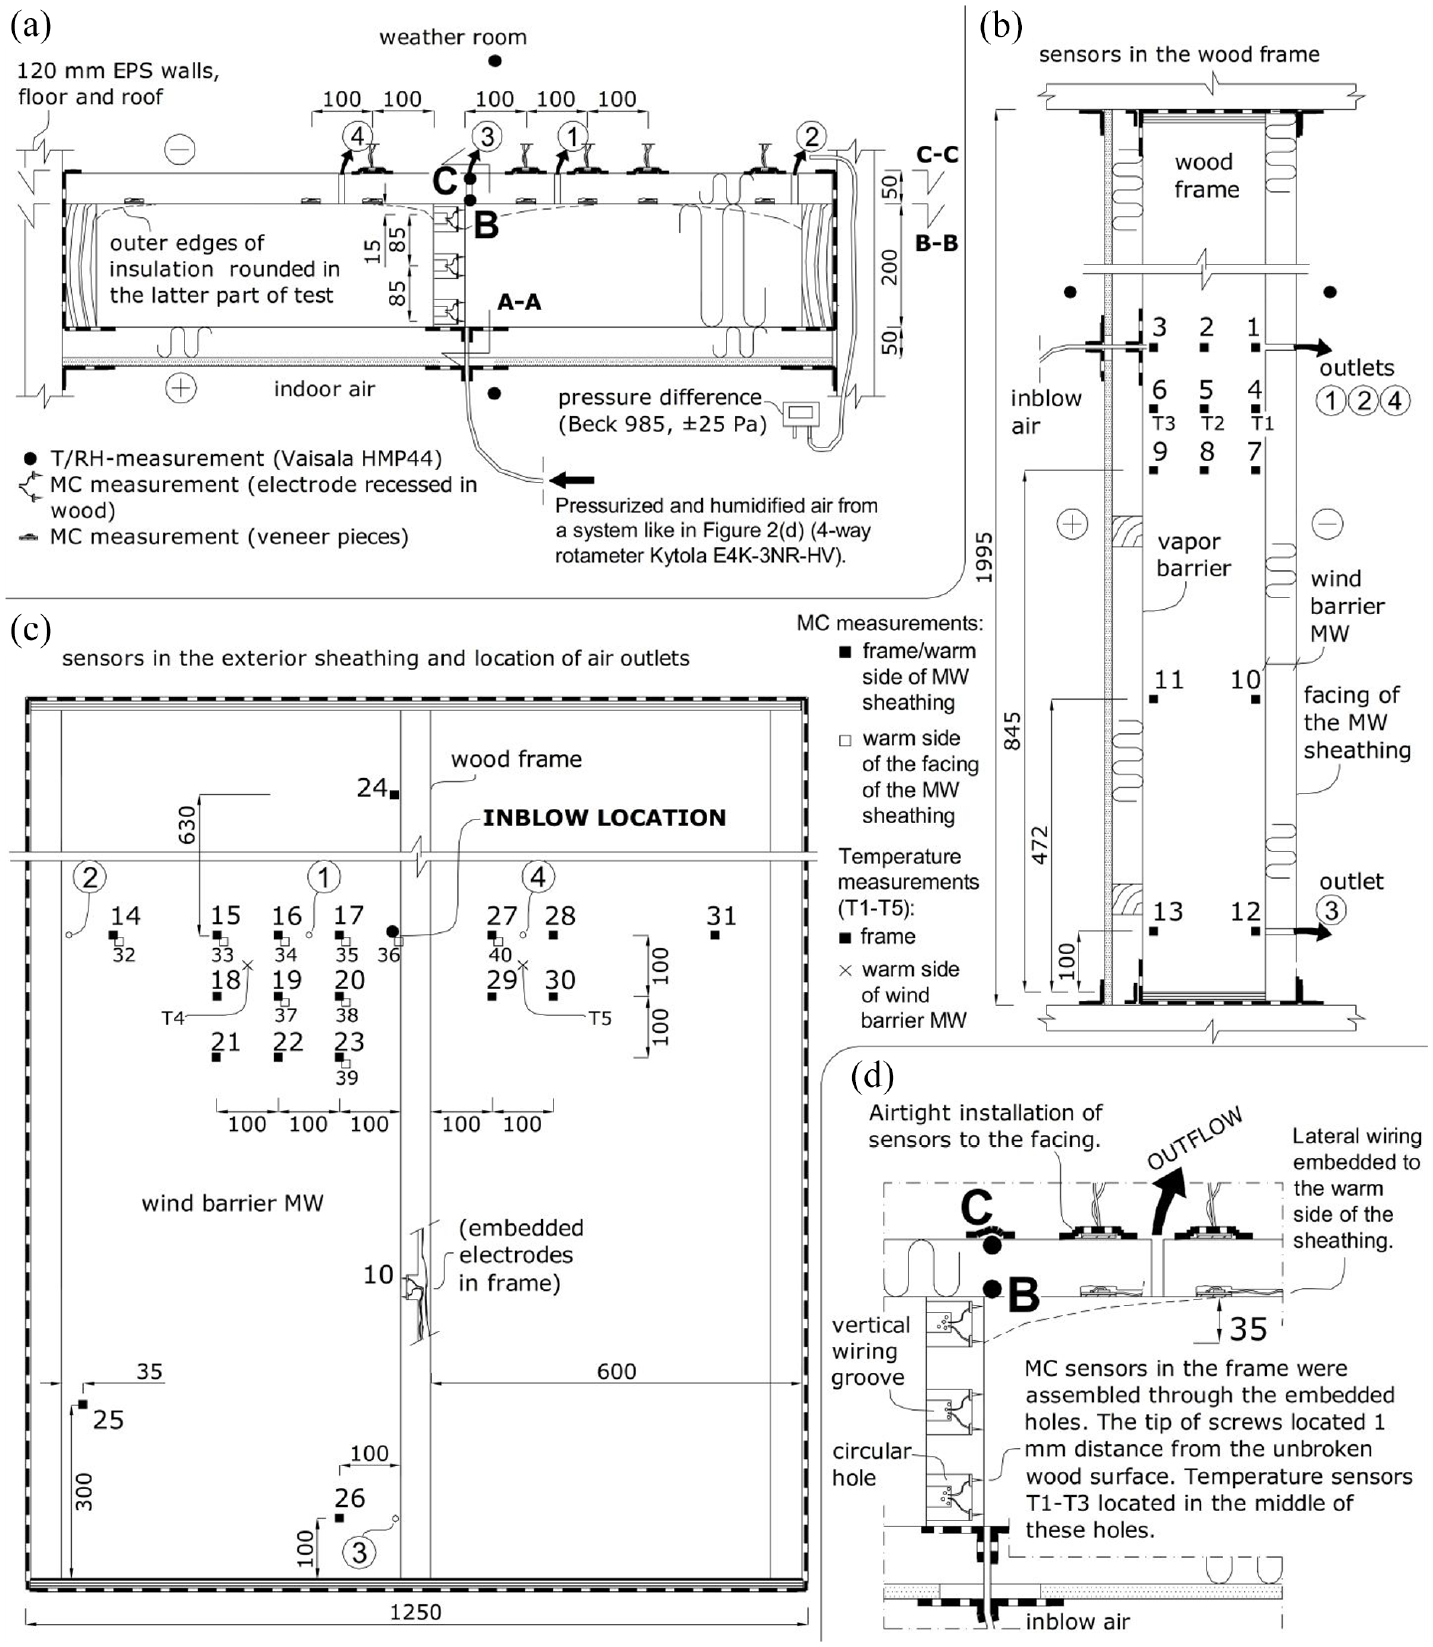
The setup for the MCM test: (a) horizontal section of the test wall, (b) vertical section of the wall seen from the side, (c) vertical sections seen from the outside air, and(d) close-up from the sensor assembly.
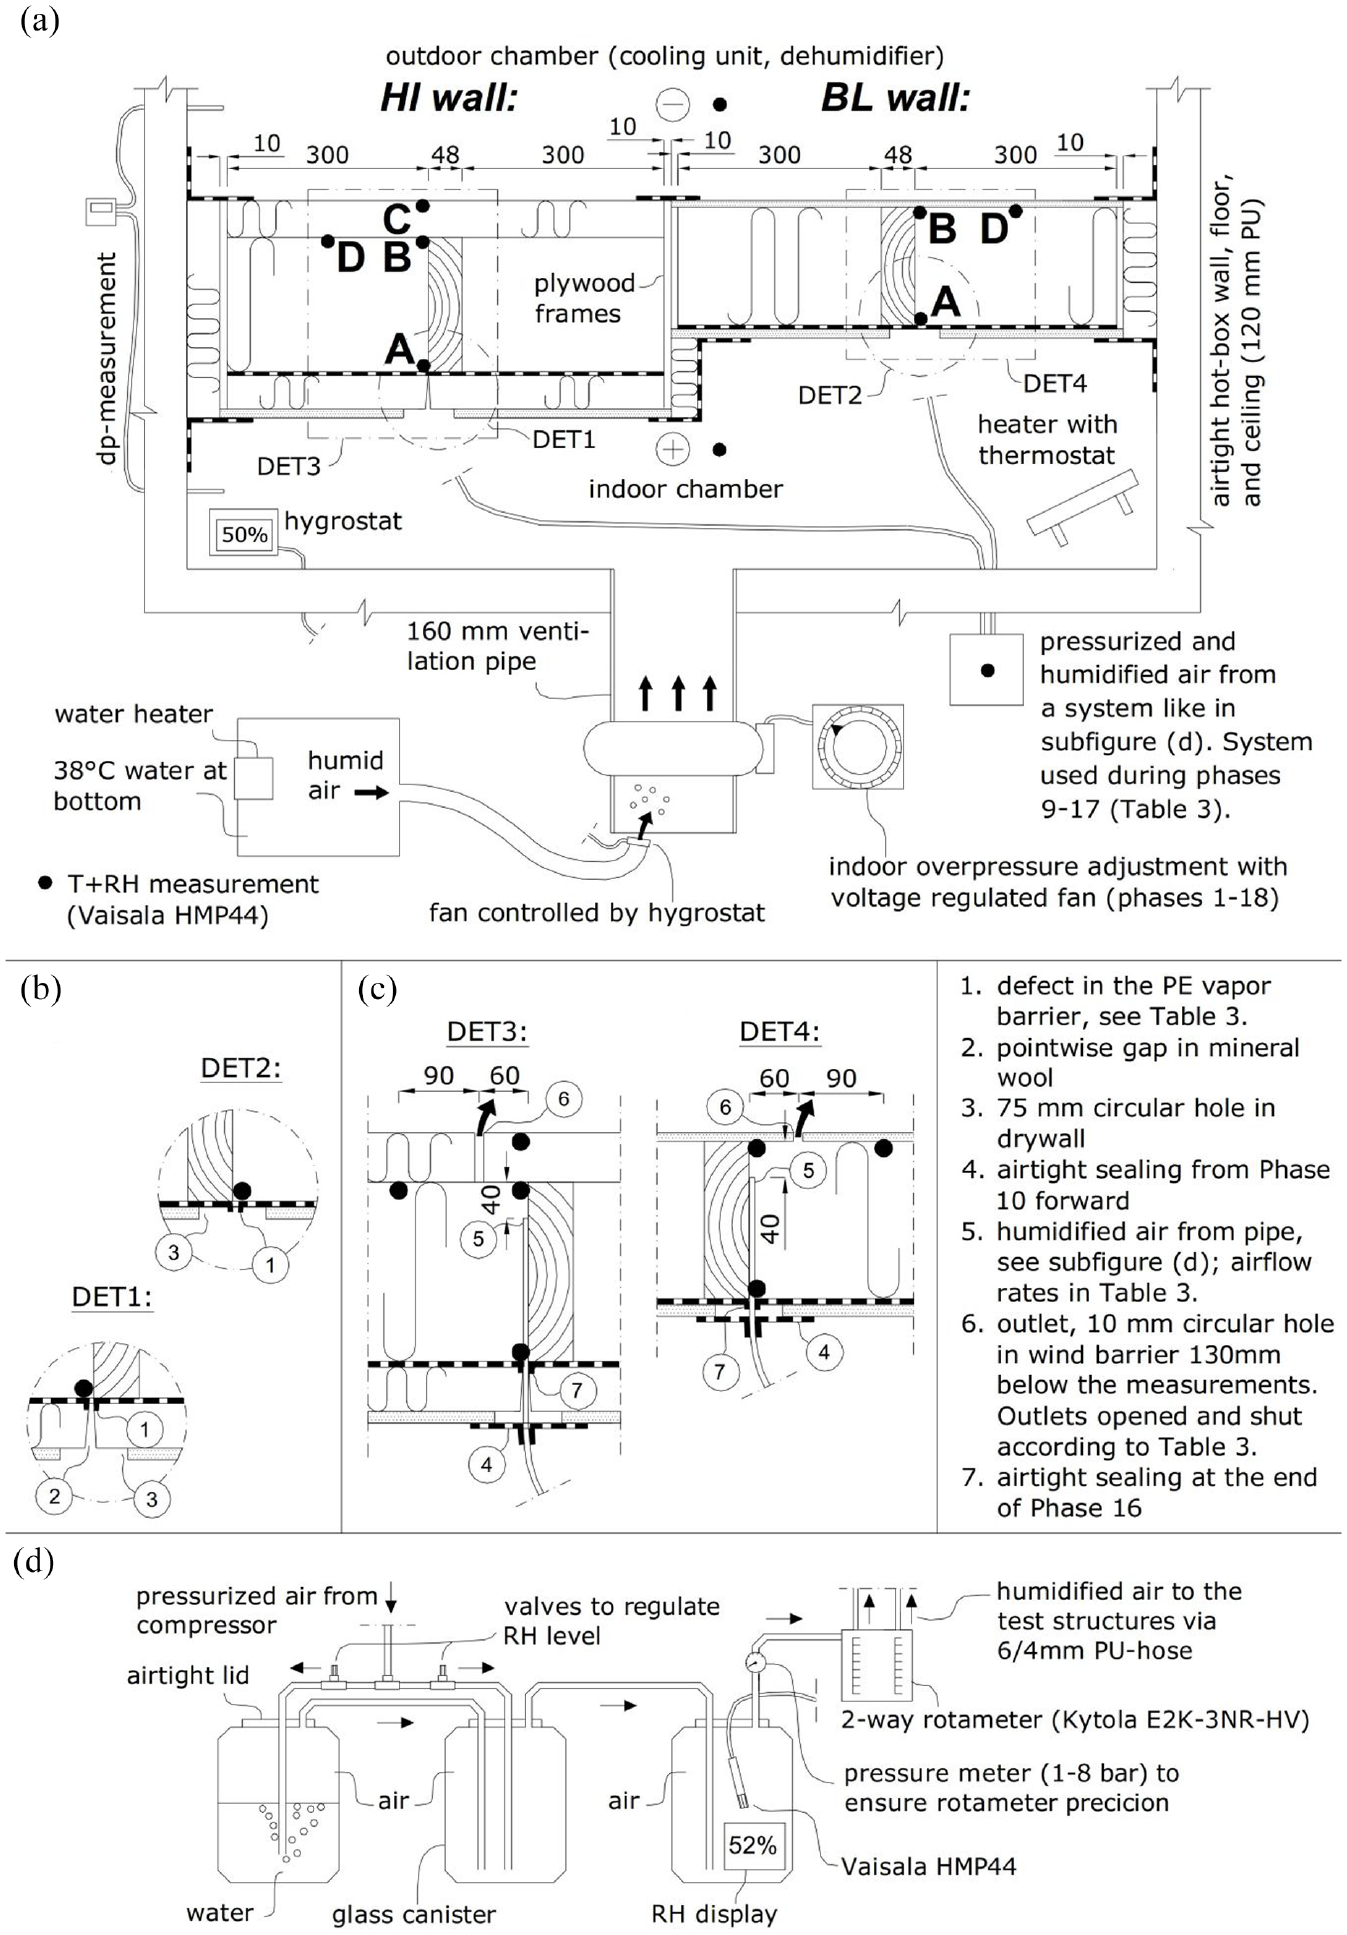
The setup for the MCON1 test: (a) the test walls were assembled into a hot-box,(b) DET1–2: defect setup in the interior side of the structures during passive convection,(c) DET3–4: assembly of the in-blow pipes during active convection and the positions of the airflow outlets, and (d) the setup to create humidified air during active convection.
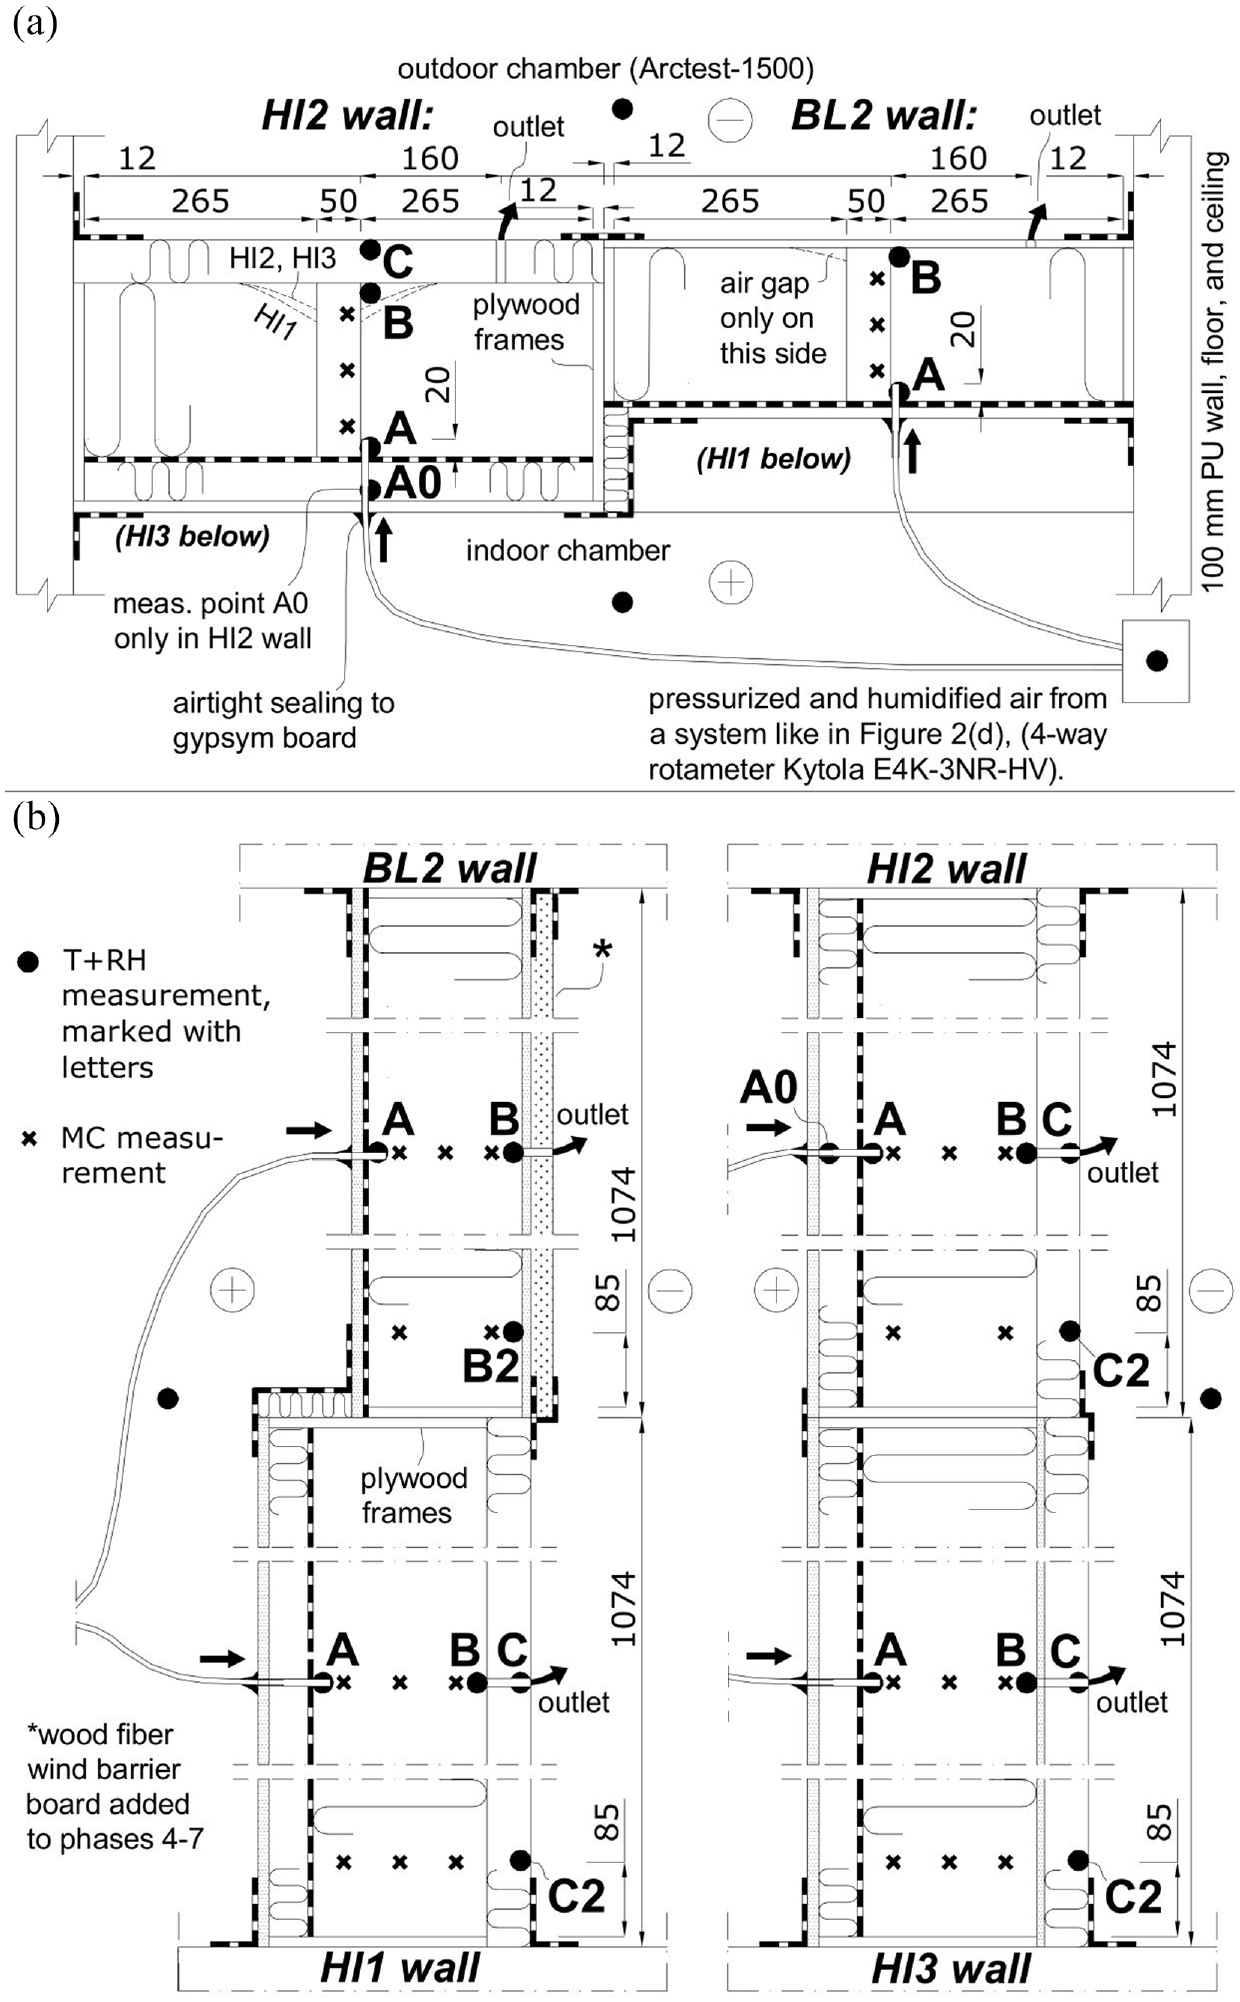
The setup and wall sections in the MCON2 test. All measuring points are located on the same plane: (a) horizontal section at middle height of the upper walls and (b) vertical sections of the four walls.
Description of the wood-framed wall assemblies studied
All the walls studied represented typical wood-framed external walls used in Finland. The 1.4-m high HI and BL walls considered in the MCON1 test were insulated with stone wool (SW) (Tables 1 and 2). The BL wall had an exterior gypsum sheathing (EGS) with low thermal resistance. The HI wall had a 55-mm-thick MW board as the only material outside the stud, which entails an exterior insulation approach (e.g. Trainor et al., 2016) and helps reduce cold bridges at the wall frame. In Finland, MW sheathings are typically used in residential buildings, whereas the EGS represents a more traditional type of sheathing that is used in several types of buildings. Even if the U-value for the BL wall, 0.23 W/m2K, is higher than the benchmark value for an external wall in Finland (0.17 W/m2K), it was included in this study to examine the effect of the different U-values on the performance of the walls.
The hygrothermal properties of the wall materials.
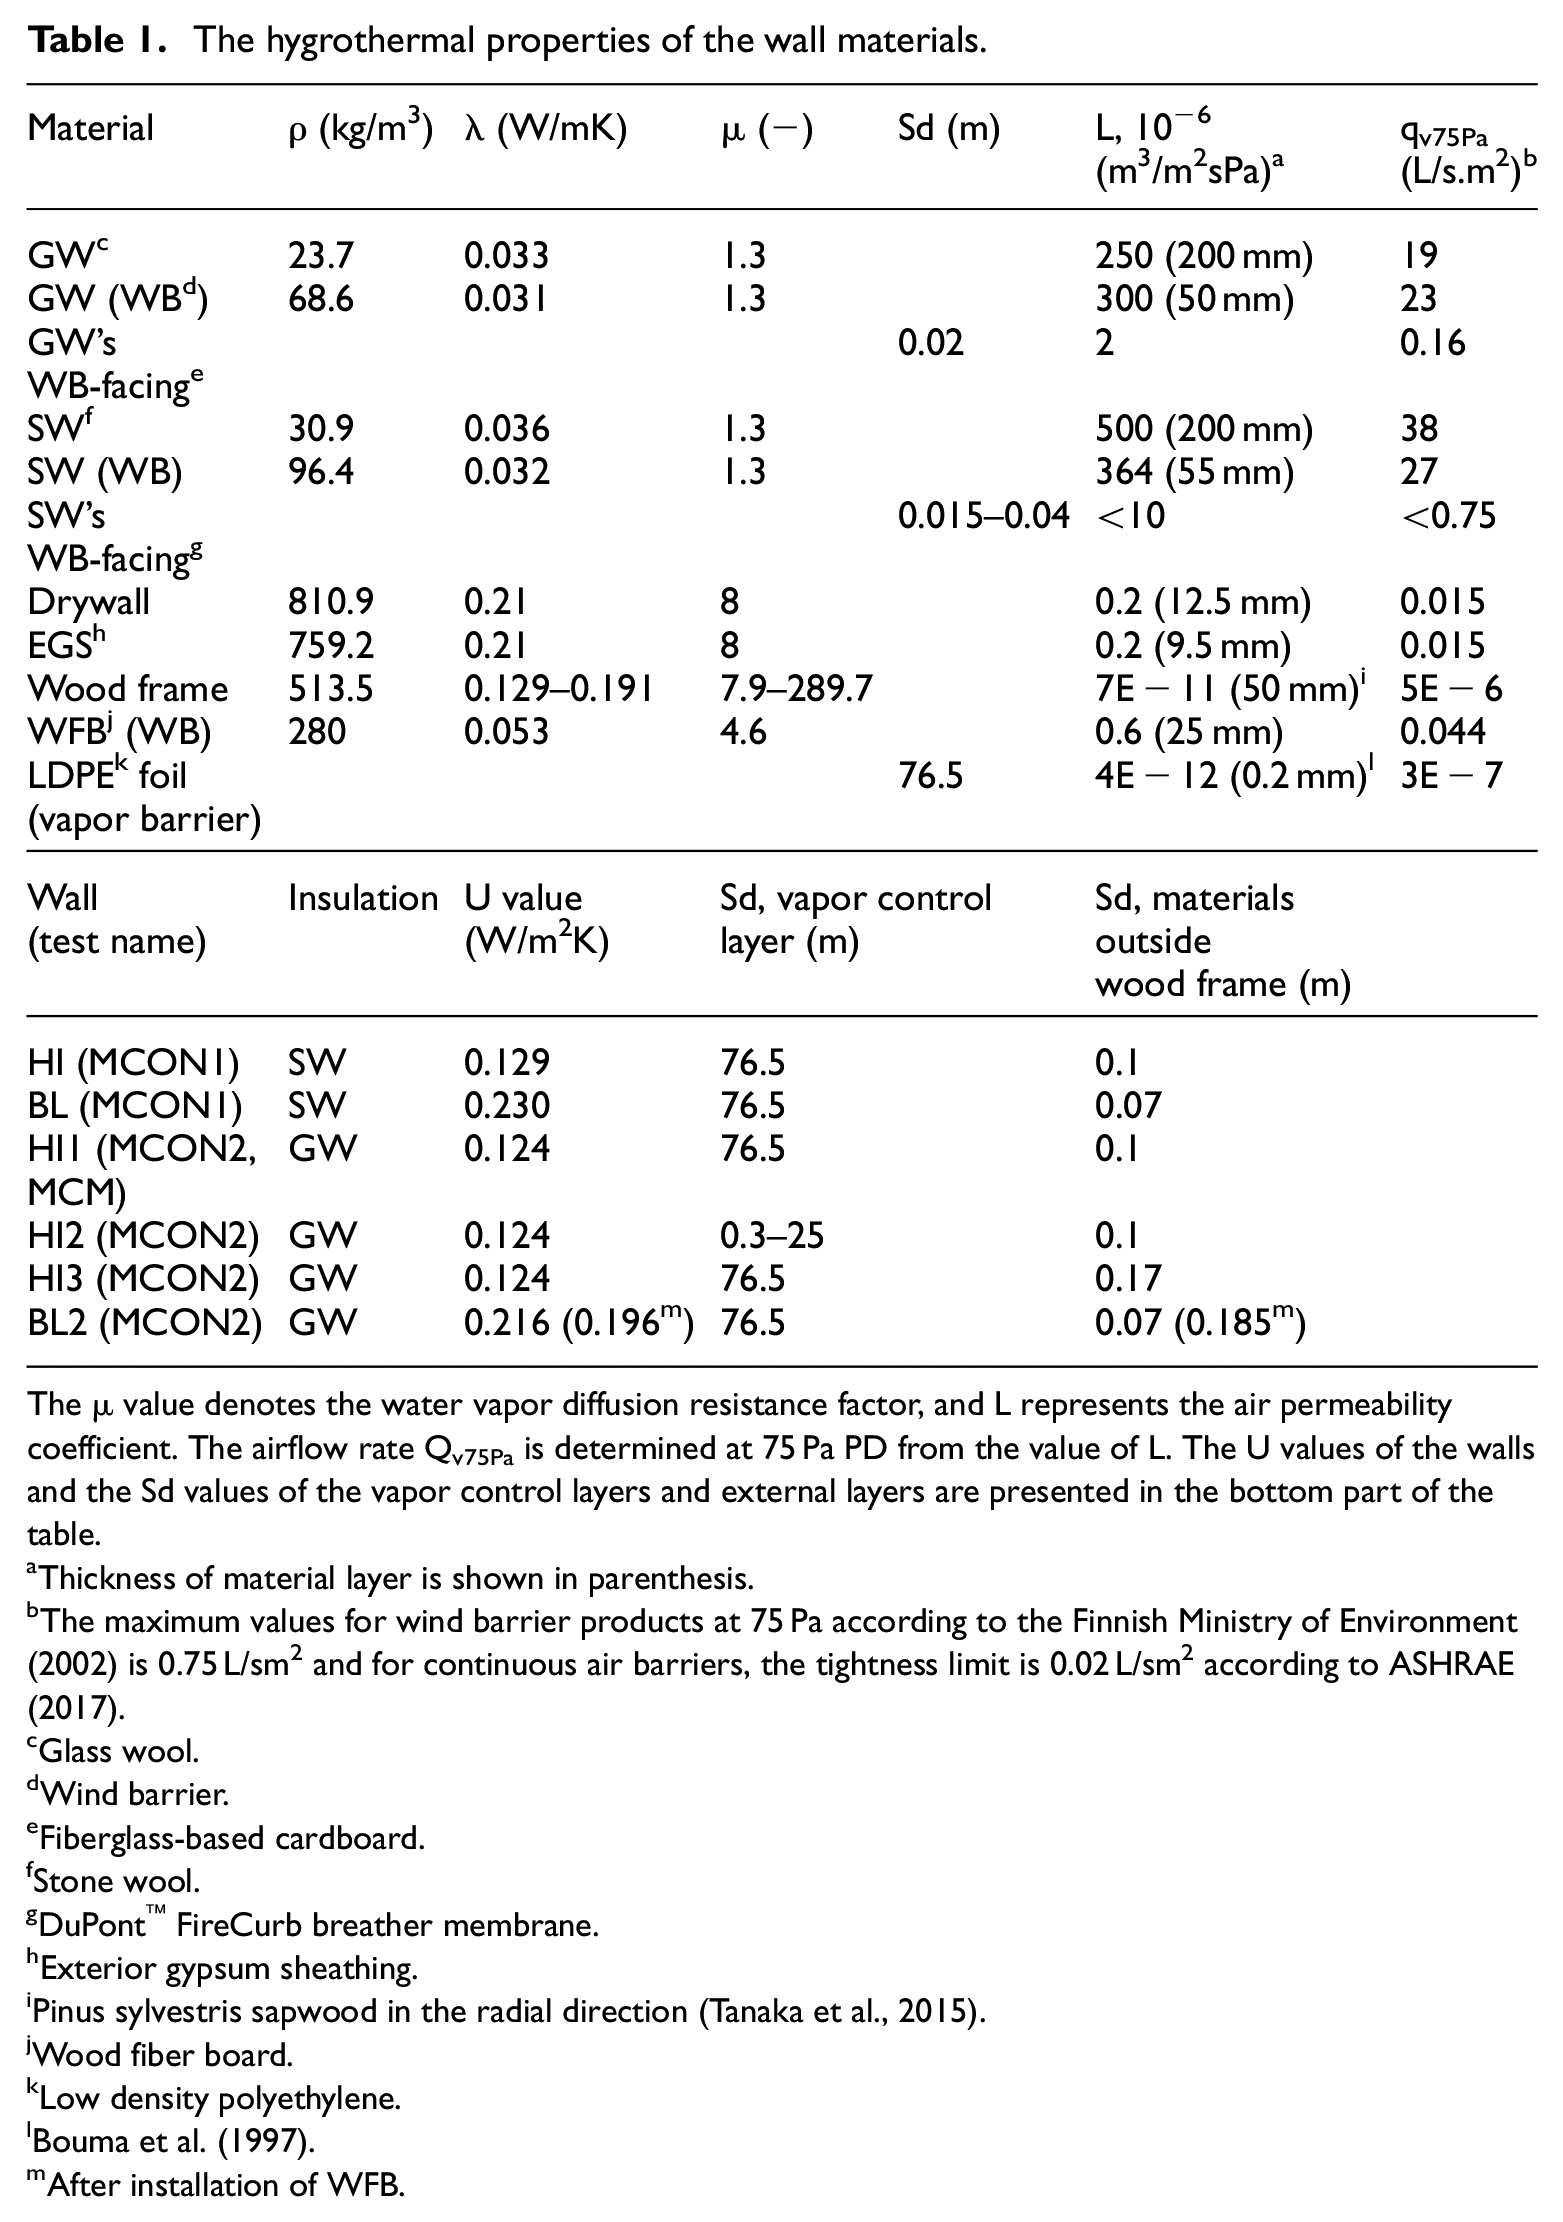
The μ value denotes the water vapor diffusion resistance factor, and L represents the air permeability coefficient. The airflow rate Qv75Pa is determined at 75 Pa PD from the value of L. The U values of the walls and the Sd values of the vapor control layers and external layers are presented in the bottom part of the table.
Thickness of material layer is shown in parenthesis.
The maximum values for wind barrier products at 75 Pa according to the Finnish Ministry of Environment (2002) is 0.75 L/sm2 and for continuous air barriers, the tightness limit is 0.02 L/sm2 according to ASHRAE (2017).
Glass wool.
Wind barrier.
Fiberglass-based cardboard.
Stone wool.
DuPont™ FireCurb breather membrane.
Exterior gypsum sheathing.
Pinus sylvestris sapwood in the radial direction (Tanaka et al., 2015).
Wood fiber board.
Low density polyethylene.
After installation of WFB.
Wall compositions listed from the outermost to the innermost layers in the MCON1, MCON2, and MCM tests (Table 1 presents which test includes the walls).
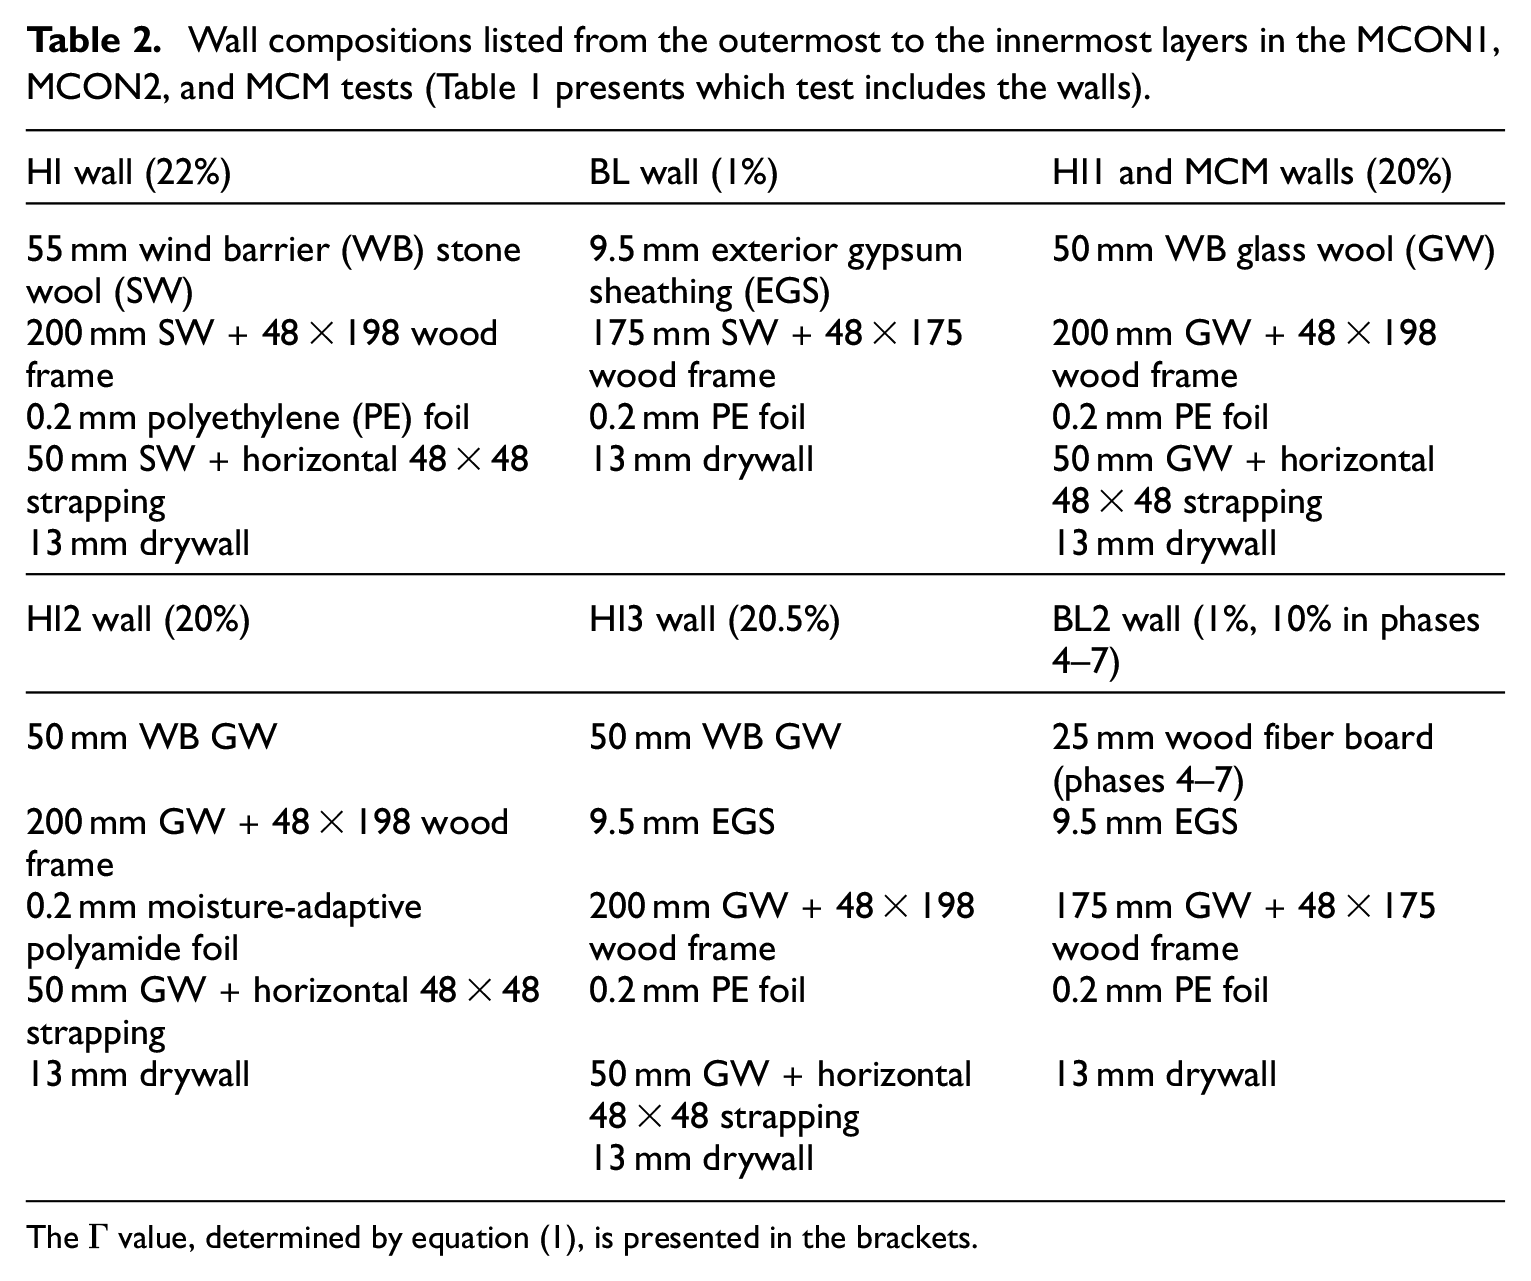
The Γ value, determined by equation (1), is presented in the brackets.
The HI1, HI2, HI3, and BL2 walls included in the MCON2 test were insulated with GW. The U-values of the HI1–HI3 walls and the BL2 wall were 0.12 and 0.22 W/m2K, respectively, corresponding to the values of the other tests (Table 1). The HI1 wall represented a typical exterior insulated HI wall with a polyethylene (PE) vapor barrier. The HI2 wall differed from the HI1 wall in terms of its moisture-adaptive vapor retarder, which was changed to polyamide (PA) to evaluate the impact of the simultaneous convection and diffusion of water vapor. The HI3 wall was similar to the HI1 wall except that it had an EGS under the exterior MW board to evaluate the impact of a higher Γ value on the performance of the EGS. The BL2 wall illustrated the possibility of improving the performance of a wall through increasing its Γ value by covering the EGS with a wood fiber board (WFB). All the EGSs used in the tests were exterior grade products and had a weather protection treated cardboard facing. Except for a larger size and the three vertical studs instead of a one, the test wall in the MCM test was similar to the HI1 wall. All the HI walls in the three tests, comprised interior horizontal strappings (Table 2) installed above and below the in-blow height. Such horizontal or vertical strapping is commonly used in Finland for electrical installations and to decrease the number of perforations in the vapor barrier.
The improper installation of soft thermal insulation materials may lead to vertical air gaps at the outer corners of the insulation. The probability of such failures increases with the thickness of the insulation layer of the wall. Proper installation can be ensured by installing the insulation before the exterior sheathing (Paroc Group Oy, 2019; Saint-Gobain Finland Oy/ISOVER, 2015). However, unintentional drilling into the insulation space (Desmarais et al., 2000) or different installation sequences may lead to unintended air gaps, which serve as a path for airflow (Forest, 1989). To assess the effects of such air cavities, the MCM test included two installation methods for the 200-mm-thick insulation. At first, the insulation filled the framing cavity completely, extending 1–10 mm over the cold side of the frames before the exterior sheathing was pressed firmly against the soft wool surface and the wall frame. In the second case, the outer surface of the 200-mm-thick insulation was curved inward at its vertical sides (Figure 1(a) and (d)). A circular outflow hole in the wind barrier (WB) board with a 10-mm diameter, the location of which was altered during the test (Figure 1(c)), was used with the both installation methods to study the impact of the outlet location on the airflow field and the hygric conditions.
The Sd values of the PA foil used were 25, 5, and 0.3 m if the average RHs affecting the foil were 26%, 60%, and 79%, respectively. The exterior Sd values of the walls were between 0.07 and 0.1 m (Table 1), and the value increased to 0.17 m for the EGS of the HI3 wall. Vapor permeable exterior insulation and sheathing boards with such Sd values have been used the most in Finnish lightweight walls. The MW products are lowly hygroscopic, as the equilibrium MC of, for example, stone-based MW at 85%–97% RH varies in the range of 0.25–0.5 kg/m3 (Viljanen and Lu, 2019) compared to that of wood fiber insulation, which is 14–35 kg/m3 in 66%–97% RH (Vololonirina et al., 2014). Among the MW products, GW has a higher hygroscopic capacity, 0.6–4.5 kg/m3 in 85%–97% RH, than SW (Viljanen and Lu, 2019). The flow rate of air through the structure and the flow field of the air inside the structure depend on the airtightness of the materials used (Table 1). The values of Table 1 indicate that the attenuation of the airflow inside the walls was the least for open-porous MW, while foils and sheathing boards increased it.
Moisture loading caused by the exfiltrating airflow
The maximum allowed value for an air leak through an assembly according to several standards and codes is 12 L/(min·m2), with a PD of 75 Pa across the structure (ASHRAE, 2017). As with a PD of 10 Pa and a flow exponent value of 0.75, this limit value corresponds to a rate of 2.6 L/(min·m2), the amount of air leakage used in the experiments was set at this level at most.
In the MCM test, a pipe with an inner diameter of 4 mm penetrated the vapor barrier of the test wall close to its wood frame while maintaining airtightness and represented a point defect in the vapor barrier (Figure 1(a)). Humidified indoor air (approx. 50% RH) was blown through the pipe at average rates of 1 and 2.5 L/min. Each in-blow phase with a different location for the air outflow lasted around 2 days, and the structure dried for the same period between the in-blow phases to minimize its wetting.
The first method employed to create air exfiltration in the MCON1 test is called passive convection, which included a variable PD across the test walls that causes air ingress into the warm sections of the walls depending on their airtightness. A small defect in the vapor barrier next to the wood frame served as a path into the wall (Table 3). In phases 1–5, the defect was a vertical cut of 10 mm (Figure 2(b)). Starting from the second phase, the indoor chamber was humidified. In the third phase, a fan was used to increase the PD over the wall to 5.5 Pa, and the dehumidification of the outdoor chamber was started. In the fourth phase, the indoor RH was raised to over 50%. In the fifth phase, the PD was raised to 10 Pa. In the sixth phase, the line cuts in the vapor barriers were enlarged to square holes of 1 × 1 cm. A circular outlet hole with a 10-mm diameter was also added to the EGS (Figure 2(c)) to decrease the airtightness of the board and promote airflow toward the outdoor air. The outlet hole that was located slightly to the side of Point B (Figure 2(c)) ensured that the air flowed over the surface of the exterior sheathing before leaving the wall. The exfiltration path used increased the moisture in the insulation space compared to the cases in which the outlet was located opposite to the inlet (Ojanen and Kumaran, 1995). In Phase 7, the PD and RH were lowered to 0.9 Pa and below 40%, respectively. In the eighth phase, the PD was raised to 10 Pa, and the facing of the exterior sheathing of the HI wall was impaired by a similar defect as that in the EGS, which had been sealed at this point.
The average conditions and modifications during the MCON1 test, where the essential changes are in bold, and the detailed descriptions in the phases are marked with an asterisk (*), are presented below the table.
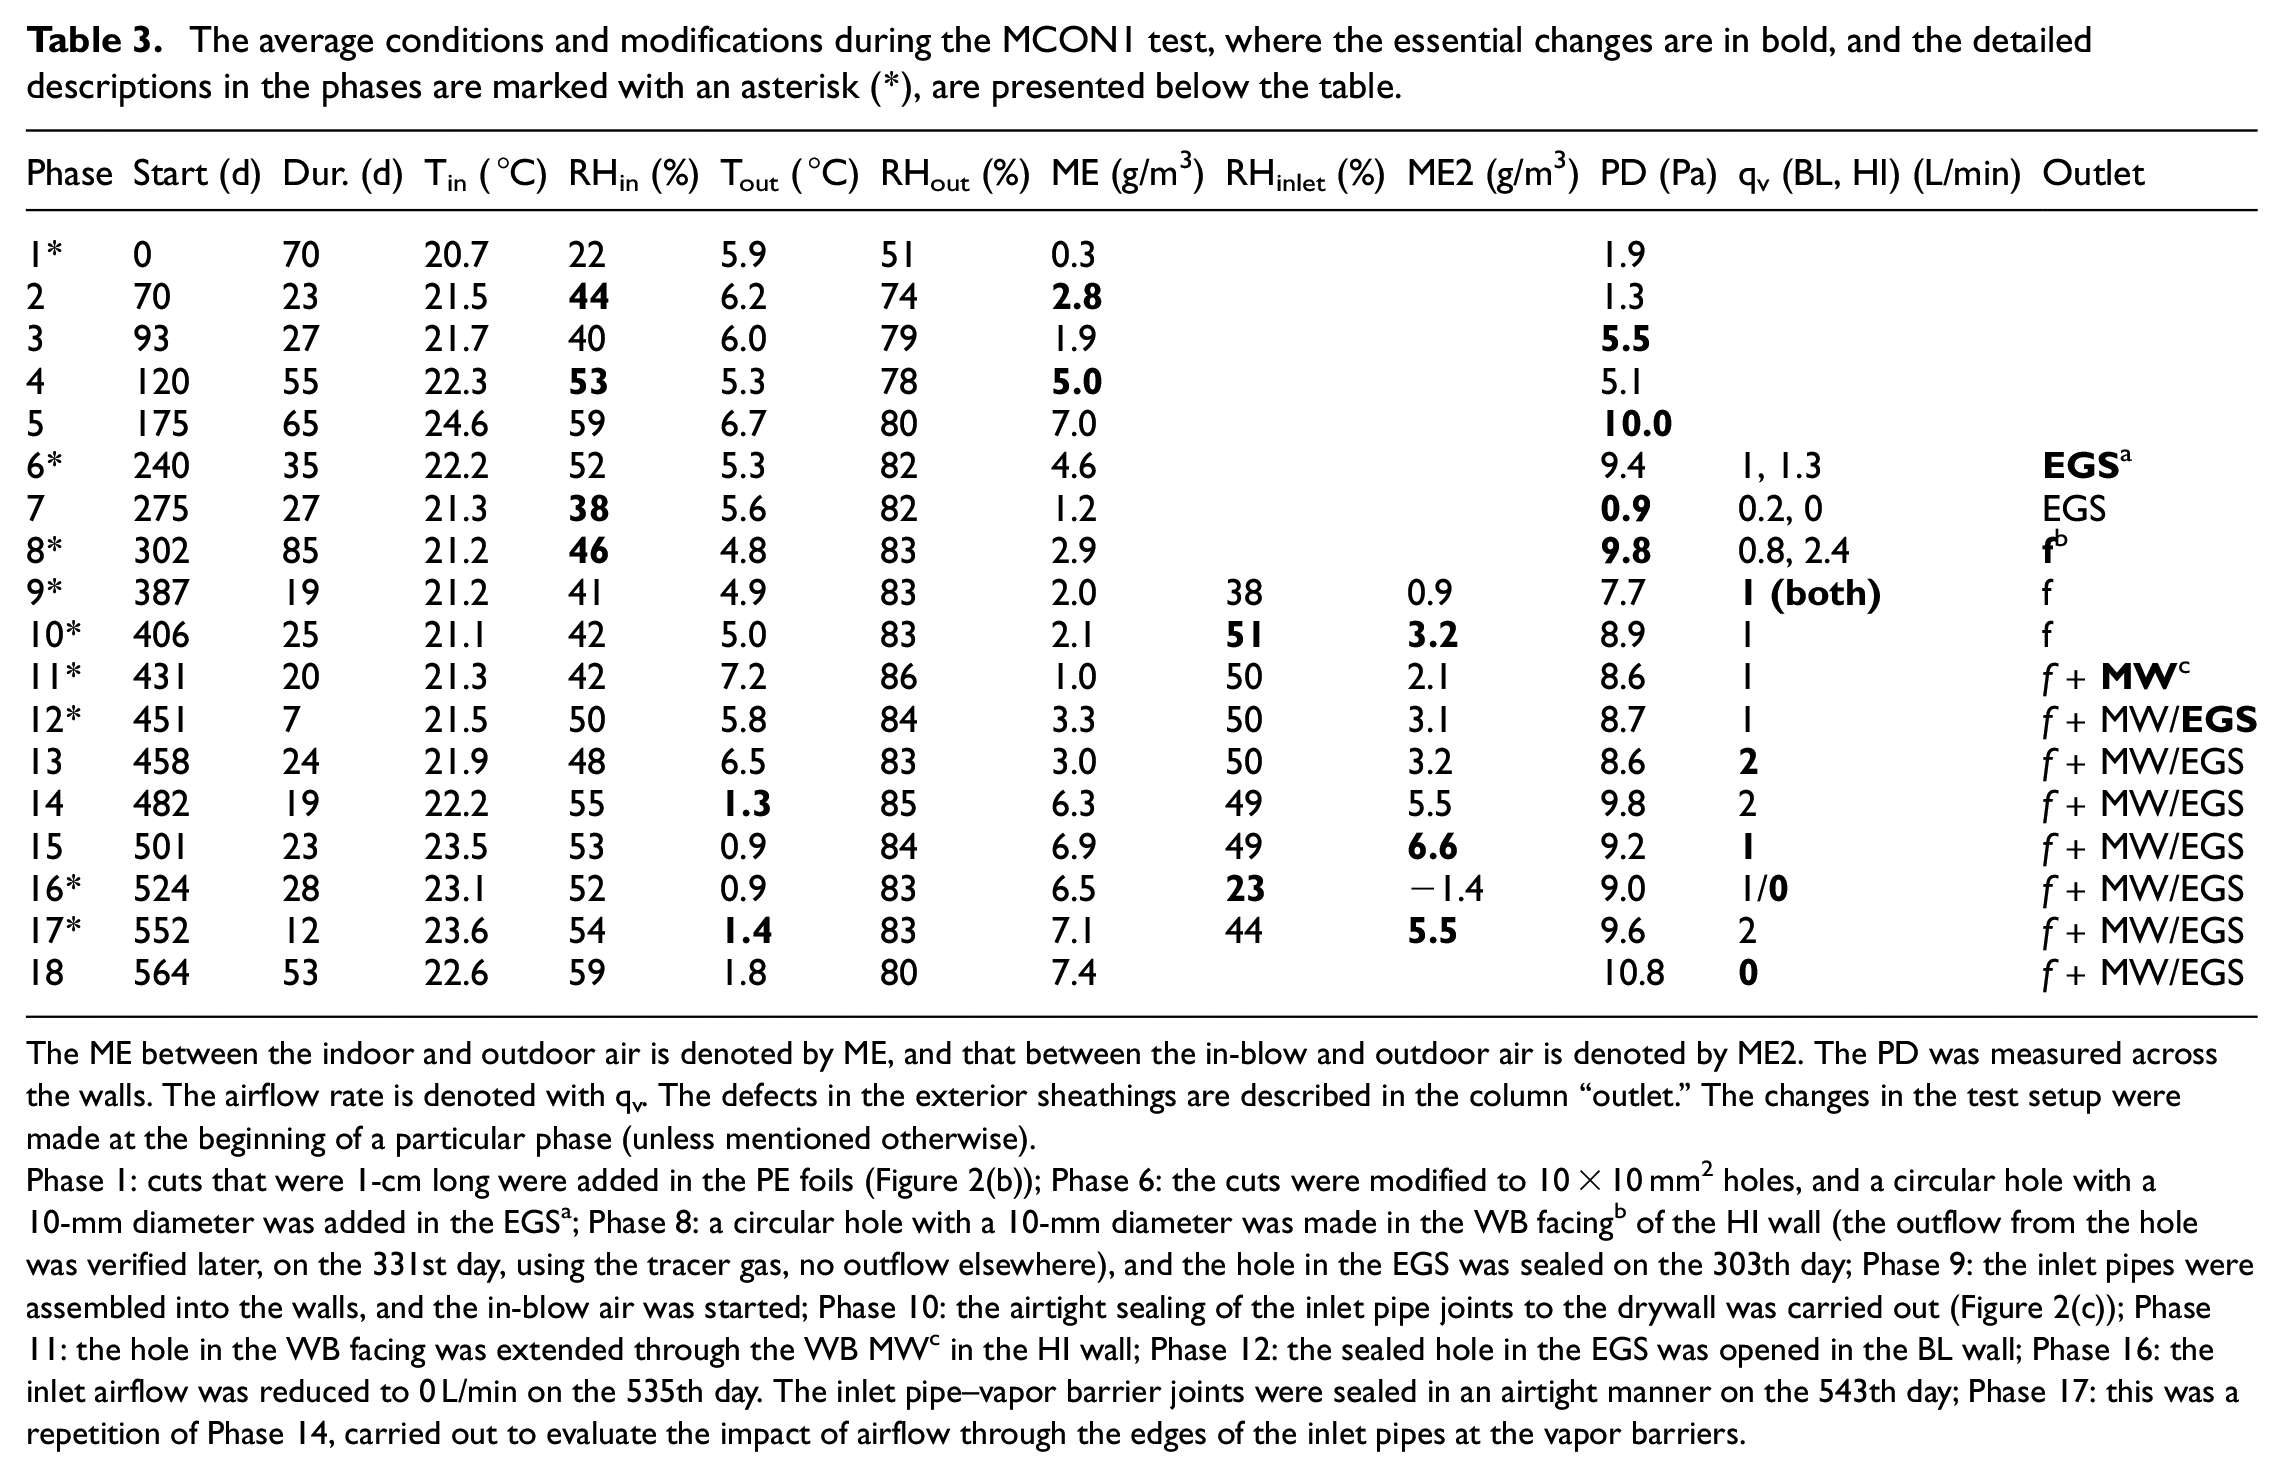
The ME between the indoor and outdoor air is denoted by ME, and that between the in-blow and outdoor air is denoted by ME2. The PD was measured across the walls. The airflow rate is denoted with qv. The defects in the exterior sheathings are described in the column “outlet.” The changes in the test setup were made at the beginning of a particular phase (unless mentioned otherwise).
Phase 1: cuts that were 1-cm long were added in the PE foils (Figure 2(b)); Phase 6: the cuts were modified to 10 × 10 mm2 holes, and a circular hole with a10-mm diameter was added in the EGSa; Phase 8: a circular hole with a 10-mm diameter was made in the WB facingb of the HI wall (the outflow from the hole was verified later, on the 331st day, using the tracer gas, no outflow elsewhere), and the hole in the EGS was sealed on the 303th day; Phase 9: the inlet pipes were assembled into the walls, and the in-blow air was started; Phase 10: the airtight sealing of the inlet pipe joints to the drywall was carried out (Figure 2(c)); Phase 11: the hole in the WB facing was extended through the WB MWc in the HI wall; Phase 12: the sealed hole in the EGS was opened in the BL wall; Phase 16: the inlet airflow was reduced to 0 L/min on the 535th day. The inlet pipe–vapor barrier joints were sealed in an airtight manner on the 543th day; Phase 17: this was a repetition of Phase 14, carried out to evaluate the impact of airflow through the edges of the inlet pipes at the vapor barriers.
The second method in the MCON1 test, which was similar to the approach used in the MCM test, is called active convection, in which humidified air (Figure 2(d)) was blown directly over the cold side of the walls (Figure 2(c)). This method was used for phases 9–16 and represented a situation in which the thermal insulation does not fill the framing cavity properly or fills it with low hygroscopic materials. These results were compared to those of the other tests in which the air in-blow was directed to the warm sections of the walls. A precise amount of airflow (Table 3) was provided using a rotameter, whereas, with passive convection, the predetermined flow rates could change, for example, if the walls were moved excessively. Another benefit of this approach was that the temperature and RH of the inlet air could be controlled and measured directly, while a variation in the indoor conditions could cause small errors when the previous method was used. Further, the closed humidification system also made it possible to monitor the amount of moisture transferred into the test walls.
In addition to the in-blow method, the factors studied were the defects in the exterior sheathing, the level of indoor humidity, the exfiltration rate, and the outdoor temperature. The PD over the walls was maintained at 8–10 Pa during the active convection phases. In Phase 10, the ME in the inlet air was increased to 3.2 g/m3. In the 11th phase, the hole in the facing was extended through the exterior wool board. In Phase 12, the outlet hole in the BL wall was reopened. In Phase 13 and 14, the in-blow rate was raised to 2 L/min, and the ME was 3.2 or 5.5 g/m3, respectively. In Phase 14, the outdoor temperature was lowered to 1°C, while in Phase 15, the in-blow rate was lowered to 1 L/min, and the ME increased to 6.6 g/m3. The walls dried during Phase 16. Furthermore, Phase 14 was repeated as Phase 17 to evaluate the impact of airflow through the gap between the inlet pipe and the vapor barrier (Appendix 2). In Phase 18, the air in-blow was stopped to allow the walls to dry, after which the structures were opened for a visual inspection and MC measurements (Gann hydromette HT 75). The air leakage rates directed to the wall areas of 1 m2 during phases 1–17 were set to a maximum value of 2.4 L/min to cover typical pressure conditions across the building envelope and were below 7.3–18.9 L/min used by Ge et al. (2019), Kalamees and Kurnitski (2010), and Langmans et al. (2012). The lateral dimensions of the walls favored a concentrated air leakage and low airflow rates.
The convection load in the MCON2 test was also achieved through the active convection method. The RH level in the in-blow air was 50%. The air leakage rates (Table 4) were similar to those used in the MCON1 test. The in-blow pipes were inserted through small holes in the vapor barriers to establish a tight contact between the materials. The inlet pipes penetrated 20 mm into the framing cavity (Figure 3), and thus, the introduction of moisture into the wall corresponded with the air ingress through a leaky air barrier.
The average conditions and modifications during the MCON2 test, where the essential changes are written in bold and the detailed descriptions in phases are marked with an asterisk (*), are presented below the table.
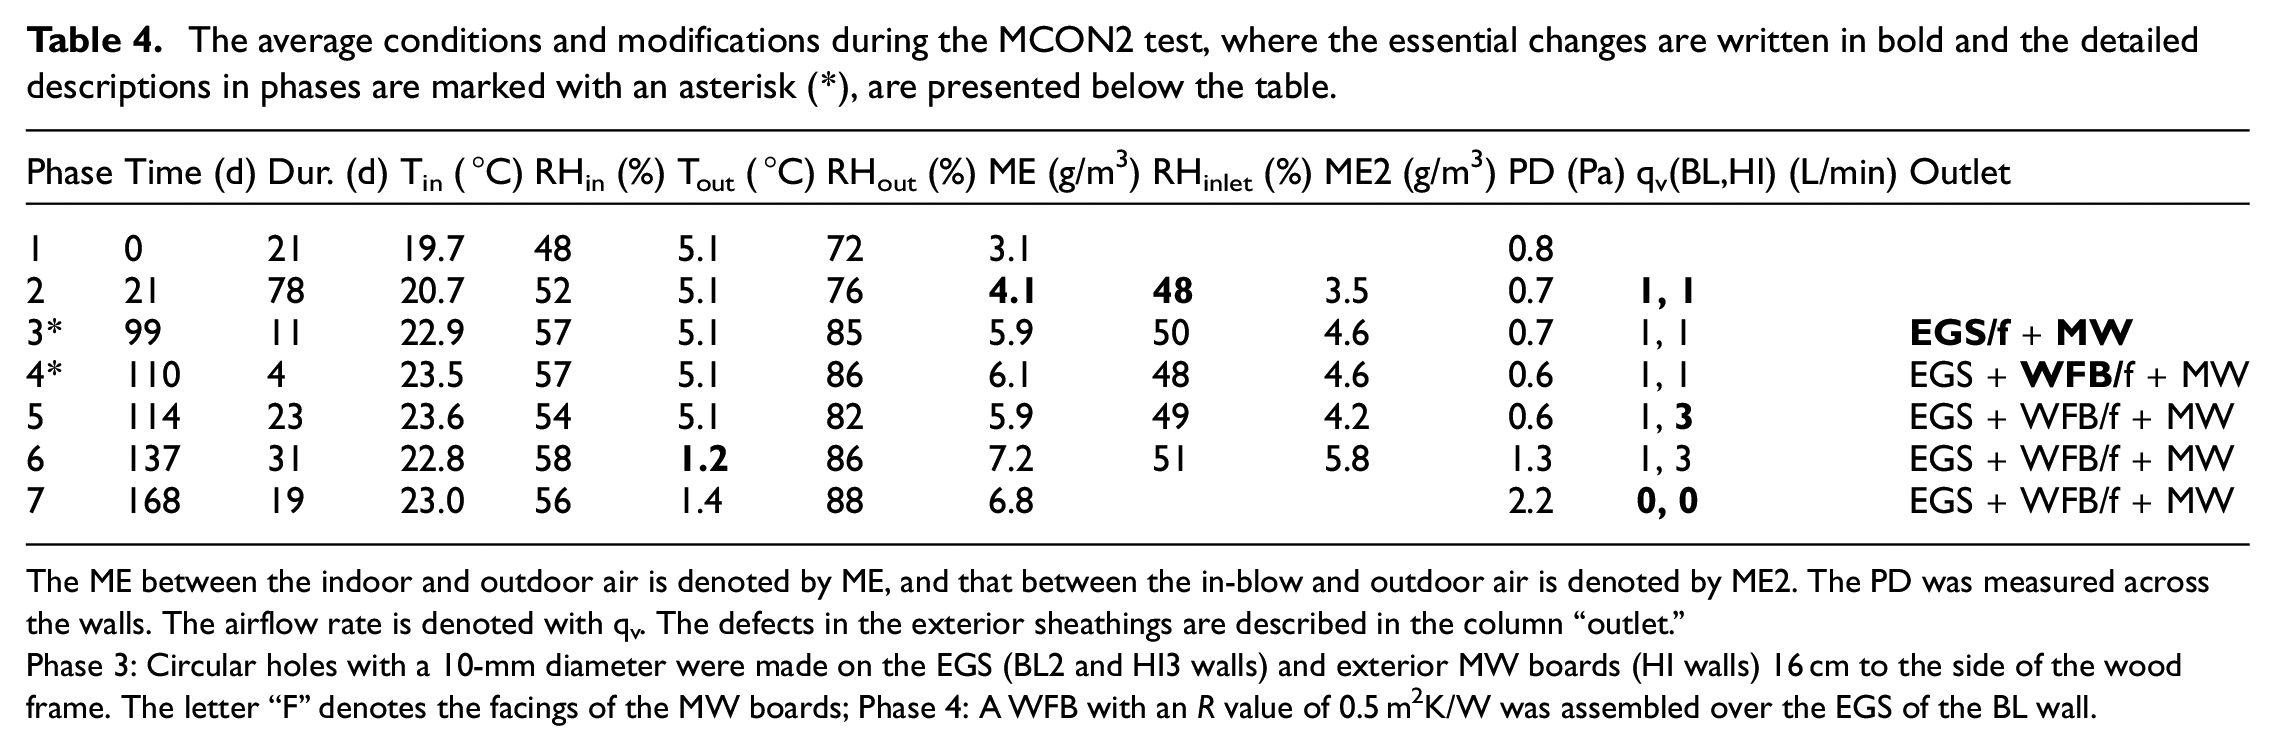
The ME between the indoor and outdoor air is denoted by ME, and that between the in-blow and outdoor air is denoted by ME2. The PD was measured across the walls. The airflow rate is denoted with qv. The defects in the exterior sheathings are described in the column “outlet.”
Phase 3: Circular holes with a 10-mm diameter were made on the EGS (BL2 and HI3 walls) and exterior MW boards (HI walls) 16 cm to the side of the wood frame. The letter “F” denotes the facings of the MW boards; Phase 4: A WFB with an R value of 0.5 m2K/W was assembled over the EGS of the BL wall.
The MCON2 test was divided into seven phases (Table 4). The first phase represented moisture transfer by diffusion only. The in-blow of air began in the second phase, with a flow rate of 1 L/min. In the third phase, outlet holes were added to the exterior part of the walls (Figure 3) to create controlled exfiltration paths, which were verified by the tests using the tracer gas. In the fourth phase, the WFB was installed in the BL2 wall, while, in the fifth phase, the airflow rate was tripled to 3 L/min in the HI walls. In the sixth phase, the outdoor temperature was lowered from 5.1 to 1.2°C. In the seventh phase, the drying phase was started by closing the in-blow pipes. Finally, the structures were opened for a visual inspection and to carry out additional MC measurements.
Environmental conditions in the tests
In previous experimental studies on exfiltration, outdoor temperatures below and over 0°C has been used. The MCM test wall (Tables 1 and 2) was assembled in front of a weather room, where the outdoor temperature was maintained at a low level of around 1.5°C to enhance the moisture accumulation in the veneer pieces (Appendix 1) while still allowing their rapid drying during the test. Employing outdoor temperatures of below zero may have prevented such drying of the veneer pieces (Forest, 1989). The outdoor RH was maintained between 75% and 85% with a dehumidifier (Wilfa WDH20) controlled by a separate hygrostat (Trotec BH30). The indoor chamber was chilled with an air conditioner (Electrolux EXP34U338CW) and humidified (target level 50% RH) using the system described in Figure 2(a).
The outdoor temperatures in the MCON1 and MCON2 tests were between 0.9 and 7.2°C (Table 3) and 1.2–5.1°C (Table 4), respectively. The lowered outdoor temperature during the subsequent part of the tests worsened the thermal conditions in the walls. This range of outdoor temperatures corresponds to typical temperatures in Finland, as the average annual outdoor temperatures during the years 2010–2019 in Southern Finland (Espoo), central Finland (Jyväskylä), and Northern Finland (Pudasjärvi) were 6.5, 4.7, and 2.5°C, respectively (Finnish Meteorological Institute, 2019). The outdoor temperature was maintained at over zero degrees to prevent ice formation inside the walls, which could have prevented moisture adsorption (Desmarais et al., 2000). Temperatures of above zero also allow for mold growth on wooden materials (Hukka and Viitanen, 1999). Although subzero outdoor temperatures induce higher moisture accumulation from air leakages, such temperatures may not be crucial regarding mold growth in the long term, as HI walls that transmit vapor outward dry quickly when the outdoor temperature is above zero (e.g. Viljanen and Lu, 2019). Temperatures of 25–30°C promote the fastest growth rate of various mold fungi (Sedlbauer, 2001) but prevent the emergence of high RH levels in the exterior parts of walls subjected to exfiltration. As the outdoor temperatures of 1–5°C in Espoo, Jyväskylä, and Pudasjärvi, are linked to outdoor RHs 75%–90%, 65%–95%, and 70%–90%, respectively, the dehumidification in the outdoor chamber in the MCON1 test was set to 80% RH. The outdoor chamber in the MCON2 test was not dehumified. Solar irradiance, which can decrease exfiltration-related moisture risks in south-facing facades (Forest, 1989; Fox, 2014), was excluded in the tests. As solar irradiance is negligible in Finland during the cold season (e.g. Viljanen et al., 2021), the results associated with cold weather are applicable for all the directions of the facade.
In the indoor climate chamber of the MCON1 test, the hygrostat (Trotec BH-30), whose setpoint for RH was between 40% and 60%, controlled the humidification fan without affecting the measured PD across the walls (Figure 2). The indoor RH was arranged similarly in the MCON2 test, but the indoor air was not pressurized. The indoor air was humidified to minimize its drying effect and to increase the outward moisture diffusion in the HI2 wall. The indoor temperature was controlled by radiators and was set to 21°C, which is a typical value for residential buildings in Finland.
Results
Results from the MCM test
Environmental conditions measured and general remarks
The temperature and RH of the in-blow and outdoor air were, on average, 22°C and 48.2% and 1.5°C and 82.2%, respectively (Figure 4(a)). The ME was about 4.9 g/m3 between the in-blow and outdoor air matching with the design values of the ME for hygrothermal design of 4 g/m3 (Kalamees et al., 2006) and 5 g/m3 (Finnish Association of Civil Engineers, 2012). The lower value of the ME represents maximum moisture supply in Finnish lightweight detached houses with an annual non-exceedance probability of 90% (recommended by ASHRAE (2016)), whereas the higher value that represents current Finnish guidelines is even more on the safe side as a design criterion. The ME measured was clearly greater than 1.8 g/m3, which is a typical value for Finnish timber-frame detached houses in the cold season (Kalamees et al., 2006).
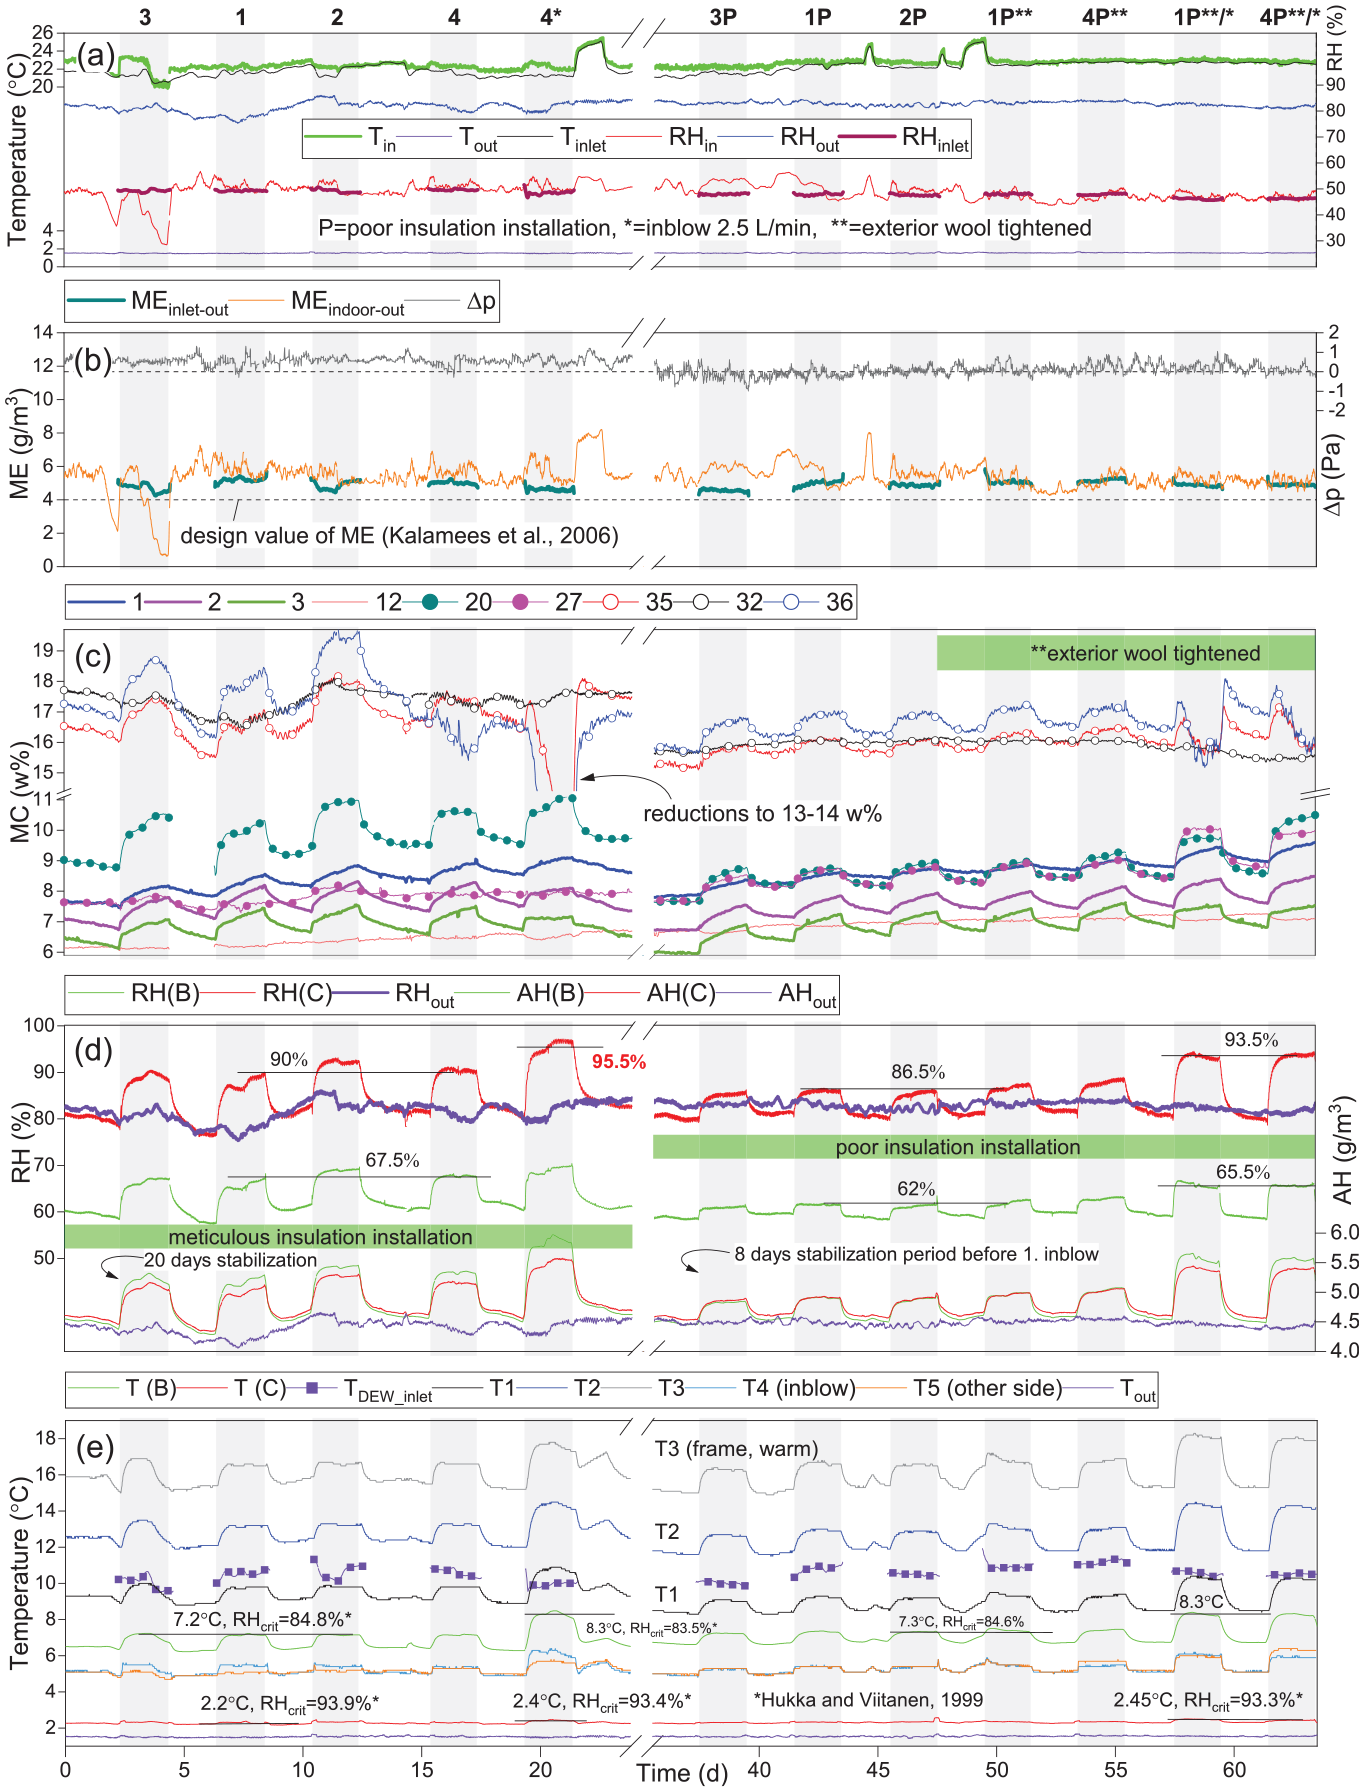
(a, b) The environmental conditions in the indoor and outdoor chambers during the MCM test, (c) the MC in the frame and in the exterior insulation (dotted lines), (d) RH and AH at Point B and C and in the outdoor air, (e) temperature in the frame, at Point B and C, on the warm face of the exterior wool, and in the outdoor air; the air in-blow phases at the top are named with the corresponding outlet number (e.g. Three denotes the air in-blow phase during which Outlet 3 was open).
The measured MC levels were analyzed together with the absolute change in the MCs. The latter was calculated by comparing the instantaneous MC values during the in-blow phases to the average MC at the start of each phase and 3.3 h before it (average of 10 values). During the 2-day-long in-blow phases, steady state hygrothermal conditions were reasonably reached (Figure 4(d) and (e)), and the results could be used to evaluate the long-term effects of these conditions.
Areas influenced by point defects
The MC changes in the stud were the highest at points 1–9 (Appendix 2, Figure A1) for the outlet locations 1, 2, and 4 (Figure 1(c)), underlining the outward direction of the moisture and airflow. In addition, the accumulation of moisture was observed mostly in an area extending 0.2 m (or slightly more) downward from the in-blow height (Appendix 2, Figure A1). The increase in MC in the wood frame was highest at the in-blow height and decreased to zero toward the bottom of the frame. A typical increase of 0.6 wt% in the MC of the frame surface during a single load phase corresponded to only 2% of the amount of the moisture blown into the wall if Point B is used as an observation point in equation (3). Most of the humidity transferred toward Point C, where, as equation (5) indicates, the outward drying by diffusion corresponded to 78% of the input humidity. A semicircular area of the warm side of the exterior sheathing (points 16, 17, 19, 20, and 23) with a diameter of 0.2–0.3 m was affected the most by the air leakage (Appendix 2, Figure A2). Considering the vapor openness of the sheathing, the area affected was likely the same size on the cold side of the sheathing, although the number of measurement points for the same was smaller (Figure 5). Thus, the remaining 20% of the input humidity adsorbed into a half-cylinder-shaped part of the exterior wool with a diameter of 0.2 m based on the average RH increase at Points B and C and accounting for the sorption isotherm of rigid GW (Viljanen and Lu, 2019). The adsorption of humidity into the soft MW was low, as the slope of the sorption isotherm is zero when the RH is 58%–75% (Figure 4(d)). The local moisture accumulation on the cold side of the structure that is opposite to the leakage position is consistent with the results obtained by Derome (2005), Forest (1989), and Lam (1996).
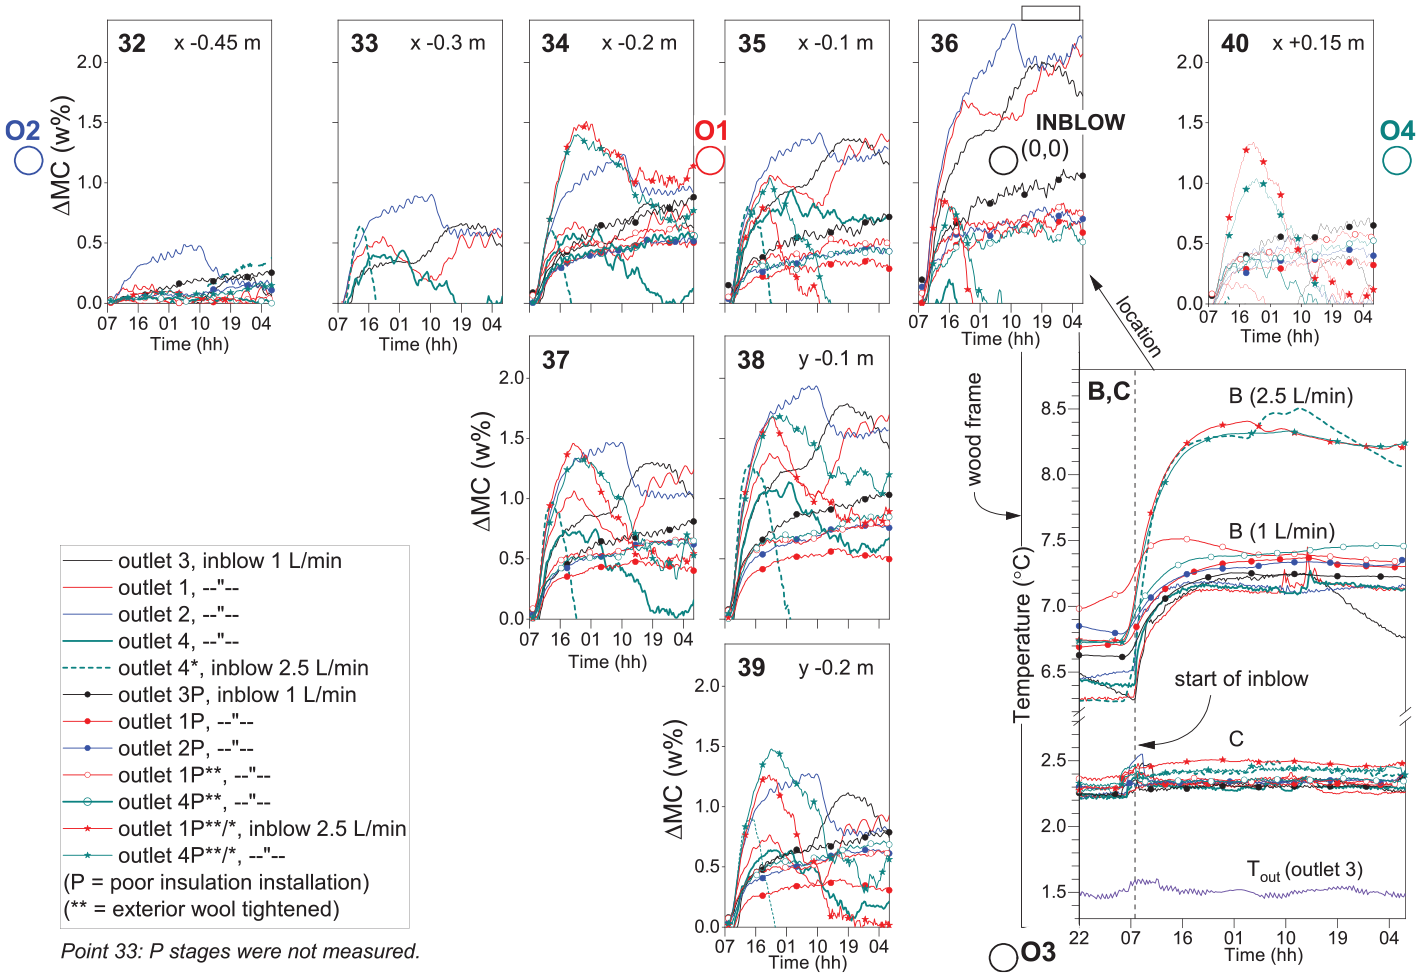
The absolute change in the MCs on the warm side of the facing of the MW sheathing during the in-blow phases of the MCM test. The temperatures at Point B and C also include the period before the in-blow. The numeric values indicate the location of the measurement points relative to the origin located at the in-blow.
Impact of outlet location on moisture accumulation
During the outflow from Outlet 3, the highest MC increase in the frame was observed at points 6, 8, 9, 10, 11, and 13, indicating that the air and moisture flows turned downward. However, the flow still affected the MCs in the exterior board but slightly less as compared to the MCs when Outlet 2 was used. Similarly, the MC changes in the exterior board and RHs at Points B and C (Figure 4(d)) for Outlet 1 were slightly below the values measured for Outlet 2, which suggests that having an outlet closer to the inlet location increased the outflow of humidity from the structure. The results show that having an outflow located far away from the inflow position leads to the highest level of moisture accumulation in the studied assembly, as observed by Ojanen and Kumaran (1995) with BL walls. The least amount of accumulated moisture can be expected when the outlets are located directly opposite to the interior leakage point. Based on the results of Ojanen and Kumaran (1995), the impact of the outflow location on the moisture accumulation is even greater in structures that have low Γ values. In the phase where Outlet 4 was open, the MCs did not increase near the outlet, and the tracer gas measurement implied weak outflow (10 ppm), indicating that the airflow had no direct route to the adjacent framing cavity.
Impact of insulation installation and heat convection
With careful insulation installation, the RH on the warm side of the exterior MW board was 67.5% on average during the convection loading phases, which was not greatly affected by increasing the in-blow rate. With imperfect insulation installation, the air gaps spread the exfiltrating air vertically, thus decreasing the rise of RH at Point B to only 62% regardless of the outflow position. Similarly, the RH, on average, decreased from 90% to 86.5% at Point C. The increased spread of humidity also explained the MC changes in the exterior wool (Figures 4(c) and 5; Appendix 2, Figure A2). On the cold side of the exterior sheathing, the distribution of the MC changes, which was previously decreasing in the lateral direction, stabilized between points 34 and 39 (Figure 5). Based on the results at points 18 and 21, and the fact that the air cavity extended to points 16, 19, and 22 (Appendix 2, Figure A2), the stabilization of the MCs was found to be limited by the boundaries of the air gap. At Point B, the RH was well below the RH threshold for mold growth regardless of the insulation installation; but at Point C, the conditions were almost the same as the critical RH (Figure 4(d) and (e)). Furthermore, regardless of the insulation installation method, the in-blow rate of 2.5 L/min increased the RH at Point C above the threshold value of mold growth, which indicates that Point C was sensitive to air leakage.
The higher MC changes at points 27–30 and 40 in the case of an imperfect insulation installation suggested that the contact between the exterior wool and the frame was less airtight than before (Figure 5; Appendix 2, Figure A2). The re-tightening of the fasteners of the exterior wool in Phase 1P** did not affect the MC changes, which were more sensitive to the method of installation used for the cavity insulation. The contact between the exterior wool and the frame was measured after the entire test using feeler gauges (0.1–1 mm) that were placed between the said materials. The most air-open route between the two framing cavities was located 13–30 cm below the in-blow height, as a 0.6-mm-thick feeler gauge fit between the sheathing and the frame only at this spot, where the distance between the sheathing fasteners (0.7 m) was longest. The vertical air gaps allowed the air to flow into the adjacent framing cavity through the least airproof contact area, highlighting the importance to install cavity insulation properly to prevent exfiltration. In addition, the use of a fastener spacing of 0.3–0.4 m is recommended, which allowed a gap of only 0.1–0.2 mm between the materials instead of the typical 0.4–0.6 m spacing (Paroc Group Oy, 2019; Saint-Gobain Finland Oy/ISOVER, 2021).
Outside the facing of the MW sheathing, the test wall did not include vertical ventilation strapping, which typically uses 22 × 100 mm wood boards and extends 25 mm from the side of the wall frame. Covering 16% of the membrane on the inlet side of the wall with such boards may affect the drying ability of the wall in a semicircular area, with a radius of 0.2 m, located opposite to the inlet position. This may also be true for the air-sealing paste (Sd value 13 m) used at the measurement points 34–39, which covered 40% of this area. However, the drying ability remains virtually unaffected due to the low Sd value of 0.02 m of the membrane and the water vapor diffusion resistance factor of 1.3 of the MW.
The temperature at Point B increased by approximately 0.75 and 2°C for the airflow rates of 1 and 2.5 L/min, respectively (Figure 5). This increase in temperature compensated for the impact of the higher in-blow rate on the RH at Point B. With an improper insulation installation, the temperature increases were 0.6 and 1.6°C, respectively, which indicates more effective convective heat transfer. At Point C, the temperature changes were of 0.15–0.2°C, with airflows of 2.5 L/min. The calculated heat flux by conduction from Point B to Point C was equal to the combined convective and radiative heat fluxes on the outer surface of the wall, which indicates that convection was not involved in the heat transfer through the exterior wool, and, thus, the air flowed laterally over the warm face of the exterior wool. With a poor insulation installation, the temperature at Point B during the drying phases was 0.3°C higher than that obtained with proper insulation, which explains a local increase of 6% in the calculated heat flux close to the stud.
The initial MC increase observed during the phases with a 1-L/min in-blow rate decreased rapidly at Point 36 in the phases with an in-blow rate of 2.5 L/min (Figure 5). Further, the timing of this coincided with the temperature increase at points B and T1 (Figures 4(e) and 5). At Point T1, the temperature rose to become close to or more than the dew point of the leakage air, which illustrates the connection between an increase in the exterior temperatures and a reduction in the moisture accumulation behind the facing of the MW sheathing opposite to the leakage point. This effect is restricted to a circular area with a radius of 0.1 m in the case of a poor insulation installation; but in the case of proper installation, the radius was 0.3 m (Point 33 and 39), as the convective heat transfer was smaller.
Results from the MCON1 test
Environmental conditions measured and insulation installation
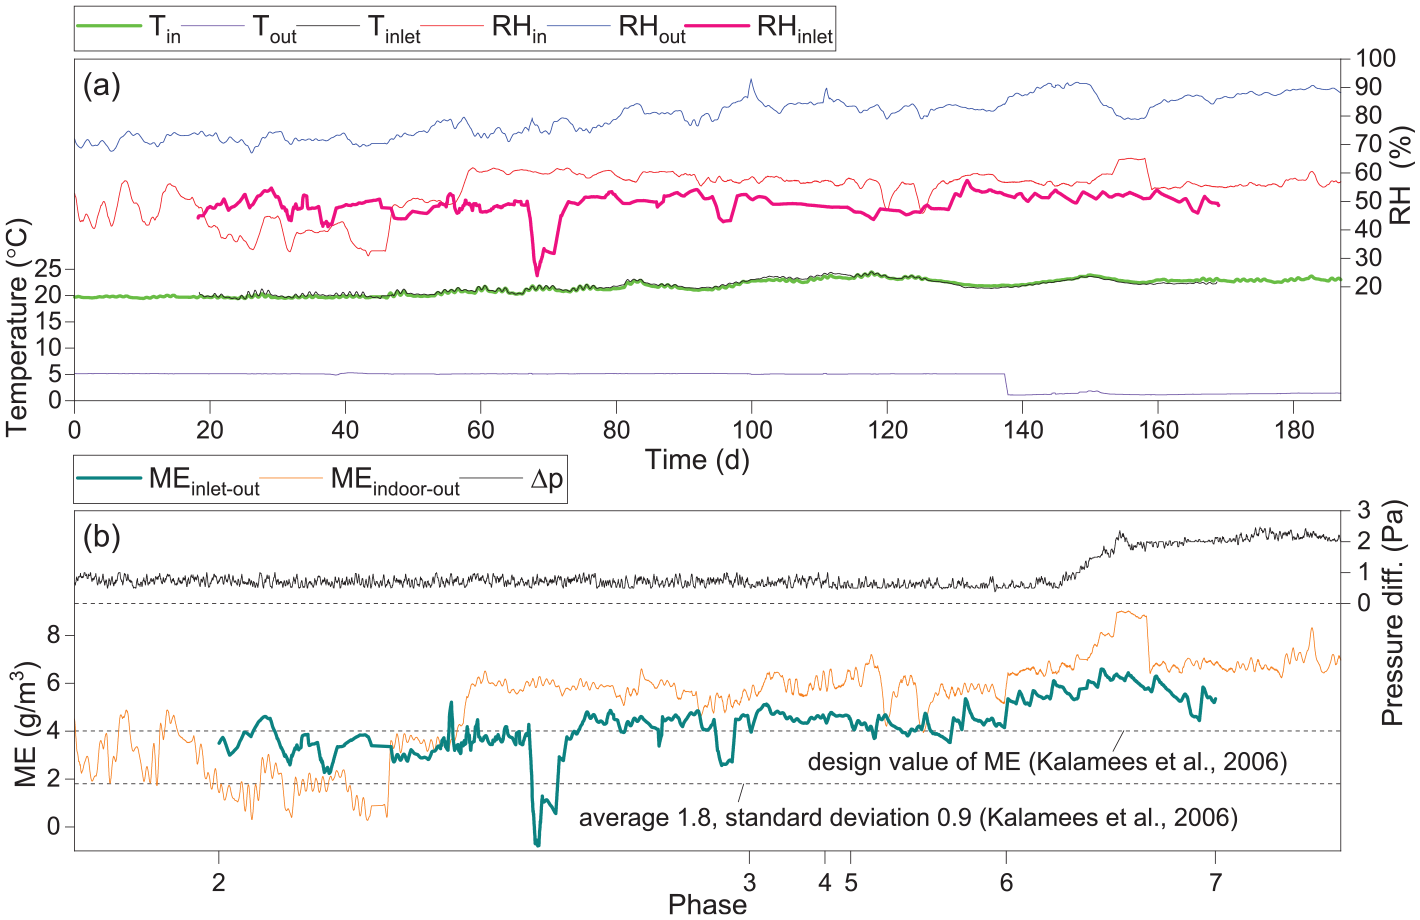
The indoor temperature varied between 20 and 25°C, while the outdoor temperature was 5°C at first and was later reduced to 1–2°C (Figure 6(a)). After the first two stages, the indoor RH was between 30% and 60%, while the outdoor RH was close to 80%. At the inlet, the air temperature coincided with the indoor temperature, while the RH was mostly 50%. The ME between the indoor and outdoor chambers varied between 0 and 10 g/m3 (Figure 6(b)), fluctuating above and below both the typical indoor ME level of 1.8 g/m3 and the design values of the indoor ME of 4 and 5 g/m3 in the cold season. The ME between the in-blow and outdoor air was the same as it was between the chambers until Phase 16, at which point the structures dried. After the test, the dismantling of the walls revealed that the thermal insulation filled the framing cavities fully, which was achieved by using two insulation boards instead of a single relatively thicker board.
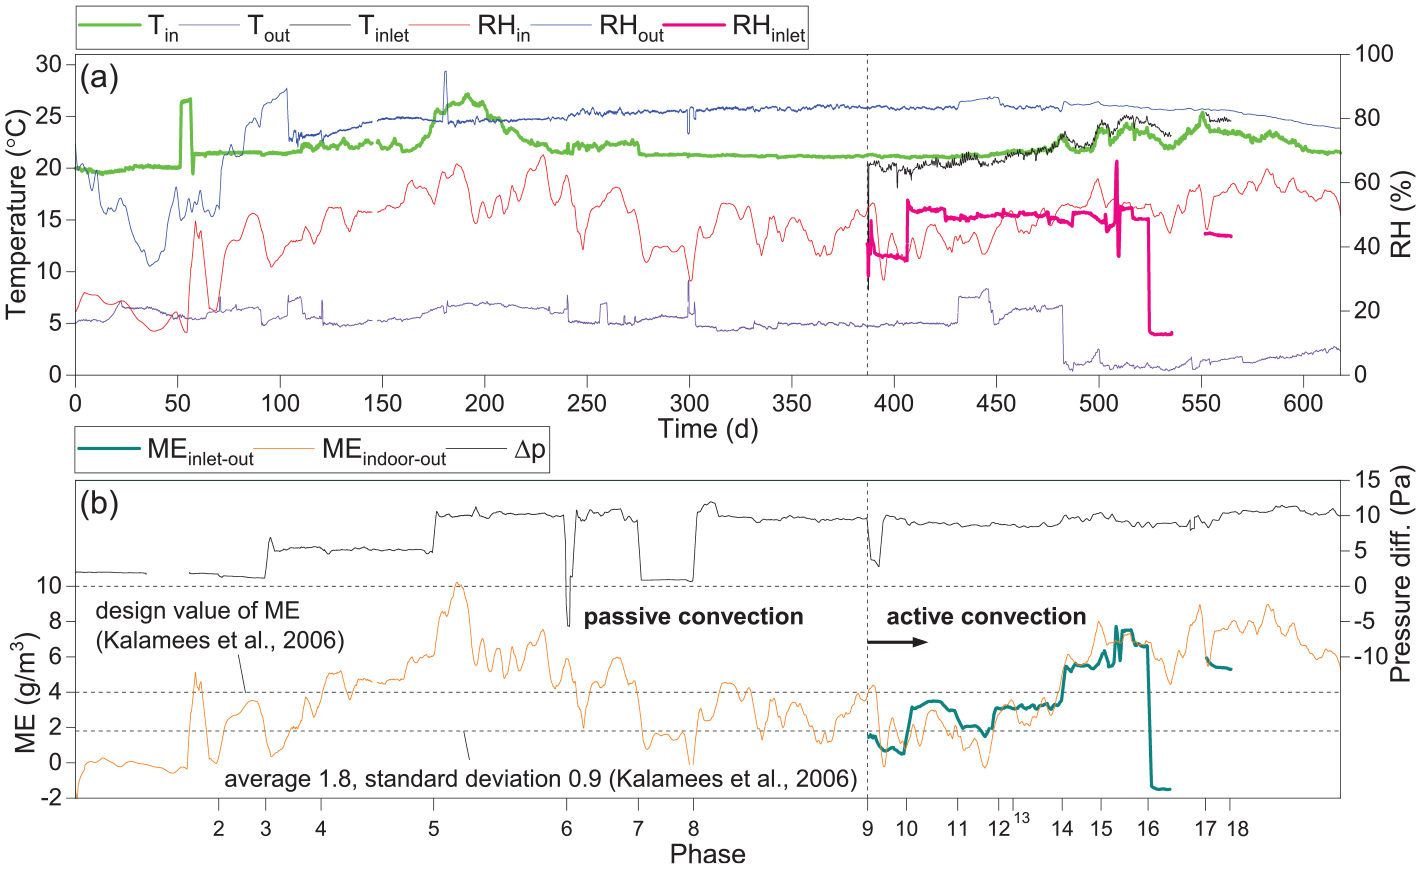
The measured environmental conditions during the MCON1 test: (a) temperature and RH and (b) the ME between the inlet and outdoor air and between the indoor and outdoor air in addition to the PD across the walls.
Effect of impaired airtightness on exfiltration
The stable DTs (Figure 7(c)) observed during phases 1–5 suggest that the air leakage through the cuts in the vapor barriers was low. In the middle of Phase 3, the dehumidification of the outdoor air lowered the RH at the exterior side of the walls (Figure 7(b)). In Phase 5, the AHs increased at Point A due to the indoor air being more humid and the PD rising, but they were distinctly below the indoor AH. The RHs for the external sections of the HI and BL walls remained at a safe level of 65%–82%. In Phase 6, the temperatures and AHs rose to become almost equal to the indoor levels at Point A, which implies an increased airflow rate that was enabled by the enlarged defects and the hole in the EGS. The DTs increased in both walls at Point B and D, which supports the previous conclusion. The RH rose to 98%–100% at Point BL(B) and BL(D) during the 19–30-day period, and condensation may have formed at Point BL(D). The rise of the RH was slower than that reported in the numerical study of Ojanen and Kohonen (1989), where 100% RH developed in just a few days. In their study, a low-Γ wall was exposed to an indoor air leakage rate of 7.2 L/min per meter of wall, the indoor RH was 60%, and the outdoor temperature was −22°C, which could explain the faster condensation. The MI value approached three at Point BL(D) during the 35 days of Phase 6 (Figure 7(a)). The RH values in the HI wall at Point B and D presented a similar trend but remained at a safe level.
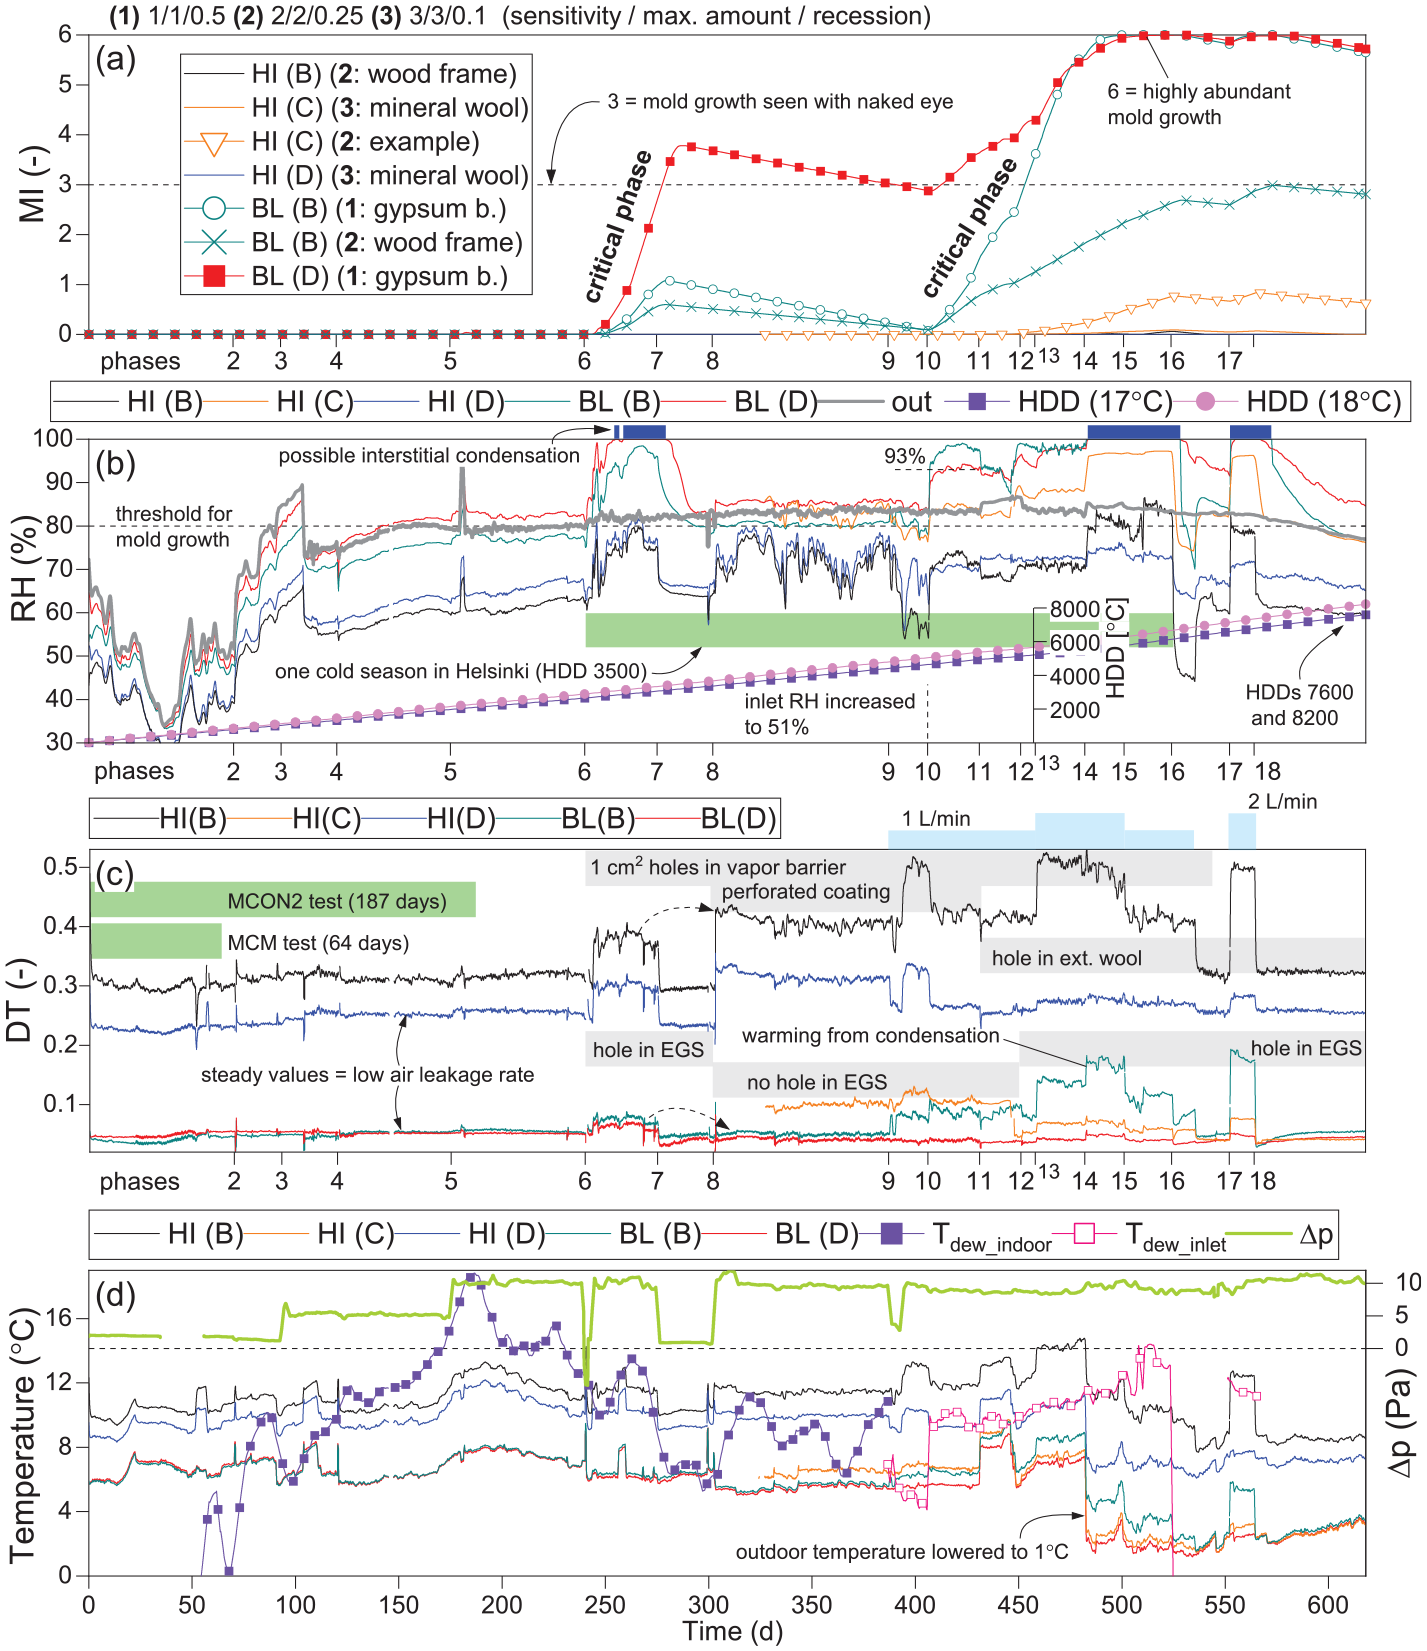
The results from the MCON1 test: calculated (a) MIs, (b) HDDs, (c) DTs, and(d) dew point temperatures of the indoor and in-blow air. Measured (b) RH, (d) temperature and PD. The duration of the MCON2 and MCM tests is illustrated in subfigure (c).
In Phase 8, the low airflow rate continued in the BL wall, as can be seen from the DT results, as the sealing of the EGS nullified the effect of the increased PD. Steady RHs of 80%–85% were obtained, and the MIs decreased at the exterior side of the BL wall. The importance of exterior airtightness, as indicated by Kalamees et al. (2017), was confirmed by these results. The DTs showed that a hole in the facing of the MW sheathing increased the exfiltration rate only slightly, and this had no clear effect on the RHs at the cold side of the HI wall.
In Phase 11, the hole in the facing was extended through the rigid MW board, which impaired the airtightness of the board and created a more direct air and moisture flow toward the outdoor chamber. Outdoor temperature increased by 2.5°C (outdoor temperature was manually adjusted only in this test) and outdoor RH by 2%. Therefore, at the cold side of the walls, the temperatures increased (Figure 7(d)), and the RHs mostly slightly decreased. These results implied that the air permeability coefficient of rigid MW (4E − 4 m3/m2sPa) can play a major role in reducing the exfiltration rate through a wall.
Impact of the humidity level of the indoor air
In Phase 9, the RH levels decreased at all the points because of the low inlet RH of 38% (ME 0.9 g/m3). The leakage rate was higher than 1 L/min in the HI wall based on the DT, which was likely caused by the joint between the inlet pipe and the drywall that was sealed in an airtight fashion after Phase 9. When the inlet RH was increased to 51% (ME 3.2 g/m3) in Phase 10, the RH levels rose to 93%–98% at the cold side of the BL wall in 1 week, and the DPD values lowered to −3.5°C on average. The high RH raised the MI values for these points, but the MIs remained acceptable in the HI wall. For the first time during the experiment, the RH at Point BL(B) was more than the RH at Point BL(D) (by 4%), as the pipe being located near Point BL(B) reduced the lateral spread of humidity. The DT at Point BL(D) was lower than that in Phase 6, when the air flowed inside the porous MW to reach Point BL(D). At Point BL(B), the RH was almost equal in Phase 6 and 10, which caused a similar rise in the MI during these phases.
Impact of exfiltration rate
In Phase 13, the doubled exfiltration rate slightly increased the RH at Point BL(D) and HI(C). This small effect is evidenced by the MCM test. The slight increase in RH only at these points can be explained by the increased transfer of heat to Point B. In Phase 15, the increased humidity content (ME of 6.6 g/m3) in the leakage air raised the RH to 85% at Point HI(B) even though the flow rate was halved. This emphasizes the significance of the DPD value for the hygric conditions compared to the exfiltration rate. The MI values reached the maximum level of 6 at the cold side of the BL wall.
Influence of outdoor temperature and critical point in the HI wall
The RHs at the cold side of the walls rose before Phase 12, as the outdoor temperature was decreased. Reopening the hole in the EGS in Phase 12 did not affect the RHs of the BL wall. At the end of Phase 11, the RH at Point HI(C) increased to almost 90%, and, for the first time in the experiment, the MI value also increased slightly. Further, the RHs remained unchanged on the warm side of the MW sheathing. The hole in the EGS resulted in a rise in outdoor temperature, which corresponds to 70% of the temperature increase caused earlier by the hole in the exterior MW sheathing. The outdoor RH, however, remained unchanged, and the humidity transferred by the leakage air continued to accumulate inside the BL wall, which coincided with the DPD values of −3 to −4°C at the cold side of the wall.
In Phase 14, the outdoor temperature was lowered from 6.5 to 1.3°C, which raised the RH at all points on the cold side of the walls. The elevation of the DT at Point BL(B) probably resulted from condensation, as indicated by the RH of over 100% at this point and the rise of the RH close to 100% at Point BL(D). At Point HI(C), the RH was over 95%, as in the MCM test Phase 4*, but the unchanged DT indicated that condensation did not occur. At this point, the MI continued to increase but remained below 1, and the DPD value decreased to below −6°C for the first time. The RHs at the other points in the HI wall were at a safe level.
The occurrence of the highest RH on the warm side of the facing of the MW sheathing indicates that this is certainly a critical area regarding moisture accumulation and the damage caused by it. The vapor permeable insulation within and outside the framing cavity effectively restricted interstitial condensation, and the foil with Sd values of 0.015–0.04 m is obviously the only part in the wall where a high RH or condensation could occur. However, in the current test, the safety margin of the wall for exfiltration was not exceeded.
Drying after moisture loading
In Phase 7, the temperatures at Point A and the DTs at the exterior side returned to the level they were before Phase 6. At the cold side of the walls, the reduced airflow started to reduce the RH values. The decrease of RH was faster in the HI wall, which implied that a greater amount of moisture accumulated in the BL wall in the previous phases. Based on the results obtained by Fox (2014), a more hygroscopic cavity insulation, such as cellulose, may extend the drying phase compared to the drying periods observed for the BL wall, which may increase the probability of moisture damage in HI walls.
In Phase 16, the inlet air with 13% RH decreased the RH of 100% at Point BL(B) by more than 10 units in 4 days, whereas, at Point HI(B), the RH of 82% declined by more than 20 units in 10 h. As the difference between the exterior Sd values of the structures was insignificant, and the drying-out ability of the HI and BL walls in general is at the same level (Viljanen and Lu, 2019), the results confirmed the earlier conclusion of higher moisture accumulation in the BL wall. This was also verified by the MC measurements carried out for the wood frames 22 days after the test before the maintenance of the environmental conditions was stopped. The MC at Point BL(B) was 10–11 wt%, whereas that at Point HI(B) was 9 wt%. The highest MC of 12 wt% was measured at the outer face of the stud in the BL wall. The MCs were higher on the side of the stud that was subjected directly to the airflow.
Risk of mold growth opposite to the air leakage
The moisture accumulation in the exterior part of the BL wall was confirmed via a visual inspection after the test; mold growth was observed on the interior surface of the EGS. The mold covered about 60% of the damaged area, the height and width of which were both 0.2 m (Figure 8). This area had an MI value of 5, and it likely delimited the part of the EGS with the highest moisture levels during the test. Mold growth was not observed on the wood studs of the walls, which indicates that planed timber is not as susceptible to mold growth as EGS. The observation of mold formation in the BL wall is in line with the local moisture accumulation on the sheathing board observed by Desmarais et al. (2000). The test setup of this study represents a kind of ultimate situation where humidity has a direct path to the exterior sheathing, whereas some leaky joints, such as the joint between the external wall and inserted floor (Kalamees et al., 2017), may provide a meandering path for the airflow, which decreases the probability of mold growth compared to a direct flow path.
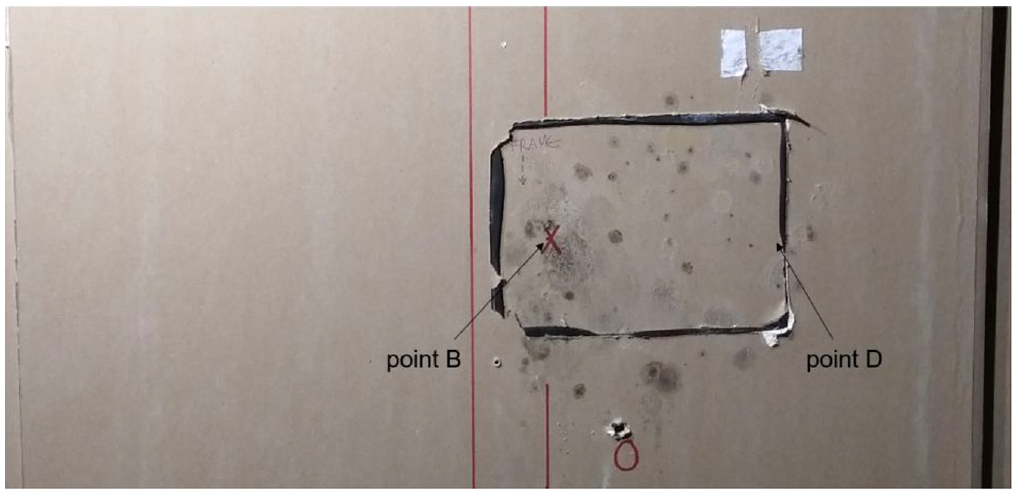
Mold growth was observed on the interior face of the EGS after the MCON1 test. The wood frame was located between the vertical lines, the inlet pipe was located opposite the spot marked with the letter “X,” and the outlet hole was located next to the letter “O.” The black ethylene propylene diene monomer (EPDM) sealant is visible at the edges of the EGS piece, whose outer surface was additionally taped. The EGS piece was removed at the end of Phase 3 for probe installations. The board was kept intact before that point.
Molds do not typically grow in temperatures below 0°C (Hukka and Viitanen, 1999; Sedlbauer, 2001); thus, considering the duration for which Finland experiences outdoor temperatures between 0 and 5°C (Finnish Meteorological Institute, 2021b), a small amount of mold (MI value 2–3) may develop during autumn or spring on very sensitive building materials if a low-Γ wall is subjected to a significant amount of air exfiltration from a point defect (Figure 9). This risk seems to be slightly higher in South Finland, where the outdoor temperature is between 0 and 5°C for 61 days of the year, while, in North Finland, such temperatures occur for 49 days. By selecting less vulnerable exterior sheathing materials, the MI values can be kept below 1 (Figure 9). In winter, the MI levels decrease due to subzero temperatures, and in summer, the high temperatures at the exterior section of a wall prevent mold growth, based on the measurements in the ventilation cavities of exterior walls (Viljanen et al., 2021).
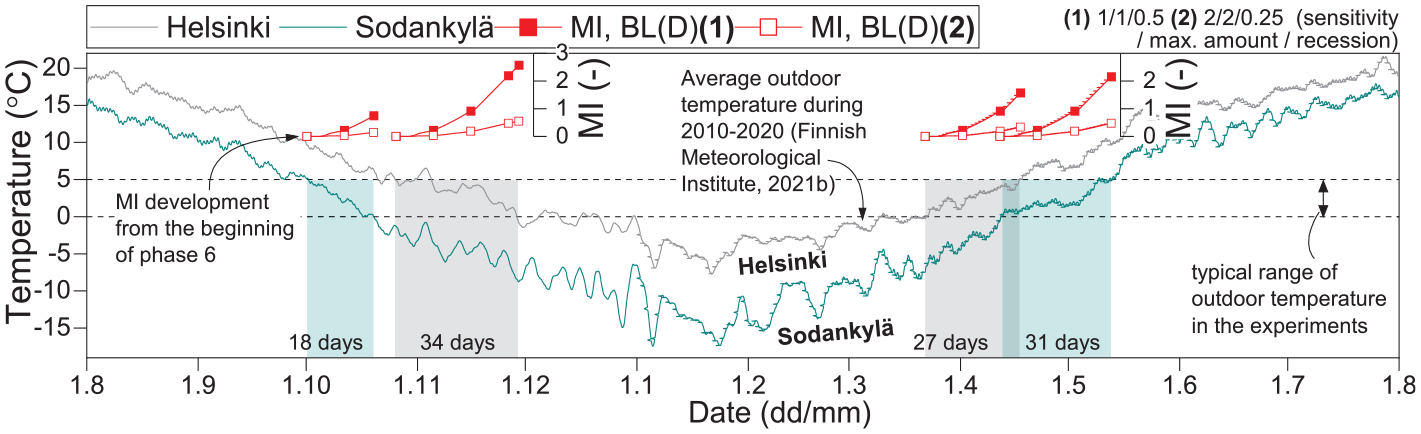
The observed MI development in the BL wall placed in the season whose temperature corresponds to the outdoor temperature used during the MCON1 test.
Results from the MCON2 test
Environmental conditions measured and insulation installation
The indoor and inlet temperatures were between 19.5 and 24°C (Figure 10(a)). The outdoor temperature was 5°C at first and 1–1.5°C during the last two phases. The RH of the indoor air first varied between 30% and 55% and, starting from the middle of the second phase, between 50% and 60%. The inlet RH was mostly between 45% and 53%, and the inlet ME was about 4 g/m3, corresponding to the lower design value. However, it was increased in Phase 6 to 6 g/m3 (Figure 10(b)). Further, the outdoor RH varied between 70% and 90%. The PD over the walls was mostly under 1 Pa, with the outdoor chamber having a lower amount of pressure. After the test, it was observed that the insulation boards did not fill the framing cavity of the HI walls completely (Figure 3(a)), as the corners of the 200-mm-thick insulation rounded when pressed against the exterior wool during the installation process. The impact of the observed installation defects on the hygrothermal behavior has been evaluated in the MCM test. The probes slightly hindered the installation of the wool boards, which is a challenge that has also been recognized by Li et al. (2007). Referring to the observations from the MCM test, it was found that the vertical air gaps affect the results of the HI1–HI3 walls, but their effect is not decisive in the context of hygrothermal conditions and the risk of mold growth on the cold side of the wall.
The measured environmental conditions during the MCON2 test: (a) temperature and RH and (b) the ME between the inlet and outdoor air and between the indoor and outdoor air in addition to the PD across the walls.
Effect of exterior mineral wool boards on performance
In Phase 1, RH was 67% at Point B in the BL2 wall, while that in the HI walls was 54%. Both these values are well below the mold growth threshold of 80% (Figure 11(b)). In addition, the MCs remained stable (Figure 11(b)). In Phase 2, the airflow of 1 L/min increased the RH at Point HI3(B) and BL2(B) to 61% and 75%, respectively, in 9 h. At the end of the phase, the RH at Point BL2(B) had reached a value of 90%. The MC of the wood frame at Point BL2(B) started to increase at the beginning of the phase but remained unchanged at Point BL2(B2). This point was 45 cm below the inlet, where RH followed the level of RH in the outdoor air, reaching a value of 80% during Phase 2. The hygric response to humid exfiltrating air was local, and the area affected was similar to the area observed in the MCM test. At the end of Phase 2, the MI at Point BL2(B) increased to 0.2–0.4 in the sensitivity classes 1 and 2 (Figure 11(a)). As the changes in the RH were small in the HI1 and HI2 walls, their performance was superior to the HI3 wall. At the interface between the 2 MW boards, the moisture transfer was faster than that at the interface between the MW and a more hygroscopic gypsum board with an Sd value of 0.07 m.
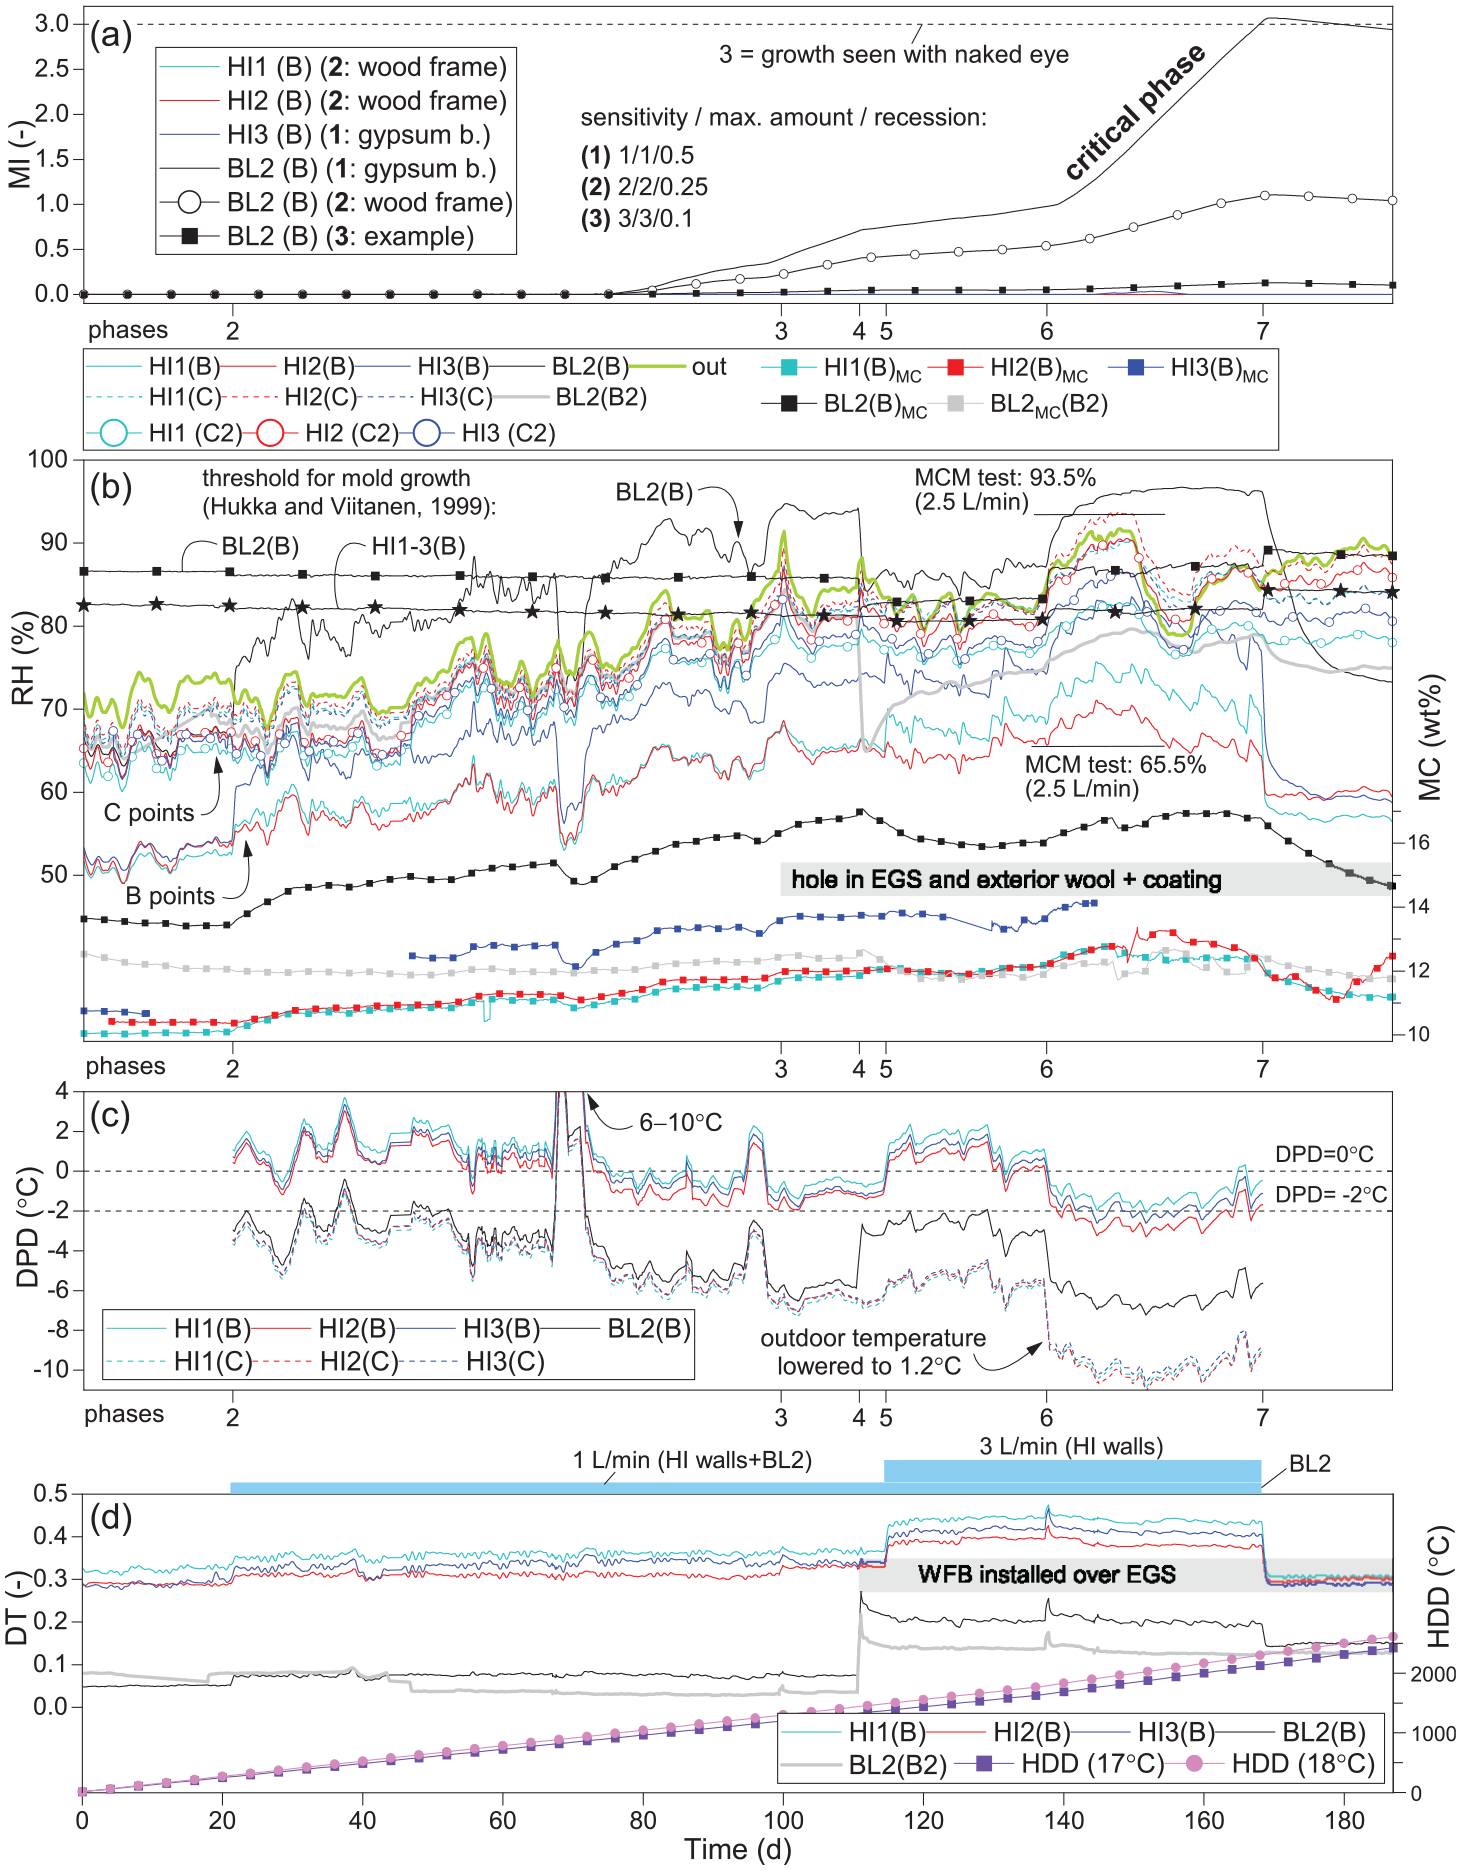
The results from the MCON2 test: the calculated (a) MIs , (c) DPDs, (d) DTs and HDDs with the measured (b) RH and MC at Point B. Additional results are presented from points B2, C, and C2.
In Phase 2, the MC of the wood frame also increased for all the HI walls at Point B, which suggests that the drying ability was insufficient to dehydrate the humidity transferred by exfiltration. However, in the HI walls, the rate of MC increase was lower than that in the BL2 wall. At all points with equal exterior Sd values, the MC results indicated that the HI walls distributed the humidity transferred by exfiltration more effectively than the BL2 wall, which could be partly explained by the vertical gaps in the HI walls. In the BL2 wall, moisture mainly accumulated at the cold side of the frame and, likely, on the EGS. The increase of the indoor RH from 40% to 60% in the middle of Phase 2 was not observed at Point B, which implies that both the vapor barriers and the moisture-adaptive foil of the HI2 wall performed well. The Sd value of the PA foil was 4.5 m at the time (Appendix 2, Figure A4).
In Phase 3, the added outlet holes did not significantly affect the RHs at Point B, but they stopped the slow increase in the MCs of the HI walls. The stable MCs suggested that the humidity flux to the outdoor air was based on both diffusion and convection, as observed in the MCON1 test. The HI3 wall presented the highest MC among all the HI walls of almost 14 wt%. The continuous increase in the MC of the BL2 wall can be explained by a greater accumulation of moisture and a lower transfer of humidity to the outdoor air compared to the walls with high Γ values.
Consequences of thermal conditions on the cold side of walls
In the first phase, the effects of the higher U value and the cold bridge at the stud resulted in only 0.25–0.45°C higher temperature at point BL2(B) as compared to Point C of the HI walls. In Phase 4, the installation of the WFB to the BL2 wall induced a large difference in thermal performance, as the DPD at Point B increased from −6 to −3°C (Figure 11(c)), the DT increased from 0.07 to 0.2 (Figure 11(d)), and the temperature rose from 6 to 8°C, while the RH declined from 94% to 85%. The increase in the MI slowed down, and the MC of the stud started to reduce at Point BL2(B) as the moisture accumulation in the wall ceased (Figure 11(b)).
In Phase 5, the tripled airflow rate in the HI walls increased the temperatures at Point B by 1.5°C and the AH by 0.5–1 g/m3. As expected from the two previous tests, the changes in the RH were small. The increases in temperature, together with the ones from the MCM test and the second phase of the MCON2 test, suggest that the temperature increase at Point B is not linearly dependent on the airflow rate, as the increase of temperature per volume flow grows when the leakage rates are raised. The temperature increase was 0.3 and 0.5°C/(L/min) if the flow rates were taken as 1 and 3 L/min, respectively. In the HI walls, the DPD values at Point B exceeded 0 (Figure 11(c)), which ceased the slow increase of the MCs entirely. Starting from the fifth phase, the HI2 wall presented the lowest RH at Point B of the test walls, as the sensor was moved 8 cm below its original position and closer to the outlet in the lateral direction. The tripled airflow rate increased the temperature at Point HI2(A) to the level of the indoor air, lowering the RH, which increased the Sd value of the vapor retarder to 12.5 m. Thus, heat convection may also improve the moisture safety inside the walls by reducing the permeability of the moisture-adaptive foils.
In Phase 6, the temperatures of the outer parts of the walls reduced, as the outdoor temperature was lowered to 1.2°C. In the BL2 wall, the temperature decreased 3°C at Point B, whereas, in the HI walls, the decrease was only 2°C. At Point B, the RH of the BL2 wall rose to 97%, and while that of the HI3 wall rose to 83%. As the RH rose to 69%–75% in the other HI walls, the EGS caused the RH at Point HI3(B) to increase by at least 11 units. This supports the earlier conclusion that installing a rigid board inside the exterior insulation weakens its performance. An exterior rigid board may create a moisture risk during cold weather, especially if it is more vapor-proof than an EGS or its R value is low. The MC at Point BL2(B) started to increase again because the DPD lowered from −2.5 to −6°C (Figure 11(c)). As observed in the other two tests, the moisture risks in the BL2 wall were local, as the MC, RH, and MI levels at Point B2 were acceptable. The tripled airflow in phases 5 and 6 led to an increase in the MEs relative to the outdoor air at Point C, from 0.1 to 0.3 g/m3, and the RHs were close to 93.5%, as they were during the MCM test. Despite the minor increase in vapor content at Point C/C2 in the HI walls, the MI values remained zero; however, at Point HI2(C), the RH rose to slightly exceed the outdoor level, and the RH at Point HI2(C2) was the highest (90%) among all the HI walls. It is obvious that an air leakage combined with vapor diffusion may slightly aggravate the rate of moisture accumulation even in structures that have a vapor permeable facing on the sheathing. Thus, decreasing the vapor resistance of the interior vapor control layer to increase the inward drying ability of walls with sufficient exterior thermal resistance, as suggested by Trainor et al. (2016), should be evaluated on a case-by-case basis. For example, the Sd value of the PA foil in the HI2 wall in the fifth and sixth phase (12.5 m) is too low if the indoor RH is above 50%. The conditions within all the HI walls remained acceptable and were compatible with the simulation results reported by Kalamees and Kurnitski (2010). These authors concluded that a significantly higher leakage rate of 12 L/(min·m) is needed for moisture to condense on the interior face of the sheathing, which means that, in the current study, a higher local leakage rate could have led to more serious consequences.
Structural endurance for short-term air leakages
In Phase 7, the temperatures at Point B practically stabilized in 10 h after the airflow had been stopped. Based on the RHs at Point B, the drying of the HI1 and HI2 walls took less than 2 days, the drying of the HI3 wall took 5 days, and the drying of the BL2 wall took 10 days. During this phase, the amounts of water vapor transferred by diffusion from Point B to the outdoor air through a square of 400 cm2 were 11.2, 5.6, 2.6, and 2.5 g in the BL2, HI2, HI3, and HI1 walls, respectively. The values were calculated using equation (5). Among the HI walls, the amount of dried moisture was the highest in the HI2 wall as a consequence of higher diffusion from the indoor air. At Point BL2(B), the MI values remained at 3 and 1 with sensitivity classes 1 and 2, respectively. As the sensitivity class for the cardboard surface of an EGS is 1 (Tuominen et al., 2019), visible mold formation could be possible in the BL2 wall, although this was not observed during the visual inspection carried out for the dismantled structures 2 days after the test. The MI values based on this model should apparently be more than three to reliably indicate a severe mold formation, such as the one presented in Figure 8. At Point BL2(B), the MC level was 12 wt%, while it was 10 wt% on the other side of the frame in the adjacent framing cavity. Similar to previous tests, the airflow was found to affect the MC of the surface of the wall frame to a greater extent, which the leakage was directed toward.
Several reasons influence the fact that mold developed in the BL wall but not in the BL2 wall. The total amount of moisture transferred into the structures was calculated using equation (3) but while disregarding the moisture adsorption or transfer at the exterior structure by omitting the AH term from the observation point. During the active convection in the MCON1 test, both walls gained 1.8 kg moisture, whereas, in the MCON2 test, the HI walls received 3.6 kg of moisture, while the BL2 wall received 2 kg. The amount of moisture transferred to the BL2 wall during 89 days before the installation of the WFB was 1.2 kg, which is less than the that transferred by the active convection in the MCON1 test. The lower RH and the absence of condensation in the BL2 wall can also be affected by the increased Γ value during the test, a lower maximum air leakage rate, a difference in the inlet pipe location, a slightly more hygroscopic GW compared to SW, and a briefer test. The BL2 wall, with a 1% Γ-value, withstood the convection loading for 89 days, which is much longer than the season of 18–34 days that promotes mold growth in Finland (Figure 9).
The DPD method and its validation for building physics
Validation of the method
The dependence of the rate of change of the MC of a wood-based material on the DPD value was evaluated based on 13 cases, in which a lightweight wall structure is subjected to concentrated air leakage (Table 5). The results from the MCM test were not included in Table 5, as they represent values at the surface of the wall frame, while the method considers those deeper in a material. The lower the negative DPD value is, the higher the rate of the MC increase in a studied material (Figure 12). The coefficient of determination (R2) for the linear fit in Figure 12 was 0.86. Thus, the rate of moisture accumulation from concentrated air leakages is reasonably explained by the DPD value. With close to zero DPD values, the rate of the MC increase is limited. The duration and rate of the airflow are less relevant in such cases. The DPD value may be as low as −2°C before the rate of moisture accumulation reaches a significant level (Figures 11(c) and 12). With a DPD value of −6.4°C, the MC of a material increases 3 wt% during 30 days, which already represents an undesirable tendency. A higher rate of moisture accumulation from a line-shaped leakage path observed by Kalamees and Kurnitski (2010) than that predicted by the linear fit suggests that the slope of the linear fit between ΔMC and DPD has a larger negative value with line-shaped defects.
The calculated DPD values in the external structures of previous and the current air leakage studies together with the observed MC increase in the studied material.
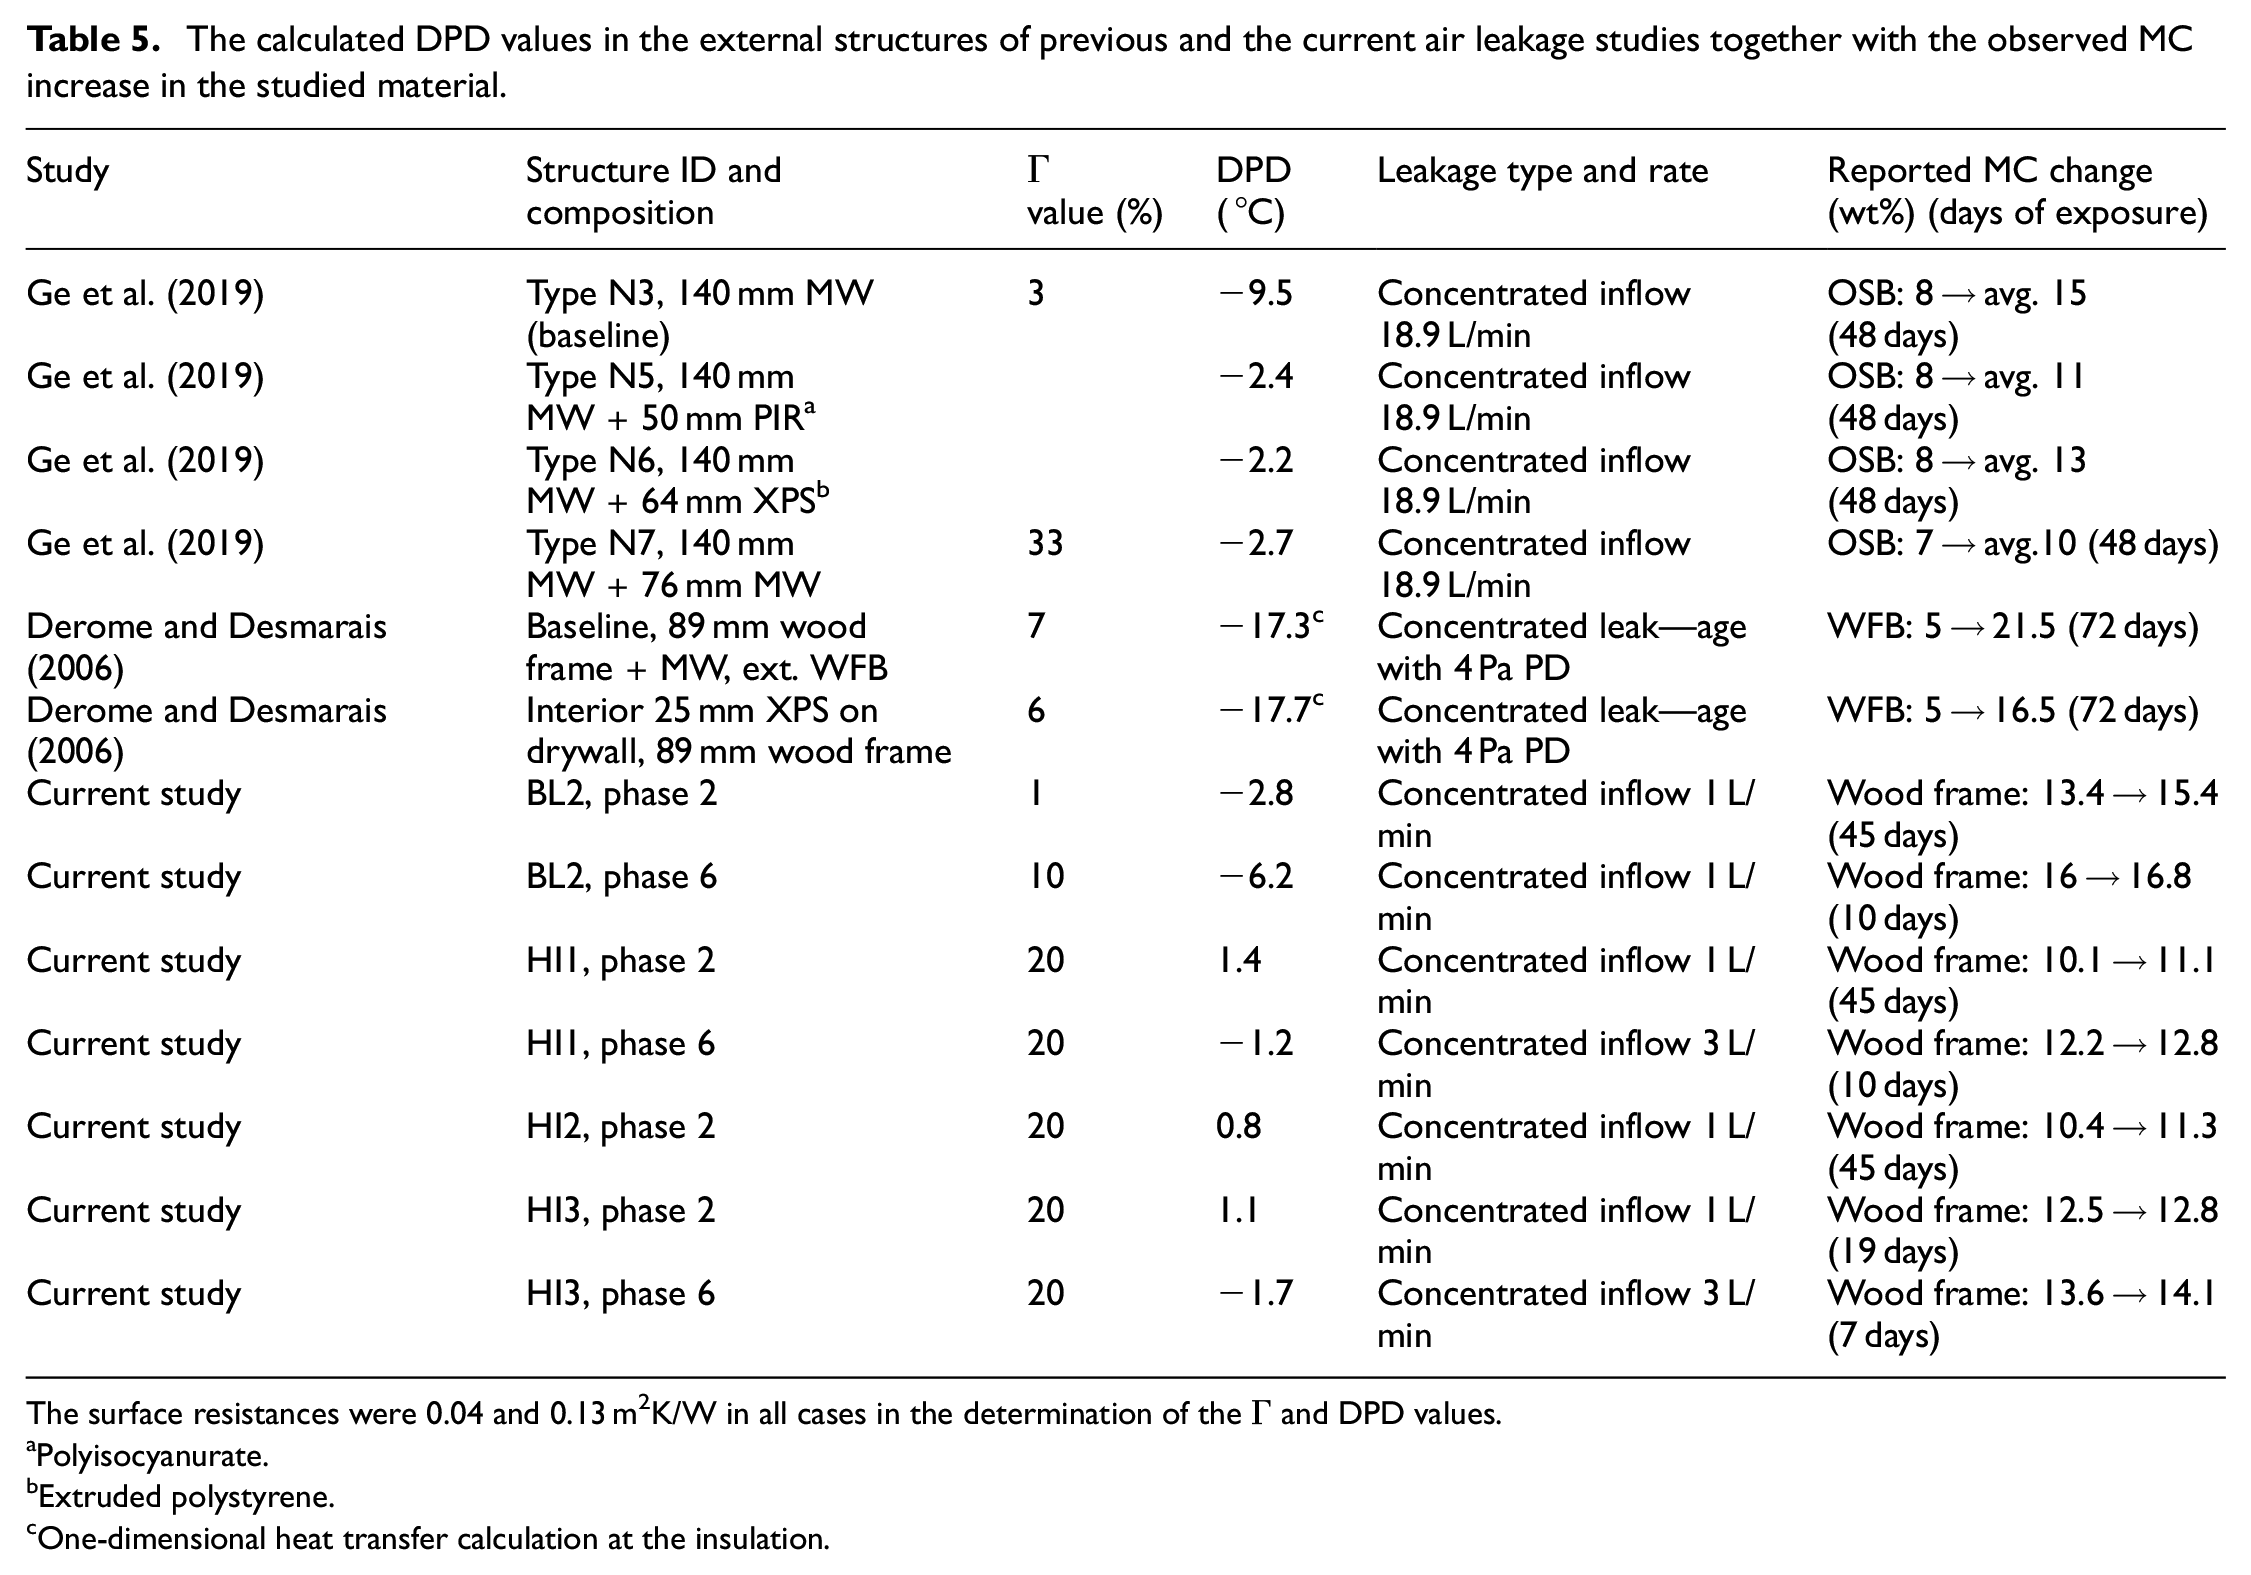
The surface resistances were 0.04 and 0.13 m2K/W in all cases in the determination of the Γ and DPD values.
Polyisocyanurate.
Extruded polystyrene.
One-dimensional heat transfer calculation at the insulation.
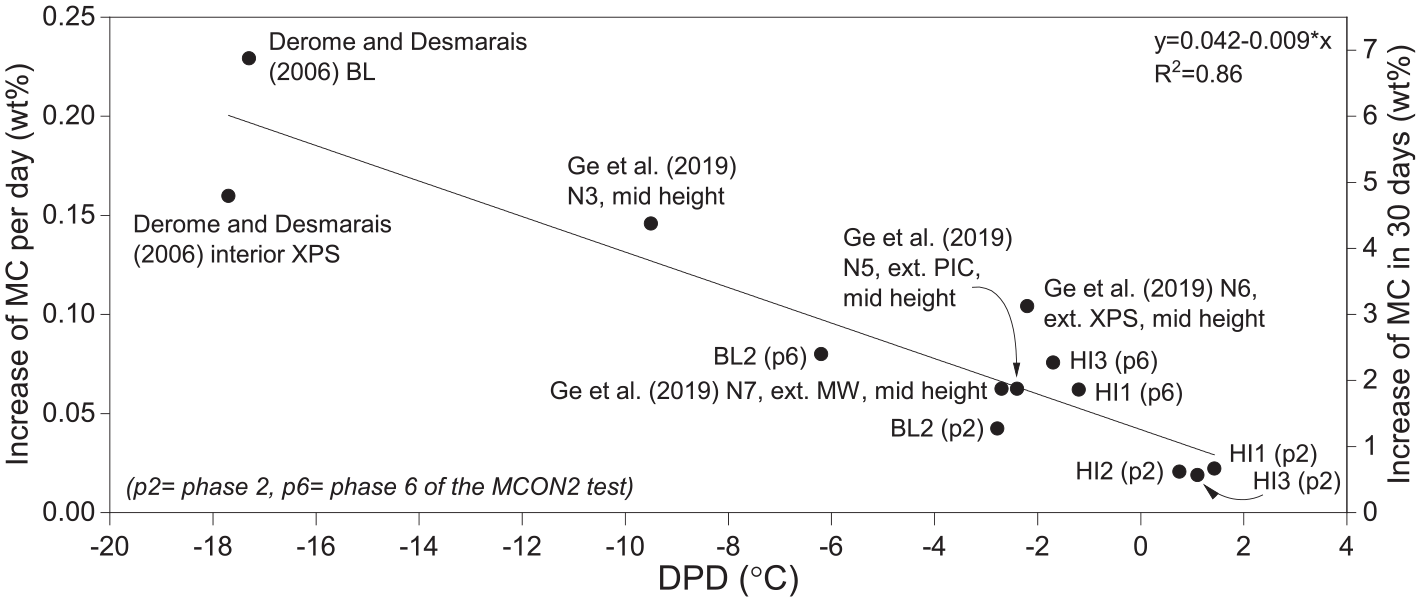
The correlation of the measured MC increase with the DPD value in the studies described in Table 5.
The effect of variable thickness of the exterior sheathing is considered by the method in the evaluation of the temperature at the observation point. However, close to the observation point of the DPD, vapor-proof materials may present exceptionally high moisture accumulation compared to the linear equation in Figure 12 if the DPD values are negative (Derome and Desmarais, 2006; Ojanen and Simonson, 1995). Relatively high moisture accumulation has been observed already with DPD values of about −2°C in structures that had exterior foam insulation (Sd value about 10 m or more) (Ge et al., 2019). Therefore, in the case of structures that have such vapor-tight materials at their cold side, DPD values should remain above zero to ensure that no moisture accumulates in the structure.
Although equation (3) indicates that the rate of moisture accumulation potentially increases with the amount of air leakage, it seems that the DPD value is a more descriptive factor to this (Table 5). The experiments showed the somewhat linear correlation between the RH at Point B and the DPD value (Appendix 2, Figure A3), which, combined with the fact that wood has approximately a linear moisture capacity at high RH levels, explains the significance of the DPD value. The MCM test also showed that the RH at Point B depends little on the outlet location, which may explain the similarity between the current results and the ones by Ge et al. (2019), although in their study, the in-blow air returned to the indoor chamber. The airflow rate, however, restricts the applicability of the method; based on the computer simulations of Ojanen and Kumaran (1995), the heating effect of the airflow, starts to reduce moisture accumulation inside a low-Γ wall when a concentrated air leakage rate is above 12.5 L/min, and with a flow rate of 25 L/min, the accumulation stops completely. Therefore, the DPD method should not be used when the leakage rate is well above 12.5 L/min, as the method ignores the heating effect of airflow. Based on the observations from the MCON2 and MCM tests, with a Γ value of 20%, a flow rate of already 2.5–3 L/min may locally prevent the accumulation of moisture at the cold section of a wall. However, as the MC of the whole wall increases in this situation, such airflow rates are still detrimental to the performance of the wall.
Visualization of exterior thermal conditions through two-dimensional DPD distribution
The average DPD values obtained for the horizontal sections of the HI1 and BL2 walls during Phase 3 of the MCON2 test were visualized by solving the two-dimensional temperature distribution and subtracting the average dew point temperature of the leakage air from the solution. The average values of the temperatures measured for the indoor, outdoor, and leakage air were used with the average RH of the leakage air. The heat transfer coefficients were 7.7 and 25 W/m2K for the internal and external surfaces of the 300-mm-wide domains used in the calculations, respectively. The heat convection from the airflow was not considered. At Point B, the DPD was −6.6 and −2.6°C for the BL2 and HI1 walls, respectively (Figure 13). This indicates a risk of significant moisture accumulation only in the BL2 wall, which is consistent with the experiment. The DPD value at HI1(C) (−6.8°C) explains the possibility of moisture accumulation on the warm side of the facing of the MW sheathing if the moisture fluxes exceed the drying ability of the wall. Further, considering the additional temperature increase caused by the convection at Point B, the DPD variation on the warm side of the MW sheathing (Figure 13) explains the higher accumulation of moisture measured at points 34, 37, 38, and 39 in the MCM test. The lower the Sd value of the facing of the MW sheathing, the lower the susceptibility of MW and this facing to mold growth. In addition, the possibility of moisture transfer toward the adjacent framing cavity makes a wall with exterior MW insulation more tolerant against air leakages as compared to a wall that has an EGS. The simulated DPD was 2 and 0.7°C below the values derived from the measurements of the HI1 and BL2 walls, respectively, which suggests that the heat convection increased the temperature at Point B more in the walls that had a high Γ value. The even DPD values detected for the EGS of the BL2 wall support the previous conclusion that the moldy area on the EGS of the BL wall depicted the most humid area of the board.
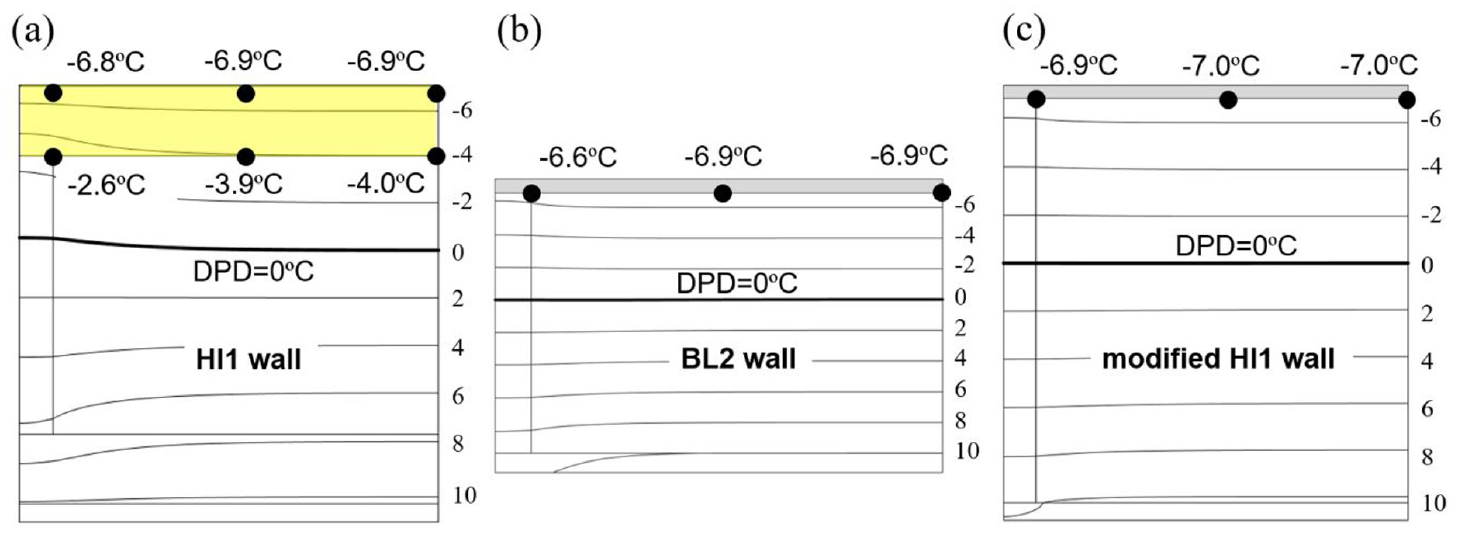
The numerical solution of the two-dimensional DPD distributions in (a) the HI1, (b) BL2, (c) and modified HI1 walls during the third phase of the MCON2 test. The exterior sheathings are highlighted in yellow (MW) and gray (EGS). The calculation was performed with the commercial software Comsol Multiphysics 5.5 using the Heat transfer in solids module to consider the heat transferred only through conduction.
The HI1 wall modified by using gypsum boards on both sides of the 300-mm-thick insulation was also analyzed (Figure 13(c)). The DPD at Point B in the modified HI1 wall was only 0.24°C lower than that in the BL2 wall, indicating that the U value contributes to the moisture accumulation caused by exfiltration less than the Γ value. The measurements support the fact that the hygrothermal behavior of the BL and BL2 walls is extremely similar to the HI walls that are equipped with similar exterior sheathings. Although having a lower temperature at the outer sections of HI walls is a negative feature, its effect on the hygric performance is negligible, as Ojanen and Hyvärinen (2008) have also stated.
Selection of thermal resistance for exterior sheathing of the wall
In Finland, moisture accumulation due to air leakages with a Γ value of about 1% in terms of outdoor air is possible for about 4–7 months annually. This, combined with the results from the experiments, supports that the Γ value should be at least 10%. Based on the experiments, the DPD value may be as low as −2°C before significant amount of moisture accumulation. In winter, in Finnish lightweight detached houses, the indoor RH is typically at a level of 20%–25%, and, thus, a Γ value of 10% or 20% (Southern and Northern Finland, respectively) may be used to restrict the period during which fast moisture accumulation is possible to 2.5 months (Figure 14(a)). With an indoor RH of 35% representing the design level of ME in the cold season, corresponding Γ values are 30% and 40% (Figure 14(b)). The analysis shows that the duration for which the outdoor conditions that enable air leakages to cause moisture accumulation vary in different climates. With an indoor RH of 50%, the recommended Γ values would roughly be 50%–60%. It is obvious that in buildings with such humid indoor air during the cold season, the importance of interior airtightness would be emphasized. Figure 14 shows that moisture does not accumulate during the summer, as also reported by Lam (1996). Figure 14 does not consider the spread of humidity and heat convection inside the assemblies, which presumably may increase the DPD values by 2–3°C (Figure 14(c)), hence incorporating additional certainty into the Γ values based on the charts.
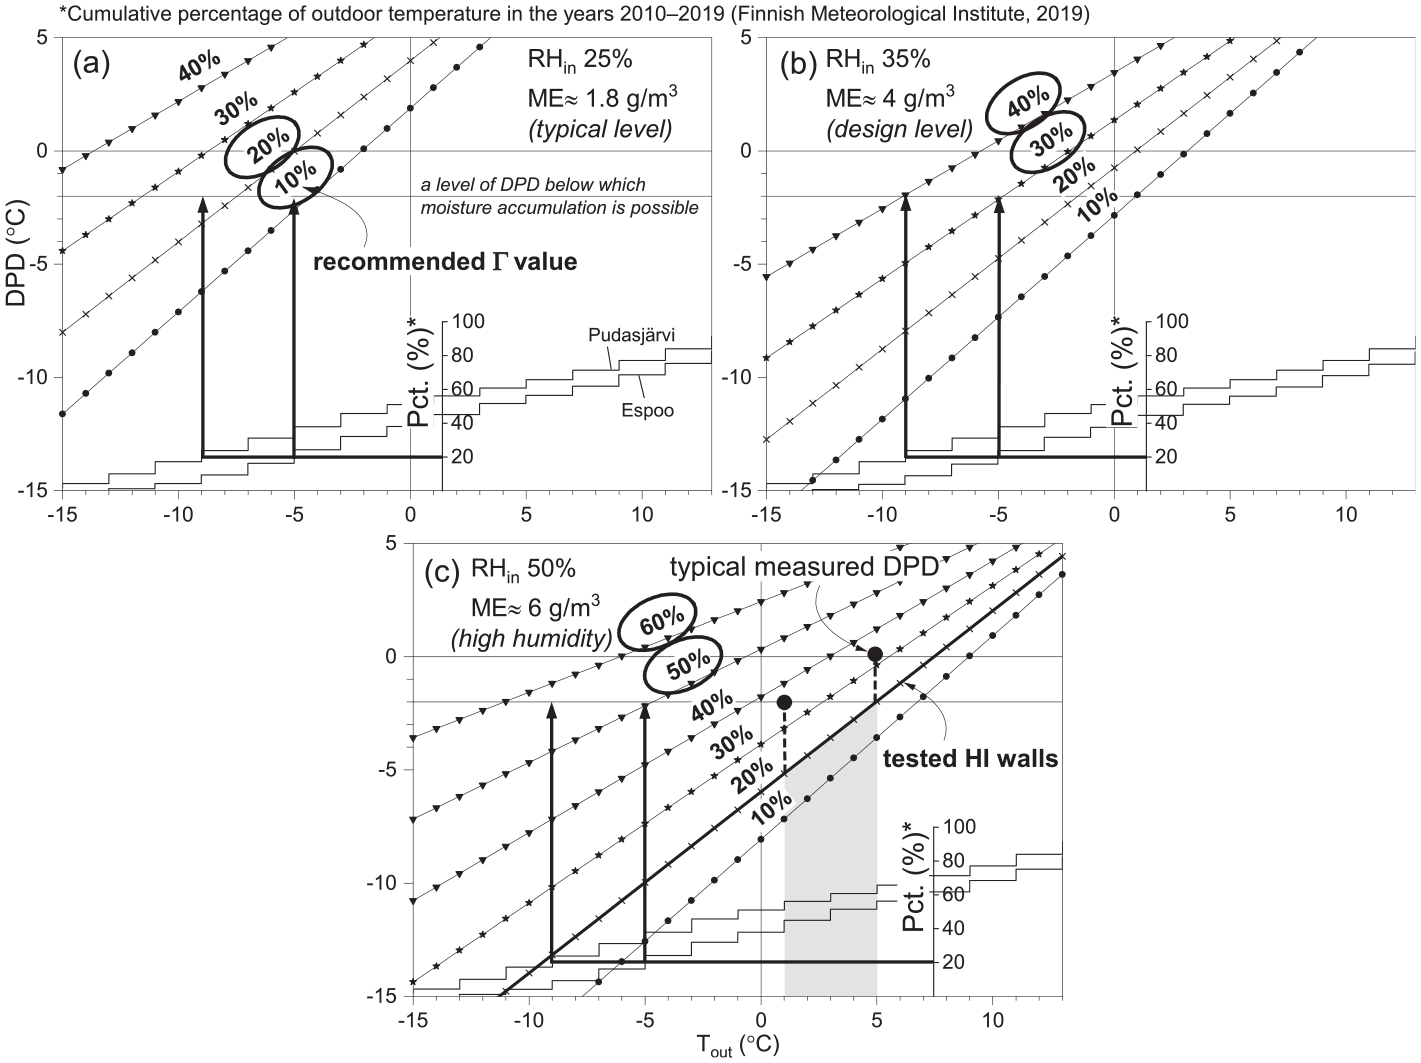
The dimensioning charts to restrict the duration per year (e.g. 20% = 73 days) during which fast moisture accumulation from exfiltration is possible by choosing the Γ value and considering the indoor RH of (a) 25%, (b) 35%, and (c) 50%. The recommended Γ values apply to structures with vapor permeable exterior sheathing (Sd value about 0.1 m). With vapor tight exterior sheathings, the target value of the DPD should be increased to 0°C.
Discussion
The observations from the experiments highlighted the several benefits of using insulating exterior sheathing to improve the functionality of wood-framed HI external walls subjected to air leakages. As the thermal conditions at the outer section of a wall have a key impact on the hygric conditions and probability of mold growth, it is recommended in Finland to use an insulating sheathing that produces a Γ value of 10%–20%. A more detailed analysis showed that advantages of exterior insulation are related to the DPD value. With the Γ values of 20%, the DPD values were close to zero, which, combined with the heating effect of exfiltrative airflow, may increase the DPD values to even above zero obstructing the accumulation of moisture.
The critical location in such a wall locates at the warm side of the facing of the MW sheathing, as the RH may rise to over 95% there. Despite this, significant moisture accumulation was not observed, and the MI levels remained within safe limits. Even though MW is not biodegradable, mold can grow in it, as pointed out by Hyvarinen et al. (2002), using dust as a source of nutrients (Klamer et al., 2004). Thus, considering the high RH level, it is appropriate to minimize dust infiltration into the insulation space using dustproof facings such as the one in the HI wall (DuPont, 2021). The adequate performance of the HI wall is largely explained by the observed path of airflow inside the wall, which indicates that the air exfiltration does not penetrate into the MW sheathing. The humid air moves laterally on the warm face of the sheathing toward the outflow, and diffusion is the only mechanism that transfer moisture directly through the sheathing. A rigid and airtight MW is recommended for the parts of the building envelope outside the wall frame. An additional benefit of such a sheathing is that it can even decrease the sensitivity of the interior air barrier to defects in terms of air exfiltration. Rigid MW board seems to retain this property even if there is a small hole on its facing. The hygroscopicity of such a product is higher compared to soft MW, and, thus, the sheathing may also act as a moisture buffer against exfiltrating humidity.
With an insulating exterior sheathing, the use of an additional, more rigid sheathing board may be required to stiffen the wall. As the results show that the performance of the wall with a combination of EGS and MW sheathing is worse compared to that of the wall with only a MW sheathing, the use of a more vapor tight sheathing on the warm side of the MW sheathing is not recommended. The results suggest that both PE and PA foils function properly as the vapor control layer for the wall.
The role of a meticulous construction practices is pivotal. The experiments showed how even a single 1 × 1 cm2 sized defect in the air barrier combined with a small hole in the EGS caused significant exfiltration when there was a pressure difference of 10 Pa across the wall. Exfiltration may occur only if there is an open path for the airflow that extends through the entire wall. Considering the findings of Langmans et al. (2012), however, interior airtightness is the primary option to prevent exfiltration. Another example is the thick cavity insulation typical to HI assemblies, which is easily prone to installation errors. The vertical air gaps that may arise in the outer section of the framing cavity increase the heat loss at the wall frame by 6%, but their effect to the hygric performance is limited. A gap between the stud and the cavity insulation that allows indoor humidity to transfer directly to the exterior sheathing, however, aggravates the hygric conditions. To avoid installation defects, it is recommended to insulate the framing cavity with about 100-mm-thick insulation boards if the exterior sheathing is already in place. In this context, it is also important to use a dense fastener spacing (0.3–0.4 m) for the exterior MW sheathing to improve exterior airtightness of the wall by a tight connection to the stud.
The functionality of the wall with an EGS and a low Γ value is more case-specific. RH may increase rapidly to 90%–100% in a wall with a Γ value of about 1% subjected to concentrated air leaks of at least 1 L/min regardless of the thermal transmittance of the wall. Slight mold growth may develop in autumn or spring on the EGS because of such an air leak, but the growth can be mitigated by selecting more robust exterior sheathing materials (e.g. a gypsum board with a fiberglass facing (Tuominen et al., 2019)). Another option is to increase the Γ value. A Γ value of 10% already improves the performance of the wall significantly, which coincides with the results of Ojanen and Kumaran (1995). Without such measures, an analysis about the mold survival over the winter is justified. Such assessments are complicated (Robinson, 2001) but necessary in climates with recurring cold periods when determining the probability of gradually developing mold damage from air exfiltration.
The developed DPD-method was found to describe the rate of moisture accumulation from exfiltration rather well, and the method may be applied to three-dimensional cases and other structures like roofs. The value of DPD may be as low as −2°C before significant moisture accumulation occurs. The numerical analysis showed that the hygric performance of HI and BL walls with a Γ value of 1% is at the same level, as the DPD values in the HI walls are only 0.1–0.3°C lower compared to the BL walls. The other computational analysis showed that it is justified to use 10% higher Γ value in Northern Finland compared to Southern Finland to control the amount of moisture accumulation. The DPD analysis should, however, be considered as an indicative and general method for evaluating the risk of moisture accumulation from exfiltration and designing the Γ value. The feasibility of this method is based on the challenges associated with the numerical models used for solving practical problems, as stated by Hens (2015).
In practice, fluctuating speed and direction of wind may rapidly change the PD across the envelope (Lam, 1996). From a practical point of view, the current experiments with continuous exfiltration loads represent a hypothetical situation, which may arise, for instance, from a faulty operation of the ventilation system, from the stack effect in high spaces, or from constantly high wind speeds. The leakage types studied in the tests were concentrated in terms of defect and flow path, which should be acknowledged when considering the results. For example, a long leakage path may generate a different response, as the humidity has less space to diffuse inside the wall structure perpendicular to the inflow of air. On the other hand, distribution of the leakage rate used (1–3 L/min) evenly to a larger wall area may affect the performance of the walls. The outdoor temperature in the tests is in the range of 1–5°C, while real outdoor temperatures vary constantly and can reach, for example, temperatures under −20°C in Finland, which aggravates the accumulation of moisture compared to the current results. However, at the same time, subzero temperatures prevent mold growth. Considering the elevated level of indoor RH used in the experiments, and the fact that snow infiltration is significantly less than rain infiltration would be at temperatures below zero, walls that have high Γ values are expected to perform well under the moisture loads and weather conditions that occur in practice.
Conclusions
Although the hygric risks associated with exfiltration are well known, in practice, building envelopes comprises defects that impair their local airtightness and may compromise the functionality of the structures. The results support the importance of both interior and exterior airtightness for preventing air exfiltration. Airtightness is always required for the interior side of walls that have an air-permeable MW insulation, while the exterior sealing complements the envelope by helping avoid problematic elements such as leaky junctions. When using MW sheathing, it is recommended to use rigid mineral wool, which, together with the airtight facing of the sheathing, hinders air exfiltration. Meticulous installation of the cavity insulation and the exterior sheathing serve the same purpose.
A thick MW insulation of an external wall alone does not explain the moisture problems caused by exfiltration because the hygric performance of the outmost section of the thermal insulation layer is practically independent of the U value of the wall and depends more on the thermal resistance of the exterior sheathing. Increasing it enhances the tolerance of faults and helps achieve DPD values of near zero, as the DPD method that was developed in this study predicts excessive moisture accumulation from concentrated air leakages only when the DPD values are less than −2°C. Based on the results obtained, the minimum Γ value recommended for a HI external wall is 10%. A wall with a Γ value of 20% can withstand the intrusion of indoor air that has an RH of 50% at a rate of 1–3 L/min for more than 100 days without virtually any mold damage. A wall with an EGS comprises a Γ value of only 1% and has a low resistance to exfiltration humidity, as diffusion alone generates rather significant RH levels of 67%–83% at the interior face of EGS. Visible mold damage developed in such a wall within 40 days with an air leakage rate 1–2 L/min and an indoor air RH of 50%. Thus, an HI wall with an EGS may perform satisfactorily only if additional insulation is used at the outer side of the EGS (e.g. 50-mm MW board), a more robust type of EGS is used, or in the absence of air leakages. The performance of air-permeable walls depends partially on the effect of the outdoor temperature on mold damage. A significant mold damage from exfiltration may require cumulative mold growth over several consecutive spring and autumn seasons, in which case, the survival of mold over winter and summer in less favorable hygrothermal conditions is a crucial aspect.
This study suggests the following measures to improve the durability and functionality of HI external walls regarding the moisture risks created by exfiltrating airflows:
Maintain the indoor RH at a maximum of 40% during the cold season (e.g. assure adequate ventilation and avoid excessive humidification of the indoor air).
Use insulating sheathing, which has a Γ value of at least 10%.
Use air and dustproof sheathing membranes and sheathing boards.
Avoid even the existence of a single defect like a 1 × 1 cm hole in the air barrier layer.
Meticulously install soft MW into the framing cavity and rigid MW against the wall frame.
The results also encourage further studies on the performance of a HI external wall equipped with a rigid exterior sheathing such as a gypsum board, plywood, or fiber cement board. The long-term performance of walls that are subjected to air exfiltration should be studied with annual weather conditions. Experimental studies are recommended based on the sensitivity of the external envelope performance to various factors, such as the quality of the insulation installation.
Footnotes
Abbreviations and symbols
AH Absolute humidity (g/m3)
BL Baseline
DPD Dew point depression (°C)
DT Dimensionless temperature (−)
EGS Exterior gypsum sheathing
EPS Expanded polystyrene
GW Glass wool
HDD Heating degree days
HI Highly insulated
MC Moisture content (wt%)
MCM Moisture content mapping
ME Moisture excess (g/m3)
MI Mold index (−)
MW Mineral wool
OSB Oriented strand board
PA Polyamide
PD Pressure difference (Pa)
PE Polyethylene
ppm Parts per million
R Thermal resistance (m2K/W)
RH Relative humidity (%)
Sd Water vapor diffusion equivalent air layer thickness (m)
SFB Soft fiber board
SW Stone wool
U Thermal transmittance (W/m2K)
WB Wind barrier
WFB Wood fiber board
XPS Extruded polystyrene
Γ Exterior insulation ratio (−) or (%)
μ Water vapor diffusion resistance factor (−)
Appendix 1
Appendix 2
Authors’ Note
Klaus Viljanen is also affiliated to Ramboll Finland Oy, Espoo, Finland and Xiaoshu Lu is also affiliated to Department of Electrical Engineering and Energy Technology, University of Vaasa, Vaasa, Finland; School of Environment and Energy Engineering, Beijing University of Civil Engineering and Architecture, Beijing, China.
Declaration of conflicting interest
The author(s) declared no potential conflicts of interest with respect to the research, authorship, and/or publication of this article.
Funding
The author(s) disclosed receipt of the following financial support for the research, authorship and/or publication of this article: The research presented in this article was funded by the Ph.D. program of Ramboll Foundation/Ramboll Finland Oy, by the doctoral program position in the Aalto University School of Engineering, and by the incentive grant for the completion of the doctoral studies awarded by the Fabian and Jaakko Ahvenainen Fund.