
Abstract
Some brand drug companies have stymied attempts by generic drug companies to obtain samples of brand drugs needed to develop and gain regulatory approval for their generic products. This conduct, which has been reported in both the US and Canada, raises drug costs to drug plans and other payors and can lessen competition. The literature to date contains little empirical evidence on the prevalence of this conduct, the attendant effects on generic drug market launches and costs incurred by drug payors. This paper addresses these questions for Canada, using data on the drug development projects undertaken by the members of the Canadian Generic Pharmaceutical Association over the period 2015–2019. I found that about 16% of generic drug development projects were delayed due to originator firm efforts to impede access to samples of their drugs. The median generic drug launch delay (among affected drugs) attributable to the challenged conduct was 6 months. The additional costs to drug payors from the resulting delays in generic drug launches over the analysis period was in the order of $284 million, or $57 million annually. This study did not explore the additional generic drug development costs attributable to the challenged conduct.
Introduction
Generic drug companies have for many decades supplied the Canadian market with less expensive interchangeable versions of originator or “brand” drugs. Generic drug prices are now as low as 10% of the price of the interchangeable brand drug. 1 Savings to drug plans and patients who pay out of pocket are thus considerable.
In order to receive regulatory approval to sell a generic drug, a generic drug company must establish, first, that the drug is bioequivalent with the brand version of the drug and, second, that there are no intellectual property (IP) related restrictions on its sale. Health Canada, the Canadian regulatory authority, refers to the brand version of the drug as the Canadian Reference Product or CRP. To establish bioequivalence and to also develop the generic drug, the generic firm requires samples of the CRP.
Generic firms developing products for the Canadian market have reported that some originator firms (the companies that sell or are licensed to sell the CRPs) are impeding generic firms’ access to CRP samples. Originator firms are reported to have impeded CRP access over the last several years, and through a variety of means, including: refusing to directly supply CRPs to generic firms that request them. This can be a flat-out refusal. In other cases, the originator firm will claim that the product is “on backorder” or will provide some other justification. offering to supply CRPs but only at a very high price, well above retail prices. offering to supply CRPs but only if the generic company incurs a large cost to execute the transaction. This could include the acquisition of costly and unnecessary insurance coverage. offering to supply CRPs but only after a lengthy delay. requiring that pharmacies, wholesalers and other distributors not sell the CRP to generic drug companies.
This conduct is evidently not uncommon. An affidavit submitted in a 2017 legal proceeding 2 identified more than 20 drugs in which access to CRPs had been restricted or refused in at least one instance by a wholesaler, or where generic manufacturers have otherwise encountered barriers that prevented or delayed access to CRPs.
This conduct raises two public policy issues. First, this conduct can prolong the originator firm’s period of market exclusivity beyond that permitted by the IP-related provisions of the Patent Act. The result is that drug plans, hospitals and other payors are deprived timely access to lower cost generic drugs. These tactics thus increase originator firm revenues at the expense of drug payors. Second, the conduct can also force the generic firm to pay very high prices for CRP samples. This increases the cost to generic firms of developing their products, potentially lessening competition. The Competition Bureau of Canada and Health Canada have both investigated and warned originator firms that any further obstruction to the manufacture of generic alternatives will not be tolerated.
This issue is evidently not limited to Canada. Generic drug companies developing drugs for the US market have reported similar problems in accessing samples of branded drugs for the purposes of comparative testing. The Commissioner of the U.S. Food and Drug Administration (FDA) issued a statement in May 2018 which called out this practice, stating that it had received more than 150 inquiries about products being denied access to drug samples due to a risk management plan. The FDA published a list of companies appearing to engage in this practice as a measure to enhance transparency. The U.S. Federal Trade Commission issued its own statement soon afterward, which outlined measures to combat the conduct.
In order to provide additional evidence for regulators, the Canadian Generic Pharmaceutical Association (CGPA) commissioned this study to assess, for the Canadian market, the prevalence of these delays caused by the challenged conduct, as well as their consequences. I therefore surveyed the CGPA member companies, Apotex, Teva, Viatris (formally Mylan), Sandoz, Pharmascience, Auro Pharma, Natco, Marcan, Taro and Fresenius-Kabi, for information needed to estimate the prevalence of the challenged conduct, the impact on generic drug launch timing, and the additional costs to drug plans and other payors arising from these delays. I did not survey generic firms operating in Canada that are not CGPA members. The CGPA reports, however, that its member firms are responsible for approximately 85% of generic product development in Canada.
Methods
I requested from each company detailed data on each product whose development at some point over the 5-year period 2015–2019, inclusive, was delayed on account of the challenged originator firm conduct. In particular, I asked the companies to indicate the timing of the following three development milestones of these affected products: 1) submission of an Abbreviated New Drug Submission (ANDS) to Health Canada; 2) notification that Health Canada is satisfied that the generic is bioequivalent to the CRP and can be marketed (assuming that there are no provisions of the Patent Act that would prevent market authorization); and 3) Health Canada’s issuance of a Notice of Compliance (or NOC), which indicates that the generic is both bioequivalent and there are no Patent Act provisions that would prevent its market authorization. The ANDS is a dossier that contains inter alia evidence of the generic drug candidate’s bioequivalence with the brand drug. 3 If Health Canada is satisfied that the drug is bioequivalent to the brand drug (and if other product quality related requirements are met) and if there are no IP related barriers to generic market entry, then milestones 2) and 3) coincide and Health Canada will issue a NOC. If the former is true but not the latter (generic is bioequivalent but there are IP barriers) then the generic drug is placed on “patent hold” until the IP protections expire, after which an NOC is issued.
I asked the companies to provide me with the timing of the above three events as they actually transpired and also as they would have transpired in the “but-for” world in which the originator firms had not impeded access to the CRP. The actual and but-for NOC dates are of particular interest – the difference reflects the delays in drug payor access to lower cost generics.
The challenged conduct will delay milestone 1), submission of the ANDS to Health Canada. It is possible, however, that a delay in 1) will not delay NOC dates if there are IP-related restrictions on the issuance of an NOC in the but-for world. It could be the case, for instance, that the challenged conduct delayed milestone 2) by 5 months but even had milestone 2) not been delayed the generic company would have had to wait 5 months for IP protections to expire. In this case, the delays in accessing CRPs would not affect launch timing. A generic firm could conceivably also have manufacturing delays that would delay its market launch irrespective of a delay in milestone 1) due to the challenged conduct.
The surveys to the CGPA members were sent in mid-March 2020. Unfortunately, the survey rollout coincided with the COVID-19 related lockdowns. These lockdowns disrupted international trade which, in turn, forced the personnel at the CGPA member companies who would otherwise have produced the requested data to focus on ensuring the continuity of their drug supply. The result is that the company data on actual and “but for” NOCs was incomplete. An additional complication was that, even without the pandemic-related disruptions, the data on NOC delays for some drugs are censored. Some generic drug development projects are, as of writing, still ongoing and it is difficult to estimate NOC dates with precision. This leaves two options to estimate NOC delays. One is to extrapolate the data from cases where data was complete, to estimate the NOC delays for cases where this information was unavailable. The limitation of this approach is that all but two of the NOC delays were reported by just one company and it is unclear if this company’s experience can be extrapolated to that of the others. The other approach is to set the NOC delay as some percentage of the reported CRP access delay, which was reported in most cases. For instance, if this percentage is 75%, then an 8-month CRP access delay translates into a 6-month NOC delay. I elected to use this approach to impute missing NOC delay values for cases with non-missing CRP access delay values. I set the NOC delay at 60% of the CRP access delay. To impute NOC delay values for cases with missing CRP access delay data, I used the mean of the estimates of the available NOC delays.
To estimate the fraction of drugs under development by each company that were affected by the challenged conduct over the analysis period (2015–2019, inclusive), I needed data on the number of drug development projects undertaken by the companies over this period. To proxy this, I used the Health Canada NOC database 4 to determine the number of NOCs provided over the period 2015–2019, inclusive, to the CGPA member companies that responded to my survey. A “drug” was defined as a unique combination of active ingredient and dosage form (such as olanzapine regular release tablets). Olanzapine regular release tablets and orally disintegrating tablets were thus treated as different drugs. The drug’s NOC date was the earliest NOC date given to all the different approved dosage strengths of the drug. Thus, if the 10 mg strength of olanzapine regular release tablets was approved on October 15, 2015 and the 20 mg strength was approved a month later, the drug’s NOC date was taken to be October 15, 2015. I also restricted my sample to the NOCs for generic drugs in which the CRP holder was an originator drug company, not another generic company.
Next, I estimated the impact of the NOC delays on outpatient drug costs reimbursed by drug payors. The additional costs due to the generic NOC delays are, by definition, payors’ actual spending on the affected drug less what spending would have been in the “but for” world. These additional costs are incurred in each period after the “but for” generic NOC date. Figure 1 below illustrates. The red line represents actual spending on the drug and the blue line represents the “but for” spending. The difference between these lines (the gray area) reflects the additional spending due to the delay in generic market entry.
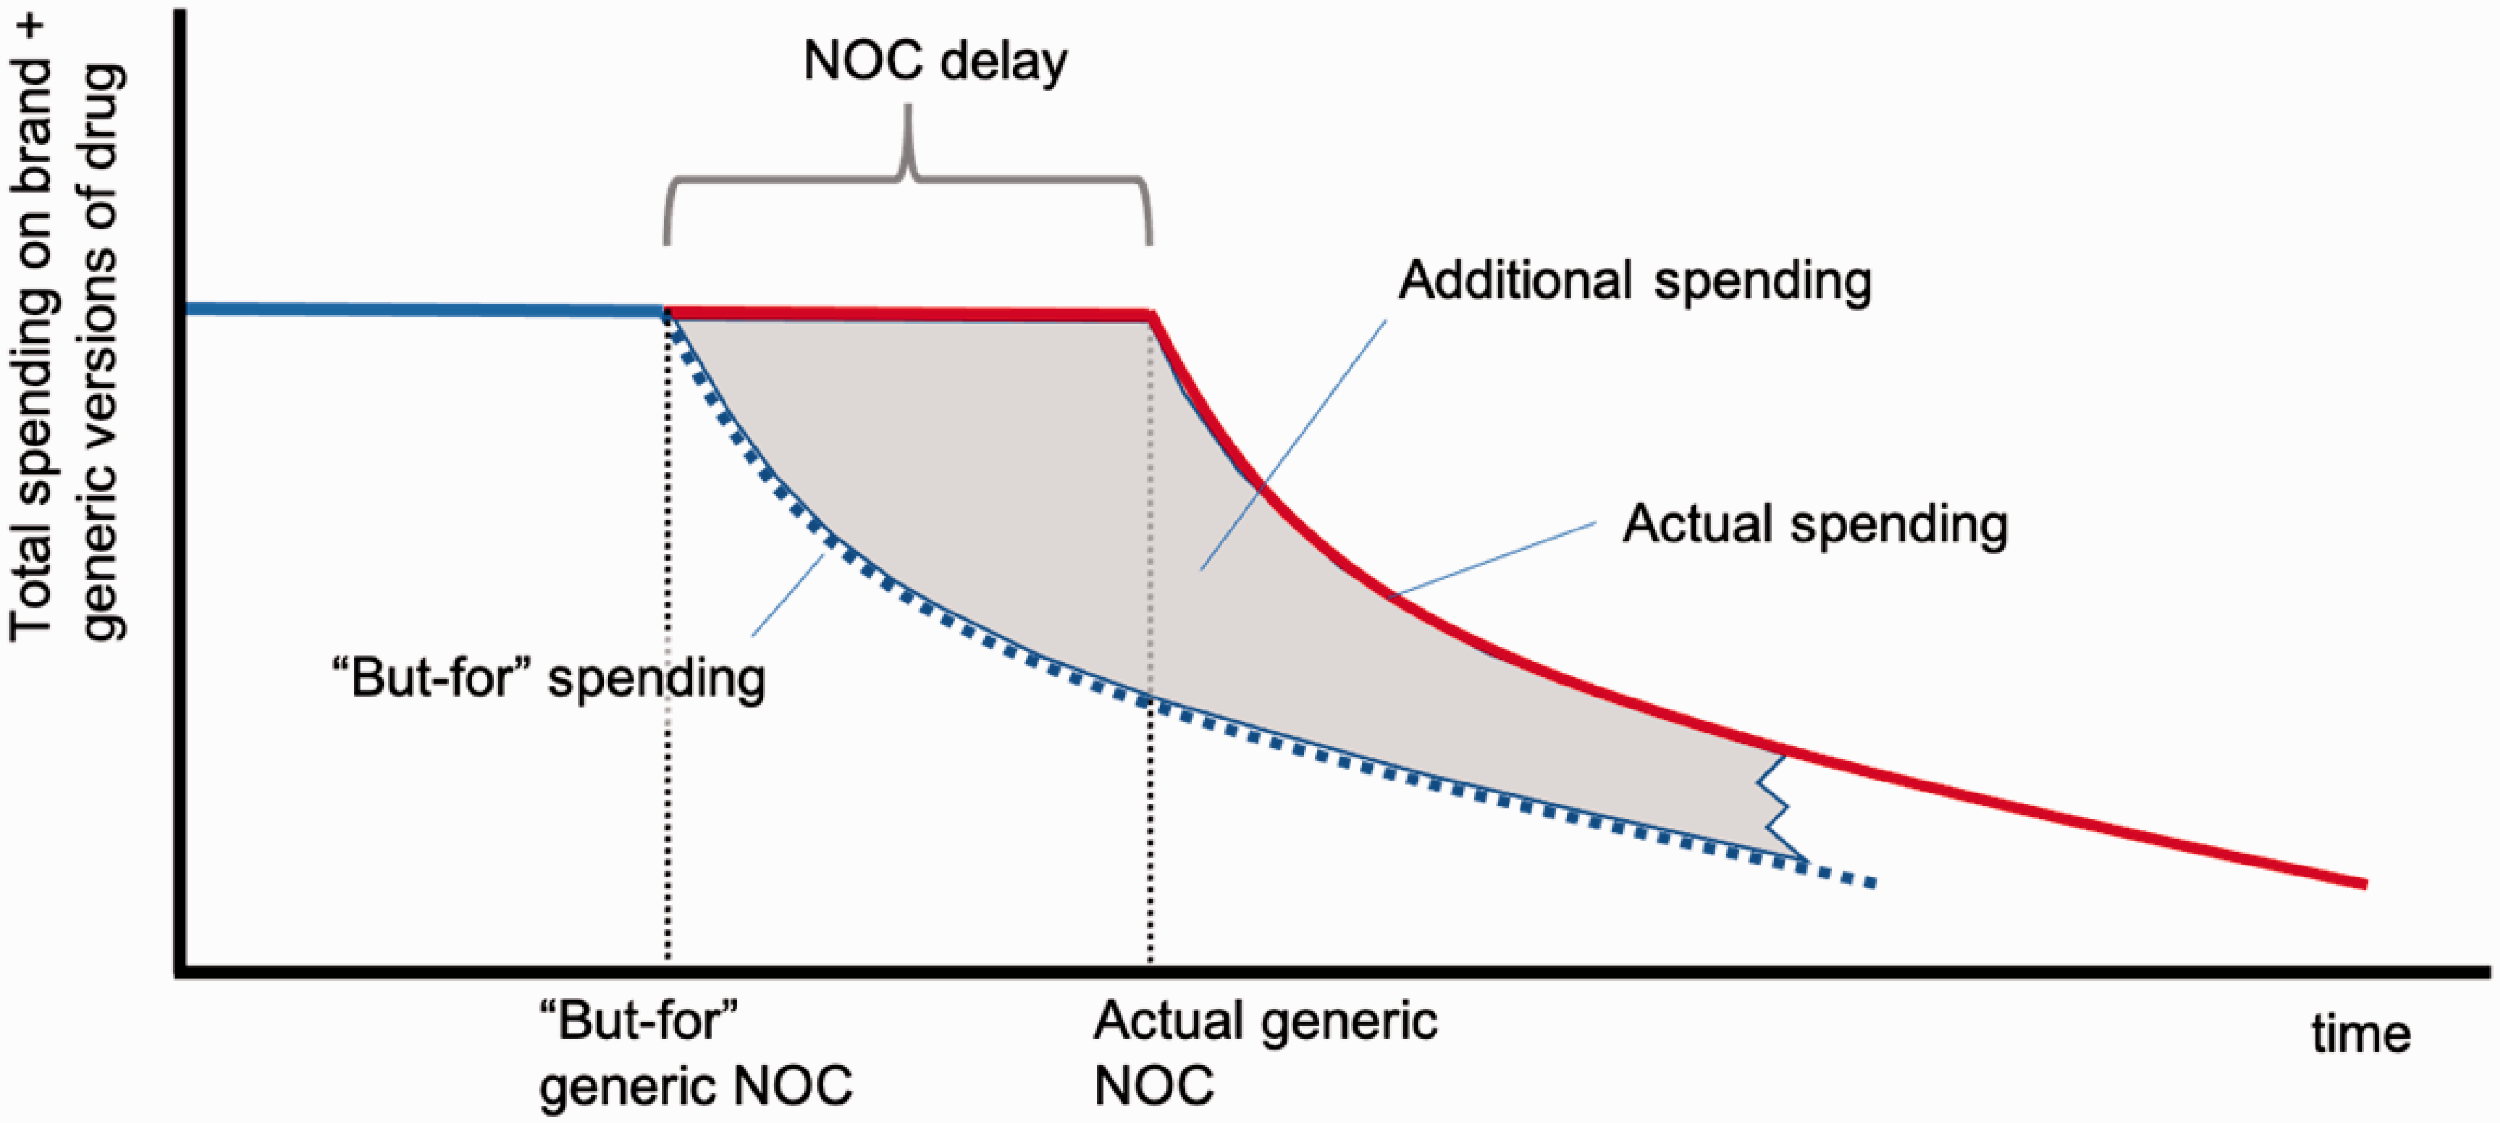
Stylized illustration of actual and “but-for” spending on a drug whose generic NOC was delayed by conduct of originator firm.
The “but for” spending in each period depends on the “but for” generic share of the drug’s unit volume and the generic drug reimbursement price in each period. “But for” spending is lower, the greater is the share of the market captured by generics and the lower is the generic reimbursement price.
In order to estimate the additional spending on a drug – the gray area in Figure 1 – one needs to determine: the period of time over which one calculates the additional spending – starting with the date of the “but for” NOC. Ideally, this time period would end at the point at which the actual and “but for” spending curves are very close. The actual and “but for” unit volumes – how much of the drug was actually sold over the time period defined in 1), and how much would have been sold had the originator firm not restricted generic drug company access to the CRP. The actual and “but for” reimbursement prices per unit of the drug. This is total spending on the drug (including brand and generic versions) divided by total units dispensed.
Determination of 2) above is hampered by the fact that there is insufficient observed data on market unit sales for some drugs in the sample, particularly those whose “but for” NOC would have occurred in late 2019. At the time of writing, the last available data point was in July 2020, and that yields only 7 monthly observations on unit volumes for drugs whose “but for” NOC was in December 2019. Moreover, as noted earlier, there was some uncertainty over the “but for” NOC date. To proceed, I calculated additional spending assuming that all affected drugs would have received their “but for” NOC in January 2019. This provided 19 monthly observations with which to calculate the additional spending. The limitation of this approach is that the actual unit sales during this period might not accurately reflect the unit sales that would have obtained had the correct “but for” NOC date been used. Nevertheless, this approach should not impart too much imprecision if the unit volumes are more or less constant over time.
To further simplify, I assumed that the “but for” unit sales are equal to the actual unit volumes sold over each month of the 19-month period. This assumption is supported by evidence from Canadian drug markets. 5 Using this assumption, the additional spending each month is the number of units of the drug sold in the month times the difference in actual and “but for” unit prices of the drug in the month. I used IQVIA Pharmastat data to estimate unit volumes for each affected drug and for each month from January 2019 to July 2020 (a total of 19 months). The Pharmastat data consist of monthly estimates of national unit and dollar sales of prescription drugs reimbursed by public and private drug plans and dispensed via community pharmacies across Canada. The dollar sales reflect the total amount paid for the prescription, excluding dispensing fees, but including wholesaler and pharmacy mark-ups. Drugs purchased by hospitals are excluded. Evidently the Pharmastat will also exclude prescriptions not paid, at least in part, by a drug plan.
Consider, next, the estimation of the actual less “but for” difference in unit reimbursement prices paid in a month. Again, we face a data limitation: Many of the affected drugs have not yet been genericized. Of those that have, there is insufficient data to directly observe the post generic entry time path of reimbursement prices for the duration of the period defined in 1) above.
To estimate the trajectory of unit prices post generic entry, I estimated the price trajectories of those drugs that were “genericized,” that is, experienced initial generic entry, in Canada during the study period 2015–2019, inclusive. In other words, I assumed that the observed impact of genericization on unit prices for these drugs reflects what the impact of genericization will be or has been for the drugs affected by the challenged conduct, most of whom have not yet been genericized. To produce these estimates, I obtained data on dollar and unit sales of oral solid drugs (tablets and capsules) that were “genericized,” that is, experienced initial generic entry, in Canada during 2015–2019, inclusive. These drug-specific data reflect spending and unit volumes across all manufacturers of the drug (brand and generic) and across all dosage forms. These data were also extracted from IQVIA’s Pharmastat database.
Using these Pharmastat data, I determined, for each genericized drug, the national average reimbursed price per unit for each month before and after initial generic entry. Again, this average price is simply total spending on the drug (across both brand and generic versions) divided by the total number of units (i.e., tablets or capsules) of the drug dispensed. It reflects both the generic share of the total units and difference in reimbursement prices of branded and generic presentations of the same drug.
As before, I defined a “drug” as a unique combination of active ingredient(s) and dosage form. For purposes of defining unique dosage forms, film coated tablets were considered to be interchangeable with standard tablet presentation of the same active ingredient(s). Similarly, film coated capsules were considered to be interchangeable with standard capsule presentation of the same active ingredient(s). Also, all long-acting presentations (delayed release, sustained release, extended release) of the same active ingredient(s) were considered to be interchangeable.
Using these drug and month level data, I modelled, using linear regression, the percentage reductions in drug prices in each month after generic entry. Details of these models are provided in Appendix 1. I estimated these models separately for large markets (brand drug sales in the month prior to generic entry greater than $1 million) and small markets (all other markets). Large markets would be expected to attract a larger number of generic competitors which, in turn, result in larger reductions in reimbursement prices. The reason is that, under the generic drug pricing rules in effect in Canada, the reimbursement price for a new generic drug is lower, the greater the number of generic firms supplying the market. 1
These percentage reduction estimates can be applied to the actual average drug price paid in the month immediately prior to the assumed January 2019 “but-for” NOC date to estimate the average price each month in the “but for” world in which generic entry had not been delayed. To estimate the average price actually paid each month (albeit in the world in which the “but for” NOC was January 2019) I simply shifted the “but for” price schedule by the number of months by which the NOC was delayed. (The procedure to estimate the NOC delays for each affected drug was explained earlier.) The difference in “but for” and actual prices each month depends on the NOC delay. The shorter the delay, the smaller is the additional price paid as Figure 2 illustrates.
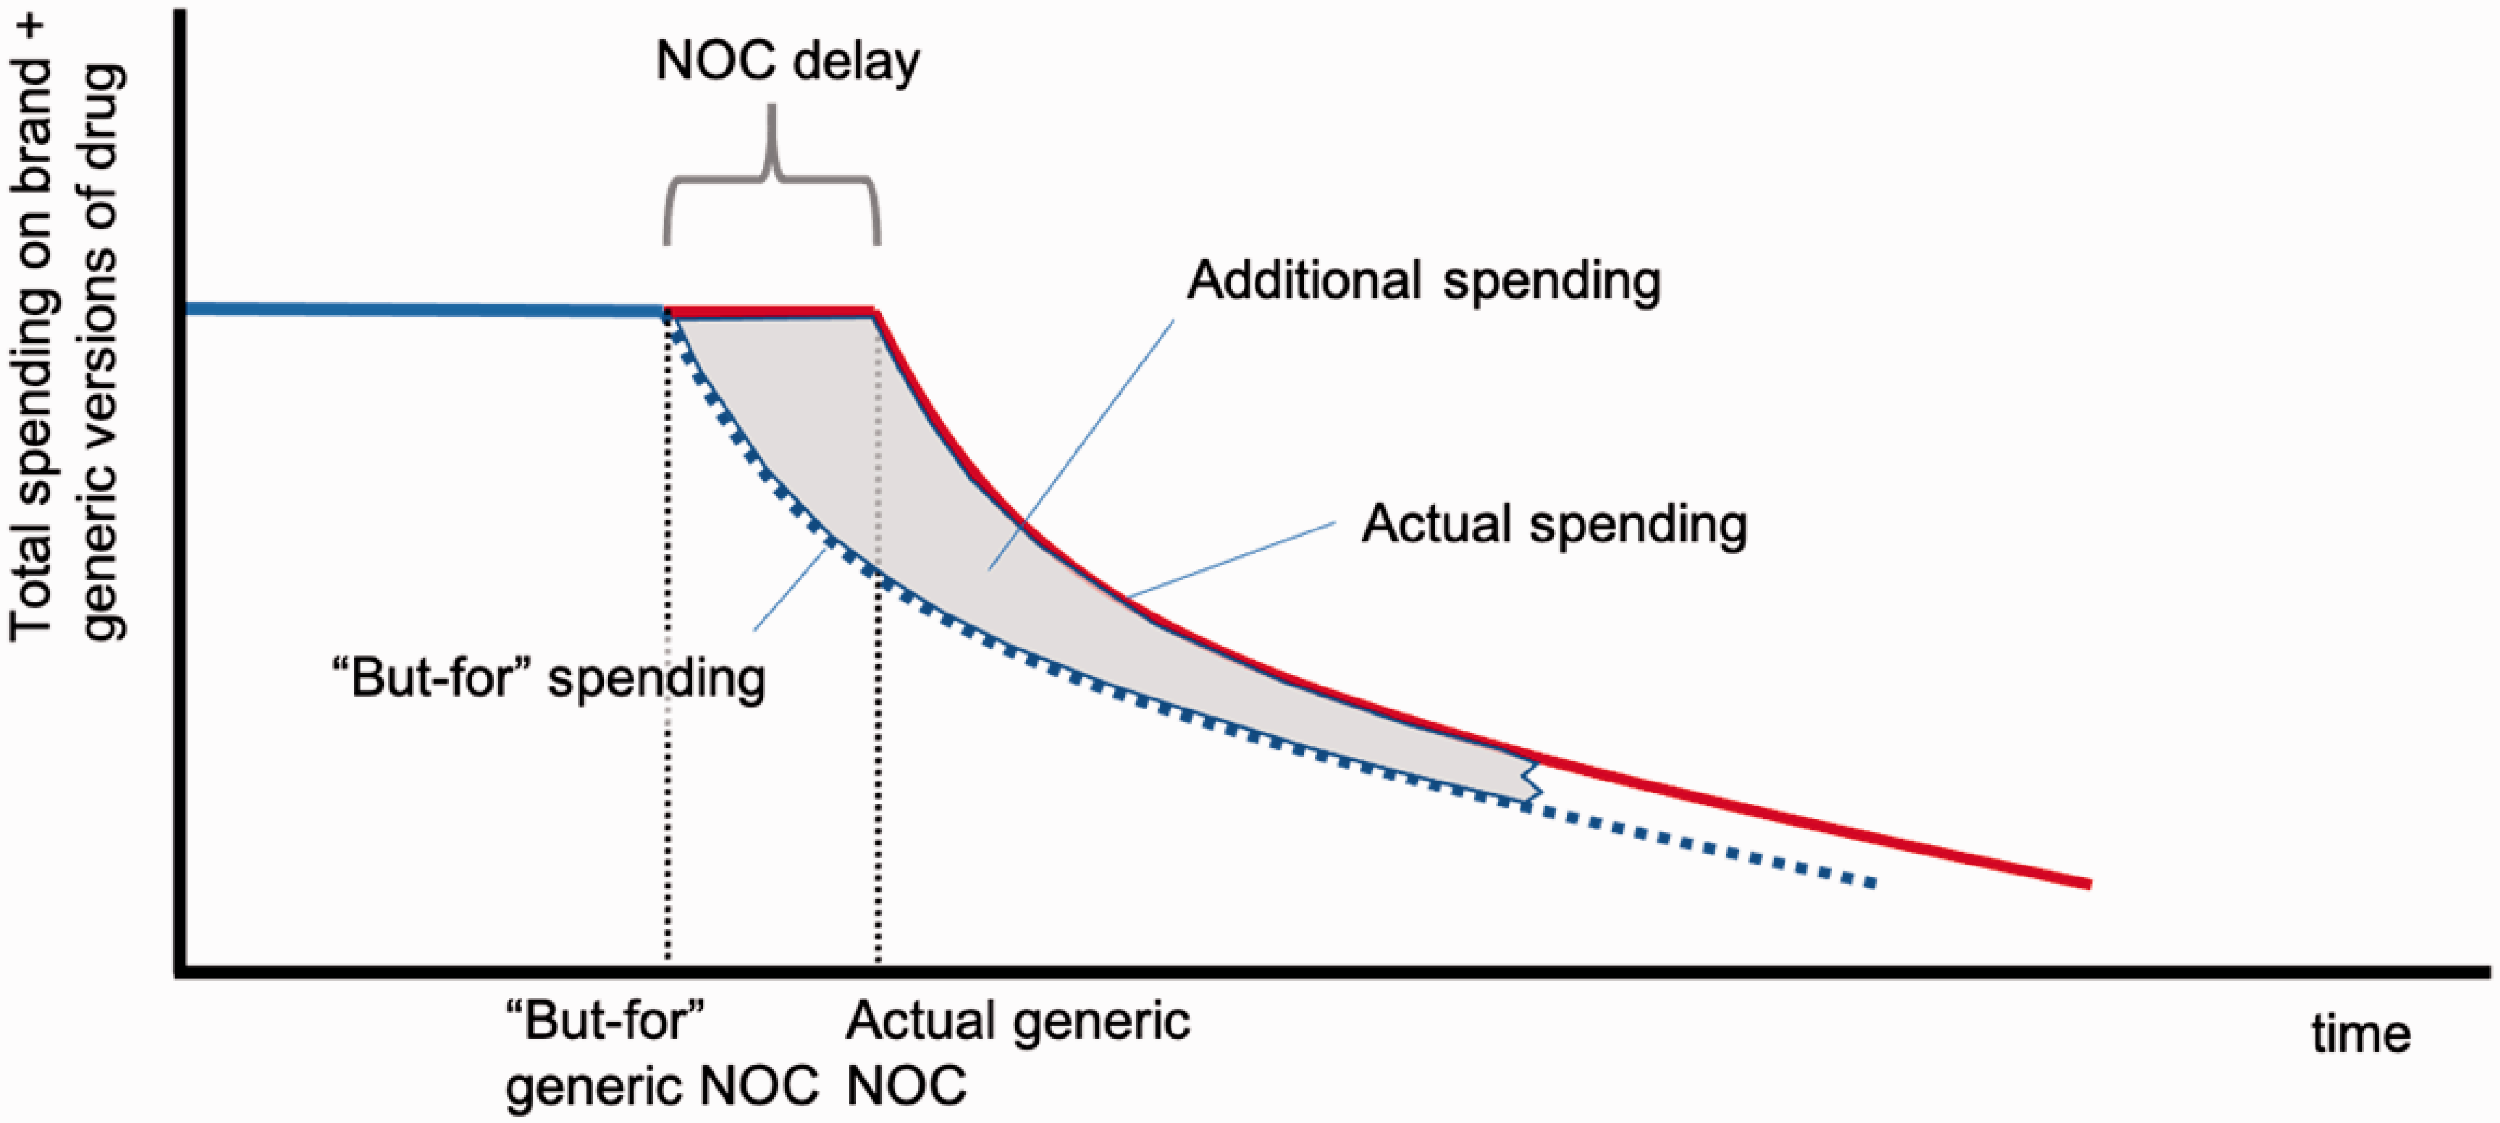
Stylized illustration of actual and “but-for” spending on a drug whose generic NOC was delayed by conduct of originator firm. Relatively short NOC delay.
The savings to payors from the introduction of “biosimilars” – biologics which are highly therapeutically similar to originator biologics – is more difficult to determine. While the generic-for-brand substitution of conventional small molecule drugs is routine and accepted, substitution of biosimilars for originator products is less so. The relative prices of biosimilars for originator products are also higher than that for generic and branded versions of conventional drugs. For these reasons, I do not estimate here the additional spending associated with the delayed entry of biosimilars. I do, however, include biosimilar development projects when tabulating the number of drugs whose development was delayed by the originator company conduct.
To estimate the impact of the generic NOC delays on hospital drug costs, one needs, again, estimates of both “but for” spending and actual spending. I estimated spending assuming a January 2019 “but-for” NOC date and the same NOC delay as that assumed for calculating additional outpatient drug spending. I also assume that hospitals savings accrue the month that the generic launches. I obtained data from the IQVIA Canadian Drugstore and Hospital Purchases Audit (CDH), a survey which contains hospital spending on prescribed drugs. One limitation with these data is that they may overstate actual spending. To wit: hospitals in Canada have formed consortia, better described as purchasing agencies, that procure drugs on behalf of their members. These agencies, which include Mohawk Medbuy and HealthPro, use tenders to encourage companies to offer low prices. Companies have the option of submitting bids in the form of confidential rebates off invoice prices.
These secret rebates complicate estimation of the additional hospital spending given that the IQVIA CDH data reflect invoice prices. Drug companies presumably pay rebates to hospitals once the drug is available as a generic. Drug plans in Canada pay as little as 10% of the price of the interchangeable brand drug for generics so one would imagine that the rebates that hospitals obtain are also substantial. The brand firm might also pay rebates, even prior to generic entry, if the hospital is willing to substitute between therapeutically similar drugs. Suppose that the hospital price is 15% of the brand invoice price once generics are available. Suppose, further, that the hospital price is 90% of the brand invoice price before generics are available. Then the hospital savings after generic entry, are 75% of the brand invoice price. Thus, the larger the brand rebate prior to generic entry, the smaller the savings from generic entry. I assume, conservatively, that the hospital price is 80% of the brand invoice price before generics are available, and 15% thereafter, so that the hospital saves 65% of the brand invoice price upon generic entry.
Results
Eight of the 10 CGPA member companies responded to the survey. These companies reported difficulty in accessing 49 CRPs over the period 2015–19, inclusive. There were 36 unique CRPs on the list, meaning that some of the 49 CRPs were being pursued by multiple companies. Most (33) of these 36 unique CRPs were conventional small molecule drugs; three were biologics. A large fraction of the 49 CRPs were specialty drugs (typically injectables) administered by a healthcare professional; 19 of the 49 CRPs were antineoplastic agents.
I agreed to hold the information supplied to me in confidence. As a result, this report will not divulge the identities of the generic drug candidates whose development was delayed by the challenged conduct.
The originator drug company Celgene was the CRP owner/licensee in 12 of the 49 cases. Pfizer was implicated in 6 of the 49 cases, GSK 4, and Otsuka 3. Amgen, Boehringer Ingelheim, Genzyme, Hospira and Sanofi were implicated in 2 each. The remaining CRPs were controlled by just one brand company.
To estimate the fraction of generic drug development projects that were delayed by the originator company conduct, I needed to estimate the overall number of projects on the go over the analysis period. To that end, I used the NOC database to determine the number of NOCs for different drugs (defined as a unique combination of active ingredient(s) and dosage form) given to the 8 CGPA companies during this time. Thus, this definition treats the NOCs for, say, the sustained release and regular release versions of a particular active ingredient as separate drug development projects.
There were 297 NOCs given, meaning that the 49 generic drug candidates whose progress was delayed by the originator firm conduct represents about 16% of all projects. The companies’ exposure to CRP access delays depends on the specialty share of its drug development portfolio. Thus, some were affected more than others.
Companies produced data on CRP access delays in 30 of the 49 cases. These ranged from 1.5 months to over 4 years. The mean delay was 12.5 months, but the reported delays varied markedly by development project; the standard deviation was 11.6. The median CRP access delay was 9 months.
Companies produced data on NOC delays in 14 of the 49 cases. These ranged from 0 months (no delays) to over 2 years. The mean NOC delay was 8 months, but again the reported delays varied by development project; the standard deviation was 8.75. The median NOC delay was 6 months. The mean of the 49 estimated NOC delays was 6.4 months. The histogram of NOC delays displayed in Figure 3 below.
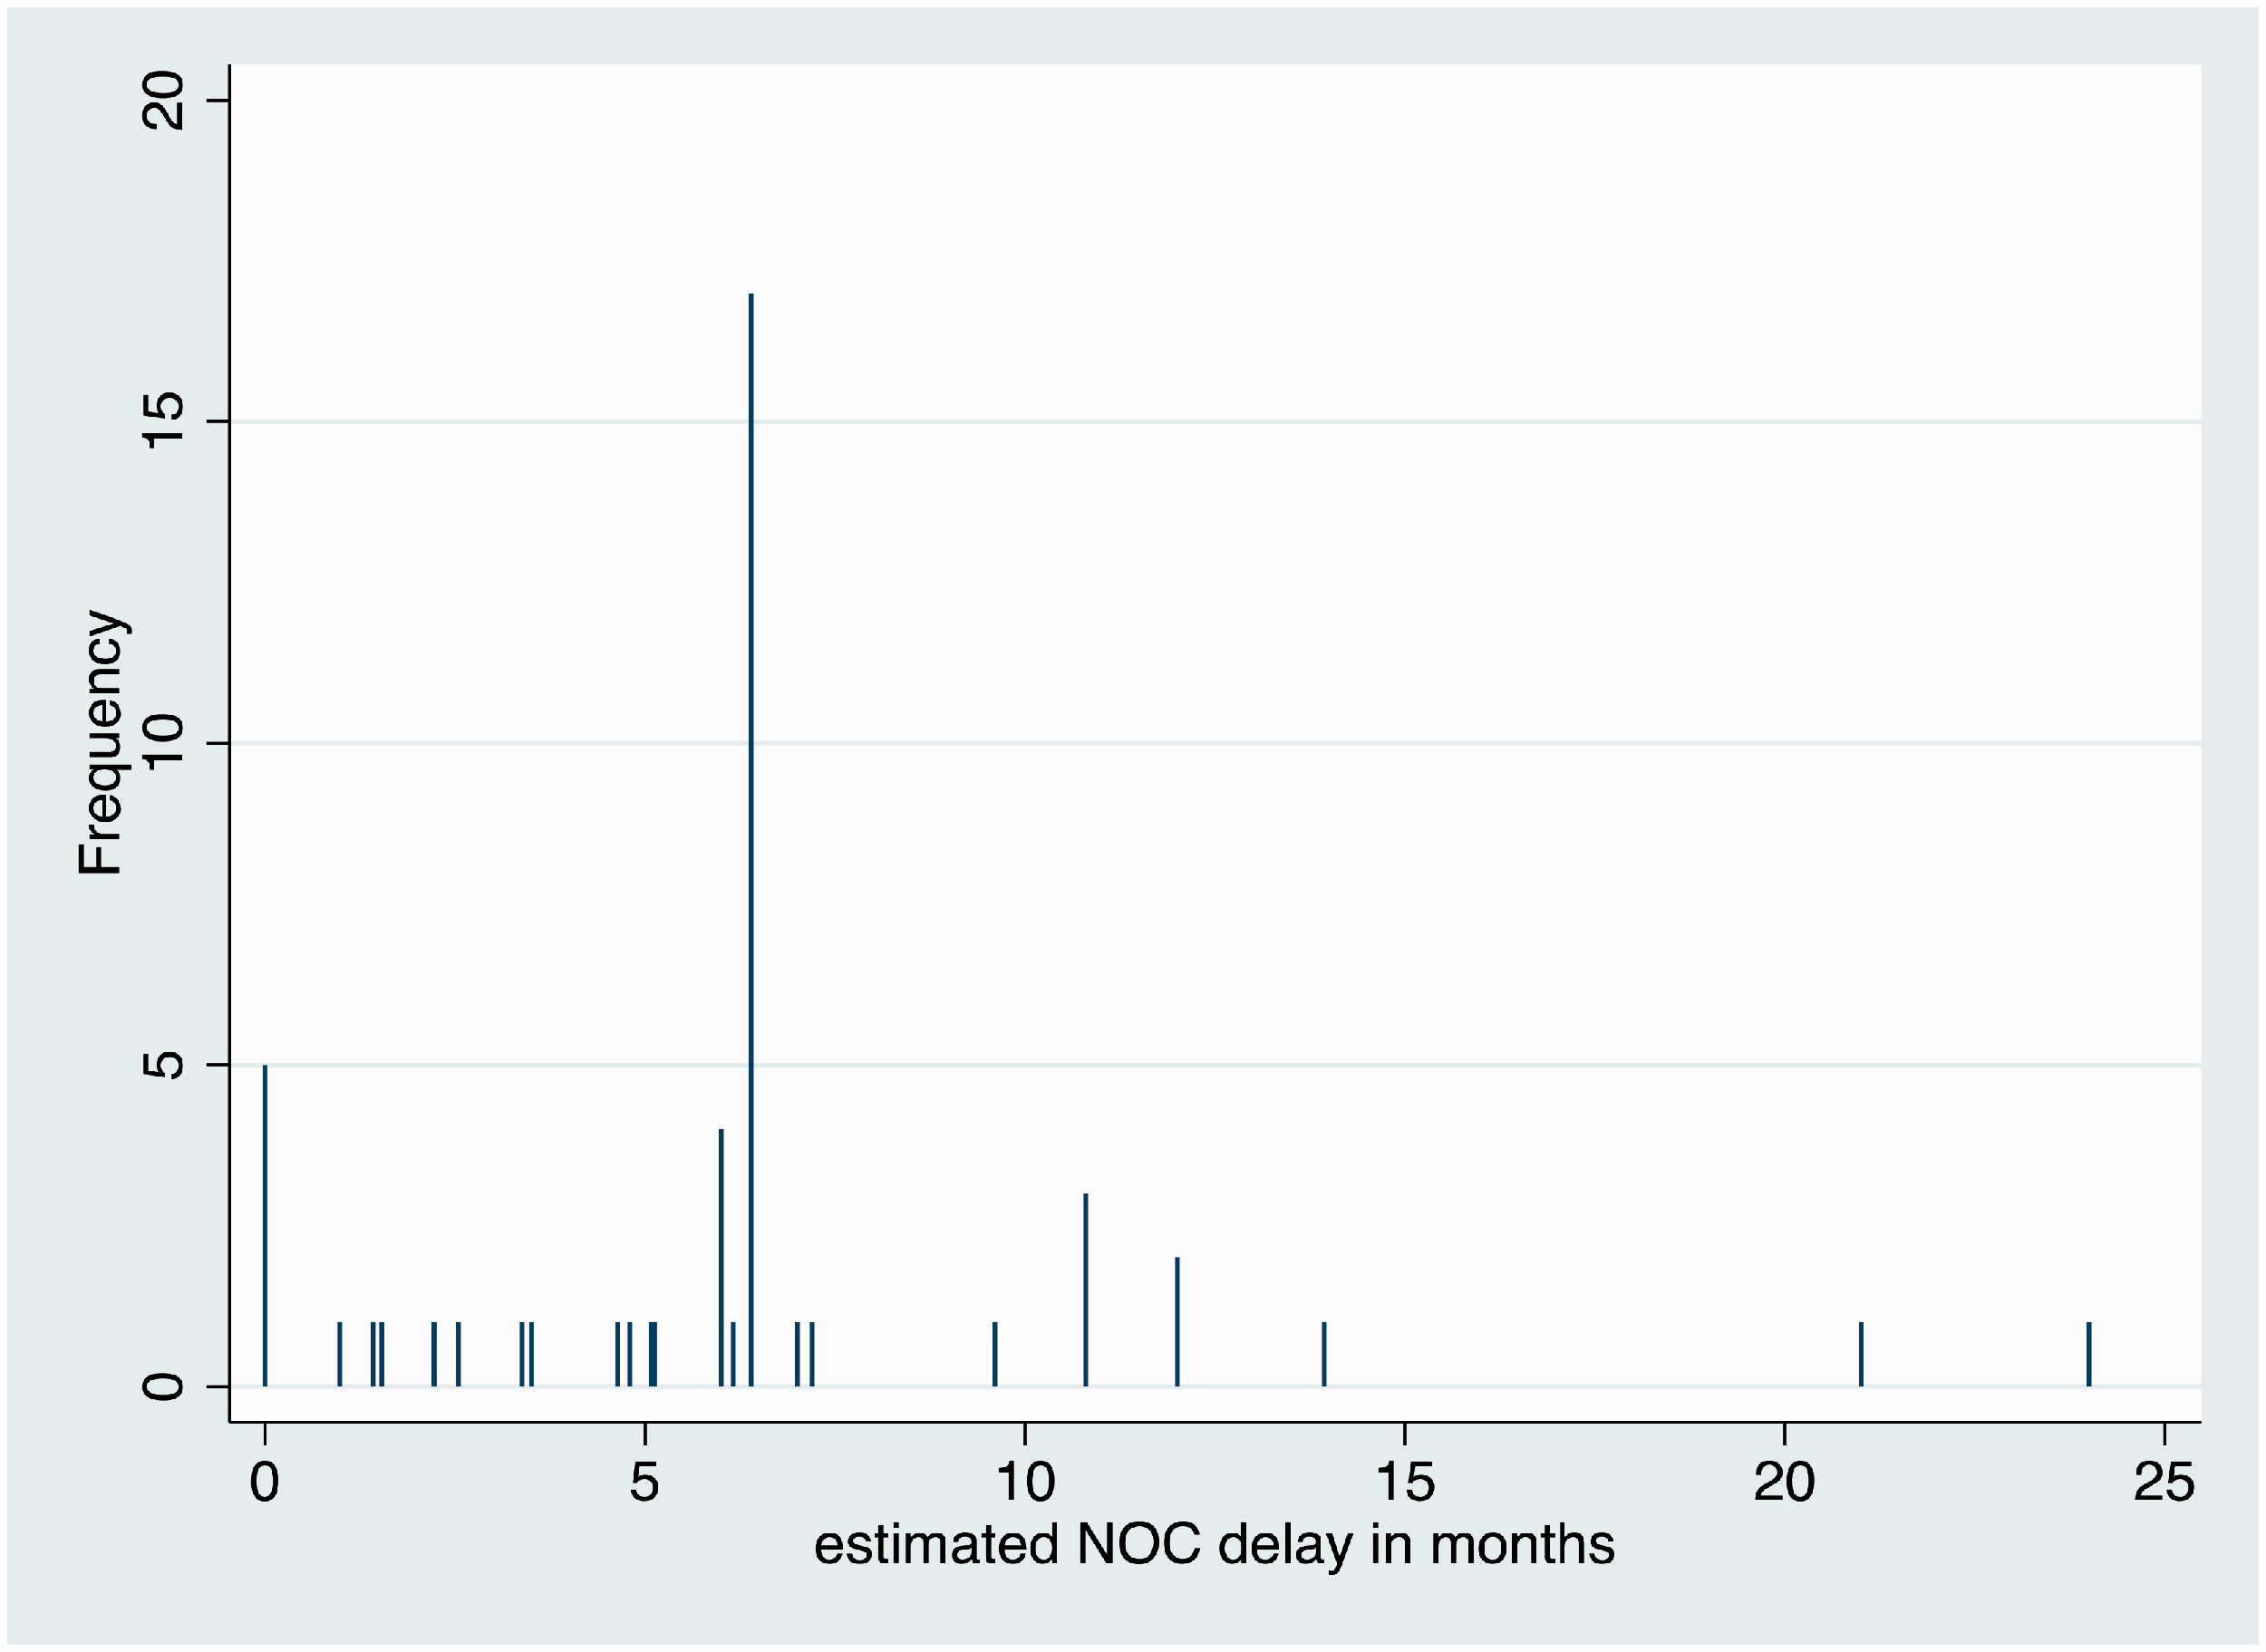
Histogram of estimated NOC delays for the 49 generic drug development projects delayed by originator firm conduct.
I next present the estimation of the impact of the NOC delays on payor costs. I first examined the distribution of NOC delays for each of the different small molecule non-biologic drugs. In most cases there was just one generic firm per drug, but a few drugs – typically those with the largest market sizes – had multiple (as many as 4) companies pursuing generic drug development projects. The shortest estimated NOC delay per drug was used to determine the overall NOC delay for the drug. For purposes of calculating the additional costs to payors, I needed to use an integer number of months delay. Thus, the estimated delay was rounded to the nearest integer. The mean integer-valued NOC delay for the 46 small molecule drugs was 6.5 months; the median was 6 months. The mean NOC delay per unique drug (and again using the shortest of the NOC delays per drug) was 5.4 months; the median remained at 6 months.
Next, using the linear regression approach described in Appendix 1 and the Pharmastat data, I estimated the percentage reduction in the average price per unit paid for a drug, by the number of months after generic entry and by market size. The results are displayed in Table 1 of the Appendix and in Figure 4 below. In smaller markets, those in which the monthly national outpatient expenditures are less than $1 million, the percent reduction is about 20% after one year. For larger markets (monthly national outpatient expenditures greater than $1 million), the percentage price reductions in larger and accrue faster. The average price drops by 40% within six months after generic entry.
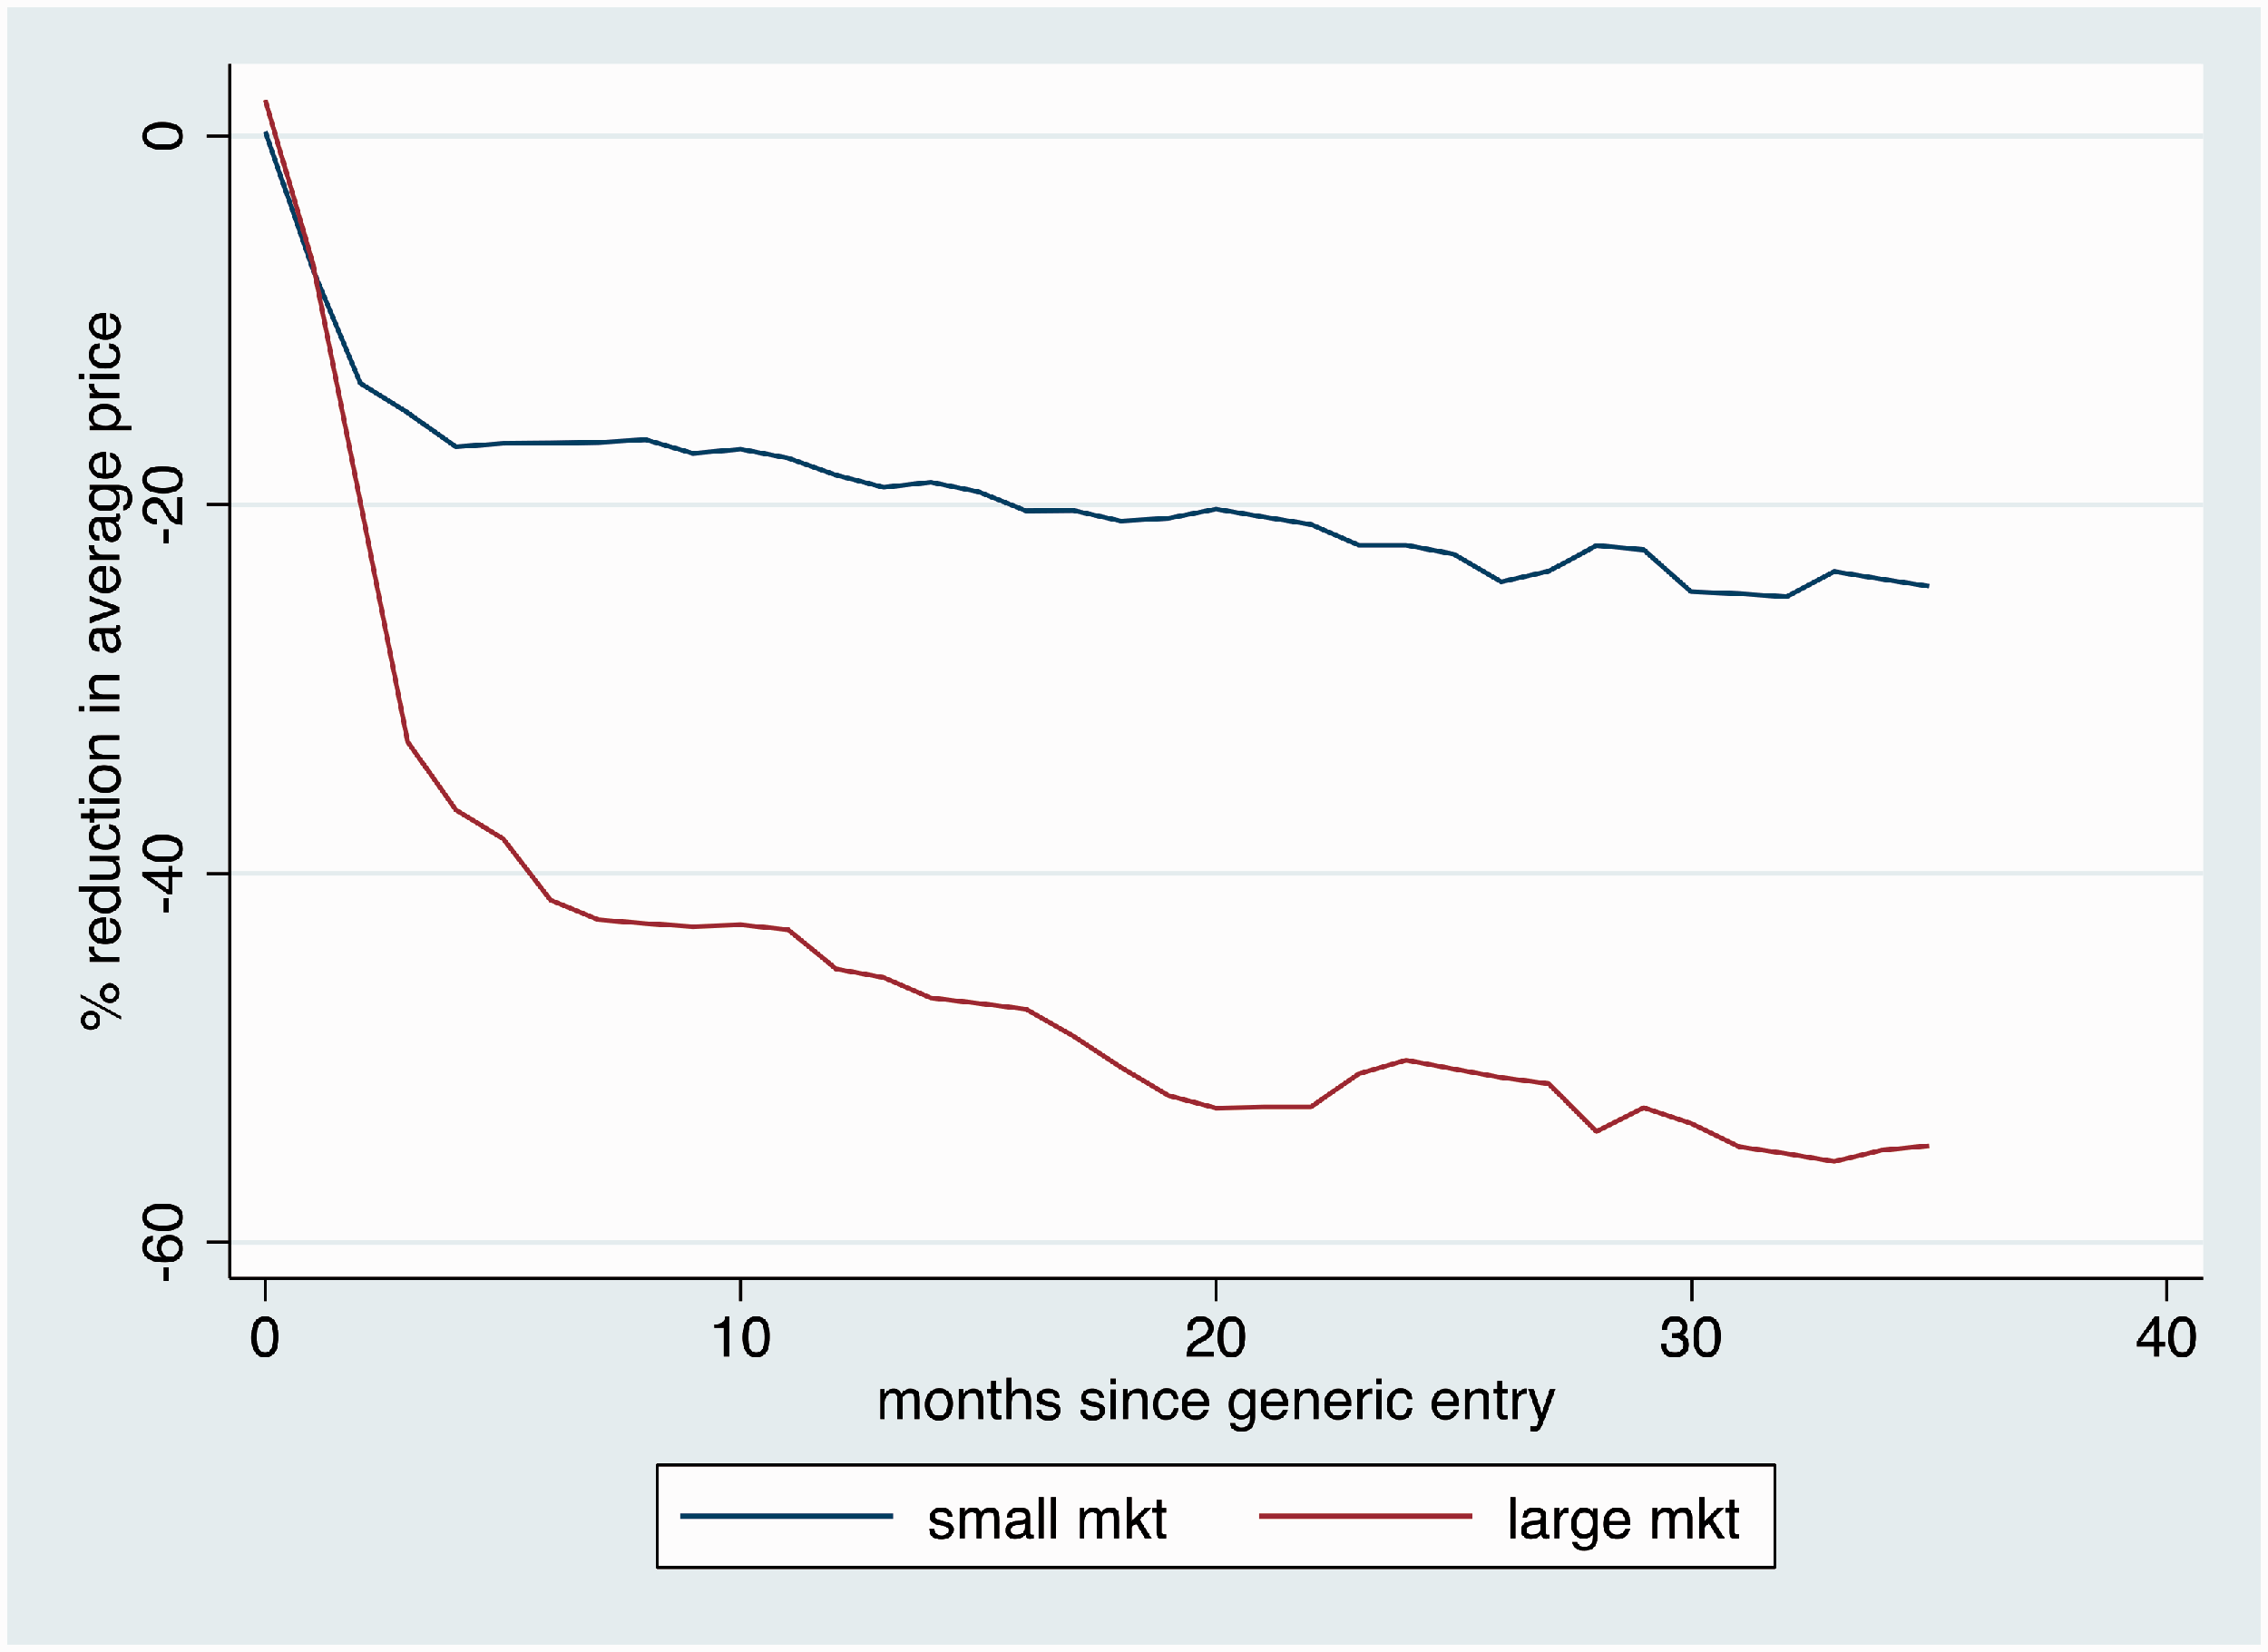
Estimated percentage reduction in average price per unit paid for a drug, by the number of months after generic entry and by market size. Data from IQVIA Pharmastat. Note: small markets are those with less than $1 million monthly national outpatient drug expenditures
Next, I determined for each drug listed on outpatient drug plans, whether total spending on the drug (including the markup but excluding dispensing fees) in December 2018 was greater or less than $1 million. This determined which price discount schedule I used for estimating additional drug plan costs. I then applied the appropriate discount schedule to the average unit price of the brand drug in the month prior to the January 2019 “but for” NOC date to determine the average price schedule each month over the period January 2019 to July 2020. This price schedule reflects the average price that would prevail if generic entry had in fact occurred in January 2019. (This is the “but for” price.) I then constructed the average price schedule given the estimated NOC delay and found the difference in average prices each month over the period January 2019 to July 2020. Figure 5, below, illustrates these price schedules for the case of a brand drug with less than $1 million in spending and a $1 unit price in December 2018 and a 6 month NOC delay.
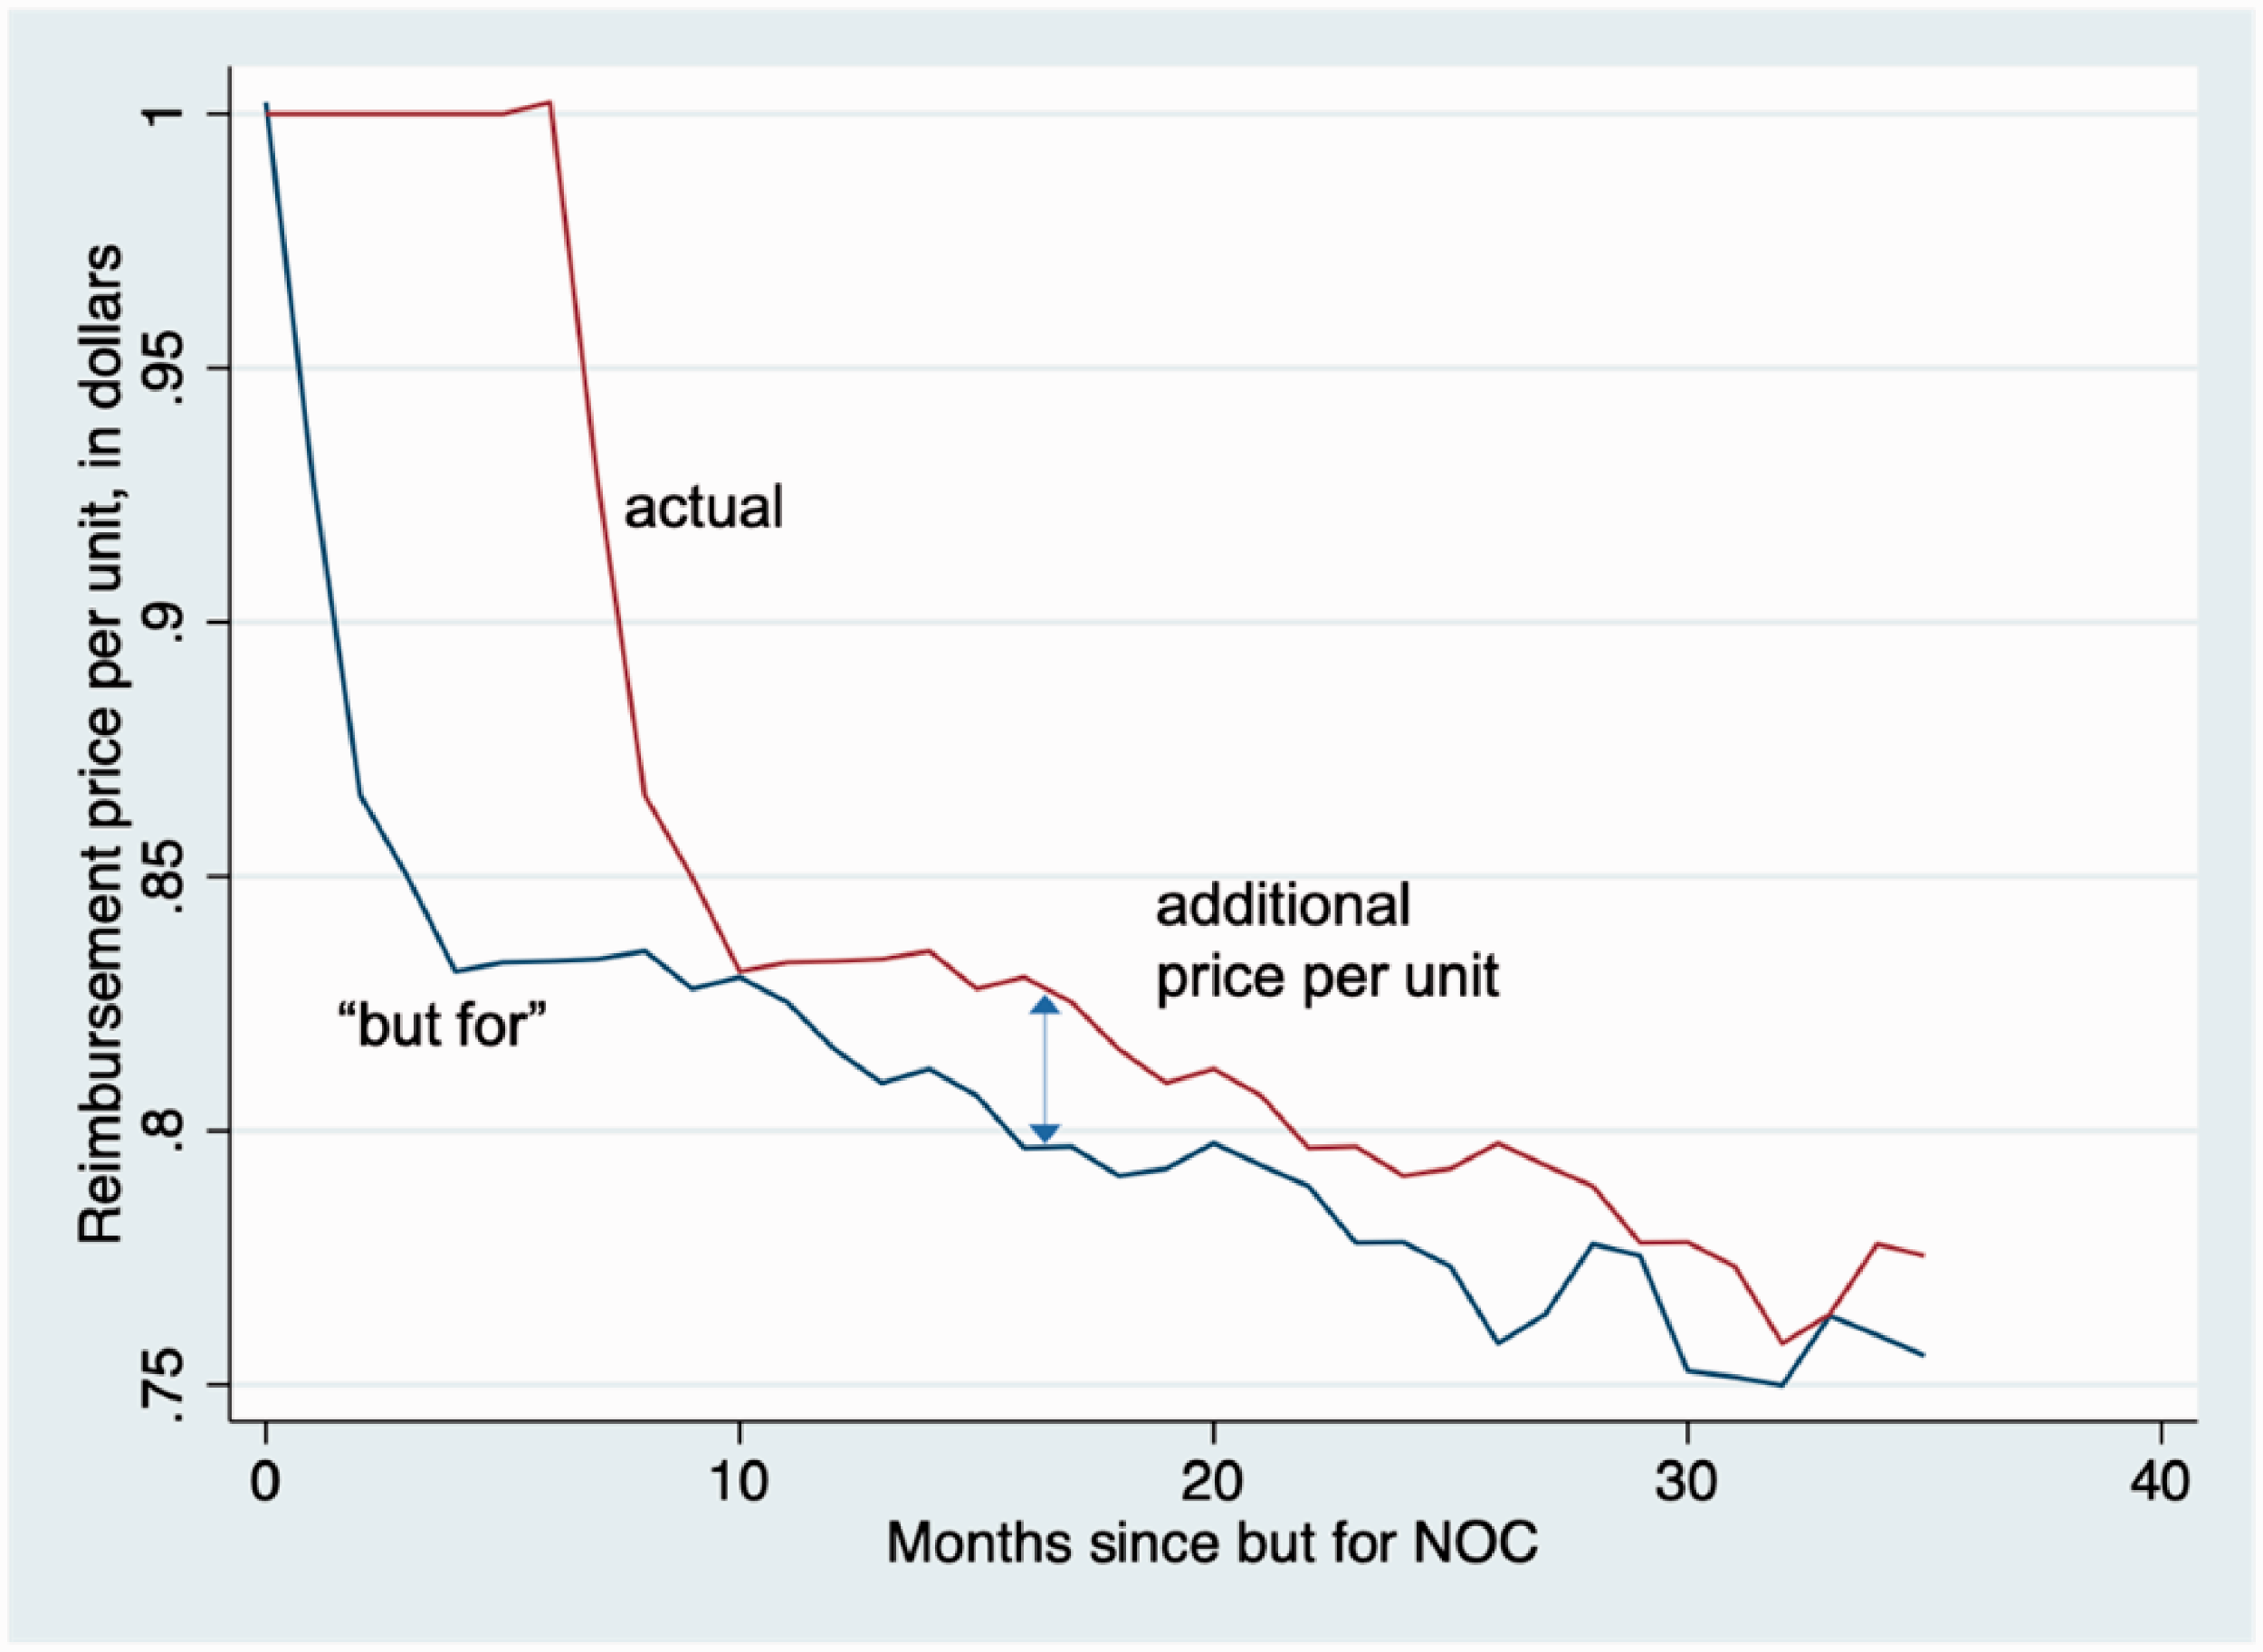
Estimated “but for” and actual price schedule, by the number of months since “but for” generic entry. Data from IQVIA Pharmastat.
This month-specific price difference was multiplied by the number of units reimbursed in each month to determine the additional drug plan spending each month. I then calculated the total additional drug cost to drug plans over the 19-month period.
The additional hospital spending for each of the affected drugs was estimated by applying a 65% discount to spending in each of the months during 2019 and 2020 in which a generic was unavailable on account of the originator firm conduct. For most drugs, the delays were 6 months or less. One drug, however, was delayed 14 months.
The total estimated, undiscounted additional costs incurred by outpatient drug plans in Canada during the 19-month period January 2019 to July 2020 was $195.7 million. The total estimated, undiscounted additional costs incurred by hospitals in Canada during the period January 2019 to February 2020 was $87.9 million. Thus, the cost to drug plan and hospital payors between January 2019 to July 2020 from the NOC delays on generic drug development projects conducted over the five-year analysis period, 2015–2019, is in the order of $284 million. This works out to approximately $57 million annually over the analysis period.
These figures are not intended to be precise estimates of the additional costs to the different payors due to the challenged conduct. As was noted in the methods section, a number of assumptions needed to be made to arrive at this estimate. Moreover, two of the 10 CGPA companies did not provide data, and generic drug companies that are not CGPA members were not surveyed. These figures do not include additional costs incurred by those who do not have insurance coverage. These figures also exclude additional spending due to biosimilar approval delays. (Had I applied the methods to estimate additional costs for conventional drugs to the biologics whose NOC was delayed, then additional outpatient drug spending would be $100.7 million higher.) Despite these caveats, however, the estimate does convey the order of magnitude of the cost consequences of the challenged conduct.
Discussion
Some originator drug companies have stymied attempts by generic drug companies to obtain samples of originator drugs needed to develop and gain regulatory approval for generic products. This conduct, which has been reported by firms operating in both the US and Canada, raises two public policy issues. First, this conduct can prolong the originator firm’s period of market exclusivity beyond that allowed by the country’s intellectual property regime. The result is that drug plans, hospitals and other payors are deprived timely access to lower cost generic drugs. These tactics thus increase originator firm revenues at the expense of drug payors. Second, the conduct can also force the generic firm to pay very high prices for originator drug samples. This increases the cost to generic firms of developing their products, potentially lessening competition.
The literature to date contains little empirical evidence on the prevalence of this conduct, the attendant effects on generic drug market launches and costs incurred by drug payors. This paper addresses these questions for Canada; I gathered data on the generic drug development projects undertaken by the members of the Canadian Generic Pharmaceutical Association (CGPA) over the period 2015–2019 that were affected by the challenged conduct.
I found that about 16% of generic drug development projects were delayed due to originator firm efforts to impede access to samples of their drugs (which in Canada are known as Canadian Reference Products or CRPs). The estimation of the attendant effects on drug launch delays and the effects of these delays on drug payor costs was hampered by incomplete data. I therefore needed to make some assumptions; these assumptions on the whole rendered estimates somewhat conservative. The median generic drug launch delay (among affected drugs) attributable to the challenged conduct was 6 months. The additional costs to drug payors from the resulting delays in generic drug launches over the analysis period was in the order of $284 million, or $57 million annually. This study did not explore the additional generic drug development costs attributable to the challenged conduct.
These findings raise questions about the appropriate regulatory response. The CGPA reports that generic firms continue to report difficulties in obtaining access to originator drug samples. The CGPA position is that, while they welcome the strong commitment to enforcement action from the Competition Bureau and the Notices to Manufacturers issued by Health Canada, these developments do not address the need for Health Canada to make regulatory amendments to provide a mandatory right of access to the originator product samples required by generic pharmaceutical companies for product development.
Footnotes
Declaration of conflicting interests
The author(s) declared the following potential conflicts of interest with respect to the research, authorship, and/or publication of this article: Paul Grootendorst has testified and submitted expert reports in legal cases on behalf of both brand and generic drug companies.
Funding
The author(s) disclosed receipt of the following financial support for the research, authorship, and/or publication of this article:This study was commissioned and funded by the Canadian Generic Pharmaceutical Association (CGPA). Grootendorst thanks Jim Keon and Jody Cox for helpful comments on earlier versions of this manuscript. Any errors are the responsibility of the author.