
Abstract
One common approach for dose optimization is a two-stage design, which initially conducts dose escalation to identify the maximum tolerated dose, followed by a randomization stage where patients are assigned to two or more doses to further assess and compare their risk-benefit profiles to identify the optimal dose. A limitation of this approach is its requirement for a relatively large sample size. To address this challenge, we propose a seamless two-stage design, BARD (Backfill and Adaptive Randomization for Dose Optimization), which incorporates two key features to reduce sample size and shorten trial duration. The first feature is the integration of backfilling into the stage 1 dose escalation, enhancing patient enrollment and data generation without prolonging the trial. The second feature involves seamlessly combining patients treated in stage 1 with those in stage 2, enabled by covariate-adaptive randomization, to inform the optimal dose and thereby reduce the sample size. Our simulation study demonstrates that BARD reduces the sample size, improves the accuracy of identifying the optimal dose, and maintains covariate balance in randomization, allowing for unbiased comparisons between doses. BARD designs offer an efficient solution to meet the dose optimization requirements set by Project Optimus, with software freely available at www.trialdesign.org.
Introduction
Conventionally, phase I dose-finding trials aim to identify the maximum tolerated dose (MTD) under the assumption that both toxicity and efficacy increase with dose. However, this paradigm poses challenges for targeted therapies and immunotherapies, where the monotonicity assumption often doesn’t hold.1,2 For instance, when a targeted agent’s binding is saturated before reaching the MTD, increasing the dose may not improve efficacy further. In such cases, a dose below the MTD may offer a better benefit-risk trade-off by providing similar efficacy with lower toxicity and better tolerability. 3 Recognizing this issue, the United States Food and Drug Administration (FDA) launched Project Optimus 4 to reform the dose selection paradigm. This initiative shifts the focus of dose finding and selection from the MTD to the optimal biological dose (OBD), which delivers the optimal risk-benefit profile.
Numerous methods have been proposed to identify the OBD. Yuan et al. 5 reviewed phase I–II trial designs and discussed critical topics in OBD identification. To better understand these various designs, Yuan et al. 6 classified them into two strategies: the efficacy-integrated strategy and the two-stage strategy. The efficacy-integrated strategy considers the risk-benefit trade-off from the beginning of the trial and uses it to guide the dose finding. Examples of efficacy-integrated designs include the model-based design such as EffTox design and late-onset EffTox,7,8 and model-assisted designs such as BOIN12, BOIN-ET, and uTPI.9–11 Efficacy-integrated designs are efficient for identifying the OBD and are most suitable for cases where the efficacy endpoint can be ascertained relatively quick and also patient population is expected to be similar between dose finding and subsequent phase II trials. A number of clinical trials applied this strategy to find the OBD using EffTox or BOIN12.12–14
The two-stage strategy refers to the approach that first performs dose escalation to identify the MTD and a safe dose range, followed by a randomization stage where patients are randomized between two or more doses to further assess and compare the risk-benefit profiles of these doses for identifying the OBD. Compared with the efficacy-integrated strategy, the two-stage strategy is more flexible, allowing different populations in the two stages (e.g. all-comers in stage 1 and particular indications in stage 2). In addition, randomization also decreases heterogeneity and enables more fair and unbiased comparisons between doses. 15 This approach has been described in the FDA’s guidance on dose optimization. 16 Examples of trial designs using the two-stage strategy include the method by Hoering et al., 17 DROID, 18 and U-BOIN. 19
One limitation of two-stage designs is their requirement for a relatively large sample size due to their structured approach. In stage 1, typical sample sizes for dose escalation often range from 20 to 30 patients, depending on the number of doses (e.g. 4–5 doses). For stage 2, Yang et al. 20 recommended sample sizes of 20 to 40 patients per dose arm to achieve reasonable accuracy in identifying the OBD. As a result, the total sample size required is substantially larger than that in conventional dose-finding trials, leading to increased costs and longer development times.
To address this challenge, we propose a seamless two-stage design, BARD (Backfill and Adaptive Randomization for Dose Optimization), incorporating two key features to reduce sample size and shorten trial duration. The first feature of BARD is the integration of backfilling into stage 1 dose escalation, allowing additional patients to be treated (backfilled) at doses deemed safe and showing promising activity. This concurrent approach enhances patient enrollment and data generation without prolonging the trial duration, thereby better informing the determination of the MTD and OBD. 21 The second feature seamlessly combines patients treated in stage 1 with those in stage 2, significantly reducing the overall sample size requirement. Integrating stage 1 patients, who are not randomized, into stage 2 may compromise covariate balance across doses. To mitigate this, we employ covariate-adaptive randomization in stage 2 to actively address potential imbalances in prognostic factors among stage 1 non-randomized patients. Our simulation study demonstrates that this approach achieves covariate balance comparable with that of fully randomized trials comprising only randomized patients.
Method
BARD consists of two seamless stages: stage 1 conducts dose escalation with backfill, and stage 2 performs covariate-adaptive randomization. The objective of stage 1 is to establish the MTD and provide toxicity and efficacy data, as well as pharmacokinetics and pharmacodynamics data, to select the doses for stage 2 randomization. Depending on the dose escalation method used in stage 1, different versions of BARD can be constructed. We focus on the Bayesian optimal interval design (BOIN) 22 and the Bayesian logistic regression model (BLRM) 23 methods to illustrate the use of model-assisted and model-based dose escalation designs, respectively, while noting that our methodology can readily accommodate other dose escalation methods, such as the keyboard design 24 and the continuous reassessment method. 25
Stage 1 dose escalation with backfill
BOIN with backfill (BF-BOIN)
In this section, we briefly review the BF-BOIN design proposed by Zhao et al., 26 which combines BOIN with backfill. This review is not only for the completeness of the method but also to provide the necessary notation and concepts for the development of BLRM with backfill (BF-BLRM) in the next section.
BF-BOIN uses the same rule as BOIN for dose escalation and de-escalation. Let
If
If
Otherwise, stay at the current dose
For safety, an overdose control rule is applied throughout the dose escalation: if
To conduct backfilling, BF-BOIN adaptively opens and closes a dose for backfilling based on observed interim data as follows. A dose level
(Safety)
(Activity) At least one response is observed at
Here, the response can be any reasonable anti-tumor activity readout, such as objective response, or a surrogate endpoint, such as a pharmacodynamics biomarker, receptor occupancy, or changes in ctDNA.
Dose level
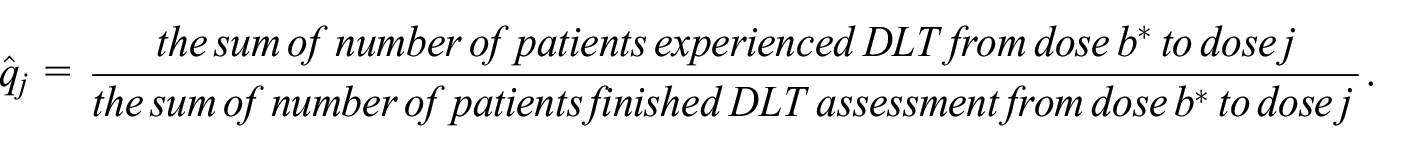
(a) both of the following two conditions are met: The observed DLT rate based on all cumulative patients completed DLT assessment at the pooled DLT rate based on the pooled DLT data over
(b) the number of evaluable patients treated at
The closing rule (a) temporarily closes a dose for backfilling due to its toxicity, while rule (b) permanently closes a dose for backfilling. If dose level
One complication introduced by backfilling is that the new data observed from backfilling patients may conflict with those from dose escalation. Specifically, after integrating the data from backfilled patients, the observed DLT rate at a lower, backfilled dose
Conflict between the current dose of dose-escalation and backfilling doses.
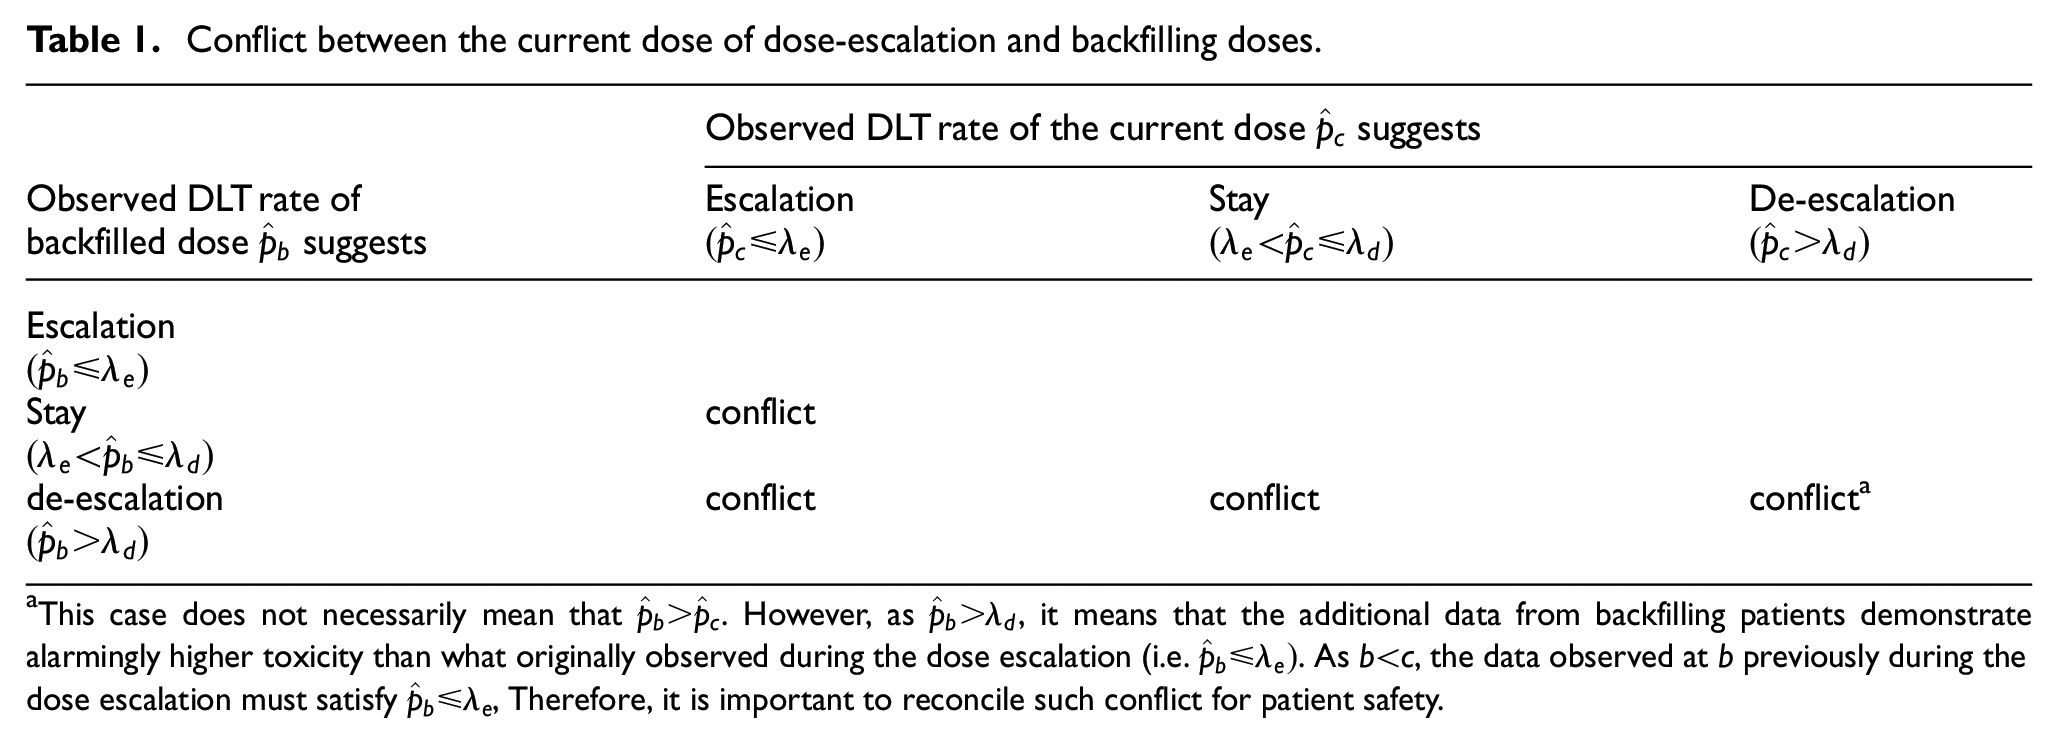
This case does not necessarily mean that
BF-BOIN reconciles the conflicts shown in Table 1 using the following rule. Let
In the presence of the conflict, BF-BOIN uses the following rule to replace the original BOIN rule to determine dose escalation/de-escalation:
If
If
Otherwise, stay at the current dose.
When a new patient is enrolled in the trial, BF-BOIN assigns the patient to dose escalation or backfilling in the following way:
If the current cohort of the dose-escalation has not been filled, the patient will be allocated to that dose-escalation cohort;
Otherwise, the patient will be allocated to a dose that is open for backfilling. If multiple dose levels are open for backfilling, the patient will be assigned to the highest one.
This patient assignment rule prioritizes dose escalation over backfilling, but can be customized based on the trial. Patient enrollment is staggered between cohorts in dose-escalation, and no stagger is necessary in backfilling.
When dose escalation ends (e.g. the prespecified maximum sample size is reached or another stopping rule is satisfied), backfilling stops, and stage 1 ends. At the end of stage 1, an isotonic regression is applied using all the data, and the dose whose isotonic estimated DLT rate is closest to
BLRM with backfill (BF-BLRM)
In this section, we present how to incorporate backfill into BLRM, 23 a model-based design. For convenience, we refer to the resulting design as BF-BLRM. The proposed method is directly applicable to other model-based designs, such as the continuous reassessment method and its extensions.
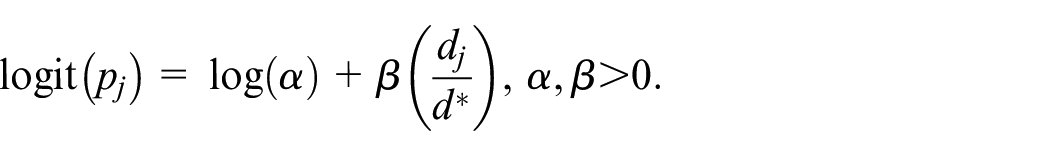
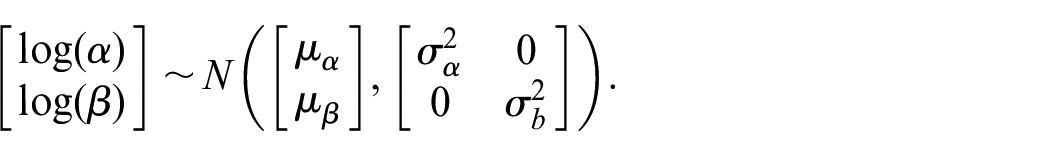
In BF-BLRM, a Bayesian logistic regression model is used to model the dose-toxicity curve. Let
To conduct dose escalation/de-escalation, BF-BLRM specifies an underdose cutoff
Given the observed interim data, BF-BLRM estimates the posterior probability of the target toxicity (PTT) and posterior probability of overdose (POD) as
If
If
Otherwise, stay at the current dose
At any time of the trial, if the POD
BF-BLRM incorporates backfilling into dose escalation similarly to BF-BOIN. Specifically, BF-BLRM adaptively opens and closes a dose level
A dose level
(a) POD for dose
(b) The number of evaluable patients treated at
Patients are assigned to the current dose-escalation cohort or backfilled using the same approach as in BF-BOIN. Guidance on selecting
The BF-BLRM enforces monotonicity in the dose-toxicity relationship by constraining
At the end of stage 1, BF-BLRM selects the MTD based on all data, including dose escalation and backfilling data. The MTD is chosen as the dose that satisfies the following two conditions:
Treated with at least 6 patients,
Has the highest PTT among all doses with POD
Stage 2 with adaptive randomization
Suppose at the end of stage 1, two doses are selected for stage 2 randomization, referred to as
To optimize the dose, the most straightforward approach is to randomize patients to
To address this challenge, we leverage the idea of the Pocock-Simon minimization 32 for stage 2 randomization. Minimization is a widely used covariate-adaptive randomization method that is discussed in the FDA’s guidance on adaptive designs. 33 Our key idea is to randomize stage 2 patients, conditional on stage 1 data, in a covariate-adaptive way to eliminate the covariate imbalance present in the stage 1 data. By doing so, at the end of stage 2, covariates are balanced between the two dose arms. This allows stage 1 and stage 2 data to be combined to better inform dose comparison and the selection of OBD.
Let
Let
When a new patient with
To balance the distribution
It is important to note that the calculation of
Due to the interplay between the two stages, the choice of the sample size cap for backfill in stage 1 (
OBD selection
At the end of stage 2, we identify the OBD based on data from
The first approach implicitly considers the toxicity-efficacy trade-off and selects the OBD as follows:
If
where
The second method explicitly accounts for the toxicity-efficacy trade-off and selects the OBD based on utility. For binary toxicity and efficacy endpoints, each patient can experience one of four possible outcomes: (toxicity, no efficacy), (no toxicity, no efficacy), (toxicity, efficacy), and (no toxicity, efficacy). Let
Utility ascribed to each possible efficacy-toxicity outcome.
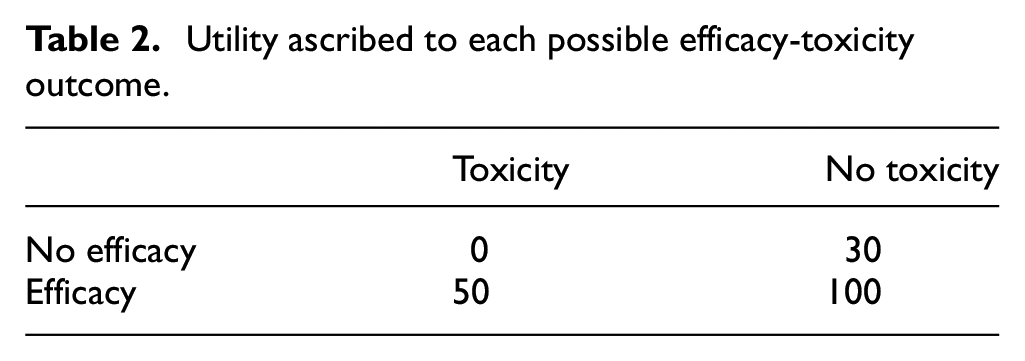
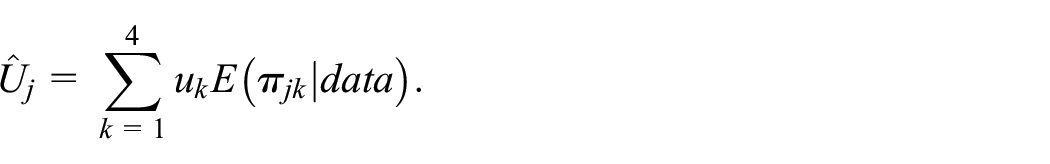
Let
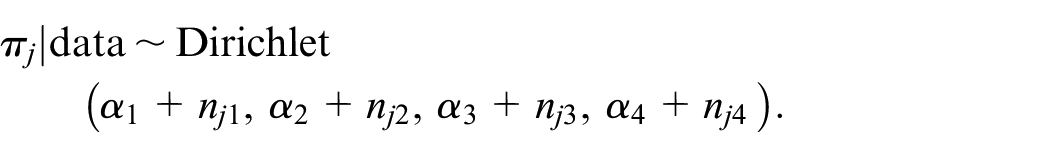
The posterior mean utility of dose
In both approaches, we require that the OBD j also satisfies the following safety and efficacy requirements:
(Safety)
(Efficacy)
where
If only one of
To facilitate the use of the BARD design, software is available at www.trialdesign.org, allowing users to run simulations and conduct trials.
Numerical studies
Simulation setting
We considered a trial where stage 1 aims to find the MTD from 5 doses with a maximum sample size of 30 for dose escalation. The dose escalation starts from the lowest dose, and patients are treated in cohorts of 3. The accrual rate is 3/month, and the DLT assessment window is 1 month. The sample size cap for backfilling is
We compared two BARD designs, BARD-BOIN and BARD-BLRM, with their conventional counterparts, referred to as BOIN-SR and BLRM-SR, where BOIN or BLRM is used for stage 1 dose escalation followed by 1:1 simple randomization. In BOIN-SR and BLRM-SR, stage 1 data are not combined with stage 2 data. Thus, a total of 40 new patients are enrolled and randomized in stage 2 to reach 20 patients per dose arm.
For BARD-BOIN and BOIN-SR, the target DLT rate is set at
For BARD-BLRM and BLRM-SR, the target toxicity interval is set at
The overdose control cutoff is set at
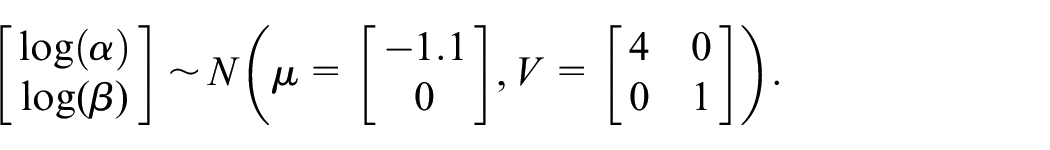
To evaluate the performance of BARD-BOIN and BARD-BLRM in balancing covariates, we assumed three binary prognostic factors
At the end of stage 2, the OBD is identified by the two approaches described previously. In the first efficacy-rate-based approach, we used
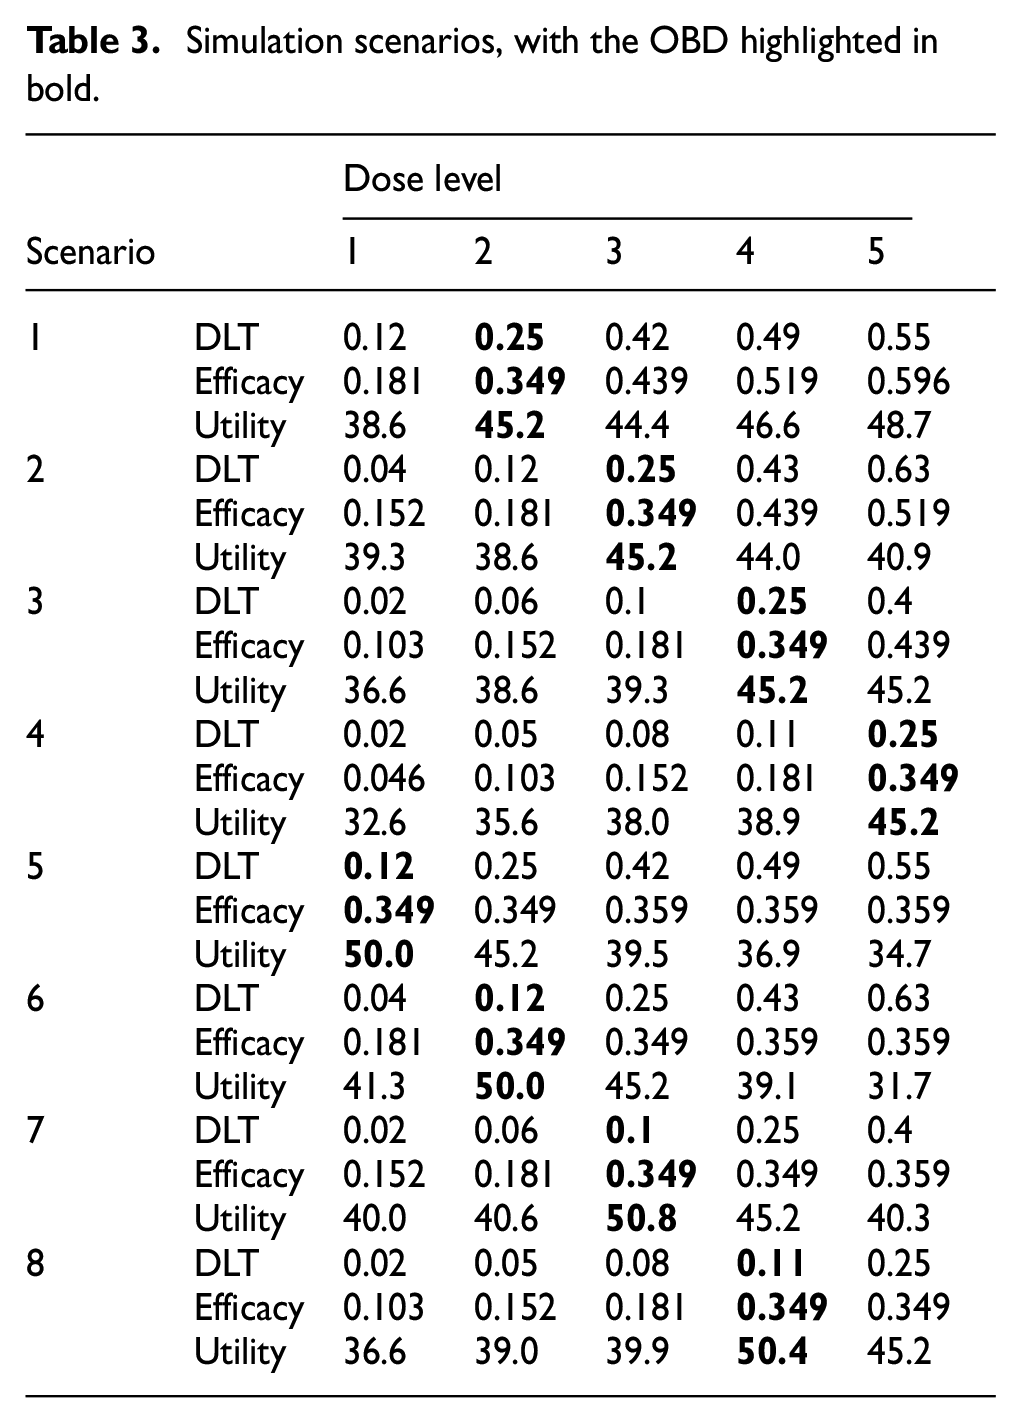
We considered 8 representative scenarios that differ in the toxicity-response curves and the location of the OBD, as presented in Table 3. In scenarios 1–4, the toxicity-response curve is monotone increasing, while in scenarios 5–8, the response rate plateaus below the MTD.
Simulation scenarios, with the OBD highlighted in bold.
The following performance metrics were evaluated based on 30,000 simulated trials.
Average total sample size.
Average trial duration.
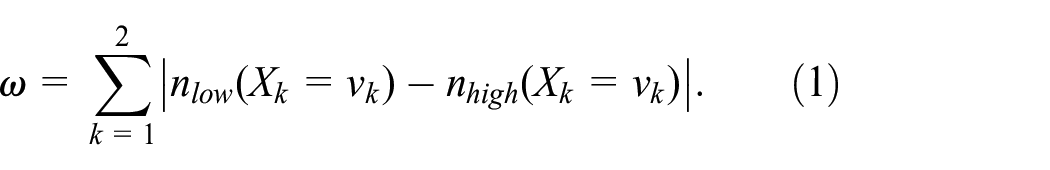
Imbalance index, defined as the absolute difference between the proportion of patients with
Imbalance in allocation, defined as the absolute difference in the number of patients treated at
PCS1: the percentage of correct selection (PCS) of the true OBD based on the efficacy-rate-based approach.
PCS2: the PCS of the true OBD based on the utility approach.
Results
Table 4 summarizes the operating characteristics of the designs. BARD-BOIN outperforms its counterpart, BOIN-SR. Across all eight scenarios, BARD-BOIN reduces the sample size by 10–15 patients and shortens the trial duration by 7–8 months compared with BOIN-SR, because of the integration of stage 1 and stage 2 data. In addition, BARD-BOIN achieves significantly better balance on
Operating characteristics of BARD-BOIN and BARD-BLRM, in comparison with BOIN-SR and BLRM-SR.
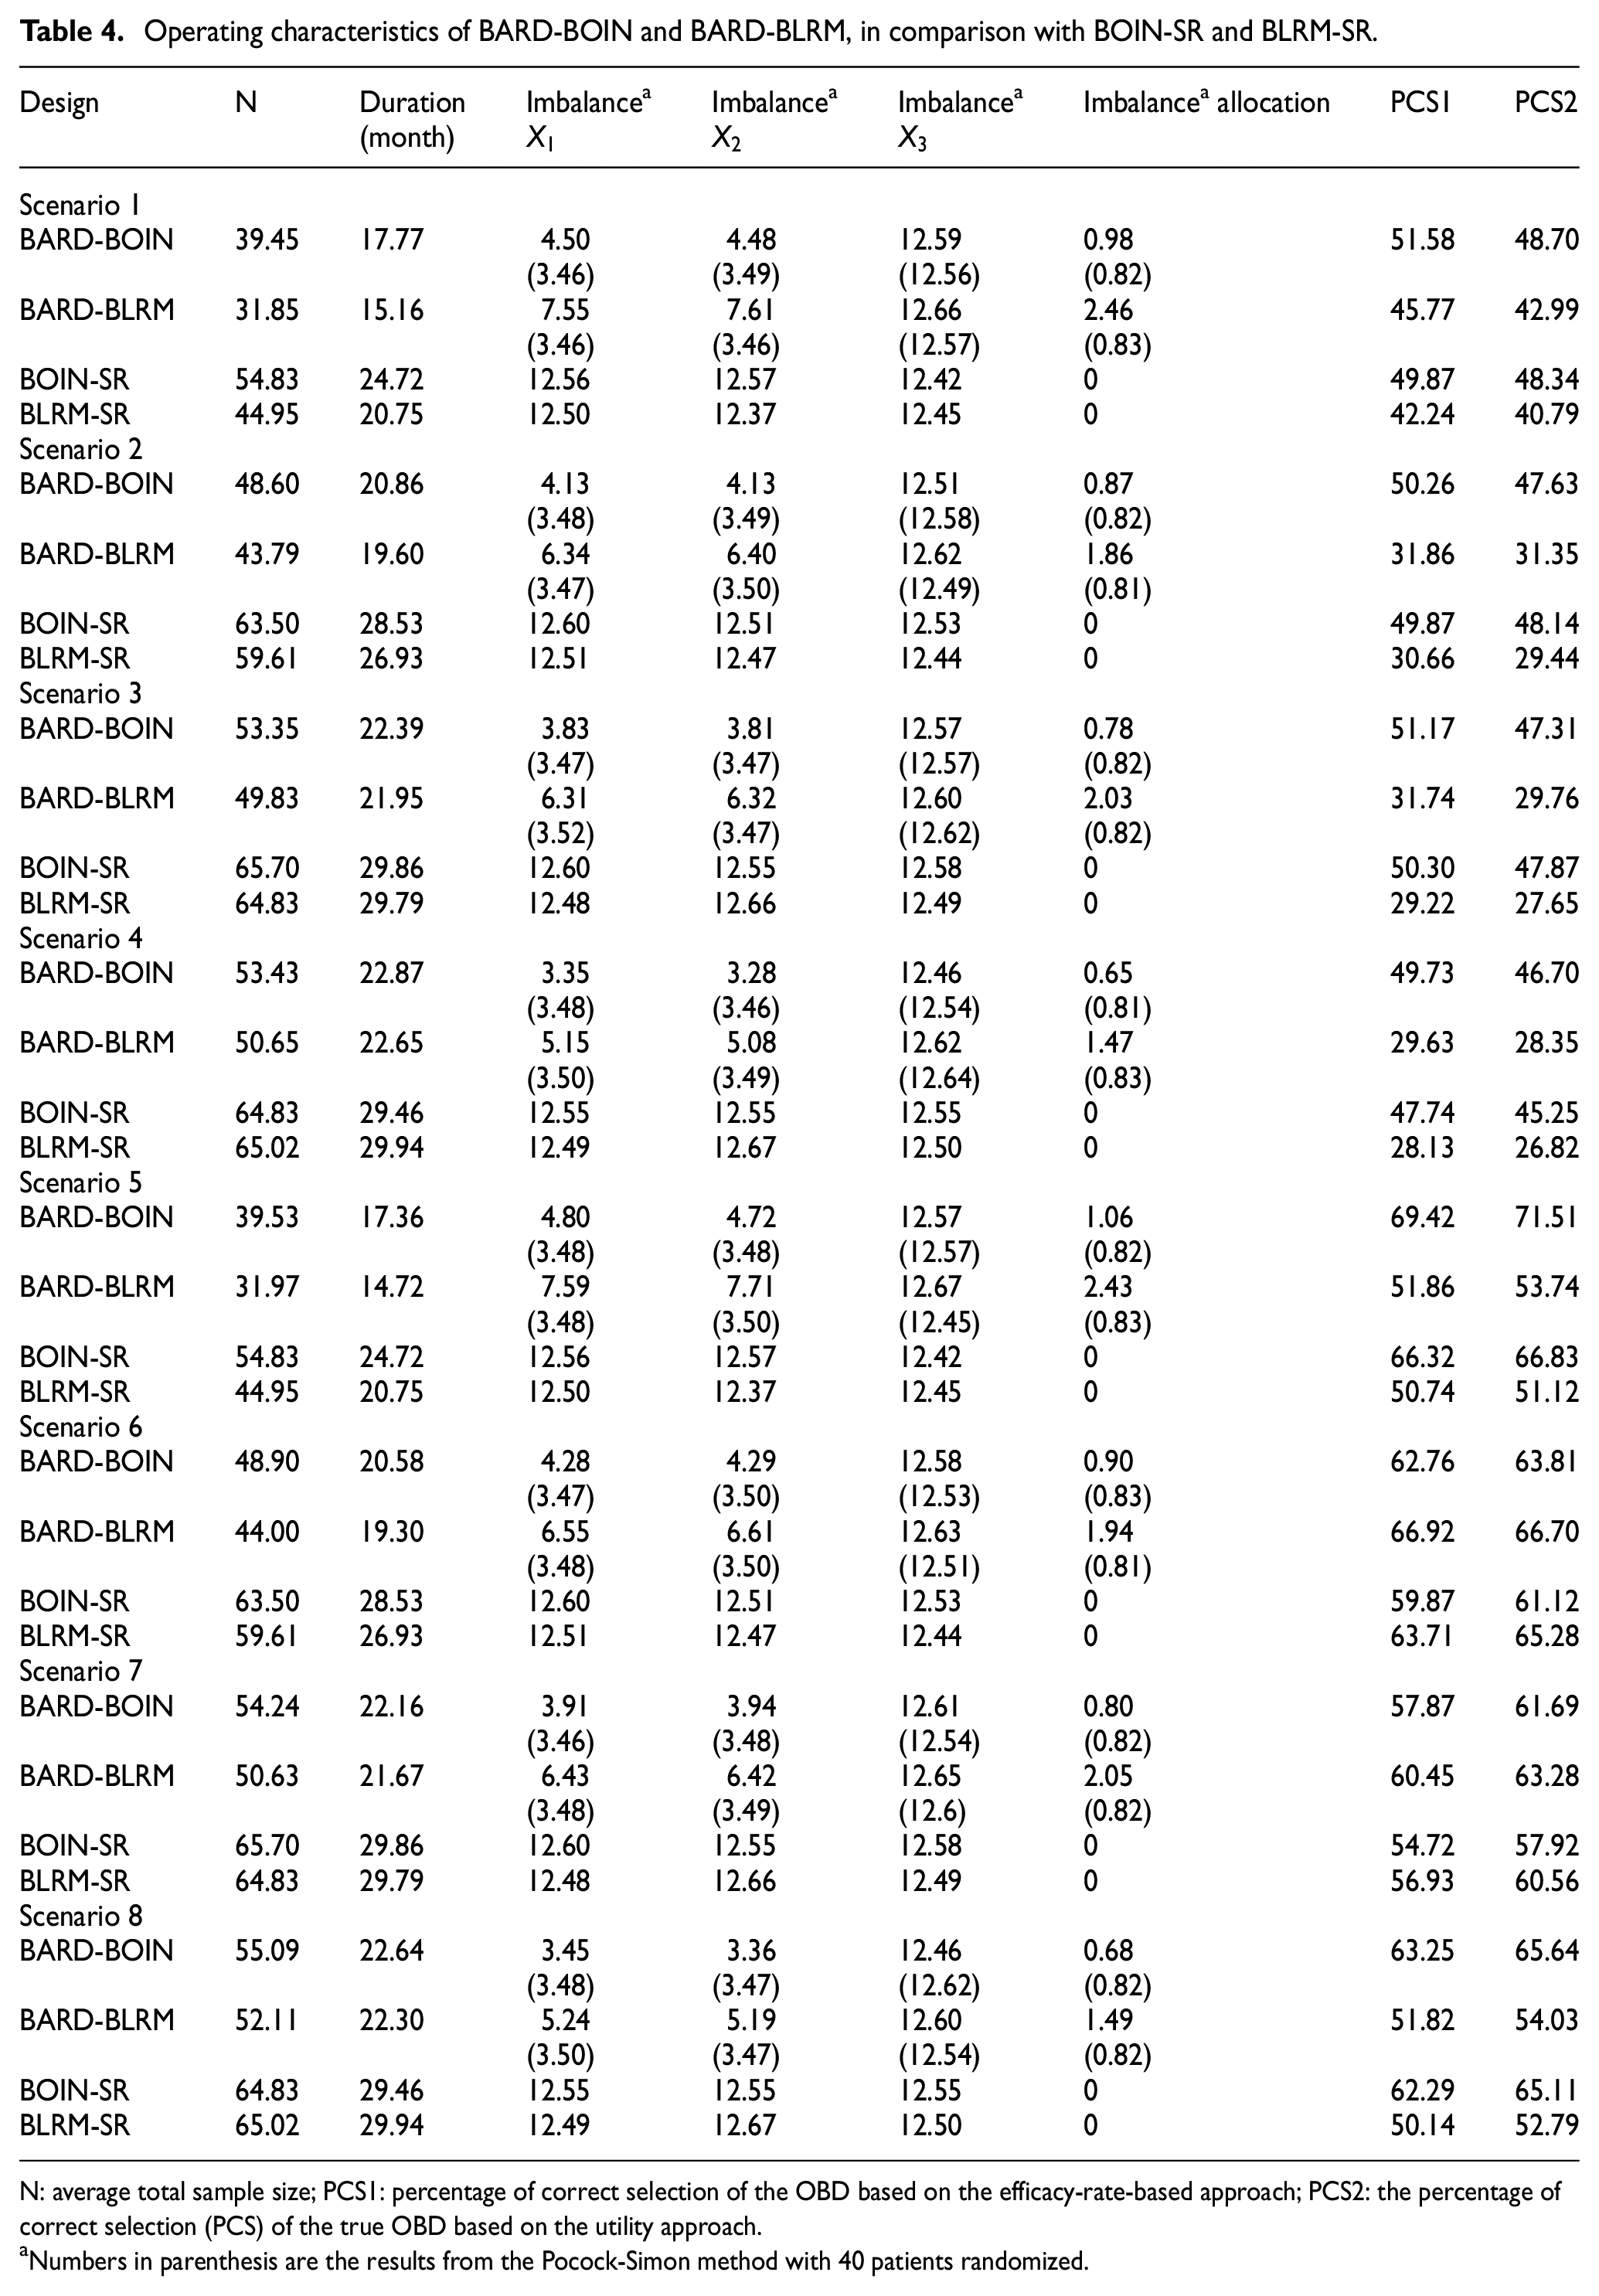
N: average total sample size; PCS1: percentage of correct selection of the OBD based on the efficacy-rate-based approach; PCS2: the percentage of correct selection (PCS) of the true OBD based on the utility approach.
Numbers in parenthesis are the results from the Pocock-Simon method with 40 patients randomized.
In terms of OBD selection, BARD-BOIN generally outperforms BOIN-SR, with a 1.89% higher PCS1% and 1.55% higher PCS2 on average. For example, in scenarios 6 and 7, the PCS1 of BARD-BOIN is 2.89% and 3.15% percentage points higher than that of BOIN-SR. This result is remarkable, considering that BARD-BOIN uses a smaller overall sample size. Of note, although BARD-BOIN has a smaller overall sample size, the number of patients used to inform the OBD selection (i.e. N2) is the same for both methods. The performance gain may stem from BARD-BOIN’s better balance in prognostic factors, which results in more accurate estimates (see Table S2 in the Supplementary materials) and, consequently, higher PCS.
As for the two OBD selection approaches (i.e. PCS1 and PCS2), they are generally comparable. Since they are based on different criteria, reflecting distinct clinical considerations and suited to different clinical settings, it is more meaningful to focus on their overall operating characteristics rather than making direct comparisons and drawing general conclusions about which approach is superior.
Similar patterns are observed when comparing BARD-BLRM to BLRM-SR across these performance metrics. Specifically, BARD-BLRM reduces the sample size by 12–15 patients and shortens the trial duration by 6–8 months compared with BLRM-SR. In addition, BARD-BLRM demonstrates greater accuracy in identifying the OBD, with higher PCS, and a superior ability to balance covariates compared with BLRM-SR.
Between BARD-BOIN and BARD-BLRM, BARD-BOIN often exhibits higher accuracy in identifying the OBD, as evidenced by higher PCS1 and PCS2. This is primarily due to BLRM’s lower probability of correctly identifying the MTD. Table S3 in the Supplementary materials summarizes stage 1 of the BARD-BOIN and BARD-BLRM designs in the simulation. BARD-BLRM has a lower probability for carrying forward the true OBD dose to stage 2. Our results align with previous findings that BLRM tends to be overly conservative, resulting in a lower probability of identifying the MTD.28–31 Tables S4 and S5 in the Supplementary materials present the results for BARD-BLRM with
However, it was somewhat unexpected that BARD-BLRM showed notably worse covariate balance than BARD-BOIN, although it still outperformed the simple randomization. This result is surprising, given that both designs use the same covariate-adaptive randomization method in stage 2. A key factor contributing to this result is the rigidity of BLRM due to the use of the two-parameter logistic model. The concept of “rigidity” is defined and discussed in Cheung
34
and Iasonos et al.
35
It refers to the tendency of a flexible model to overfit the data, which in turn causes the dose-finding process to become stuck at a low dose, preventing exploring higher doses that seem toxic based on the data from a few patients (e.g. 3), which are actually safe. Once the process is stuck at a dose, treating more patients does not resolve the issue. Given the limited data available at the beginning of a dose-finding trial (e.g. data from only 3 or 6 patients), the two-parameter logistic model is often deemed overly flexible, leading to overfitting and getting stuck at a particular dose. As a result, BLRM often leads to a highly imbalanced number of patients between
Sensitivity analysis
We conducted a sensitivity analysis to assess the robustness of BARD-BOIN regarding the number of covariates, the stage 2 sample size
Figure 1 depicts the differences in the covariate imbalance index for
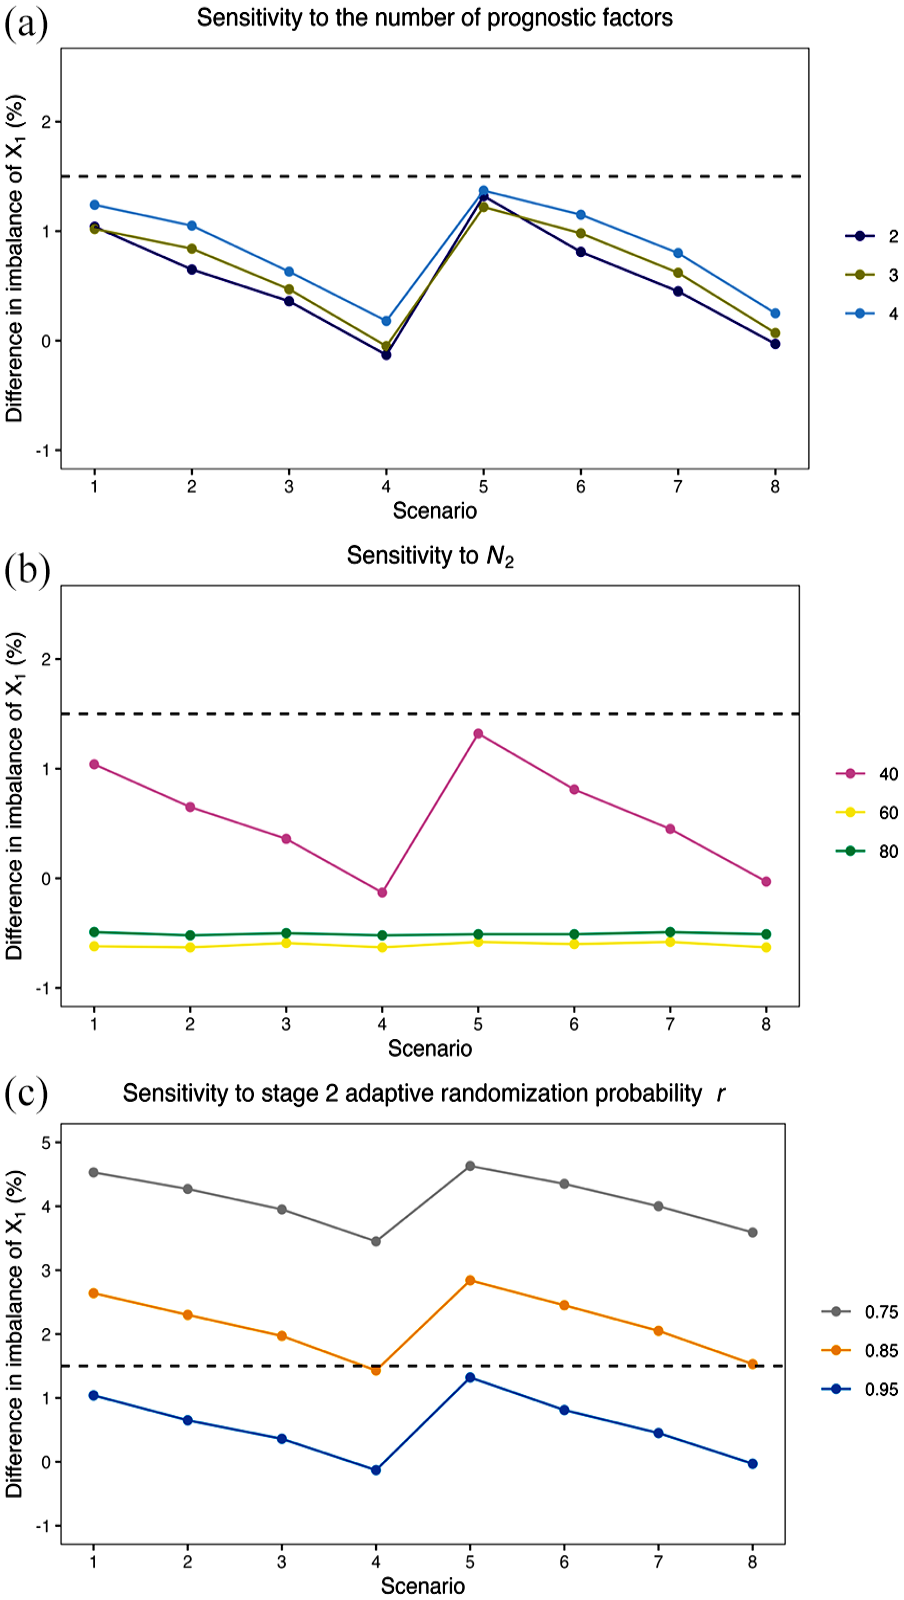
The difference in the imbalance index of
Tables S6–S8 in Supplementary materials show the setting and result with J = 3 doses. The results are generally consistent with those observed with 5 doses. Specifically, compared with BOIN-SR, BARD-BOIN reduces the sample size and trial duration, achieves better covariate balance, and improves the accuracy of identifying the OBD.
Discussion
We have proposed a seamless two-stage design, BARD, that integrates backfilling and adaptive randomization for efficient dose optimization. Backfilling allows additional patients to be enrolled at doses deemed safe and showing promising activity, enhancing patient enrollment and data generation without extending the trial duration. The adaptive randomization enables the combination of data from dose escalation and randomization without compromising the balance of baseline characteristics between comparative dose arms. BARD designs offer an efficient solution to meet the dose optimization requirements set by Project Optimus.
Backfilling and adaptive randomization significantly enhance trial efficiency when used together, but they do not necessarily need to be bundled. Stage 1 dose escalation can proceed without backfilling while still utilizing adaptive randomization to combine stage 1 and 2 data for a more efficient comparison of multiple doses. In addition, while we focus on using the Pocock-Simon method, its various extensions and other covariate-balance randomization 36 methods can also be employed when appropriate.
Because dose selection is performed at the end of stage 1, one may concern potential estimation bias when stage 1 and 2 data are combined to estimate and select the OBD at the end of the trial, an issue analogous to what occurs in inferential phase II–III trials. 37 Supplemental Table S2 presents the bias of the estimates of the DLT rate and response rate at the end of the trial. The estimate of the response rate has minimal bias. The estimate of the DLT rate exhibits a small negative bias (−0.015 to −0.022), which arises from the DLT-data-dependent dose assignment and selection in stage 1. However, this bias is generally negligible relative to the high heterogeneity typically observed in early-phase patients and the inherent variance of the DLT estimate.
The stage 1 of BARD designs centers on dose escalation based on DLT and the identification of MTD. When suitable, efficacy-integrated designs, such as EffTox 7 and BOIN12, 9 can be used to more efficiently identify doses likely to be the OBD, which can then be advanced to stage 2 for adaptive randomization. In addition, our simulation does not include interim toxicity and futility monitoring, which potentially further reduces the sample size if one or two doses in stage 2 are overly toxic or futile. Bayesian optimal phase 2 design38,39 can be employed to achieve this goal. Finally, this article focuses on single-agent dose-finding trials. Extending BARD to combination trials involving the identification of the OBD from a dose matrix is a topic for future research.
Supplemental Material
sj-pdf-1-ctj-10.1177_17407745251350596 – Supplemental material for BARD: A seamless two-stage dose optimization design integrating backfill and adaptive randomization
Supplemental material, sj-pdf-1-ctj-10.1177_17407745251350596 for BARD: A seamless two-stage dose optimization design integrating backfill and adaptive randomization by Yixuan Zhao, Rachael Liu, Jianchang Lin and Ying Yuan in Clinical Trials
Footnotes
Declaration of conflicting interests
The author(s) declared no potential conflicts of interest with respect to the research, authorship, and/or publication of this article.
Funding
The author(s) disclosed receipt of the following financial support for the research, authorship, and/or publication of this article: Yuan’s research was partially supported by Award Number P50CA281701, P50CA127001, and U24CA274212 from the National Cancer Institute, and Bettyann Asche Murray Distinguished Professorship.
Supplemental material
Supplemental material for this article is available online.
References
Supplementary Material
Please find the following supplemental material available below.
For Open Access articles published under a Creative Commons License, all supplemental material carries the same license as the article it is associated with.
For non-Open Access articles published, all supplemental material carries a non-exclusive license, and permission requests for re-use of supplemental material or any part of supplemental material shall be sent directly to the copyright owner as specified in the copyright notice associated with the article.