
Abstract
Background/Aims:
Provisions of the Inflation Reduction Act mandating drug price negotiation by the Centers for Medicare & Medicaid Services have been criticized as a threat to pharmaceutical innovation. This study models potential impacts of the Inflation Reduction Act on drug approvals based on the differential contributions of large pharmaceutical companies and smaller biotechnology firms to clinical trials and the availability of capital.
Methods:
This study examined research and development expense, revenue, and new investment (sale of common and preferred stock) by public biopharmaceutical companies and sponsorship of phased clinical trials in ClinicalTrials.gov. Financial data were incorporated in a model that estimates the number of drugs in each phase and approvals from reported phase-specific costs and transition rates, proportional sponsorship of trials by companies of different size, projected reductions in research and development spending based on company size, and three scenarios by which large companies may allocate reductions in research and development spending among clinical phases: (1) research and development proportionally reduced across phases; (2) research and development disproportionally reduced in phases 2–3; and (3) research and development disproportionately reduced in phases 1–2.
Results:
Financial data were examined for 1378 public biopharmaceutical companies (2000–2018). Research and development expense was associated with revenue for 79 large companies with market capitalization ≥$7 billion with a 10% reduction in revenue reducing research and development expense by 8.4%. For 1299 smaller companies with market capitalization <$7 billion, research and development was associated with new investment, but not revenue. Smaller companies sponsored 55.2% of phase 1, 55.6% of phase 2, and 49.8% of phase 3 trials in ClinicalTrials.gov 2013–2018. In a model of clinical development that apportions clinical trials between large and smaller companies and determines the number of trials based on research and development resources, 400 drugs entering development produced 47.3 approvals (11.83% rate). A 10% reduction in revenue, reflecting the upper boundary of observed changes 2000–2018, with (1) proportional reduction across phases 1–3 produced 45.1 approvals (4.61% reduction); (2) disproportional reduction of phases 2–3 produced 42.8 approvals (9.55% reduction); and (3) disproportional reduction of phases 1–2 produced 46.9 approvals (0.95% reduction).
Conclusion:
This work suggests that the drug price negotiation provisions of the Inflation Reduction Act could have little or no impact on the number of drug approvals. While large pharmaceutical companies may reduce research and development spending, continued research and development by smaller companies and strategic allocation of research and development resources by large companies may mitigate any negative effects of the Inflation Reduction Act.
Keywords
Introduction
Legislative proposals designed to lower prescription drug prices, including the price negotiation provisions of the Inflation Reduction Act,1,2 have been criticized for potentially threatening innovation.3–10 This criticism posits that lowering drug prices could reduce capital resources available for research and development (R&D) both by directly decreasing revenue from drug sales and new investment. These arguments are consistent with established financial principles, which teach that investment in R&D is driven primarily by present value of future revenue or earnings that may accrue from commercial product sales and by anticipated returns on the investment. 4 Econometric models incorporating this principle, including those from the Congressional Budget Office, have estimated that the Inflation Reduction Act could reduce the number of drug approvals annually by 0.8%–4.5%.4,7–11 The present analysis expands on previous studies by recognizing differences in the business models of the largest pharmaceutical companies, which collectively account for the large majority of global pharmaceutical sales, revenue, and R&D spending12,13 and smaller, emerging companies that, in recent years, have originated 67% of new drugs and sponsored 64% of late-stage clinical trials and 40%–69% of new drug approvals.14–16
The objective of this study was to characterize how drug price reductions resulting from the price negotiation provisions of the Inflation Reduction Act may impact availability of capital for R&D in both large and smaller biopharmaceutical companies as well as the number of new drug approvals. Specifically, this analysis describes audited financial data on public biotechnology or pharmaceutical companies 2000–2018, and their contributions to phased clinical trials posted to ClinicalTrials.gov 2013–2018. Companies were classified by size into groups exhibiting distinct associations between revenue, new investment, and R&D expenses. These data were then used as inputs to a steady-state model of the drug development pipeline to estimate the number of drug approvals with different levels of revenue reduction.
This analysis considers several characteristics of drug development that were not incorporated in previous studies. First, the model recognizes that the biopharmaceutical industry derives capital for R&D from not only drug sales but also new investment. Large, integrated pharmaceutical companies typically have substantial product revenue, which provides capital resources for R&D, 4 manufacturing and commercial operations, and corporate profit (earnings). These profits may then be reinvested in the company or distributed to shareholders through dividends or stock buybacks. In contrast, smaller and emerging biopharmaceutical companies have been described as having a science-based business model that creates value by generating new intellectual property.17,18 These companies typically do not have marketed drugs or product revenue, although they may have project-specific revenue from research partnerships with larger firms, and acquire much of their capital for R&D and operations from new investment rather than revenue.17–21 This analysis considers the potential effects of price negotiations on the availability of capital for R&D in both large pharmaceutical companies and smaller biotechnology companies.
Second, large pharmaceutical companies typically have large numbers of drugs in development and considerable ability to abandon drugs of insufficient commercial interest and acquire clinical-stage drug candidates through licensing or acquisitions of smaller companies.22–24 The dynamic nature of the drug pipeline allows these companies to strategically allocate R&D spending to different products or phases of drug development to maintain a robust pipeline of drugs in development or control costs. This analysis recognizes this ability of large companies to adapt their pipeline to ever-changing resource constraints.
This analysis describes differences in the finances and clinical contributions of large, integrated pharmaceutical companies and the many smaller biopharmaceutical companies engaged in new drug discovery or development. Incorporating these data into a pharmaceutical pipeline model provides a more robust and realistic perspective on how decreases in revenue resulting from the price negotiation provisions of the Inflation Reduction Act may impact the number of new drug approvals in the future. These results suggest that strategic management of the drug pipeline may mitigate any negative impacts of the Inflation Reduction Act and may be a useful guide to assure a continuing flow of new, innovative drugs and public policy intended to assure the availability and affordability of drugs to treat morbid diseases.
Methods
Data sources
Company-specific, audited financial data (2000–2018) for public pharmaceutical companies (Global Industry Classification Standard code 35202010) or biotechnology companies (Global Industry Classification Standard code 35201010 was retrieved from Compustat (Wharton Research Data Services, https://wrds-www.wharton.upenn.edu). A list of financial variables, their definitions, and sources of data are provided in Supplemental Tables S1 and S2 and Appendix S1. Financial data are inflation-adjusted to 2016 using the Consumer Price Index for All Urban Consumers data (https://data.bls.gov/cgi-bin/surveymost).
Finances of large and smaller biopharmaceutical companies
Companies were categorized as “large” in a given fiscal year if their market capitalization exceeded $7 billion, representing the approximate lower bound of market capitalization for companies of the (large cap) S&P500 over this period. Large companies were further subcategorized into quartiles based on their market capitalization. Companies were categorized as “smaller” in a given fiscal year if their market capitalization was uniformly less than $7 billion, representing the approximate upper bound of the (mid cap) S&P400. Annual financial data were not available for private companies or companies not listed on US exchanges.
Correlations between annual revenue and R&D expense were estimated using simple linear regression. Due to the wide range of values and non-normal distribution of the data set, data are described as the median and interquartile range (IQR). In addition, the non-normal distribution made traditional regression to the mean inappropriate, and so regression to the median (i.e. median regression) was used instead to characterize associations between revenue and R&D with results reported as median values and the 95% confidence interval (CI).
The relationship between changes in revenue and changes in R&D was described by the model

with the changes in R&D and revenue expressed as a fraction of total R&D or revenue, respectively. For large companies, this model also included an indicator variable for company size.
Median regressions were performed to analyze multivariate impacts on R&D spending. The first examined the impact of cumulative (all companies in the fiscal year data set by class) revenue and new investment on cumulative R&D expense with the model

where new investment represents the sales of common and preferred stock.
The second examined multivariate impact on sale of common and preferred stock including S&P500 index as an indicator for general market conditions (https://www.spglobal.com); global pharmaceutical sales; 25 and the Producer Price Index: Pharmaceutical and Medicine Manufacturing representing the price received by pharmaceutical manufacturers 26 (https://fred.stlouisfed.org/series/PCU4461104461101) using the model

where new investment is the sales of common and preferred stock across all companies in the data set by year, S&P is the S&P500 Index, and PPI is the Producer Price Index: Pharmaceutical and Medicine Manufacturing (for additional details on all regression models, see Supplemental Appendix S2).
Identifying sponsors of phased clinical trials
Sponsors of phased clinical trials were identified in ClinicalTrials.gov (2013–2018) as those with agency class “Industry.” Clinical trials were categorized as being sponsored by a large pharmaceutical company if any one of the sponsor organizations had a market capitalization ≥$7 billion at the time the trial was initiated and were further subcategorized by quartile. The market capitalization of private companies was estimated from BioCentury or other media. The size of companies listed on foreign exchanges was estimated as the maximum market capitalization achieved 2010–2018.
Modeling the drug pipeline
The drug pipeline model is described in detail in Supplemental Appendix S3 and shown schematically in Figure 1. Briefly, the model estimates the steady-state number of drugs in each development phase as well as annual drug approvals for different levels of R&D spending (i.e. the number of annual drug approvals once the impacts of reducing revenue are fully realized across the pipeline). The baseline case considers 400 new candidate drugs entering the pipeline each year with phase-specific costs, transition success rates reported by DiMasi et al., 27 and trials allocated among companies of different sizes in proportion to ClinicalTrials.gov data 2013–2018. The model posits that reductions in pharmaceutical revenue due to the price negotiation provisions of the Inflation Reduction Act will lead to decreased R&D spending on phased clinical trials in proportion to the associations observed for companies of different sizes 2000–2018. R&D spending reductions limit the number of candidate drugs that can be supported at each development stage in companies of different sizes, which may lead to candidate drugs being abandoned (i.e. commercial failures),23,24,27 acquired by larger companies (i.e. licensing or acquisition), or adopted by smaller companies (i.e. licensing, spin out, repurposing). The model further recognizes that large companies, but not smaller companies, can strategically distribute R&D cost reductions proportionally among all three phases (scenario #1); primarily by reducing spending on late-stage (phase 3) trials (scenario #2); or primarily by reducing spending on early-stage (phases 1–2) trials (scenario #3). Model outputs in this article consider a 10% reduction in pharmaceutical revenue, representing the year-to-year revenue reduction upper boundary observed 2000–2018 and the applicability limit of the model. An interactive dashboard is provided in Supplemental Appendix S3 that allows consideration of different levels of drug price and revenue reduction as well as different strategies for distributing R&D cost reductions among clinical phases.
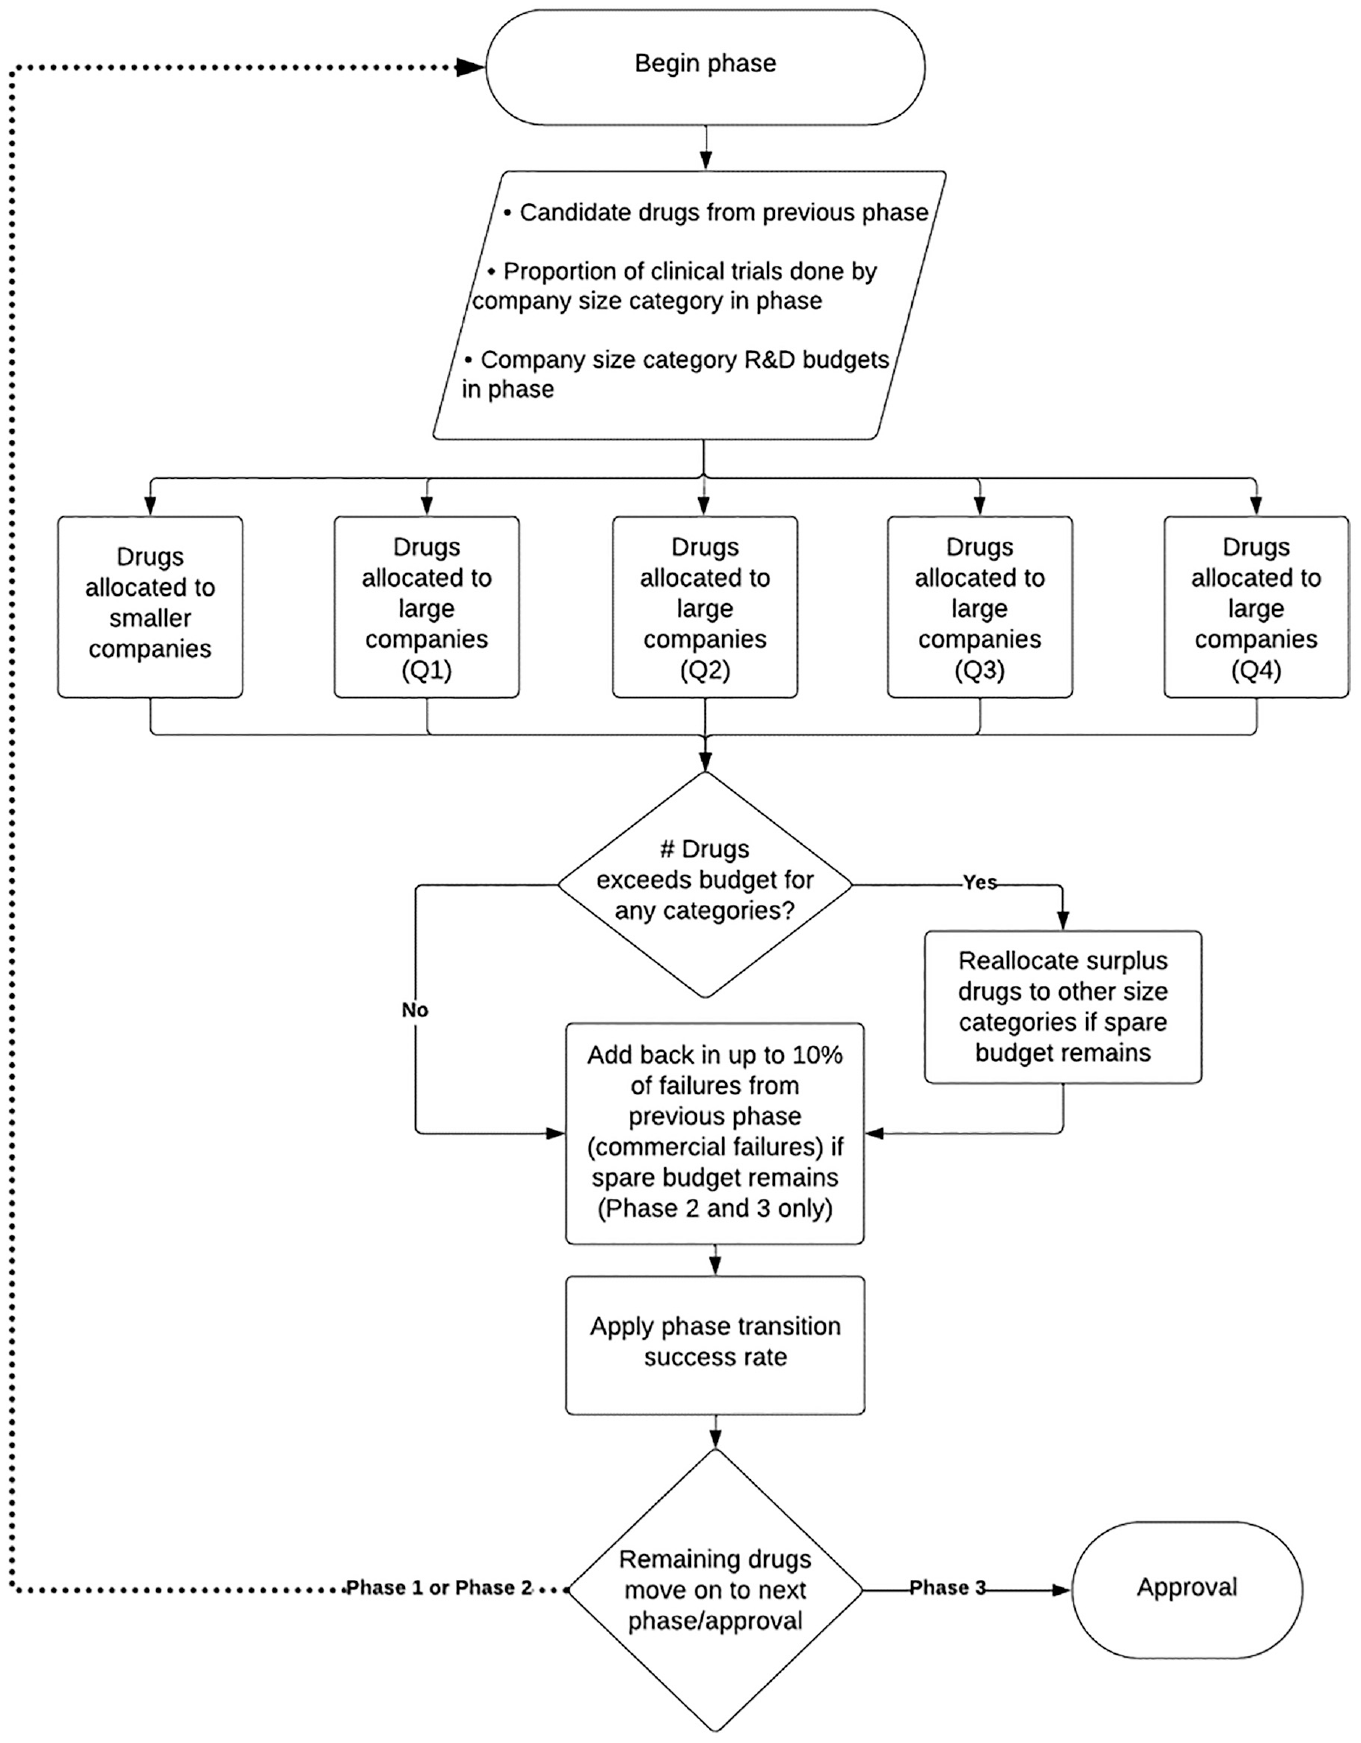
Schematic of the drug pipeline model.
Results
Finances of large and smaller companies
Annual financial reports were identified for 1378 publicly traded companies comprising 9998 fiscal years of data, 2000–2018. For the full data set, revenue was strongly associated with R&D expense (linear regression: R2 = 0.92) (Figure 2(a)), although the strength of this association was disproportionately influenced by large companies given the wide (100-fold) range of revenue and R&D in the data set (Supplemental Table S3).
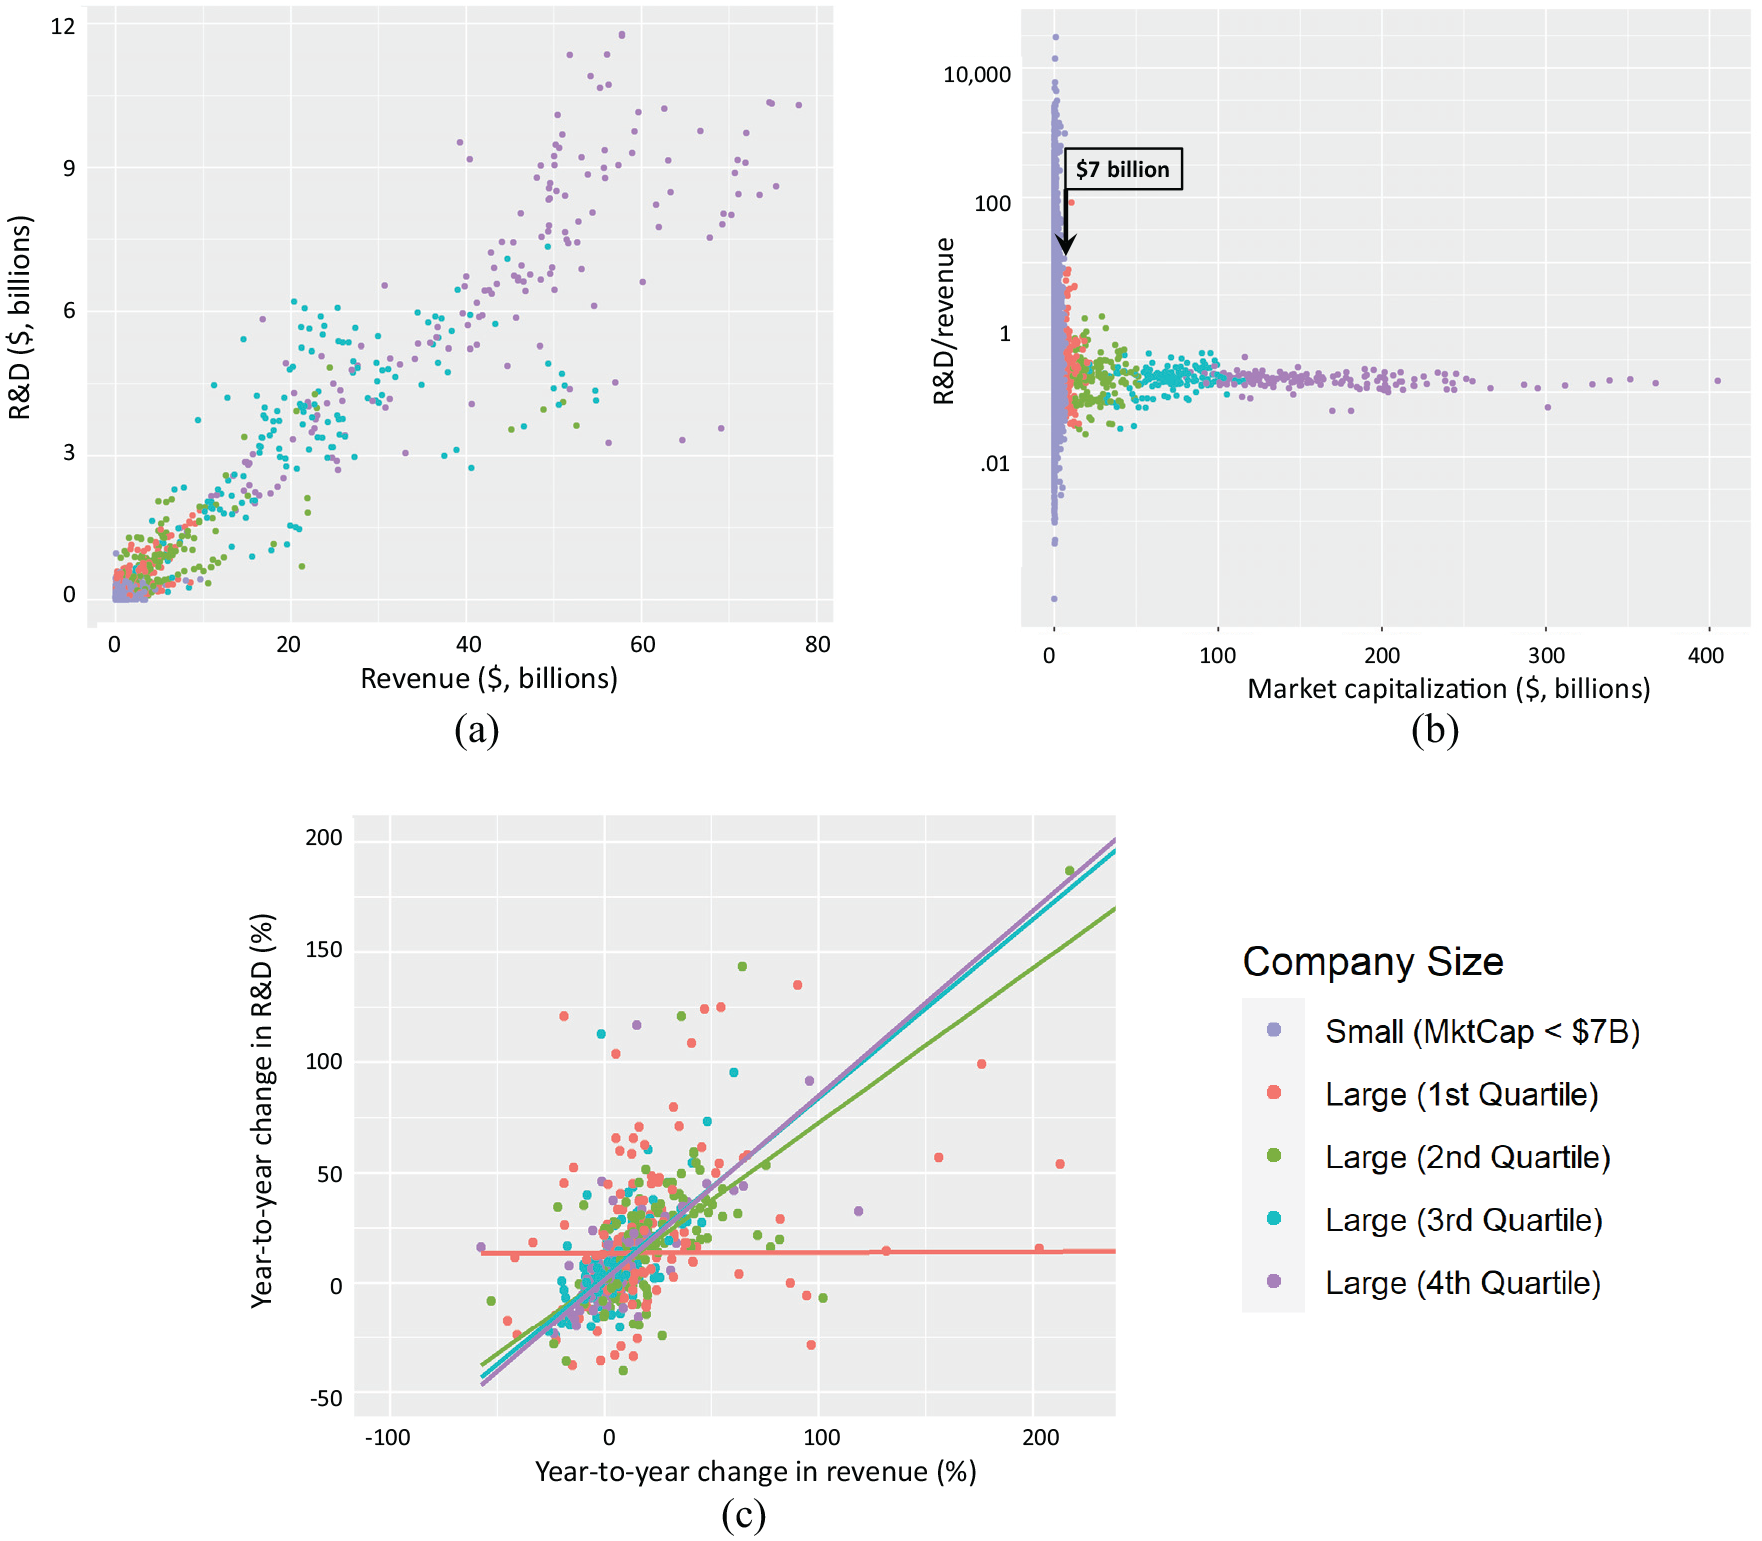
Relationship between annual revenue and R&D expense for 1378 public biopharmaceutical companies 2010–2018.
Figure 2(b) shows the fraction of revenue expensed as R&D (research intensity) across companies of different sizes measured by market capitalization. For the largest companies, the fraction of revenue expensed as R&D was relatively constant with a median value of 19%, while there was wide variation in this metric for smaller companies. An empirical boundary was identified between companies with market capitalization ≥$7 billion, where there was a strong association between revenue and R&D, and <$7 billion, where there was no evident relationship between corporate revenue and R&D expense. This boundary roughly corresponds to the lower end of the (large cap) S&P500 or the high end of the (mid cap) S&P400.
From 2000 to 2018, 79 companies achieved a market capitalization >$7 billion and were categorized as “large companies.” These companies had a median gross profit margin of 75% (IQR = 42% to 85%) and a median net income (earnings) margin of 9% (IQR=−28% to 19%) (Supplemental Table S3). In these companies, the proceeds from sale of common and preferred stock, typically issued as part of an employee stock option plan, was less than the purchase of common and preferred stock (stock buybacks), making stock transactions a net negative source of capital for large companies. These results suggest that large pharmaceutical companies are dependent on revenue to provide the capital resources for R&D.
The 1299 “smaller companies” typically had limited revenue, median gross profit close to $ 0, and negative median net income (earnings) (−$14.1m, IQR =−$36.2m to −$3.0m). In these companies, median R&D expense ($11.2m, IQR = $2.3m to $30.9m) was greater than median revenue ($2.6m, IQR = $0 to $22.9m) (Supplemental Table S3). These companies had greater median sale of common and preferred stock ($5.00m, IQR = $0.3m to $28.3m) than revenue with negligible distributions to shareholders. These results suggest that, in smaller companies, revenue is often inadequate to support R&D and that new investment provides substantial capital for both R&D and operational expenses.
Association between revenue and R&D expense in large and smaller companies
Figure 2(c) shows the association between year-to-year (fractional) changes in revenue and in R&D expense with the regression slopes representing the change in R&D that might be expected from any decrease in revenue. For large companies, changes in revenue were associated with changes in R&D expense with the strongest association for companies in the top quartiles of market capitalization (Q4 = 0.84; 95% CI = 0.64–0.95, p < 0.001; Q3 = 0.81; 95% CI = 0.62–1.06, p < 0.001) and a weaker association for the second quartile (Q2 = 0.70; 95% CI = 0.46–0.86, p < 0.001) (Table 1). There was no evident association for the lowest quartile (Q1 = 0.003, 95% CI = 0.0–0.30, not significant (NS)) or in the smaller companies (Table 1 and Supplemental Figure S1). The year-to-year revenue reduction upper boundary observed 2000–2018 was ∼10%, representing an applicability limit of these data.
Relationship between R&D expense and revenue for 1378 biotechnology and pharmaceutical companies 2000–2018.
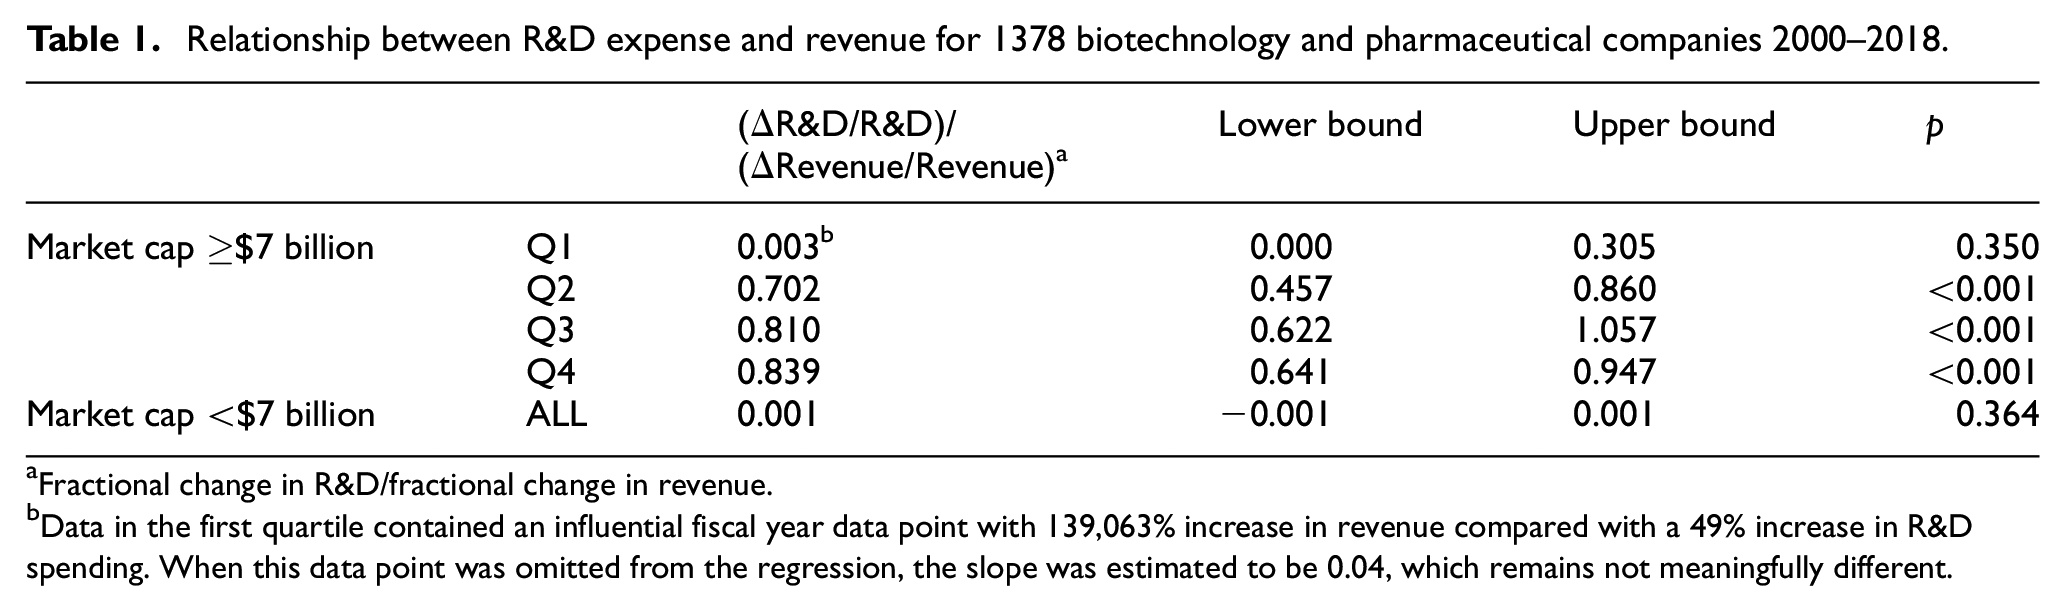
Fractional change in R&D/fractional change in revenue.
Data in the first quartile contained an influential fiscal year data point with 139,063% increase in revenue compared with a 49% increase in R&D spending. When this data point was omitted from the regression, the slope was estimated to be 0.04, which remains not meaningfully different.
Association of drug prices, pharmaceutical sales, and market conditions on new investment
Median regression was used to examine the combined effects of cumulative annual revenue and new investment (sale of common and preferred stock) on R&D expense across the biopharmaceutical sector. This analysis showed that cumulative R&D expense was more strongly associated with cumulative sale of common and preferred stock (0.72, 95% CI = 0.65–0.77, p < 0.001) than with cumulative revenue (0.07, 95% CI = 0.05–0.12, p = 0.006). Moreover, the larger (normalized) slope associated with sale of common and preferred stock (0.719 vs 0.072) suggests that changes in new investment could have a proportionally greater impact on R&D than changes in revenue (Supplemental Table S4).
Median regression was also used to evaluate whether changes in drug pricing or global sales (revenue) were associated with new investment (sale of common or preferred stock) in smaller biopharmaceutical companies. This analysis showed a strong association between sale of common and preferred stock and the S&P500 index, an indicator for general market conditions, (23.5, 95% CI = 4.8–31.80, p = 0.02), but no meaningful association with global pharmaceutical sales or Producer Price Index: Pharmaceutical and Medicine Manufacturing (Supplemental Table S5).
Contributions of large and smaller companies to development
There were 21,167 trials 2013–2018 with agency class “Industry” in ClinicalTrials.gov (8446 in phase 1, 7097 in phase 2, and 5624 in phase 3). Companies listed on US exchanges with market capitalization ≥$7 billion sponsored 37.2% of phase 1, 38.9% of phase 2, and 42.6% of phase 3 trials (Table 2). Similarly sized companies listed on foreign exchanges or privately held firms were the largest sponsor for 7.6% of phase 1, 5.5% of phase 2, and 7.6% of phase 3 trials. Large companies sponsored a median of 65 clinical trials/company 2013–2018.
Fraction of clinical trials in ClinicalTrials.gov sponsored by companies of different sizes 2013–2018. a
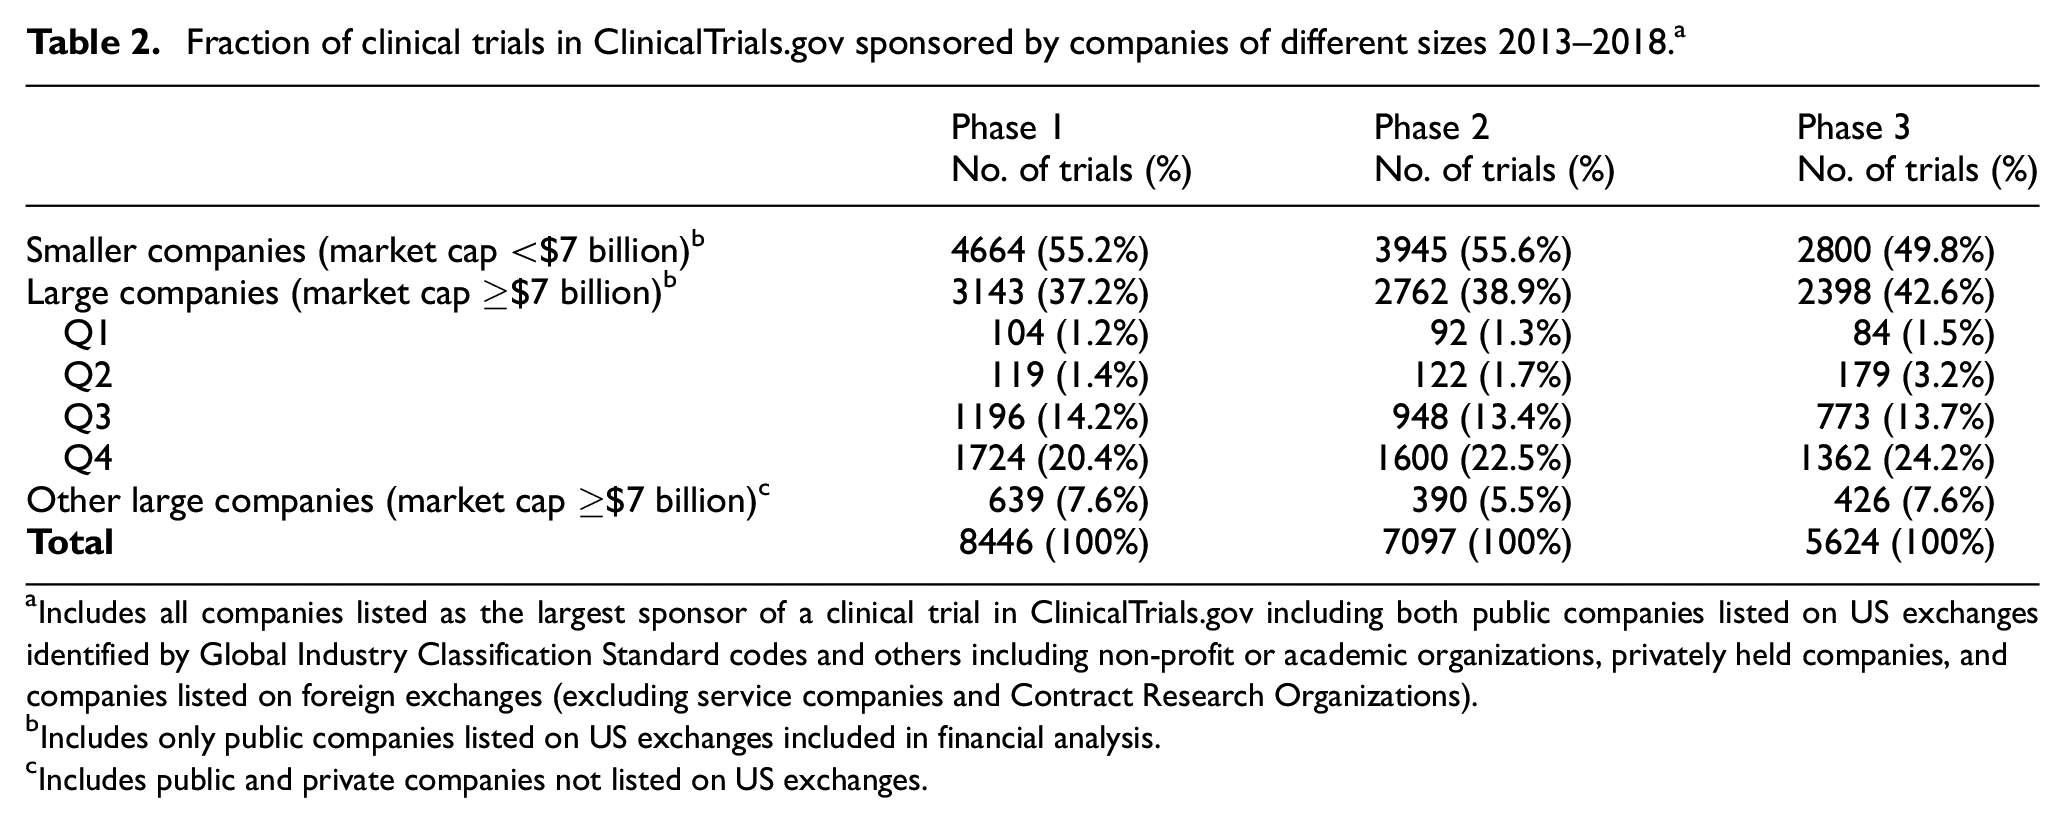
Includes all companies listed as the largest sponsor of a clinical trial in ClinicalTrials.gov including both public companies listed on US exchanges identified by Global Industry Classification Standard codes and others including non-profit or academic organizations, privately held companies, and companies listed on foreign exchanges (excluding service companies and Contract Research Organizations).
Includes only public companies listed on US exchanges included in financial analysis.
Includes public and private companies not listed on US exchanges.
Smaller companies sponsored 55.2% of phase 1, 55.6% of phase 2, and 49.8% of phase 3 trials (Table 2), with the large majority of companies sponsoring <10 trials and a median of 2 clinical trials/company 2013–2018 (Figure 3). Thus, most clinical trials at each development phase were sponsored by companies with market capitalization <$7 billion for which there was no observed relationship between revenue and R&D expense.
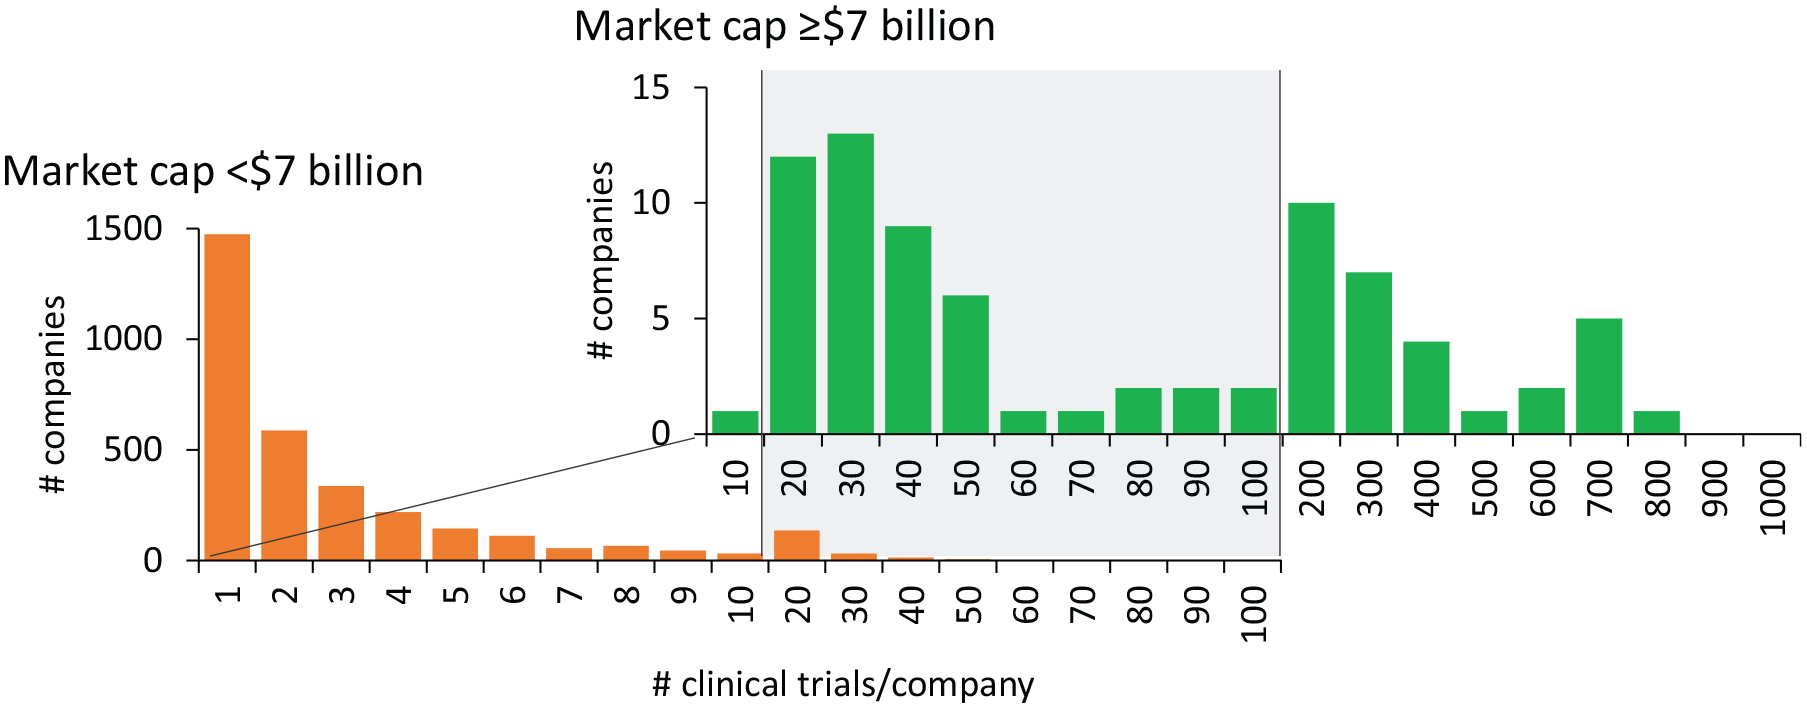
Number of clinical trials in ClinicalTrials.gov sponsored by companies with market capitalization <$7 billion or ≥$7 billion.
Modeling the impact of revenue reduction
In the baseline case with 400 candidate drugs entering clinical development annually, the model estimated 47.33 approvals/year, an overall success rate of 11.8%, consistent with reported data.24,27 The effect of revenue reduction was estimated for a 10% reduction in pharmaceutical revenue reflecting the year-to-year revenue reduction upper boundary observed in the data set. This level of revenue reduction is applied to both large companies that derive revenue from drug sales and smaller companies that are more likely to accrue revenue through partnerships with larger firms. For large firms, the decrease in R&D spending for companies in each quartile was based on the observed association between R&D and revenue in companies (Table 3). No change in R&D expense is anticipated in smaller companies based on the absence of an association between R&D and revenue in these companies. Three different scenarios are shown:
In scenario #1, large pharmaceutical companies reduce R&D expense through proportional reductions in spending on phase 1, phase 2, and phase 3 trials. This results in 45.1 approvals/year or a 4.6% decrease in new drug approvals.
In scenario #2, large pharmaceutical companies reduce R&D expense by reducing spending on late-stage phase 3 trials. This results in 42.8 approvals/year or a 9.6% decrease. In this worst-case scenario, decreased spending on phase 3 trials leads to an increase in the commercial failure rate of drugs in phase 2 trials.
In scenario #3, large pharmaceutical companies reduce R&D expense by reducing spending on early-stage phase 1 or phase 2 trials. This results in 46.9 approvals/year or a <1% decrease in new drug approvals. In this scenario, an increase in the transition success rate in phase 1 or phase 2 trials conducted by smaller companies (i.e. reducing the commercial failure rate) is sufficient to maintain a full pipeline of drugs in phase 3 development.
Model of revenue reductions on the clinical development pipeline.
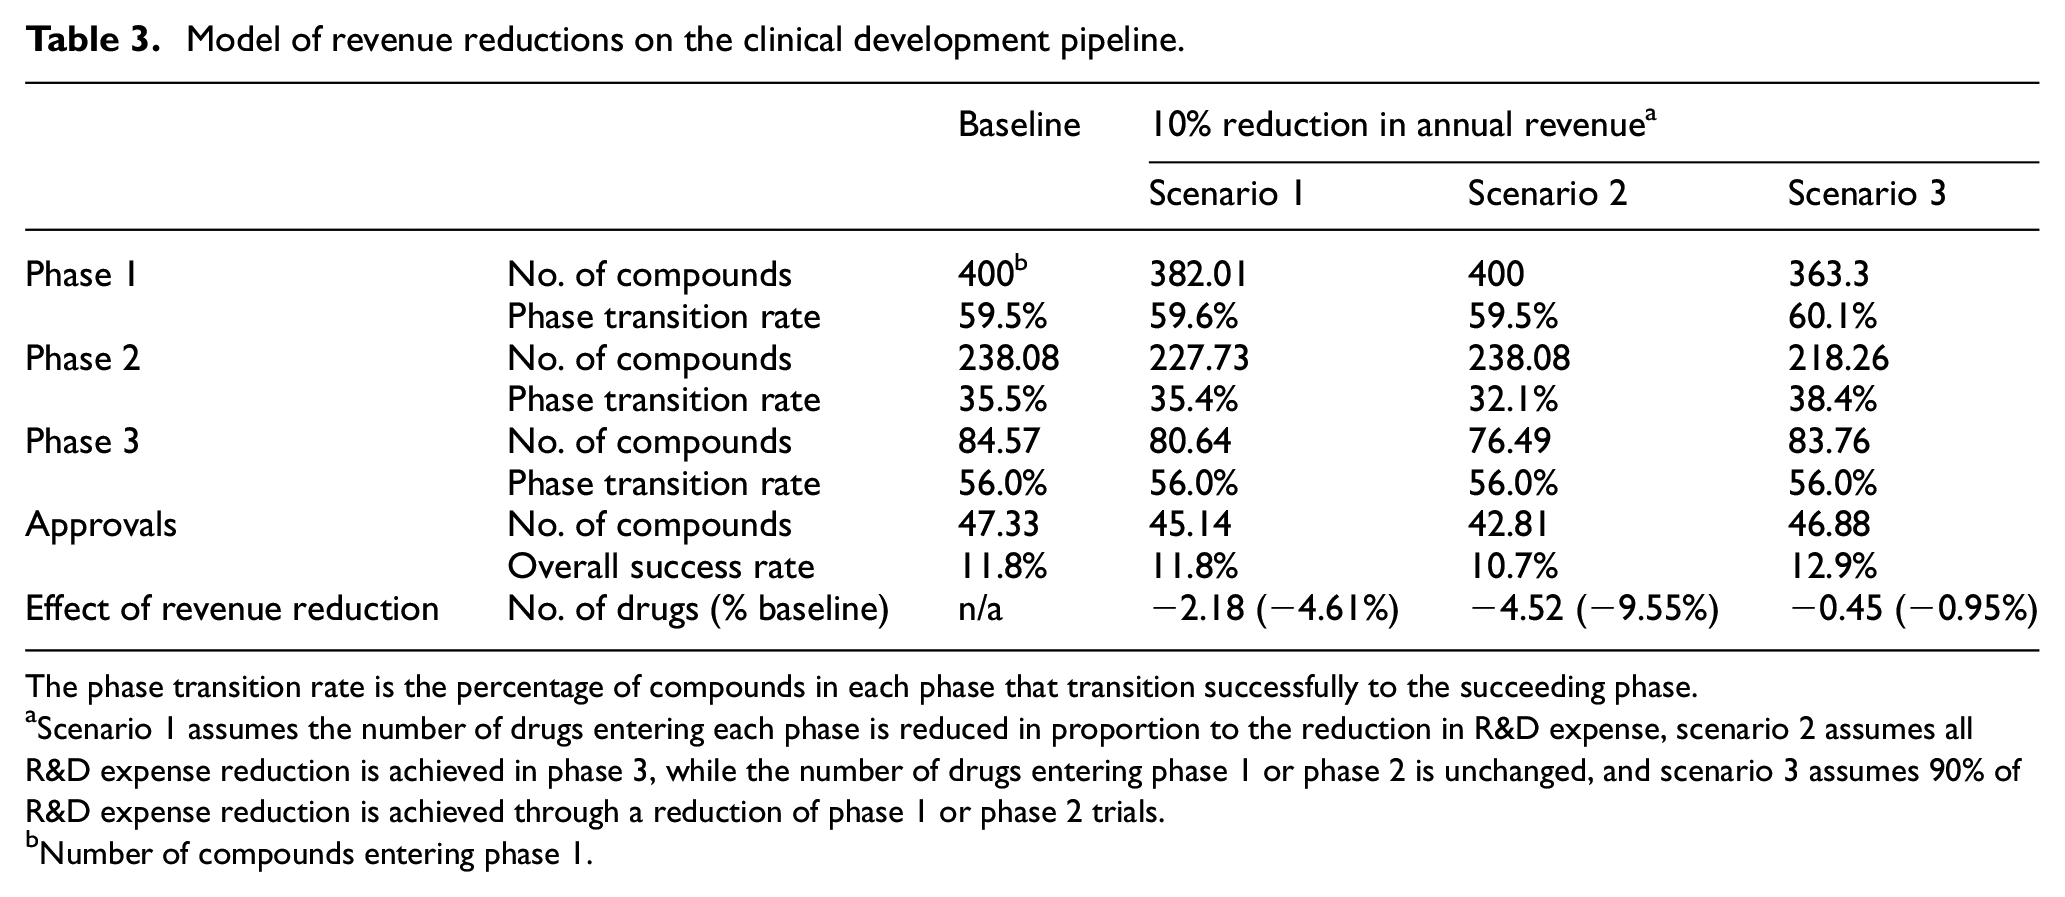
The phase transition rate is the percentage of compounds in each phase that transition successfully to the succeeding phase.
Scenario 1 assumes the number of drugs entering each phase is reduced in proportion to the reduction in R&D expense, scenario 2 assumes all R&D expense reduction is achieved in phase 3, while the number of drugs entering phase 1 or phase 2 is unchanged, and scenario 3 assumes 90% of R&D expense reduction is achieved through a reduction of phase 1 or phase 2 trials.
Number of compounds entering phase 1.
Supplemental Table S6 shows the estimated number of drug approvals with a range of revenue reductions and the three scenarios described above. These results suggest that the strategic allocation of R&D resources and clinical development activities could result in little or no decrease in the number of drug approvals. Different levels of revenue reduction can be modeled using the interactive dashboard at https://bentleyuresearch.shinyapps.io/drugreduction.
Discussion
The objective of this study was to characterize how revenue reductions resulting from the drug price negotiation provisions of the Inflation Reduction Act may impact the availability of capital for R&D in both large and small firms and the number of new drug approvals. The global biopharmaceutical industry comprises more than 8000 companies, ranging from large, fully integrated pharmaceutical companies, which account for a large majority of drug sales, 13 revenue, and R&D expense, to emerging biotechnology firms variously focused on biomedical science, drug discovery, or drug development.17,19,21 This study demonstrates that large and smaller biopharmaceutical companies have distinctly different mechanisms for funding R&D that may influence the potential impact of the Inflation Reduction Act on pharmaceutical innovation.
This analysis demonstrates that the largest pharmaceutical companies, defined in this work as having a market capitalization ≥$7 billion, derived capital for R&D almost entirely from drug revenue and that R&D expense is strongly associated with revenue. These observations are consistent with previous studies demonstrating that R&D in large companies is largely driven by the available market size and that R&D activity has changed in response to changing market conditions associated with implementation of Medicare Part D, 28 changes in population demographics, 29 or the threat of price controls embodied in the Clinton-era health reform proposals.30–33 The strong association between R&D expense and revenue observed for the largest pharmaceutical companies is consistent with traditional financial models in which the discounted value of future revenue is a major factor in determining a company’s valuation and management would be expected to reduce costs in proportion to any reductions in market size to maintain operating margins and earnings.
In contrast, this analysis shows that smaller biopharmaceutical companies, defined in this study as having a market capitalization <$7 billion, often have R&D expense greater than revenue, considering both revenue from drug sales and revenue from research or licensing agreements with large companies. These smaller companies derive a substantial portion of the capital for R&D from new investment, and R&D was more strongly associated with the sale of common and preferred stock than with revenue. Moreover, there was no evidence that new investment was meaningfully associated with either global pharmaceutical sales or the Producer Price Index: Pharmaceutical and Medicine Manufacturing for pharmaceutical products. Together, these studies found no evidence that changes in drug prices or industry revenue were negatively associated with the ability of these companies to procure the capital for R&D.
These associations were incorporated into a steady-state model of the drug development pipeline with a 10% reduction in revenue for both large and smaller companies. The results suggest that, while large pharmaceutical companies may be expected to reduce R&D expense in proportion to any decreases in revenue, the number of drug approvals could be sustained by a combination of sustained R&D activity in smaller companies and strategic allocation of cost reductions in larger companies.
The present analysis differs fundamentally from the simulation models developed by the Congressional Budget Office,8,34 which utilize a theoretical, statistical model of decision-making in drug development based explicitly on the expected returns on R&D spending. The assumptions in the Congressional Budget Office’s model are generally consistent with the empirical findings of this report describing the firm-specific relationships between revenue and R&D expense in large pharmaceutical companies that account for most product sales, revenue, and R&D expense. This assumption, however, is inconsistent with the observation that no such relationship is evident for smaller, emerging companies that, in recent years, have originated 67% of new drugs and sponsored 64% of late-stage clinical trials and 40%–69% of new drug approvals.14–16 Similarly, while the Congressional Budget Office’s econometric models focus on investment returns that may be consistent with strategic decision-making in large companies, our model focuses on the availability and allocation of capital resources. This focus recognizes that resource constraints are often central to decision-making in smaller biotechnology companies and that strategic allocation of R&D resources by larger companies can impact the efficiency of drug approvals.
The model described here identifies two factors that may contribute to sustaining the innovation pipeline. First, smaller or emerging companies currently sponsor more than half of phased clinical trials and are responsible for initiating and launching 40% of drugs approved over the past 5 years.15,16,35 The present analysis suggests that this production will not be impaired by revenue reductions up to 10%.
Second, the allocation of R&D cost reductions in large companies between phase 1, phase 2, or phase 3 trials may be an important factor in maintaining the drug approval pipeline. The model suggests that any negative impacts of revenue reductions up to 10% could be mitigated by targeting cost reductions in large companies to early-stage trials. In this scenario, the late-stage pipeline is maintained by drugs acquired from smaller companies and by lowering the commercial failure rate in early-stage trials. These mechanisms are consistent with existing industry practice, in which 47% of drugs launched by large companies were licensed from smaller companies following initiation of phase 2 trials. 36 Moreover, evidence suggests that many of the drugs that fail to progress through clinical trials are abandoned due to changing commercial priorities rather than issues of safety or efficacy.23,27 In contrast, the effects of revenue reductions could be exacerbated by cutting costs equally across the pipeline or targeting cost reductions to late-stage trials, both of which would increase the commercial failure rate and decrease the number of drug approvals.
It remains unclear how much the Inflation Reduction Act of 2022 will reduce average drug prices or revenue. One analysis estimates that the various drug pricing provisions of the Inflation Reduction Act would have provided $15 billion in cost savings in 2020, 37 representing an approximate 3% reduction in US sales. Another report simulated price negotiations based on the years 2018–2020, estimating that the provisions of the Inflation Reduction Act would have provided cost savings of $26.5 billion. 38 The Congressional Budget Office estimates suggest that the Inflation Reduction Act could provide cost savings to Medicare of $98.5 billion over 10 years, 2 representing an approximate 2% reduction of the estimated $500 billion in projected US sales. The 10% reduction in global revenue modeled in this study is not a predicted value, but rather the year-to-year revenue reduction upper boundary in the data set analyzed, and therefore, the limit for application of the model. A reduction of this magnitude would represent an estimated 30% reduction in prescription drug prices in the United States based on $580.4 billion total US drug spending (2021), $1423.5 billion sales (2021), and prescription drugs representing 82% of US sales (2018) assuming no elasticity in drug sales.25,39
Study limitations and need for further research
First, any model is only as good as the assumptions and data available as inputs. There is considerable variation in reported costs and success rates for clinical development as well as considerable uncertainty regarding the outcomes of the price negotiations mandated by the Inflation Reduction Act. Moreover, the model assumes that reductions in R&D spending are achieved solely by reducing spending on phased clinical trials and does not assume any reduction in corporate earnings, improvements in the efficiency of clinical development, or changes in the therapeutic focus or classes of molecular entities (small molecule vs biological) in the pipeline. Second, this analysis uses financial data reported using US Generally Accepted Accounting Principles, which do not reflect cash flows. Specifically, R&D expense is not synonymous with R&D spending and may not include items that are capitalized and depreciated such as facilities, equipment, research, or products acquired through merger, acquisition, or licensing. Also, “revenue” may not be recognized when payments are received, but rather at the time products or services are provided. 40 Third, this analysis did not include data on private companies or public companies on non-US exchanges. There is no evidence that these companies will resemble public companies listed on US markets. Fourth, this work describes a statistical analysis of a population of biopharmaceutical companies and does not consider firm-specific effects based on the specific drugs chosen for price negotiation, partnerships, therapeutic focus area, drug class, or provisions of the Inflation Reduction Act that provide selected exemptions for smaller biotech companies. This analysis also does not consider firm-specific effects on investment in smaller companies.41–47 Fifth, this analysis does posit differences in transitional efficiency between large and small companies or changes in the nature of products in the pipeline. Further research could examine potential impacts of differences in translational efficiency related to therapeutic area, classes of molecular entities, regulatory policies, or company size.24,48,49 Sixth, this analysis is based on a retrospective analysis of corporate finances and clinical activities. There is no evidence that these patterns will persist in the future.
Conclusion
This work suggests that the drug price negotiation provisions of the Inflation Reduction Act could have little or no impact on the number of drug approvals. More specifically, this analysis suggests that the Inflation Reduction Act may not reduce R&D spending or activity in smaller companies and that strategic management of R&D in large companies may be sufficient to mitigate any negative impacts of the Inflation Reduction Act on the broad pipeline of new products. This may involve strategic allocation of reduced R&D budgets to different phases of clinical development as well as increased reliance on acquisition or licensing of drugs from early-stage trials for late-stage development and commercialization.
Supplemental Material
sj-docx-1-ctj-10.1177_17407745241259112 – Supplemental material for Modeling impact of inflation reduction act price negotiations on new drug pipeline considering differential contributions of large and small biopharmaceutical companies
Supplemental material, sj-docx-1-ctj-10.1177_17407745241259112 for Modeling impact of inflation reduction act price negotiations on new drug pipeline considering differential contributions of large and small biopharmaceutical companies by Gregory Vaughan, Roger Du and Fred D Ledley in Clinical Trials
Footnotes
Acknowledgements
The authors thank Sarah Al-Masri for her contributions to data collection and Juliana Harrison, MBA, for assistance in preparing the manuscript, as well as Cody Hyman, PhD, Brian Fox, PhD, Michael Boss, PhD, Nancy Hsiung, PhD, and Bruce Leicher, Esq, for advice and critical reading of the manuscript. Portions of this work were described at a Congressional Briefing in August 2021 and in a white paper published by the West Health Policy Center, which provided funding for this work. 50
Declaration of conflicting interests
The author(s) declared the following potential conflicts of interest with respect to the research, authorship, and/or publication of this article: Drs G.V. and F.D.L. received a grant at Bentley University from the West Health Policy Center. Dr F.D.L. has received grants at Bentley University from the National Biomedical Research Foundation, Institute for New Economic Thinking, and the National Pharmaceutical Council. Drs F.D.L. and G.V. had full access to all of the data in this study.
Funding
The authors disclosed receipt of the following financial support for the research, authorship, and/or publication of this article: This work was supported by the West Health Policy Center and the National Biomedical Research Foundation. The sponsors had no role in the design and conduct of the study; collection, management, analysis, and interpretation of the data; preparation, review, or approval of the manuscript. There were no restrictions regarding the submission of this report for publication.
Supplemental material
Supplemental material for this article is available online.
References
Supplementary Material
Please find the following supplemental material available below.
For Open Access articles published under a Creative Commons License, all supplemental material carries the same license as the article it is associated with.
For non-Open Access articles published, all supplemental material carries a non-exclusive license, and permission requests for re-use of supplemental material or any part of supplemental material shall be sent directly to the copyright owner as specified in the copyright notice associated with the article.