
Abstract
Introduction
Funders must make difficult decisions about which squared treatments to prioritize for randomized trials. Earlier research suggests that experts have no ability to predict which treatments will vindicate their promise. We tested whether a brief training module could improve experts’ trial predictions.
Methods
We randomized a sample of breast cancer and hematology–oncology experts to the presence or absence of a feedback training module where experts predicted outcomes for five recently completed randomized controlled trials and received feedback on accuracy. Experts then predicted primary outcome attainment for a sample of ongoing randomized controlled trials. Prediction skill was assessed by Brier scores, which measure the average deviation between their predictions and actual outcomes. Secondary outcomes were discrimination (ability to distinguish between positive and non-positive trials) and calibration (higher predictions reflecting higher probability of trials being positive).
Results
A total of 148 experts (46 for breast cancer, 54 for leukemia, and 48 for lymphoma) were randomized between May and December 2017 and included in the analysis (1217 forecasts for 25 trials). Feedback did not improve prediction skill (mean Brier score for control: 0.22, 95% confidence interval = 0.20–0.24 vs feedback arm: 0.21, 95% confidence interval = 0.20–0.23; p = 0.51). Control and feedback arms showed similar discrimination (area under the curve = 0.70 vs 0.73, p = 0.24) and calibration (calibration index = 0.01 vs 0.01, p = 0.81). However, experts in both arms offered predictions that were significantly more accurate than uninformative forecasts of 50% (Brier score = 0.25).
Discussion
A short training module did not improve predictions for cancer trial results. However, expert communities showed unexpected ability to anticipate positive trials.
Pre-registration record: https://aspredicted.org/4ka6r.pdf.
Introduction
Cancer clinical research enjoys an abundance of hypotheses when it comes to testing new molecules, biomarkers, and treatment combinations. Yet because resources are finite and eligible participants limited, funders and research hospitals must make tough choices about which randomized trials to support. Physicians too must decide which trials for which they will recruit. One important consideration in selecting randomized trials is whether a new treatment is likely to improve on standard of care. All else being equal, trials that demonstrate superiority of a new treatment offer greater pay off for participants and healthcare systems.
Little is known about how well physicians and research communities select treatments for randomized trials. According to the principle of clinical equipoise, the outcome of randomized trials should never be known in advance. 1 However, different trials might all fulfill clinical equipoise while being regarded by experts as having different prospects of being positive. For example, physicians might have higher expectations for a precision-medicine drug demonstrating efficacy, or they might be more doubtful about a small study with limited statistical power for detecting a modest effect.
Prior research suggests that research communities are bad at predicting trial results. In one study, expert oncologists showed essentially no ability to predict which trials within their specialty would produce positive results. 2 Another study of neurologists found similar results. 3 More broadly, experts often find it difficult to beat simple models when predicting clinical outcomes.4,5 Yet model-based approaches are not likely to be useful for deciding which trials to run, because new drugs often target mechanisms that are different from drug trial results used to build those models. For the foreseeable future, decisions about which randomized trials to pursue will continue to rely heavily on expert judgment.
Expert predictions might nevertheless be improved by offering experts brief training. Training has elsewhere shown promise for improving prediction in medical contexts.6–11 In other contexts, receiving feedback is associated with reduced overconfidence in predictions. 12 In what follows, we tested whether a simple training module could improve the ability of oncologists to predict which trials would be positive. This training module provided experts an opportunity to practice making predictions and receive feedback.
Methods
Trial selection
We selected ongoing oncology trials in breast or hematologic cancers. We searched ClinicalTrials.gov in March 2017 for phase 2 or 3 trials using search terms: leukemia, myeloma, lymphoma, myelodysplastic syndrome, or breast. We used the following inclusion criteria: (1) interventional trial, (2) randomized, (3) two-arm studies, (4) single primary outcome, and (5) primary completion dates listed between August 2016 and March 2018. Hematologic cancers were divided into “leukemia” and “lymphoma” subsamples, with myelodysplastic syndromes grouped with acute leukemia and myeloma grouped with lymphomas. Non-pharmacological studies were excluded. We verified that no results of eligible trials had been released by performing web searches for the National Clinical Trial (NCT) number and the study acronym, the lead investigator’s last name, or other identifying characteristics of the study, such as the study drug. We also searched for company press releases.
Expert sampling
We created a sample of active cancer subspecialists in breast and hematological cancers using three approaches. First, we searched SCOPUS for breast or hematological cancer clinical trials published since 2013 or 2012, respectively. Authors named on three or more papers and listed at least once as a corresponding author were selected for inclusion. Second, we included subspecialists listed as having breast or hematological oncology expertise within the BioCanRx Network, the American Society of Hematology, and the National Comprehensive Cancer Network. 13 Third, we manually searched hematology experts among the highest ranked 25 US cancer institutions. 14 Experts in each area were further identified from major cancer centers in Canada and France (2 centers in Canada and 11 in France). Each expert was invited to participate through email or mailed letters with two reminders, if necessary.
Treatments
Our original protocol involved three arms: a comparator, a feedback arm, and a “cognitive debiasing training module.” Due to high dropout, the cognitive debiasing arm was dropped and results are not included in the present analysis (n = 11 excluded).
After providing informed consent, participants were randomized 1:1 to control and feedback arms, stratified on the clinical indication. Participants in the control arm were presented with trials matched with their specialty and a brief description of the trial. They were then asked to state the probability the trial would be positive on its primary outcome (for further details, see example in Supplemental Appendix Figure A1).
The feedback arm consisted of a brief training module that was easy to implement. Previous work suggests that experts are prone to overconfidence.15–18 Feedback on prediction skill aimed at curbing overconfidence by alerting experts of the adverse consequences of overconfident forecasts on their forecast skill scores. 12 Experts randomized to the feedback arm were asked to predict outcomes for five trials within their subspecialty for which results had very recently become available. To create the trial sample for feedback, we searched for recently closed trials within the relevant subspecialty using the same criteria as the above trials, except that trial results became available within the 6 months preceding our collection of forecasts. To reduce the likelihood that experts were knowledgeable about the results of trials used for feedback training, our co-authors with relevant expertise reviewed these trials to ensure their results were unlikely to be widely known. Our intervention provided feedback on experts’ prediction accuracy and confidence (Supplemental Appendix Figure A2).
Feedback training provided an opportunity for participants to practice predicting and to learn if they were prone toward overconfidence. We broke down the feedback to focus experts’ attention not just on whether they were correct, but to train participants to carefully consider their confidence levels, similar to differentiating between calibration and discrimination. After predicting the outcomes of the five feedback trials, we gave experts separate definitions of confidence (approaching 0% or 100% represents high confidence and approaching 50% represents low confidence) and accuracy (distance from their forecast to being certain and correct). Experts were shown how many predictions they got right when their predictions were highly confident (greater than 75% or less than 25%) and how many they got right when their predictions showed low confidence (between 25% and 75%). Next experts were shown accuracy described by an A-index as the distance from their forecast to the correct answer where lower means more accurate. For example, a forecast of 20% has an A-index of 80 for a positive trial and 20 for a non-positive. We described their per trial performance as somewhat or very (in)accurate. Finally, we gave experts their average A-index and a breakdown of how many positive trials versus negative trials they predicted correctly (on the right side of 50%). Participants then advanced to the prediction questions as described for the control arm. After predictions were collected, participants were asked to provide demographic information.
Surveys were piloted with three oncologists and modified based on input prior to implementation. The final survey was implemented online through an electronic case report form (e-CRF) using Qualtrics software. The study received ethical approval from McGill University Research Ethics Committee. All participants provided informed consent. Participants were encouraged to participate by offering to provide individualized feedback on their prediction skill and by making a donation to a charity for each participant. The study was pre-registered on AsPredicted.com (AsPredicted #4218; https://aspredicted.org/4ka6r.pdf).
Prediction skill scoring
Outcomes of trials used in surveys were obtained online, from publications, or by contacting the investigators (last contact on February 2021). A trial was considered “positive” when the results showed a significant difference in the primary outcome favoring the experimental arm, at the 0.05 significance level, and “non-positive” otherwise. Predictions offered by experts claiming inside knowledge of trial outcome were excluded from analysis.
The primary outcome of our study was the average Brier score (BS) for each individual across all trials.19,20 BSs measure predictions’ average squared deviation from actual results, where a positive trial result is coded as “1” and a non-positive trial result is coded as “0.” Mean BSs of experts were benchmarked by comparing them against the BS for always predicting 50% (“uninformative forecasts”), which would produce a BS of 0.25. Outcome definitions and concepts are summarized in Table 1.
Forecast Outcome Definitions.
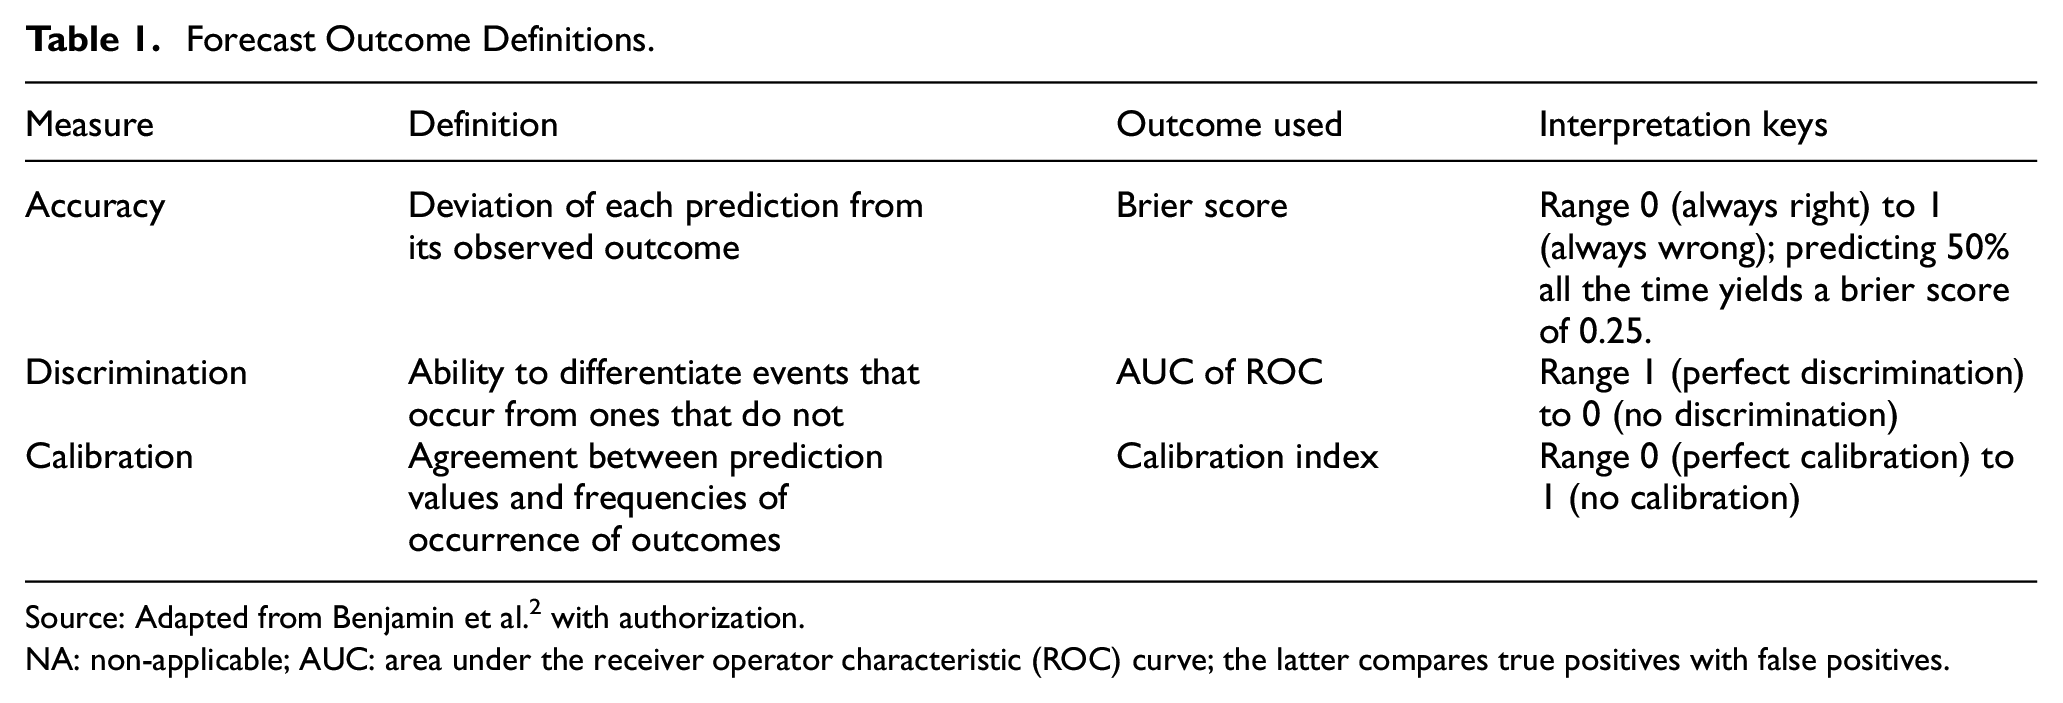
Source: Adapted from Benjamin et al. 2 with authorization.
NA: non-applicable; AUC: area under the receiver operator characteristic (ROC) curve; the latter compares true positives with false positives.
Secondary outcomes were discrimination and calibration. The former measures the extent to which experts’ forecasts on positive trials are different than for non-positive trials. Discrimination was calculated as the area under the curve (AUC) of a receiver operating characteristic (ROC) function created by treating the forecasts with an arm and indication as if they all belonged to a single forecaster. Better discrimination performance is indicated by ROC curves coming closer to the top left corner. Calibration measures the extent to which predictions correspond with actual event frequencies (e.g. for all the times experts predict 70%, trials are positive 70% of the time). Calibration was calculated as described elsewhere. 19 The closer the calibration curves come to the unity line, the better the calibration.
Statistics
To have higher than 80% power of detecting a significant difference of mean BSs of one standard deviation (using a two-sided test, and defining an alpha of 5%), we aimed at including at least 144 experts over the three cancer indications and three arms (16 experts per arm × 3 arms × 3 cancer type specialties). Differences in the BSs across arms were tested using a non-parametric resampling test of difference of means. We performed this test pooling across indications as well as stratified within each indication.
Because prediction skill was similar between each arm, we performed a post hoc aggregate analysis, including an analysis pooling data across arms. Confidence intervals on all reported measures are calculated using bootstrap resampling of individuals. We implemented a modified intent to treat analysis, whereby participants completing fewer than five predictions or who knew results of more than four trials were excluded from analysis (Figure 1).
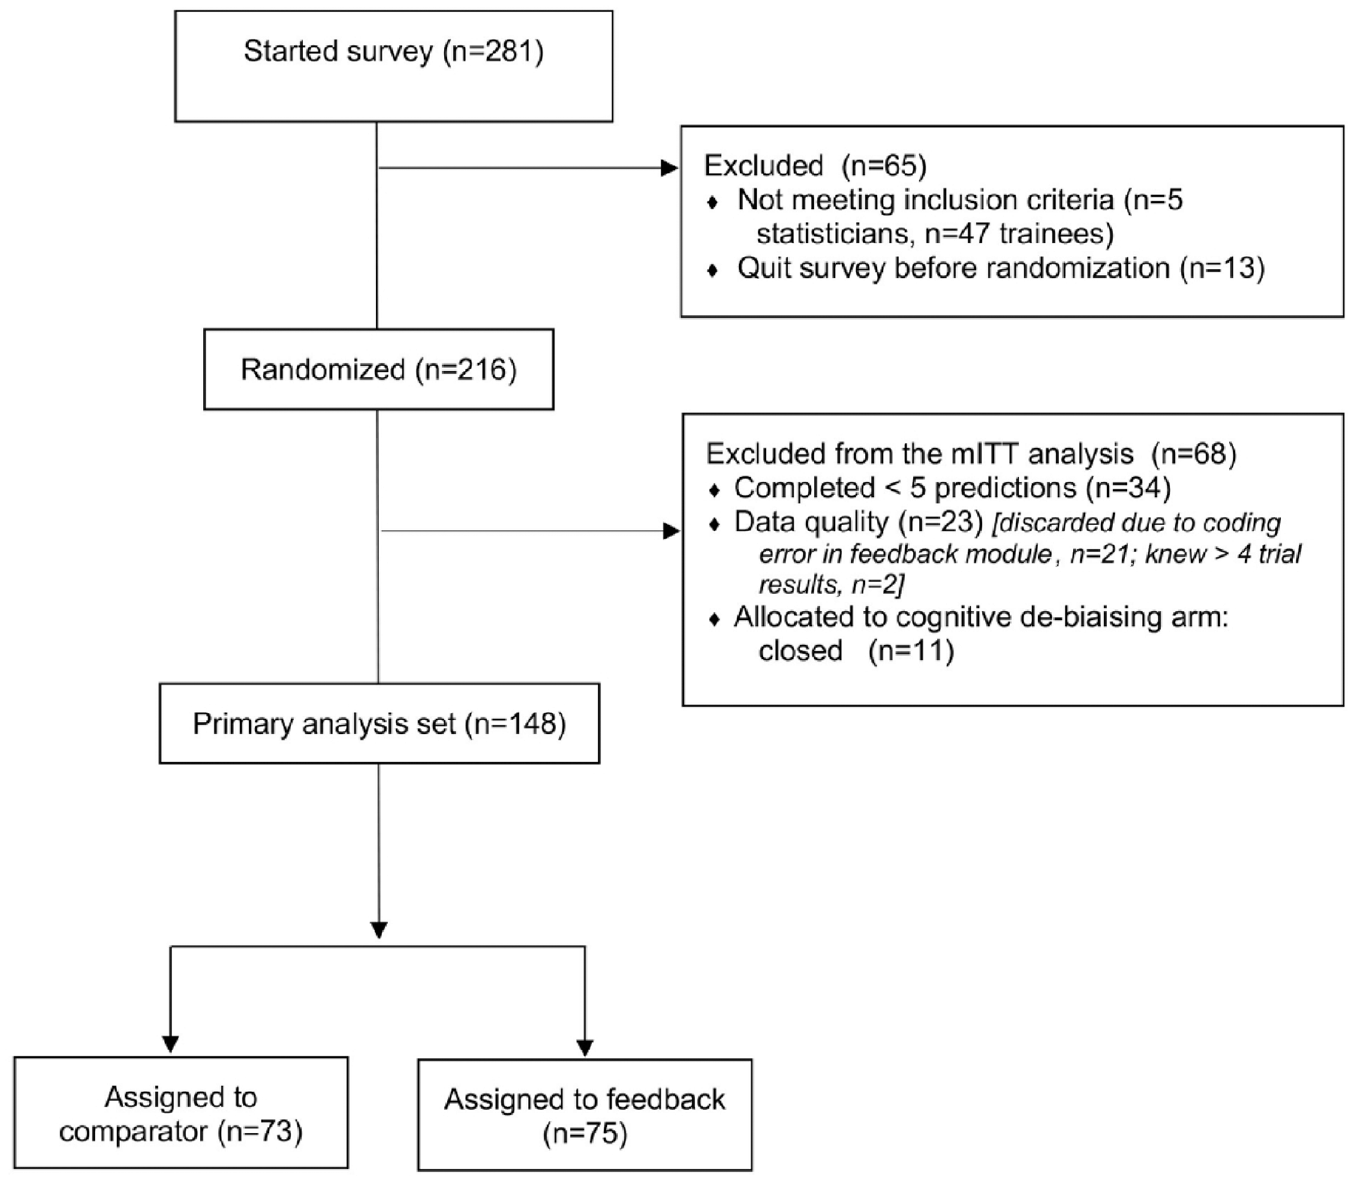
CONSORT flow diagram.
Results
Expert and trial sample
Between May and December 2017, 216 experts were randomized, and 148 were included in the modified intent to treat analysis (46 for breast cancer, 54 for leukemia, and 48 for lymphoma) (see Figure 1 for flow diagram). Most experts (70%) had served on Institutional Review Boards (IRBs) or Data Monitoring Committees (DMCs)—committees that would draw on judgments about whether a trial had favorable prospects of being positive. Most experts had an MD (87%), and most originated from the United States (n = 63), Canada (n = 26), or Europe (n = 30). Participants in control and feedback arms were comparable on key characteristics, including age, sex, and training (Table 2). Experts assigned to the feedback arm spent on average 3–4 min in training (mean 4 (standard deviation (SD) = 2), 4 (SD = 8) and 3 (SD = 3) min for breast, leukemia, and lymphoma survey, respectively).
Demographics of expert sample by indication and arm.
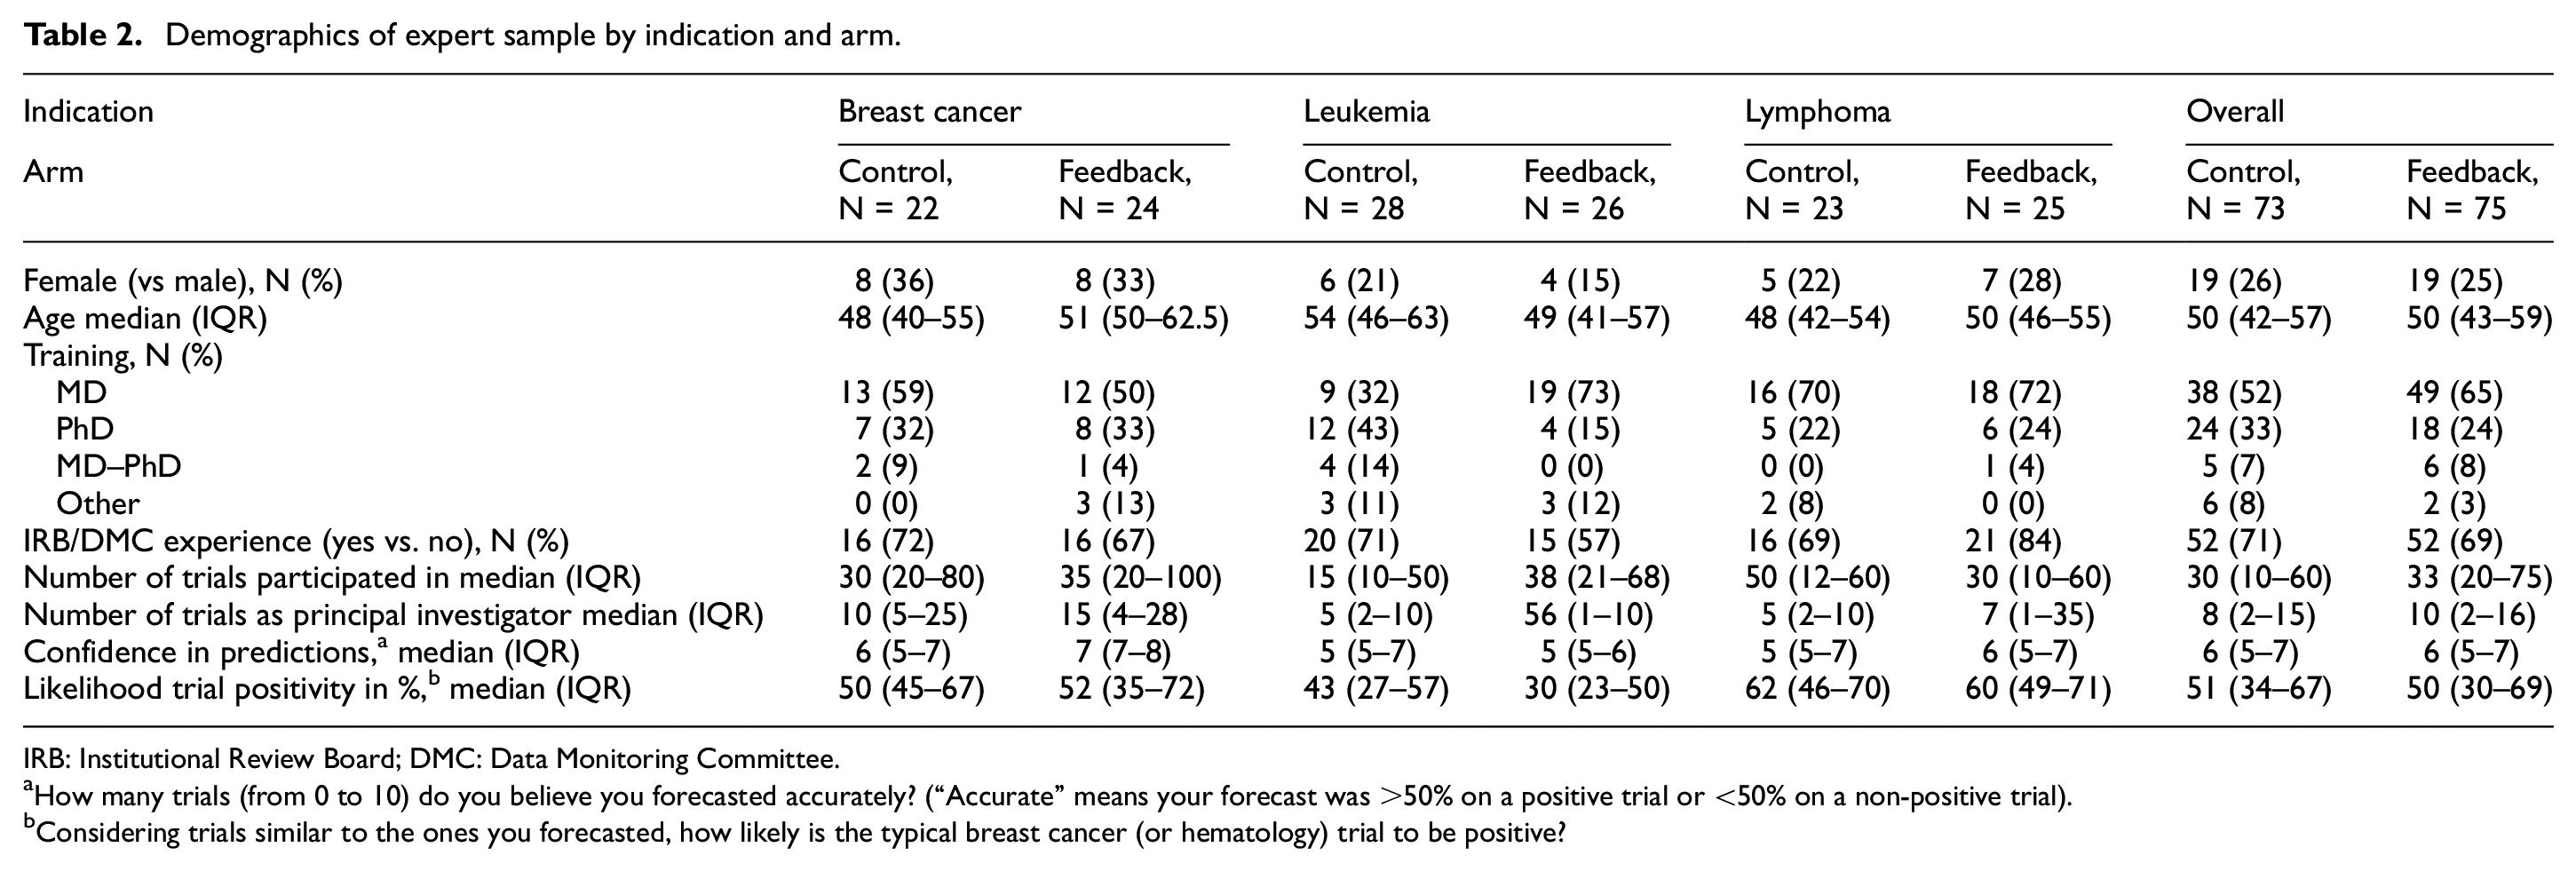
IRB: Institutional Review Board; DMC: Data Monitoring Committee.
How many trials (from 0 to 10) do you believe you forecasted accurately? (“Accurate” means your forecast was >50% on a positive trial or <50% on a non-positive trial).
Considering trials similar to the ones you forecasted, how likely is the typical breast cancer (or hematology) trial to be positive?
Our study used predictions of 25 trials for which outcomes became available within a 4-year follow-up window. Identity and characteristics of trials are described in Table 3. Out of the 25 trials (7 for breast, 9 for leukemia, and 9 for lymphoma), 13 (52%) were positive (3 in breast, 5 in leukemia, and 5 in lymphoma).
Trials used for study (N = 25).
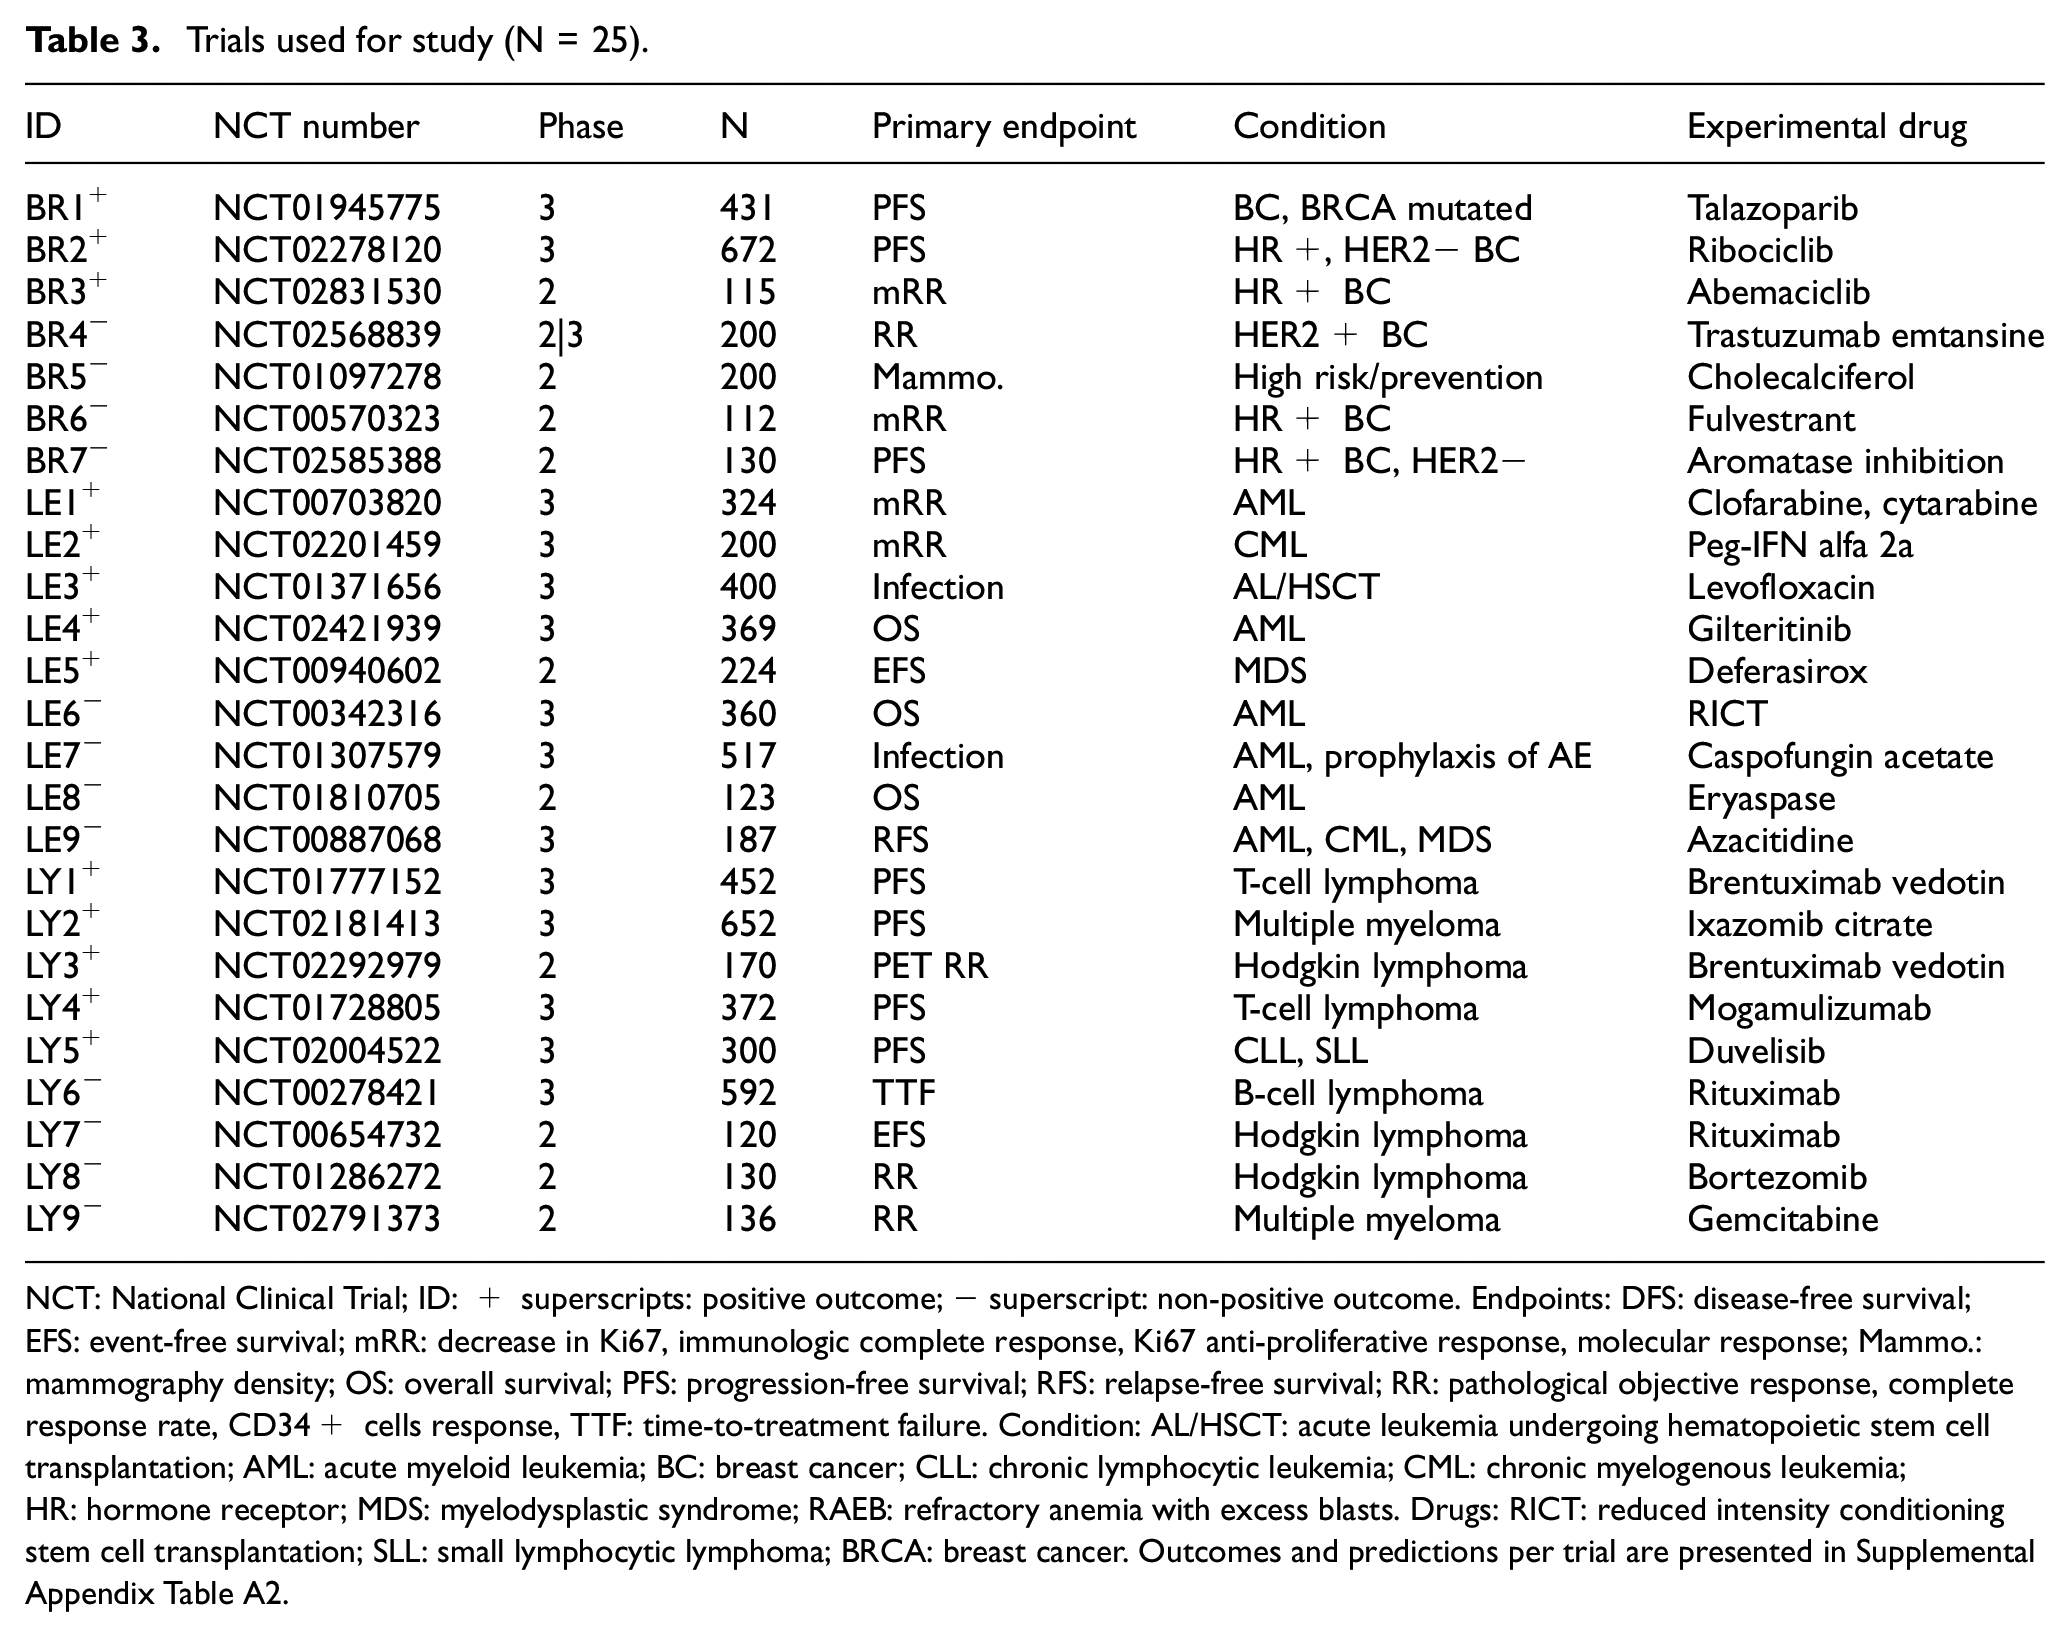
NCT: National Clinical Trial; ID: + superscripts: positive outcome; − superscript: non-positive outcome. Endpoints: DFS: disease-free survival; EFS: event-free survival; mRR: decrease in Ki67, immunologic complete response, Ki67 anti-proliferative response, molecular response; Mammo.: mammography density; OS: overall survival; PFS: progression-free survival; RFS: relapse-free survival; RR: pathological objective response, complete response rate, CD34+ cells response, TTF: time-to-treatment failure. Condition: AL/HSCT: acute leukemia undergoing hematopoietic stem cell transplantation; AML: acute myeloid leukemia; BC: breast cancer; CLL: chronic lymphocytic leukemia; CML: chronic myelogenous leukemia; HR: hormone receptor; MDS: myelodysplastic syndrome; RAEB: refractory anemia with excess blasts. Drugs: RICT: reduced intensity conditioning stem cell transplantation; SLL: small lymphocytic lymphoma; BRCA: breast cancer. Outcomes and predictions per trial are presented in Supplemental Appendix Table A2.
Average prediction score
Our analysis included 1217 individual predictions. Violin plots of forecasts are shown in Figure 2. Mean forecasts varied from one trial to another. Overall, however, experts were neither pessimistic nor optimistic about trials in their sample being positive: the average forecast of trial positivity was 53.4% (95% confidence interval (CI) = 50.7%–54.1%). By indication, average forecasts were 57.2% for breast cancer (95% CI =54.1%–60.6%), 51.4% for leukemia (95% CI =45.5%–51.6%), and 53.0% for lymphoma (95% CI = 50.5%–55.2%).
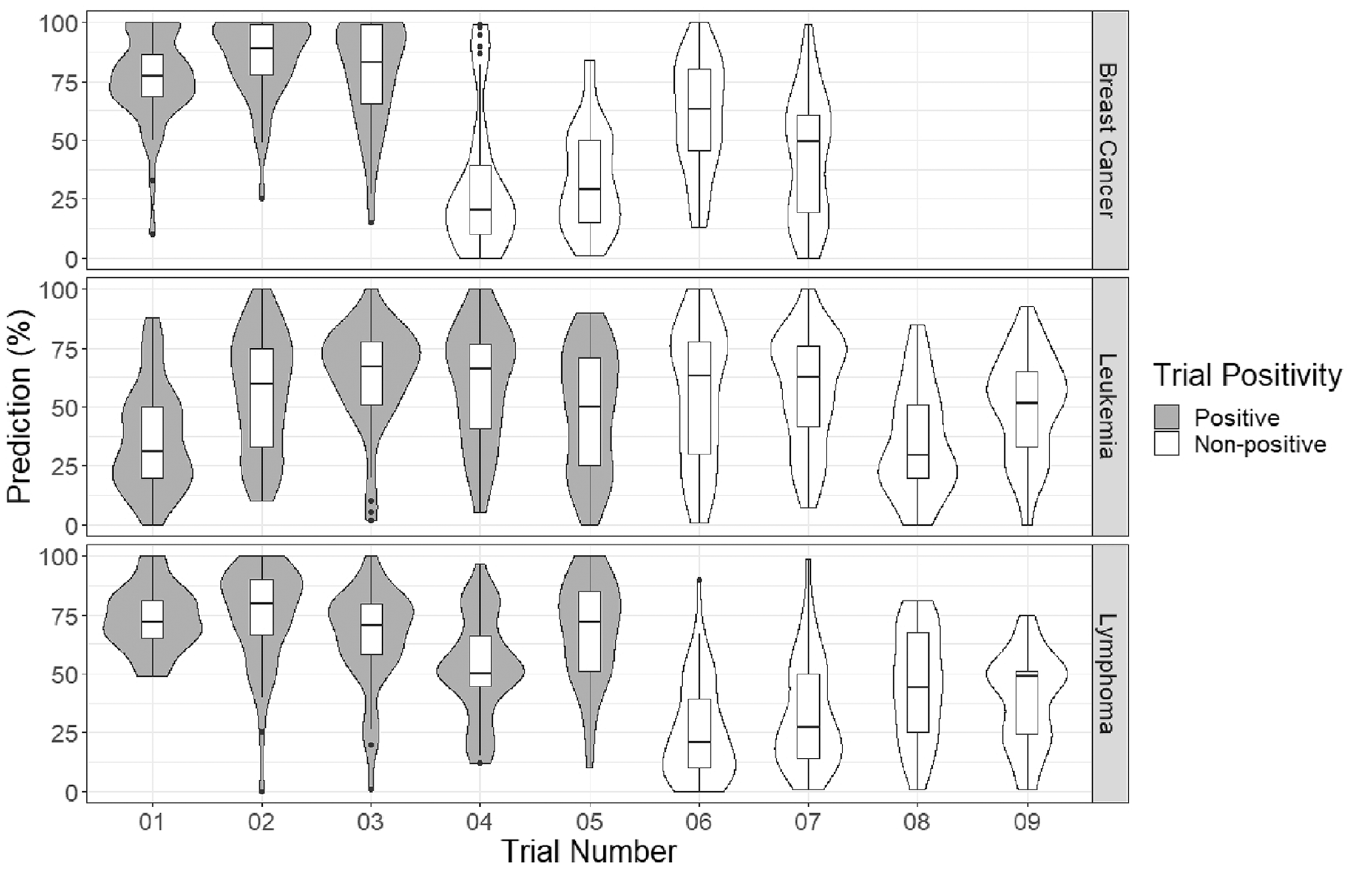
Violin plots of the forecasted probability of a positive outcome for each breast cancer, leukemia, and lymphoma trial.
Recall that, for BSs, lower scores indicate greater skill; scores below 0.25 indicate skill exceeding an uninformative forecaster (i.e. an individual who predicts 50% all the time). The mean BS was 0.22 for experts in the control arm (95% CI = 0.20–0.24) versus 0.21 (95% CI = 0.20–0.23) for experts in the feedback arm; the difference was not significant (p = 0.51). Mean BSs by indication are shown in Table 4 (violin plots in Supplemental Appendix Figure A3). Average BSs for breast cancer (0.17, 95% CI = 0.15–0.20) and lymphoma (0.16, 95% CI = 0.15–0.18) significantly outperformed that for uninformative forecasts (0.25, p < 0.001 in both cases), while those for leukemia (0.29, 95% CI = 0.28–0.32), experts did not outperform this benchmark (p = 0.99).
Mean Brier score, AUC, calibration index, and 95% confidence intervals by indication and arm.
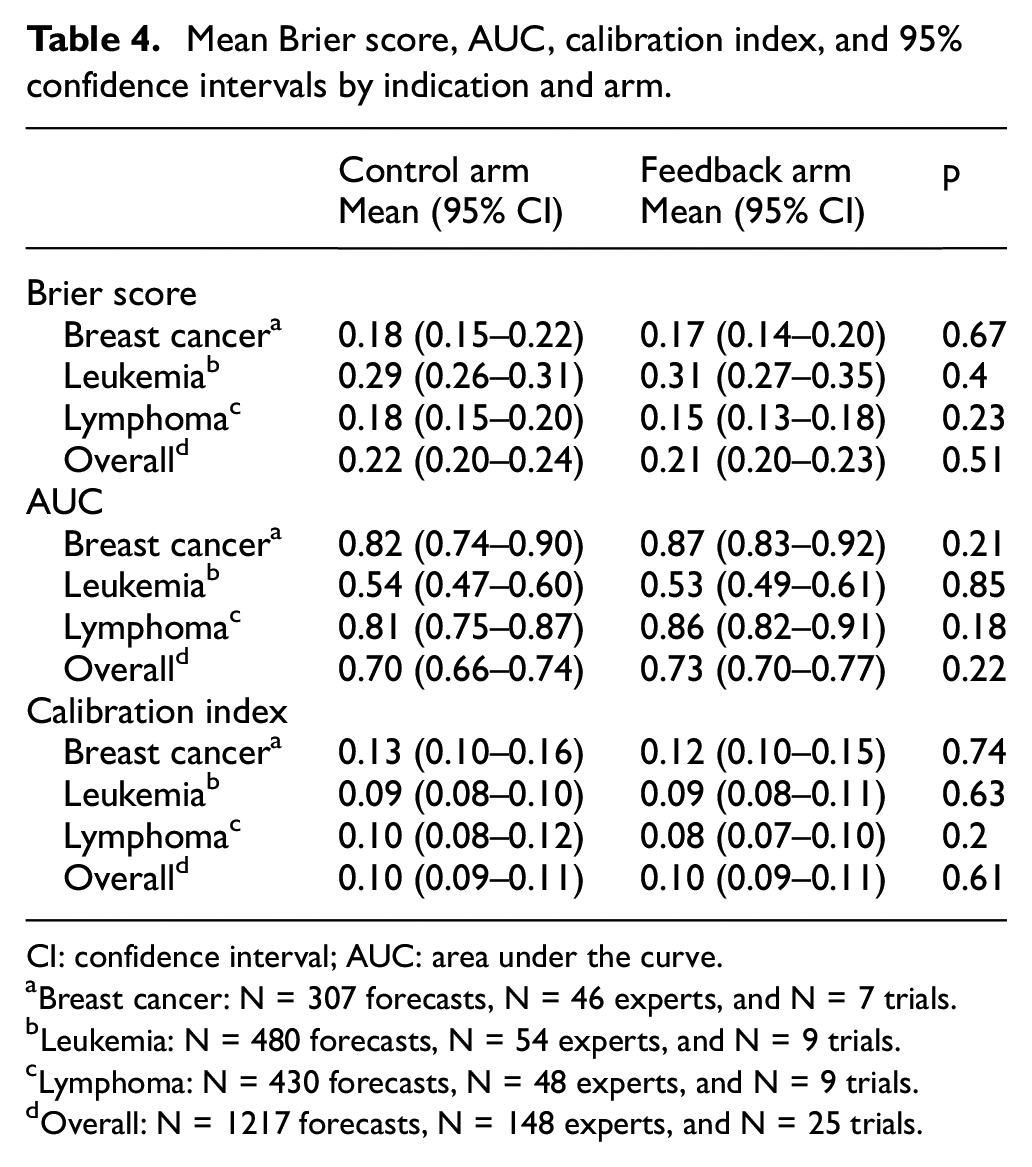
CI: confidence interval; AUC: area under the curve.
Breast cancer: N = 307 forecasts, N = 46 experts, and N = 7 trials.
Leukemia: N = 480 forecasts, N = 54 experts, and N = 9 trials.
Lymphoma: N = 430 forecasts, N = 48 experts, and N = 9 trials.
Overall: N = 1217 forecasts, N = 148 experts, and N = 25 trials.
Discrimination for all participants in the control arm was AUC = 0.70 (95% CI = 0.66–0.74) versus 0.73 (95% CI = 0.70–0.77) for the feedback arm; the difference was not significant (p = 0.22). Table 4 contains the AUC scores, and Figure 3(a) depicts the ROC curves for each arm in each indication. The calibration index for all participants in the control arm was 0.10 (95% CI = 0.09–0.11) while that for the feedback arm was 0.10 (95% CI = 0.09–0.11); the difference was not significant (p = 0.61). Table 4 shows the calibration indices for each indication. Figure 3(b) depicts the calibration curves for each arm in each indication. There were no significant differences between arms, for any of the three indications, on calibration or discrimination.
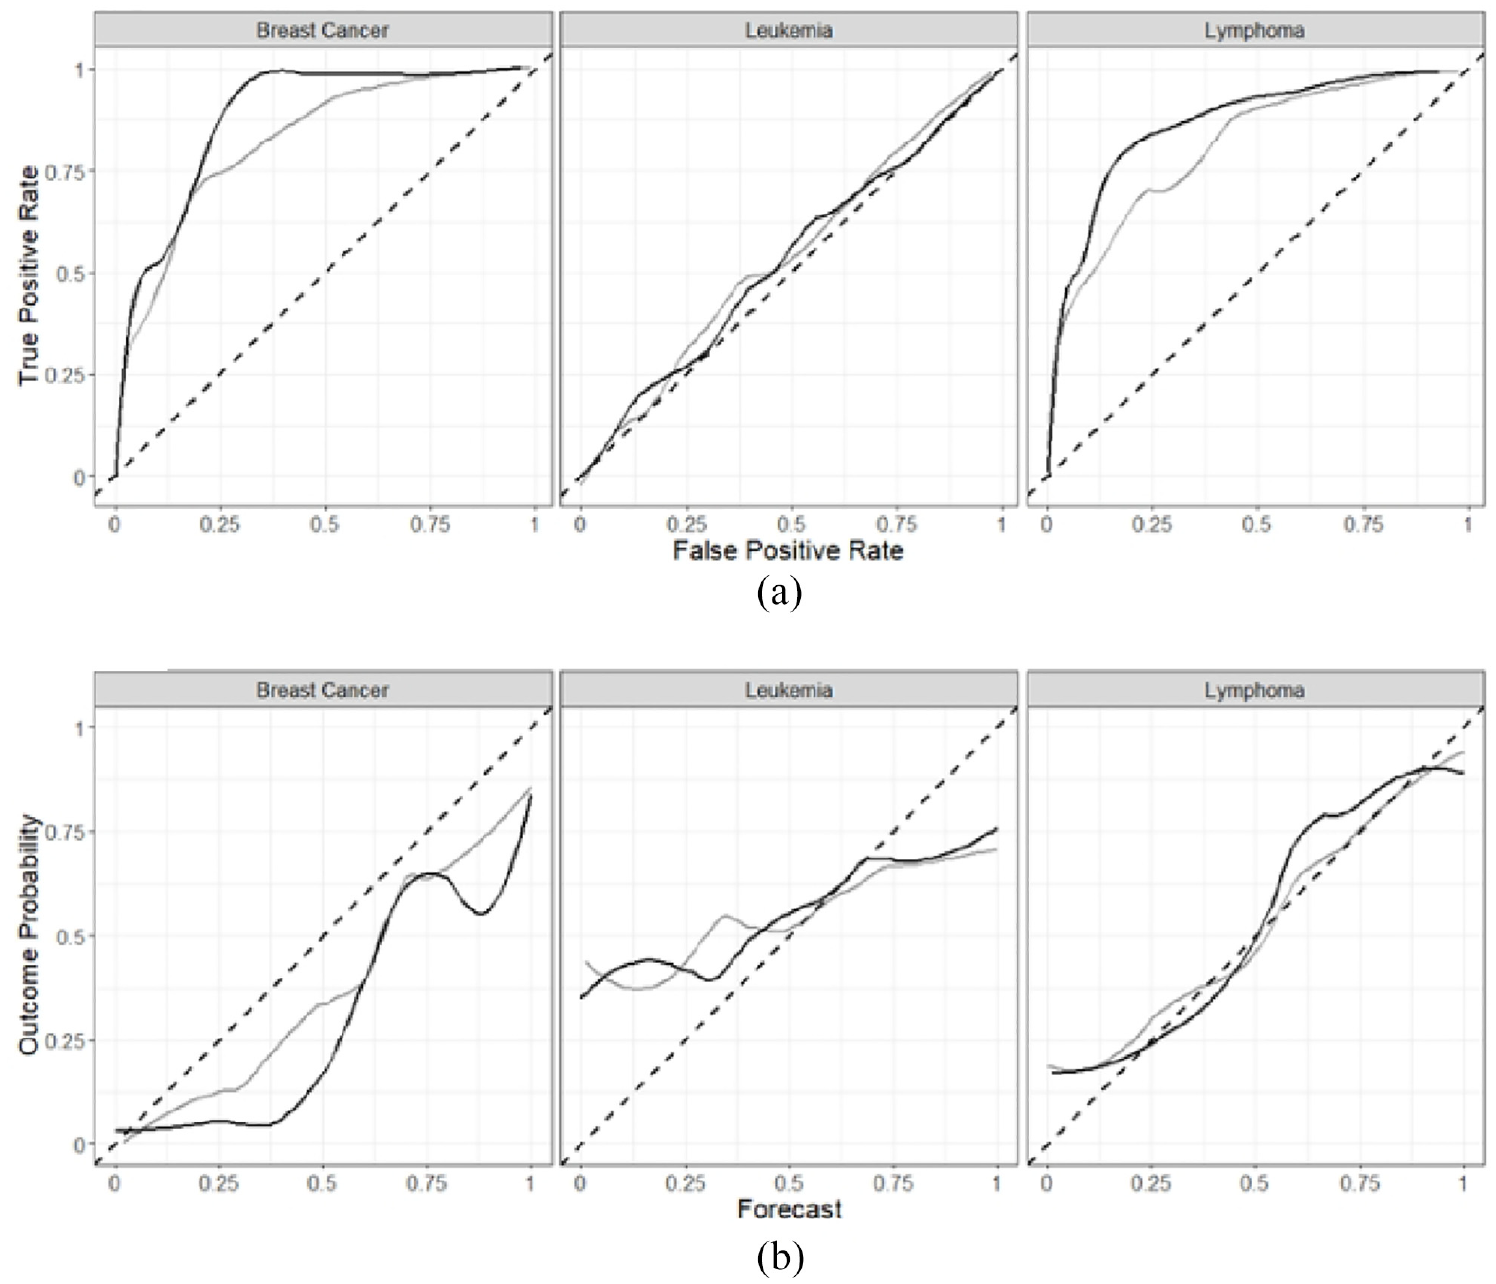
Receiver operating characteristic (ROC) curves (a) and calibration curves (b) for each arm and indication, with the feedback arm in black and the control arm in gray.
Aggregating all raw forecasts predictions within each trial and across both arms in the post hoc analysis into a single prediction produced an overall BS of 0.17 (95% CI = 0.16–0.18). This reflects a BS = 0.13 (95% CI = 0.11–0.15) for breast cancer, 0.24 (95% CI = 0.22–0.26) for leukemia, and 0.12 (95% CI = 0.11–0.14) for lymphoma. The overall AUC for the aggregate predictions was 0.89 (95% CI = 0.85–0.92). The overall calibration index for the aggregate predictions was 0.05 (95% CI = 0.04–0.06).
Discussion
Previous studies suggested that oncologists are no better at predicting which randomized trials will be positive than if they offered uninformative forecasts (e.g. guessing 50%).2,3 This study tested whether a short training module could improve prediction accuracy. Our training module did not improve the ability of experts to anticipate the probability of positive trial outcomes. Nor did our training module have any impact on the two components of forecast skill, discrimination, and calibration.
However, cancer experts in this study showed unexpected skill in predicting trial outcomes. A previous study using almost identical methods produced a mean BS of 0.29, which was significantly worse than uninformative prediction. 2 This same study also indicated that experts had no ability to assign higher probabilities for positive trials (AUC = 0.52). This study showed experts as having some ability to discern which trials would be positive (AUC = 0.70). Discrimination was especially impressive for lymphoma and breast cancer experts, with AUC values in the range of 0.8–0.9. Leukemia expert forecast performance, by contrast, was similar to our previous findings. Differences in skill across different indications may reflect random variation of the trial set we chose and random variation in their outcomes. It could also reflect that outcomes for leukemia trials were less predictable, perhaps because of greater uncertainty about the underlying science for the trials in our sample.
Reconciliation of our demonstration of high forecast skill in this study with our failure to show forecast skill in previous studies awaits further investigation. We believe this study suggests, overall, that there are circumstances where experts can anticipate outcomes of randomized trials. Of note, this study used a larger sample of trials and forecasters than the previous one.
Some may regard the prediction skill observed in our study as betraying a lack of clinical equipoise for studies in our sample, since equipoise implies outcome unpredictability.21,22 This interpretation is mistaken. Consider study NCT01371656, a Children’s Oncology Group study testing levofloxacin for prevention of bacteremia in children undergoing stem cell transplant for acute leukemia. The mean prediction for this trial (64%) clearly suggests that a majority of oncologists believed levofloxacin would outperform its standard of care comparator. Yet a sizable fraction of the expert community, 24%, offered predictions expressing overall doubt about primary outcome attainment, with some experts expressing extreme doubt. Such diversity of opinion clearly reveals expert disagreement that only well-designed trials can resolve.
Our findings suggest that expert predictions, when pooled with each other, contain useful information about the prospects of different trials being positive. Whereas the average BS for each individual expert in our sample was 0.22 (95% CI = 0.20–0.24), the BS for community averages of forecasts was 0.17 (95% CI = 0.16–0.18). This is consistent with “wisdom of the expert crowd” phenomena observed in other settings.23,24 Pooling forecasts from even a small number of experts (absent feedback training) could be used to prioritize treatments for testing.
Our findings should be interpreted in light of several limitations. First, our failure to detect advantage from training does not exclude that better training approaches might prove more useful. Our training approach had three essential characteristics: brevity, a forum in which experts could practice articulating subjective probabilities, and an opportunity to observe the risks of offering extreme predictions. More intensive training or training given serially (rather than in a batch) might improve forecast skill. Second, it is impossible to exclude the possibility that outcomes for the particular trials in our sample might have been more predictable than typical randomized trials. Third, our approach to scoring prediction relied on a metric, the BS, that is known to heavily penalize wrong predictions. Nevertheless, our failure to observe differences on discrimination or calibration leads us to think our findings are generalizable.
A simple training approach did not improve expert predictions about trial outcomes. However, our study does not exclude that forecast accuracy in this setting is a skill that can be developed with repeated effort applied over time. Nor does it exclude that offering incentives that favor accuracy overconfidence in funding and ethics review would help improve the impact of such an intervention. Another brief intervention that might be tried in future studies would be to use conditional probabilities to improve forecast accuracy. For example, experts might be asked to predict positive trial outcomes provided certain scientific or operational milestones (like successful recruitment) are met.
Our study suggests that expert communities harbor insights about which cancer treatments will show efficacy in randomized trials. These insights are amplified when predictions are pooled. If replicated, this has reassuring implications for many facets of medicine and research. For example, it suggests that guideline recommendations for treatments that have not been tested in randomized trials may, on balance, be right much of the time. It would also suggest that tapping expert community forecasts can help with prioritizing the most promising clinical hypotheses for randomized trials.
Supplemental Material
sj-docx-1-ctj-10.1177_17407745231203375 – Supplemental material for The impact of feedback training on prediction of cancer clinical trial results
Supplemental material, sj-docx-1-ctj-10.1177_17407745231203375 for The impact of feedback training on prediction of cancer clinical trial results by Adélaïde Doussau, Patrick Kane, Jeffrey Peppercorn, Aden C Feustel, Sylviya Ganeshamoorthy, Natasha Kekre, Daniel M Benjamin and Jonathan Kimmelman in Clinical Trials
Footnotes
Acknowledgements
Without implying their endorsement of our manuscript, the authors thank Harry Atkins, Chris Bredesen, Dean Fergusson, and Amanda MacPherson for various contributions to the present work. The authors also thank the oncologists who participated in our study.
Author contributions
J.K. contributed to the conceptualization. A.D. and P.K. contributed to the data curation. A.D. and P.K. contributed to the formal analysis. J.K. contributed to the funding acquisition. N.K., J.P., A.D., P.K., A.C.F., and S.G. contributed to the investigation. A.D., P.K., D.M.B., J.P., and N.K. contributed to the methodology. J.K. contributed to the project administration. J.K. contributed to the supervision. A.D. and P.K. contributed to the visualization. A.D. and J.K. contributed to the writing original draft. All authors contributed to the writing, review, and editing.
Declaration of conflicting interests
The author(s) declared no potential conflicts of interest with respect to the research, authorship, and/or publication of this article.
Funding
The author(s) disclosed receipt of the following financial support for the research, authorship, and/or publication of this article: This work was supported by BioCanRx.
Supplemental material
Supplemental material for this article is available online.
References
Supplementary Material
Please find the following supplemental material available below.
For Open Access articles published under a Creative Commons License, all supplemental material carries the same license as the article it is associated with.
For non-Open Access articles published, all supplemental material carries a non-exclusive license, and permission requests for re-use of supplemental material or any part of supplemental material shall be sent directly to the copyright owner as specified in the copyright notice associated with the article.