
Abstract
Background
Adaptive platform trials allow randomized controlled comparisons of multiple treatments using a common infrastructure and the flexibility to adapt key design features during the study. Nonetheless, they have been criticized due to the potential for time trends in the underlying risk level of the population. Such time trends lead to confounding between design features and risk level, which may introduce bias favoring one or more treatments. This is particularly true when experimental treatments are not all randomized during the same time period as the control, leading to the potential for bias from non-concurrent controls.
Methods
Two analysis methods addressing this bias are stratification and adjustment. Stratification uses only comparisons between treatment cohorts randomized during identical time periods and does not use non-concurrent randomizations. Adjustment uses a modeled analysis including time period adjustment, allowing all data to be used, even from periods without concurrent randomization. We show that these competing approaches may be embedded in a common framework using network meta-analysis principles. We interpret the stages between adaptations in a platform trial as separate fixed design trials. This allows platform trials to be viewed as networks of direct randomized comparisons and indirect non-randomized comparisons. Network meta-analysis methodology can be re-purposed to aggregate the total information from a platform trial and to transparently decompose this total information into direct randomized evidence and indirect non-randomized evidence. This allows sensitivity to indirect information to be assessed and the two analysis methods to be clearly compared.
Results
Simulations of platform trials were analyzed using a network approach implemented in the netmeta package in R. The results demonstrated bias of unadjusted methods in the presence of time trends in risk level. Adjustment and stratification were both unbiased when direct evidence and indirect evidence were consistent. Network tests of inconsistency may be used to diagnose inconsistency when it exists. In an illustrative network analysis of one of the treatment comparisons from the STAMPEDE platform trial in metastatic prostate cancer, indirect comparisons using non-concurrent controls were inconsistent with the information from direct randomized comparisons. This supports the primary analysis approach of STAMPEDE, which used only direct randomized comparisons.
Conclusion
Network meta-analysis provides a natural methodology for analyzing the network of direct and indirect treatment comparisons from a platform trial. Such analyses provide transparent separation of direct and indirect evidence, allowing assessment of the impact of non-concurrent controls. We recommend time-stratified analysis of concurrently controlled comparisons for primary analyses, with time-adjusted analyses incorporating non-concurrent controls reserved for secondary analyses. However, regardless of which methodology is used, a network analysis provides a useful supplement to the primary analysis.
Keywords
Background
Platform trials provide a framework for undertaking randomized controlled treatment comparisons of potentially many treatments, while flexibly allowing design adaptations as the study progresses.1,2 Adaptive design changes include adding new treatments, dropping existing treatments, altering randomization allocations, enrichment to selectively recruit participants likely to respond, and many others. The times of design adaptations define a multi-stage structure for platform trials which motivates an alternative name, multi-arm multi-stage studies (MAMS). 3
Despite the flexibility of platform trials, they have been criticized because the adapting design may introduce bias if there are time trends in the population risk level.4,5 Indeed, if treatments are not all randomized during identical time periods, the non-concurrent randomization leads to a mixture of randomized and non-randomized evidence. 4
Although the design of a platform trial may adapt over time, the multi-stage structure provides a sequence of fixed design trials. The synthesis of information from the multiple stages of a single platform trial is therefore analogous to a meta-analysis of fixed design trials. Our goal is to take advantage of this structure by using meta-analytic principles to overcome some of the limitations of platform trials, and to provide transparent delineation between randomized and non-randomized evidence.
The primary limitation of adapting the study design over time is that key design features become confounded with time. This means that if the background risk of participants is related to time of randomization, comparisons of risk between treatments may be biased. For example, if the underlying risk level of the population decreases over time, and the allocation ratio of an experimental treatment is increased over time relative to the control, then this will bias the controlled comparison in favor of the experimental treatment.
There have been two primary approaches for dealing with this confounding. The first approach, which we will call adjustment, uses a modeled analysis including an adjustment for randomization time. An example of a platform trial following this strategy is the REMAP-CAP trial in COVID-19.4,6 In this trial, the primary analysis uses a time epoch adjustment allowing all data to be used in treatment comparisons, even for periods in which there was no concurrent randomization to the treatments being compared. The second approach, which we will call stratification, involves using the stages of a platform trial as time strata, and only using those strata that include concurrent randomization to the treatments being compared. An example of a platform trial using this strategy is the STAMPEDE trial in prostate cancer.3,7 Advocates of adjustment argue that it allows more information to be extracted, while advocates of stratification argue that it preserves randomization and is, therefore, less susceptible to bias and modeling assumptions.
In this article, we present an approach to analyzing platform trials that embeds both approaches within a common framework. We use network meta-analysis principles, providing an established methodology for combining direct and indirect comparisons. 8 We show how a platform design may be viewed as a network of direct and indirect comparisons, which may be decomposed into randomized and non-randomized evidence. This allows both the adjusted and stratified approaches to be conveniently compared in a common framework that allows transparent assessment of their consistency.
Methods
Our proposed analysis method is based on viewing a platform trial as a network of direct and indirect treatment comparisons. The stratified and adjusted approaches described above correspond, respectively, to restricting the analysis to direct comparisons or aggregating the information from the direct and indirect comparisons. The aggregation of direct and indirect treatment comparisons is called a mixed treatment comparison.9,10 Methods for undertaking mixed treatment comparisons are well-known in meta-analysis and may be re-purposed for the analysis of a single platform trial.
Mixed treatment comparisons
Figure 1 depicts an illustrative platform trial with four stages and five treatment arms, including one control and four experimental treatments. The study is initiated at time
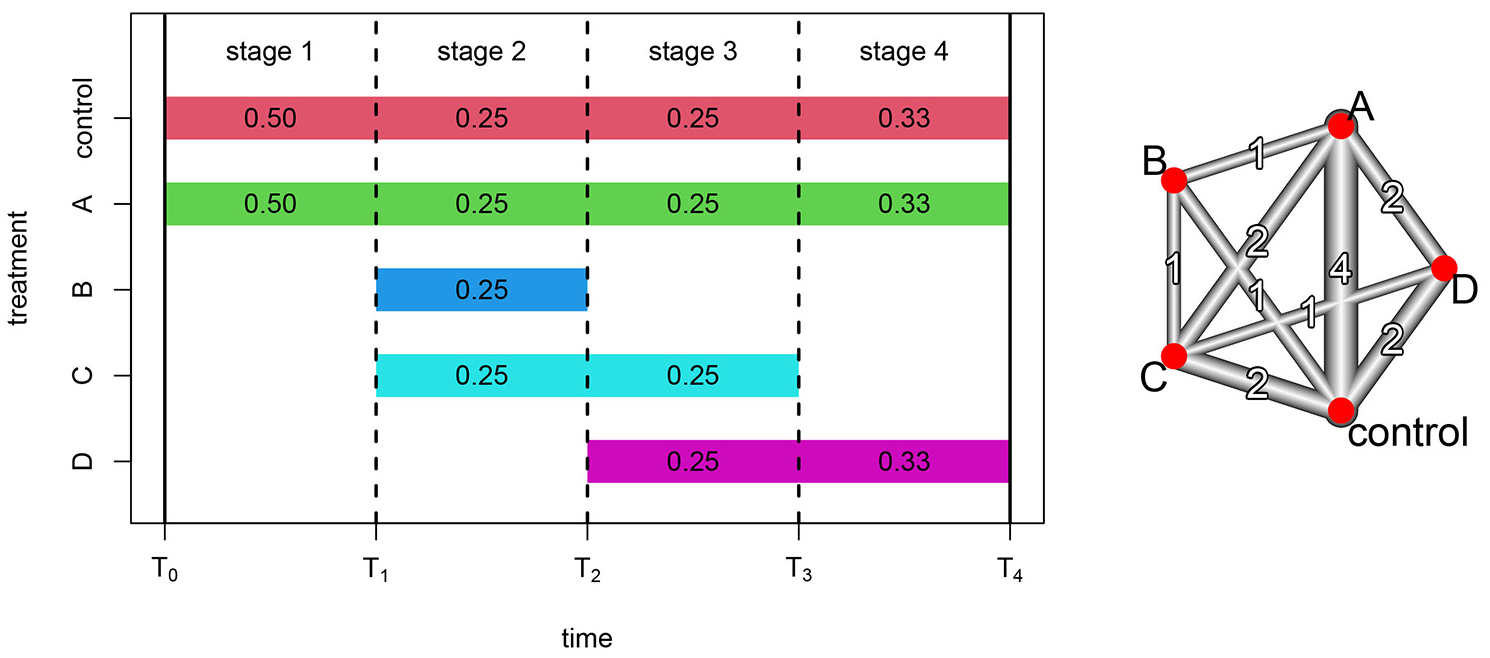
Platform trial with four treatments compared to a common control. Design adaptations occur at three timepoints denoted by vertical dashed lines, yielding four stages. Colored bands denote the stages that each treatment is available for randomization, with the corresponding stage-specific randomization probabilities. The network diagram depicts the network and number of direct treatment comparisons available within the platform.
The MAMS structure in Figure 1 is equivalent to four distinct randomized trials with four different fixed designs: (1) control versus A; (2) control versus A, B, and C; (3) control versus A, C, and D; and (4) control versus A and D. Within each stage-specific design, randomization is fully preserved, and the design does not change. Thus, within stages, the concurrent randomization prevents any bias resulting from changes in background risk. However, between stages there are design changes that are confounded with time, so comparisons between stages are susceptible to bias from changes in background risk.
Figure 1 yields a collection of direct and indirect treatment comparisons. A direct comparison compares treatment cohorts concurrently randomized within the same study stage, whereas an indirect comparison compares treatment cohorts randomized during different stages with a reference treatment common to both stages. For example, stage 2 provides a direct comparison of control and treatment B, yielding an effect estimate
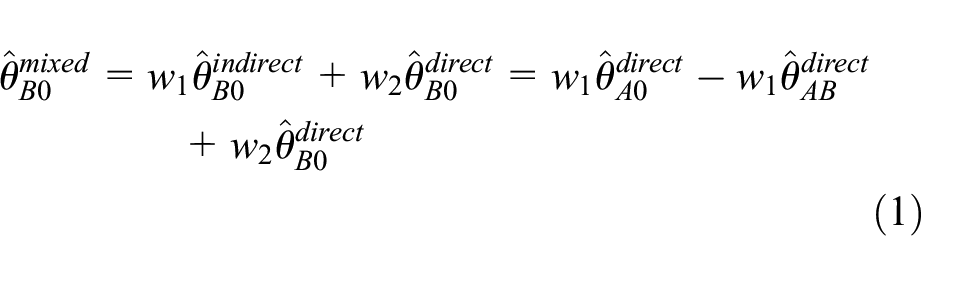
From equation (1), the mixed treatment effect estimate is a linear combination of the three direct treatment effect estimates. As we will see, network meta-analysis generalizes this notion to complex networks of treatment comparisons by using linear combinations of direct treatment effect estimates to optimally combine direct and indirect information.
Use of the direct effect estimate
Network analysis
Figure 1 also displays a network representation of the direct comparisons available within the illustrative platform trial. Vertices represent treatments while edges represent direct comparisons between the associated treatments. The width and number associated with each edge represent the number of stages providing each direct comparison. Where two vertices are not directly connected, if they can be reached from each other by passing through a third vertex, then an indirect comparison is available with the third treatment as reference. For the network displayed in Figure 1, direct comparison of treatments B and D is unavailable. However, since vertex D can be reached from vertex B via each of the other three treatments, indirect comparisons are available with each of the other three treatments as reference. We now discuss the synthesis of such direct and indirect evidence using network meta-analysis and demonstrate its application to the network representation of platform trials.
Network analysis methods are more straightforward to describe when we assume that there is a common control arm in all stages. This is not an essential assumption but will often be true in platform trials and can be relaxed with additional technical details. 11
For each stage
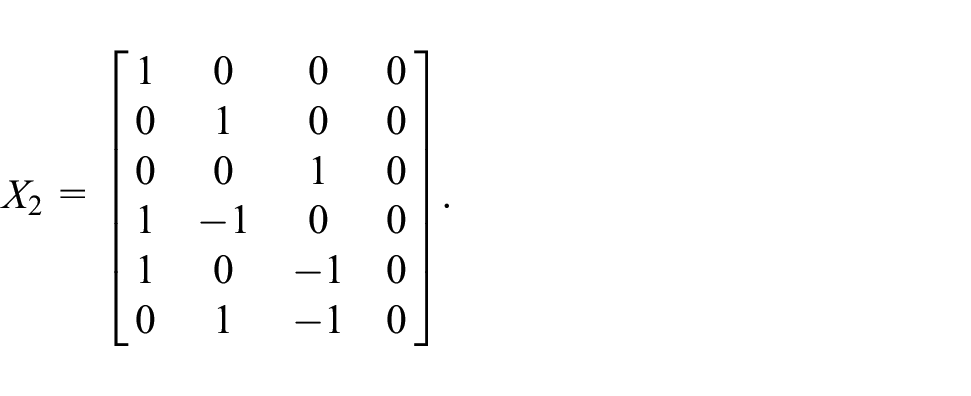
Using this notation, the linear model for a general platform trial is then specified in terms of a
for some appropriately chosen
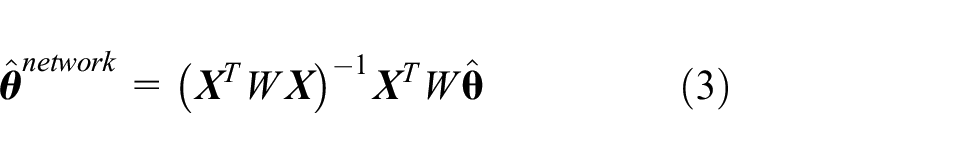
from which the effect estimates associated with other contrasts may also be obtained.
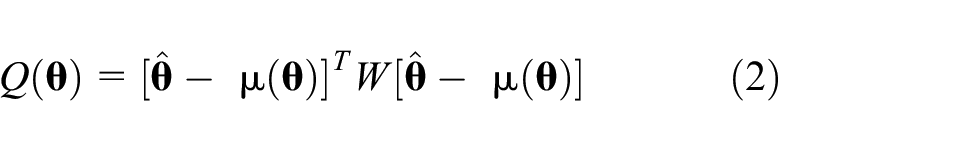
Equation (3) is a weighted linear combination of the direct effect estimates and is a generalization of the basic mixed comparison approach exemplified in equation (1). The weight matrix employed in equation (3) is chosen by using the variance–covariance structure implied by the stage-specific treatment effect standard errors and the stage-specific designs, and it is analogous to the inverse variance weights used in regular meta-analysis. This weighing process gives greater weight to effect estimates having smaller standard errors, but it is also necessary to accommodate correlations between treatment comparisons from the same stage. These correlations stem from the fact that a comparison of treatment A with control shares the same control participants as the comparison of treatment B with control, within the same stage. Thus, the two treatment effect estimates are correlated and collectively provide less information than if they had been obtained from different study stages. Full details of this variance–covariance weighting process are described by Schwarzer et al. 11 and references therein. The weight matrix may also be used to quantify the proportion of the overall evidence that is provided by direct treatment comparisons, which is referred to as the direct evidence proportion. This allows decomposition of the full network analysis into its randomized and non-randomized components, facilitating a comparison of the two sources of information. 12
An important assumption of network meta-analysis is that the underlying difference between two treatments is identical for all direct and indirect comparisons between the two treatments. The concept of inconsistency in network meta-analysis refers to the violation of this assumption and is a useful addition to platform trial analysis methodology. Inconsistency is an extension of the concept of heterogeneity in regular meta-analysis. Generalizations of Cochrane’s Q-statistic and
Implementation
Various software packages are available for network meta-analysis and may be used to implement the analysis methods for platform trials described here. One such package is the netmeta package in R, which we will use to illustrate our proposed analysis approach. 13
For binary endpoints, data from a platform trial would be organized as events and sample sizes by treatment arm for participants randomized in each stage of the study. In Table 1, we provide illustrative binary data in this format for the illustrative platform design presented in Figure 1. This binary data structure is pre-processed by the function pairwise and then inputted to either the netmetabin or netmeta function for analysis. For other types of endpoints, the stage-specific effect estimates and standard errors are inputted directly to the netmeta function. Data from the STAMPEDE trial will be analyzed in this way using log hazard ratios (HRs). Importantly, participants contribute only to the stage-specific effect estimate from the stage in which they were randomized, regardless of whether the endpoint involves follow-up during a subsequent stage.
Example data for the platform design shown in Figure 1.
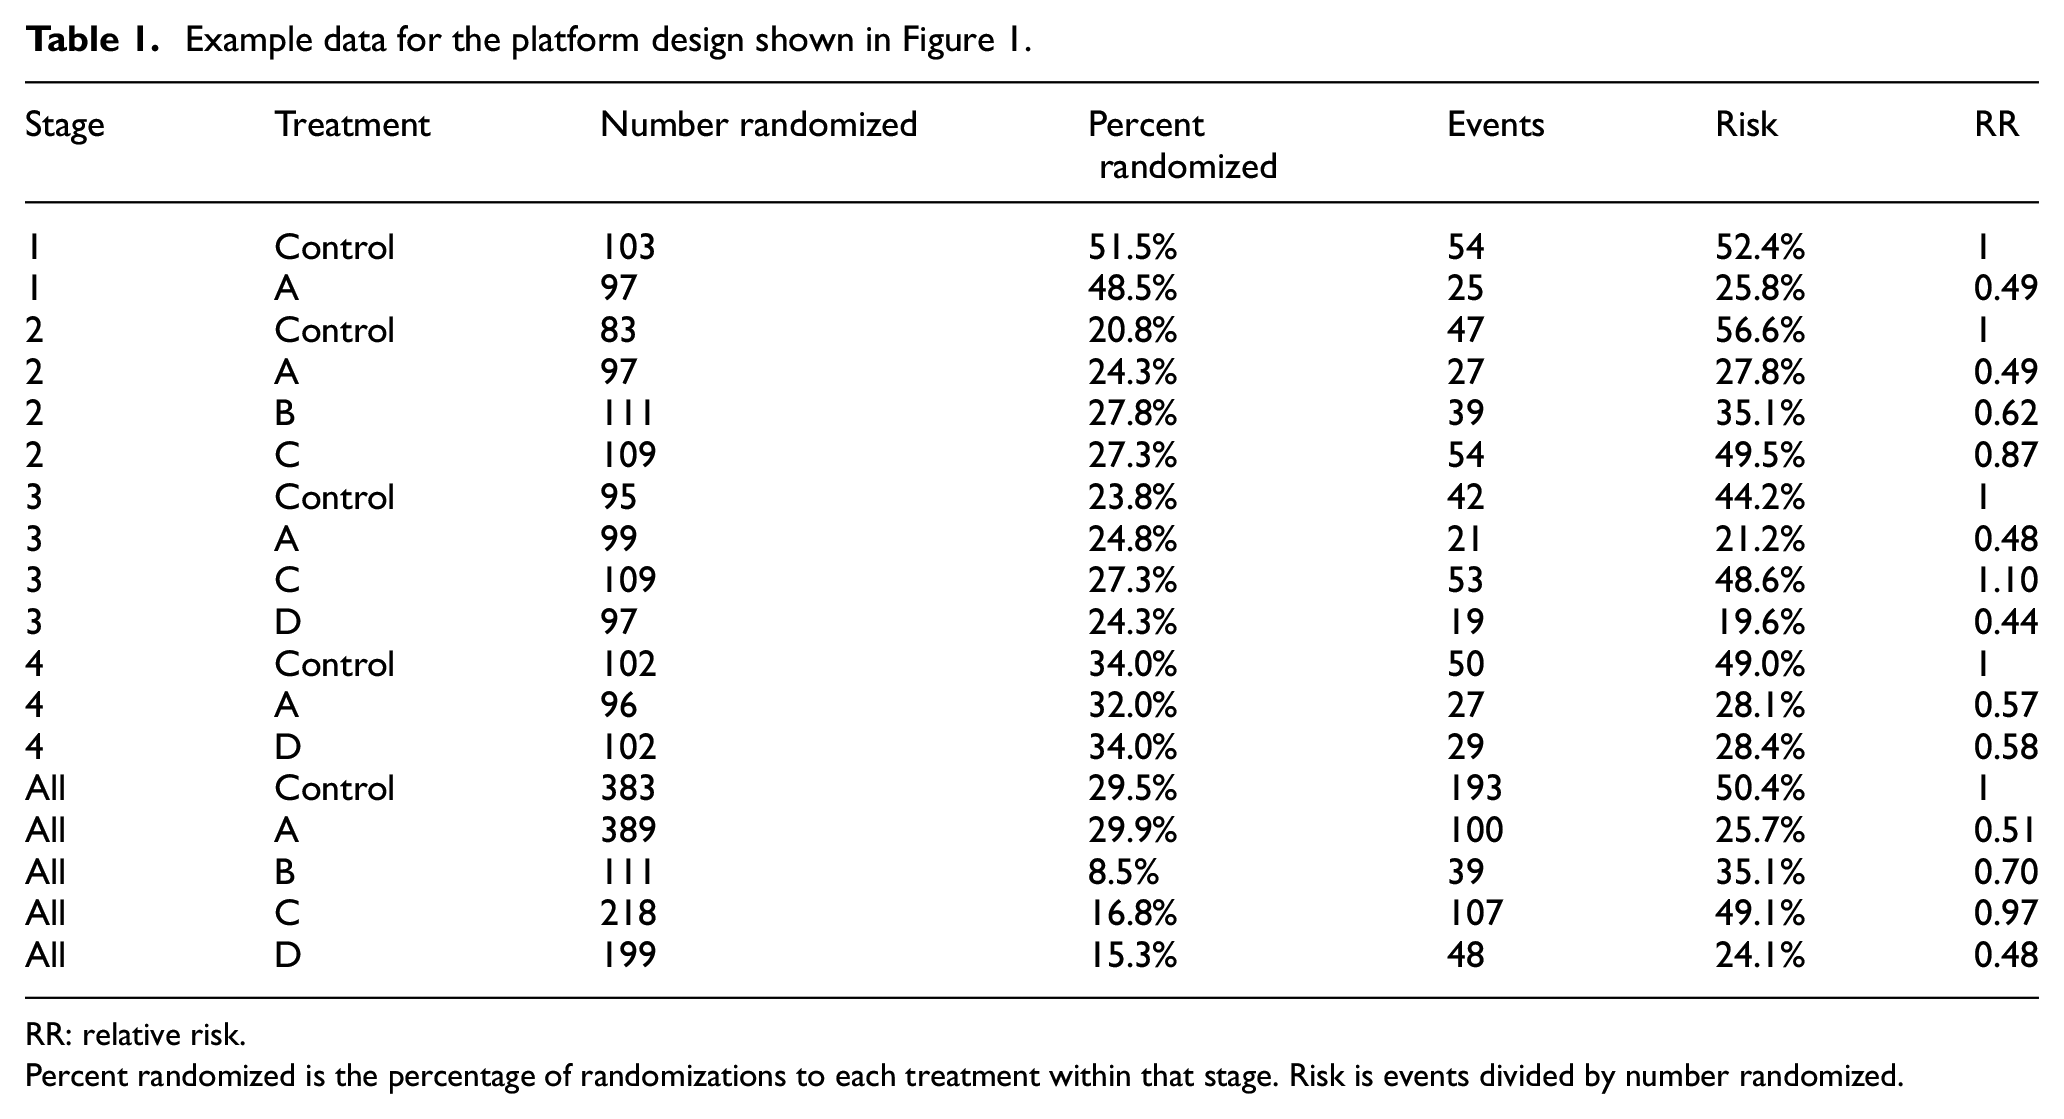
RR: relative risk.
Percent randomized is the percentage of randomizations to each treatment within that stage. Risk is events divided by number randomized.
Other analytical and graphical functions are also available in the netmeta package. For the purpose of investigating the difference between adjusted and stratified analyses, decomposition of the analysis into direct randomized evidence and indirect non-randomized evidence is particularly important. 12 This facility is provided by the function netsplit, applied to the output from a netmetabin or netmeta analysis, together with a test of inconsistency between the direct and indirect evidence using the separate indirect and direct evidence (SIDE) back-calculation method of König et al. 12 Graphical functions for constructing a network diagram of the design and presenting forest plots of the analysis results are also available and will be illustrated in the Results section. Further details of the netmeta package are presented by Schwarzer et al. 11
Results
Simulated analyses
We begin by providing the results of simulated analyses using the four-stage platform design depicted in Figure 1, under various scenarios. The purpose of the simulations is to investigate the bias of an unadjusted analysis in the presence of time trends in background risk, and whether adjustment and stratification can address this bias.
In the first scenario, platform trials were simulated with a binary endpoint that occurs with a risk (probability) of 0.5 in the control arm. The RR compared to control was 1.0 for arms B and C, and 0.5 for arms A and D. The randomizations to each arm occurred with probabilities shown in Figure 1. We refer to this scenario as the homogeneity scenario.
The homogeneity scenario was then altered to provide the time trend scenario, in which the risk in the control arm was assumed to have a decreasing trend over time, beginning with 0.5 in stage 1, followed by 0.4, 0.3, and 0.2 in stages 2 to 4, respectively. In this scenario, the RR for each treatment remained the same as in the homogeneity scenario. For each scenario, 1000 trials were simulated, first with an average of
While the homogeneity and time trend scenarios are the primary simulations discussed here, various other simulations were also conducted. These include a differential time trend scenario in which the RR decreases over time and an inconsistency scenario in which the RR for one treatment was inconsistent between stages. Full specification of these scenarios is provided in the Supplemental Material.
For each simulated platform trial, the data were analyzed using the netmeta package described in the Methods, producing a direct randomized RR estimate for each comparison, an indirect non-randomized estimate, and a combined network estimate. In addition, we computed unadjusted and adjusted RR estimates, the latter from a log-link binary regression model adjusting for a stage effect, which is typically called relative risk regression. 14
Table 1 provides the full data for the first simulation of the homogeneity scenario with
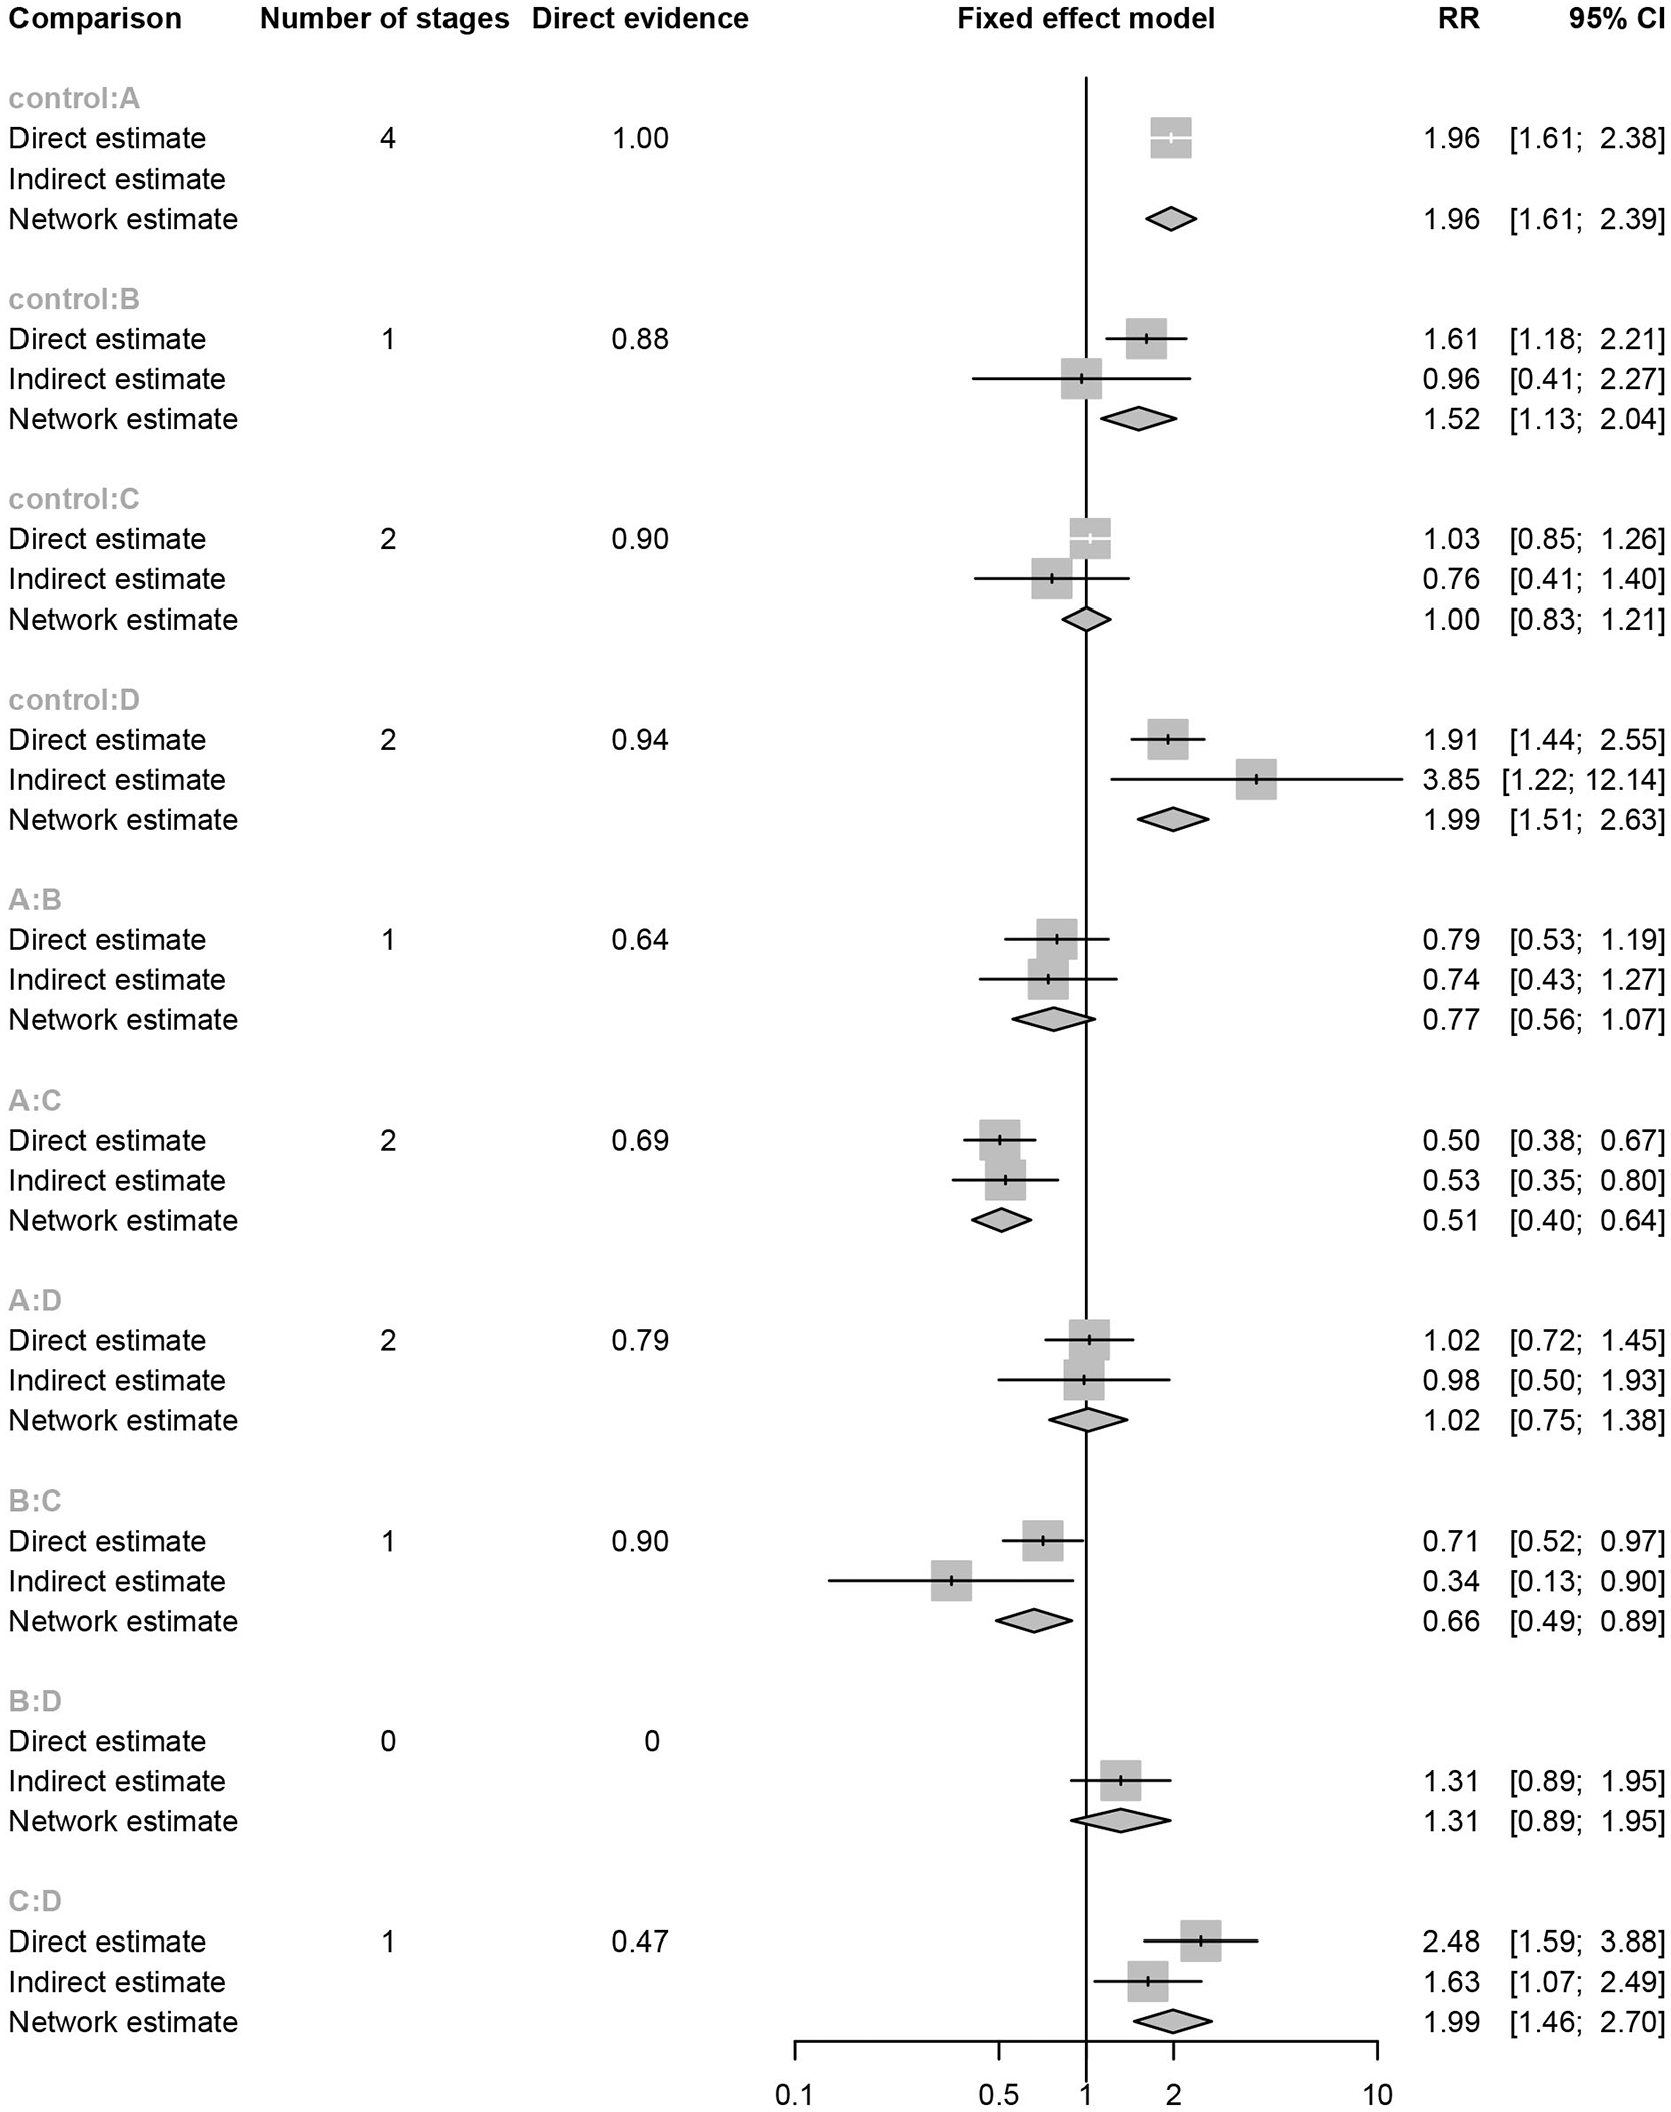
Network analysis of the platform trial depicted in Figure 1, with data provided in Table 1. For each possible treatment comparison, the direct randomized estimate, the indirect non-randomized estimate, and the mixed network estimate of the relative risk (RR) and 95% confidence interval (CI) are provided. Also provided for each treatment comparison is the number of stages with direct comparisons and the proportion of overall evidence coming from direct comparisons.
Figure 3 provides a selection of simulated treatment effect distributions from the various scenarios. First, all estimation methods are unbiased except for the unadjusted method which has substantial bias when there is a time trend in the control risk. Importantly, this bias is eliminated by the other methods, which is the intention of the stratified and adjusted approaches. It may also be seen that the comparison of control and treatment D is a situation where the indirect information adds very little, so that the network and adjusted methods are almost identical to the direct method. However, for comparison of treatments A and B, the indirect information is more substantial, leading to greater efficiency for the network and adjusted methods compared to the direct method. A complete tabulation of all simulation results is provided in the Supplemental Material where, as well as the above observations, we observe that the adjusted regression and the network approaches are essentially equivalent across all comparisons and scenarios.
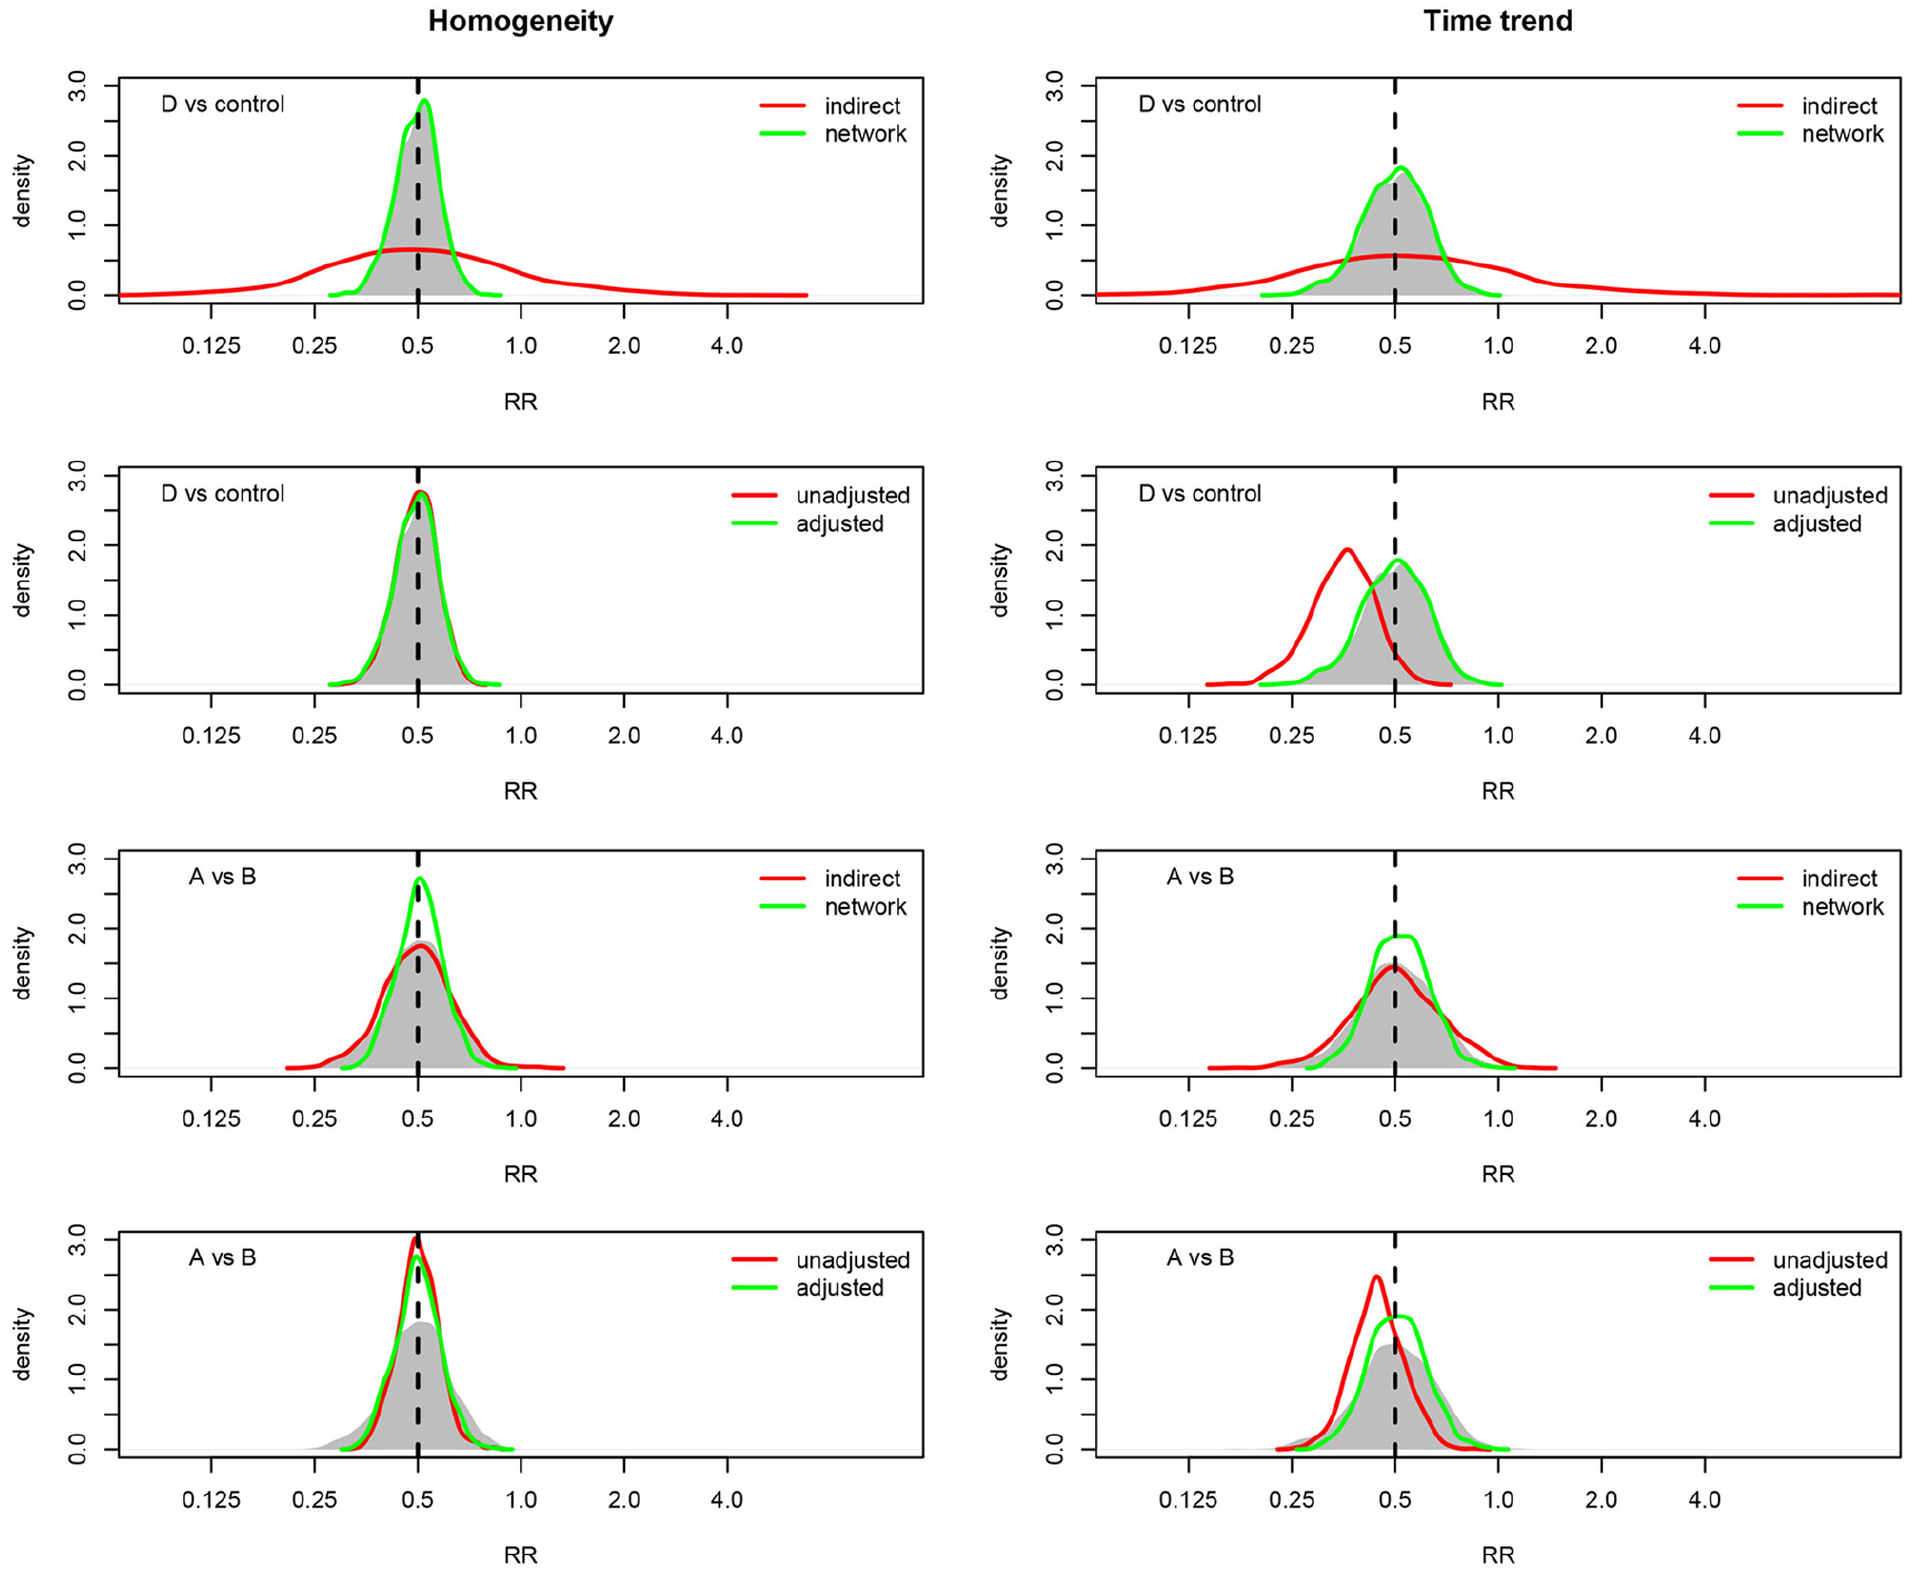
Results of 1000 simulations of the platform design depicted in Figure 1, for the treatment comparisons D versus control and A versus B. For each comparison, the true relative risk (RR) is 0.5 and each treatment has an average of 100 randomizations per stage. In all panels, the shaded area depicts the distribution of the direct (stratified) estimates, with other methods shown in the legend. The left column assumes constant control risk over time, whereas the right column assumes a decreasing trend in the control arm risk over time.
Overall, the primary conclusion of the simulation study is that time trends in the background risk level may lead to bias in unadjusted analyses, while stratification and adjustment may be used to address this bias.
STAMPEDE trial
The STAMPEDE trial is a multi-stage platform trial of various treatments for metastatic prostate cancer with a primary endpoint of overall survival.3,7,15,16 The trial was initiated in 2005 with a control arm of androgen-deprivation therapy (ADT) which continued until 2015, after which ADT was dropped as the control therapy. During the period in which ADT was the control, an additional eight experimental therapies were initiated and dropped at various times. These adaptation times define seven stages within which the design remained fixed. The precise periods between adaptations have been published in various sources, see for example the study’s protocol 17 (Table 6, page 10) in which the seven stages correspond with the first seven protocol changes after activation. The complete network of available randomized treatment comparisons for the era in which ADT was the control therapy is shown in Figure 4. This network diagram demonstrates the potential complexity of direct and indirect treatment comparisons available in a large platform trial, such as STAMPEDE.
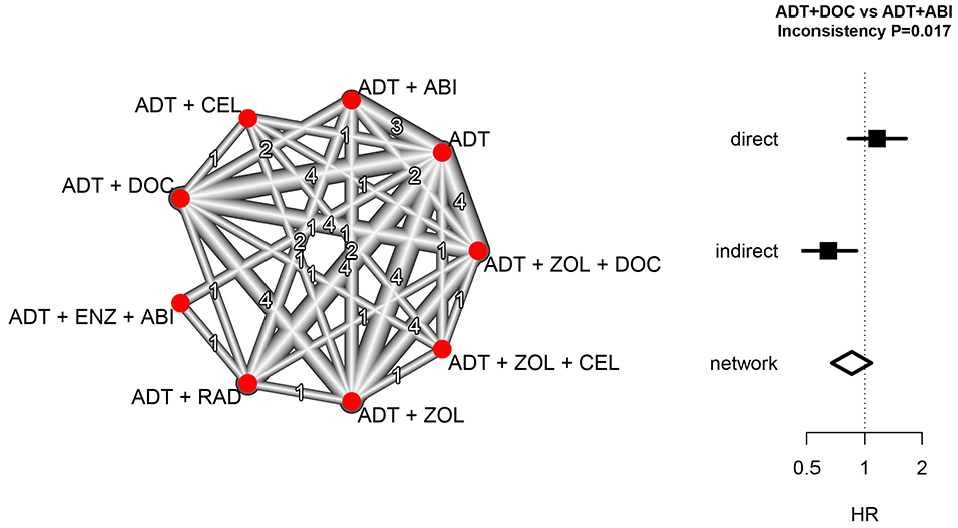
Network analysis of the STAMPEDE multi-stage platform trial of prostate cancer therapies during the years 2005–2015. The network diagram depicts the network and number of direct treatment comparisons between combinations of androgen-deprivation therapy (ADT), docetaxel (DOC), zoledronic acid (ZOL), celecoxib (CEL), abiraterone (ABI), radiotherapy (RAD), and enzalutamide (ENZ). For the comparison of ADT + DOC and ADT + ABI, the direct, indirect, and network estimates of the hazard ratio (HR) for overall survival are shown with 95% confidence intervals.
The pre-specified primary analysis for STAMPEDE uses a stratified approach in which treatment comparisons are restricted to patients who were concurrently randomized. The restriction to direct randomized comparisons in STAMPEDE contrasts with, for example, the approach taken in the REMAP-CAP platform trial where both randomized and non-randomized treatment comparisons are combined using an adjusted analysis.4,6 We now illustrate the potential impact of combining direct randomized evidence with indirect non-randomized evidence using our network approach for one particular comparison, ADT+DOC versus ADT+ABI.
The randomized comparison of ADT and ADT+DOC was based on randomizations during the years 2005–2013, which reached a conclusion that ADT+DOC is superior for overall survival (HR 0.78, CI 0.66–0.93). 7 The randomized comparison of ADT and ADT + ABI was based on randomizations during the years 2012 and 2013, which reached a conclusion that ADT + ABI is superior (HR 0.63, CI 0.52–0.76). 15 The randomized comparison of the two experimental treatments ADT + DOC and ADT + ABI was based on randomizations during the years 2012 and 2013, which favored ADT + DOC but did not provide evidence of a difference (HR 1.16, CI 0.82–1.65). 16 Nonetheless, the period 2005–2011 provides further information about ADT + DOC that could potentially be used for further exploration of the difference between the two experimental therapies, using ADT as a common reference treatment.
A combined network comparison of ADT + DOC and ADT + ABI may be conducted using randomized comparisons from two periods, 2005–2011 and 2012–2013. For the 2005–2011 stage, there is just one randomized comparison of interest, ADT versus ADT + DOC. For the 2012–2013 stage, there are three randomized comparisons of interest: ADT versus ADT + DOC; ADT versus ADT + ABI; and ADT + DOC versus ADT + ABI. The log HR and associated standard errors for each of these stage-specific randomized comparisons were used in a network analysis implemented in the netmeta package and reproduced in the Supplemental Material.
Figure 4 displays the results of the network analysis. Visually, there is a difference between the direct and indirect treatment comparisons, with an averaging of the two effects in the network analysis, and the test of inconsistency is statistically significant (p = 0.017). The analysis also produces an assessment of heterogeneity across the network, which in this case assesses differences between the ADT versus ADT + DOC comparison in the two stages (Q = 1.49, df = 1, p = 0.22).
Figure 4 illustrates the transparent decomposition of the complete network into a direct randomized component and an indirect non-randomized component. The STAMPEDE trial pre-specified the use of randomized comparisons in the primary analysis, and the inconsistency of the two information sources in Figure 4 provides strong support for that approach. The cause of the inconsistency cannot be determined from this analysis but may be due to time trends in the population risk combined with a treatment effect magnitude that is dependent on underlying risk. Regardless of the cause of the inconsistency, this analysis identifies the potential for it to be present and illustrates how it can be transparently reported.
Conclusion
This article has shown that an adaptive platform trial provides a network of stage-specific treatment comparisons that may be analyzed using the methodology of network meta-analysis. We have described the network approach at a conceptual level, emphasizing the combination of randomized and non-randomized information using weighted linear combinations of stage-specific direct treatment comparisons. Our approach was guided by the methods and software available in the netmeta package in R.11,13 However, alternative network methods and software exist and could be used in an analogous manner. 18 Rather than advocating specific methods and software, our goal has been to present the general principles of network meta-analysis as a relevant methodology for analyzing platform trials.
An important characteristic that distinguishes different platform trials is the choice of a Bayesian or frequentist approach. Both approaches are common, and the Bayesian REMAP-CAP and frequentist STAMPEDE trials exemplify the two. However, the distinction between Bayesian and frequentist approaches to analyzing platform trials is tangential to the issues discussed in this article. Direct versus indirect evidence, and adjustment versus stratification, have similar relevance to the analysis of platform studies regardless of whether a Bayesian or frequentist framework is used. Software for implementing Bayesian network analyses is also available.19,20 It is beyond our scope to investigate these methods here; however, it would be of interest for future research to undertake simulation studies of Bayesian network analyses analogous to the simulations presented here.
An issue of growing importance in adaptive trials is treatment effect bias arising from response-driven design adaptations.21,22 In the context of platform studies, the observed design structure is randomly generated by the outcome of decisions to drop treatments or adaptively change randomization probabilities. Conditional likelihood methods that condition on this observed design have been proposed to adjust for potential estimation biases, and these methods have been studied in the context of traditional group sequential designs, 23 as well as designs with other adaptive features 24 and meta-analyses of group sequential studies.25,26 It may be possible to extend our network approach for platform studies by using conditional stage-specific treatment effect estimates.
Our work has implications for the design of platform trials. We have assumed that design adaptations occur at discrete times that define the stages of a multi-stage platform design. This means that within a stage the design remains fixed. Frequent adaptation limits the information provided by each fixed design and forgoes the opportunity to assess the consistency between randomized and non-randomized evidence. Instead, we recommend an adaptation frequency guided by the typical timing of interim analyses in a group sequential trial. Furthermore, in assessing the consistency between direct and indirect evidence, formal tests of inconsistency are available and should be conducted. However, like tests of interaction, such tests may have low power in some circumstances. Since designing a platform trial typically involves extensive simulations to inform design assumptions, it would be possible to assess the power of inconsistency tests as part of these design simulations.
We also recommend that the reporting of platform trials should take advantage of the underlying fixed designs by providing the stage-specific treatment effects, as illustrated in Table 1. These could be valuable for subsequent systematic reviews and re-analyses. For example, the STAMPEDE trial has contributed to subsequent reviews and re-analyses that may have benefited from stage-specific information.27,28 Nonetheless, in the absence of stage-specific treatment effects, it may still be possible to use innovative ways to extract the information, such as reconstruction of individual patient data from published Kaplan–Meier plots. 29 The Supplemental Material provides an illustration of this approach.
Although the purpose of this article has not been to advocate for one or other of the stratified or adjusted approaches, it is natural to consider which approach is more appropriate. The direct randomized treatment comparisons from a platform trial provide a higher quality of evidence than the indirect non-randomized treatment comparisons, which provides an argument for using the stratified approach in the primary analysis. As discussed in the Background section, the STAMPEDE and REMAP-CAP trials are exemplars of the stratified and adjusted approaches, respectively. Given the inconsistency between randomized and non-randomized comparisons in the STAMPEDE case study, we would recommend the STAMPEDE approach of restricting to concurrent randomizations as the most appropriate primary analysis method, with the REMAP-CAP approach of including non-concurrent randomizations reserved for secondary analyses. Indeed, it could be argued that non-concurrent controls are unnecessary if the trial is adequately powered, and we would recommend every effort be made to power adaptive platform trials based on concurrently randomized treatment comparisons. Nonetheless, we acknowledge the existence of differing viewpoints on the use of non-concurrent controls and advocate further research on their advantages and disadvantages.
In summary, regardless of whether a platform trial plans to use only direct randomized evidence in the primary analysis or plans to use all available information including indirect non-randomized evidence, this article has shown that transparent display of direct and indirect comparisons using a network analysis provides a valuable supplement to the planned primary analysis.
Supplemental Material
sj-pdf-1-ctj-10.1177_17407745221112001 – Supplemental material for Analysis of adaptive platform trials using a network approach
Supplemental material, sj-pdf-1-ctj-10.1177_17407745221112001 for Analysis of adaptive platform trials using a network approach by Ian C Marschner and I Manjula Schou in Clinical Trials
Footnotes
Acknowledgements
The authors acknowledge the support of the Australian Trials Methodology Research Network (AusTriM).
Declaration of conflicting interests
The author(s) declared no potential conflicts of interest with respect to the research, authorship, and/or publication of this article.
Funding
The author(s) disclosed receipt of the following financial support for the research, authorship, and/or publication of this article: This research was funded by research grants 1150467 and 1171422 from the National Health and Medical Research Council of Australia.
Supplemental material
Supplemental material for this article is available online.
References
Supplementary Material
Please find the following supplemental material available below.
For Open Access articles published under a Creative Commons License, all supplemental material carries the same license as the article it is associated with.
For non-Open Access articles published, all supplemental material carries a non-exclusive license, and permission requests for re-use of supplemental material or any part of supplemental material shall be sent directly to the copyright owner as specified in the copyright notice associated with the article.