
Abstract
The target-oriented spraying is an effective way to minimize chemical input in agricultural production and it is important to actualizing sustainable agriculture. This article focused on the design and optimization of the target spray platform. The spray platform consists of three parts: the vision system, the spray system, and the moving platform. All components were effectively connected and preliminarily evaluated especially regarding the response time and target spray accuracy. A simulation system was built considering the real crop geometric shape and nozzle spray pattern using the Monte Carlo method. The spray simulator was used to optimize the spray height objective function of spray deposition rate and coefficient of variance for the spray deposition. The spray process can be easily visualized and compared for different spray parameters. The indoor experiment setup was built to test and optimize the parameters of the overall system, which is flexible to verify the system. Afterward, the outdoor tractor-based equipment was designed to test the system for the field environment. The experimental result showed that 80% of the crop had a spray deviation from 0 mm to 28 mm and the proposed spraying system can reduce 46.8% usage of the chemical compared to the uniform spray method.
Introduction
Agriculture is currently faced with a great challenge of providing food to an ever-growing population expected to reach 9 billion by 2050, hence, we need to double the agricultural production to meet food demands. 1 To address this challenge, a lot of research from different fields, including genetic modification of crops to improve the biological production and management; improvement of inputs including herbicide, fertilizer, and water; and development of more effective technologies on postharvest, processing, and storage have been studied. 2 Spray technology plays an important role in agriculture production. Nearly, 45% of agriculture products can be saved by using pesticides, and the use of fertilizer can increase agriculture production by 40%. 3 Generally, these chemicals are sprayed into the field with equipment uniformly. However, overusing them can bring about pestilent consequences. This attracted the attention of many researchers as early as the 1950s, due to the serious environmental and food safety problems it poses. 4 According to statistical data from the Chinese government, in 2015, the efficiency of fertilizer and pesticides was 37.8% and 38.8%, respectively, which indicates that most of the chemicals remained in the soil media and did not contribute to the functionality of the product. Also, in 2015, China used 178.3 million tons of pesticide, which is about one-third of worldwide usage. During these years, million tons of pesticides were poured into the field causing terrible damage to the environment. In the United States, it was reported that urban streams had the level of pesticide increasing from 53% during 1992–2011 to 90% during 2002–2011, largely because of fipronil and dichlorvos. 5 Even with advanced technology development, the reduction of chemical usage remains a problem due to factors like government policies, the pressure of the population increase, and the cost of technical solutions.
A lot of research on the reduction of chemical usage has been carried out since the 1950s, but with the development of computer vision technologies, one important area of research focus is the target spray technology, which sprays chemical liquid only on the target plants. This technique can save a lot of chemical usage, especially for weed control as compared to spraying uniformly in the field. Many platforms have been built with target-orientated action based on the different platforms. 2,6 –8 Some of these research have been successfully transferred to farming production, making it more efficient.
However, currently, many studies based on these platforms focus on the sensing system and decision-making part.
2,7,9
The quality and accuracy of target orientated action system, especially regarding target-orientated spray, has not been fully analyzed. Some of the platforms are also designed in a specified way with multisensors, which are not friendly enough for the farmers to operate. The advantage of avoiding the usage of multikinds of sensors is that it reduces the cost of overall equipment, making it more affordable and accessible, and thus, reducing the chemical usage. To tackle aforementioned challenges, this article focuses on building and optimizing the target spray platform with cheap and off-the-shelf components. A simulation framework was also developed to assist in the optimization of the spray process. The main contributions of the article are listed as follows: Two platforms were built, one indoor experimental platform, which is flexible for component integration and algorithm test, and a field platform was also built to preliminarily evaluate the overall system in the field environment. The response time of the system was analyzed and reduced especially for the solenoid valve without additional sensors. A simulation framework was built to simulate the droplet distribution on the crop. The spray height was analyzed for the case study of the simulation framework. The preliminary experiments with spray accuracy were tested in different field scenarios, which showed that the proposed system had a spray deviation from 0 mm to 28 mm on 80% of crop.
The content of this article is organized as follows: “Related work” section reviewed the state-of-the-art in agriculture robotic platform development for target-oriented action. “Method” section covers the stakeholder engagement and insights, and outlines the functional requirements and specifications for the platform design. “Experiments and results” section contains results from the experiment and field trials, and finally, a discussion and conclusion of the results were presented.
Related work
Advanced robotic and automation technologies have been widely researched and applied from industrial to agricultural application. 8,10,11 Target-oriented action comparison has been highly researched in recent years for agriculture production because it is an environmental friendly alternative compared to indiscriminate action. 12,13 This target-oriented action could be in the form of spray herbicide to the weed or spray fertilizer to the targeted crop. The basic required components to perform target-oriented action involve three basic components 14 : (1) a sensing system to measure important physical and biological properties of the agricultural system; (2) decision-making capabilities for processing information from the sensor system to determine how the agricultural system should be manipulated; and (3) actuators to manipulate the agricultural system accordingly. Different robotic platforms include tractors, lightweight wheel robots, and unmanned aerial vehicles (UAVs). Since 2002, Tian 6 developed a weeds control equipment based on a tractor with target spray using computer vision. However, at that time, the accuracy of crop and weed detection was limited by the machine learning algorithm, which hindered the technology translation to farming. This, however, challenged the research community to develop sensors to recognize the weed and crop. The hyperspectral imaging and sensing system was introduced to segment weed in a soybean field by Suzuki et al. 15 Hague and Tillett 16 used the analysis of the periodic near-infrared intensity function in a lateral path across five wheat rows in a plan view of the field rather than the traditional row segmentation method to obtain row guidance information.
These technologies have made considerable progress and have also bred several companies with intrarow cultivation system. Tillett et al. 17 developed a mechanical device that removes the weed within-row based on computer vision without using any herbicides. This has been commercialized and cost for US$17,000 per row with the speed limited to 3 km/h. 18 Steketee IC automatic hoeing machine used a hoe blade that can retract to avoid crops. Results from field trials show that the guided systems can work up to a speed of 4 km/h with little damage to crop roots at a crop spacing of 300 mm. However, with the development of deep learning technology, which is a breakthrough for object detection task in a complicated environment, it is possible to use only RGB images to robustly recognize the crop and weed. The Blue River Technology integrated the deep learning-based image processing technology into the tractor platform for weed control with spraying herbicide, which is a very promising machine for the rapid weed control in the large field. 19 Most of the above mentioned commercialized technologies are based on the tractor-based platform.
The tractor-based platform is easier for farmers to accept because these advanced technologies are built-in tractors that are already used in current agriculture production. However, the heavy tractor causes soil compaction, which can make plowing the land difficult, resulting in decreased crop production. The lightweight wheel robot has been proposed to address this problem. 20 –23 Madsen and Jakobsen 24 developed an experimental four-wheel-drive, four-wheel-steer platform for testing software, navigation, and different steering approaches. This battery-powered vehicle could operate for 2 km/h, and it was designed for driving in-crops with 500 mm ground clearance and a narrow wheel-transmission setup. BoniRob developed by Ruckelshausen et al. 25 has individual wheel drives, adjustable ground clearance (40–80 cm), and track widths (75–200 cm). Robert Bosch GmbH developed a novel mechanical weed control method mounting on the BoniRob in which a mobile manipulator is used to punch the weeds to death with high-speed image processing. Bawden et al. 2 developed a modular robotic with a 500 kg platform and a heterogeneous weeding array for agriculture destruction. Field trials of the weed detection and classification system show an accuracy of 92.3% across a range of weed species, while the heterogeneous weed management system can selectively apply a mechanical or chemical control method based on the species of weed. An agricultural robot developed by ecoRobotix 26 is a vehicle for inter- and intrarow weeding that utilizes a slender chassis and delta arm with a liquid-spray or rotating-blade end effector. Even though it is designed to work 12 h/day and powered by solar energy, this kind of lightweight robot may not be efficient enough to react to some emergency or fast crop treatment, due to the fact that most of the lightweight robots cannot take enough chemicals and have limited field operation speed.
UAV-based platform can solve the disadvantage of the lightweight robot. With the improved control technology of the multirotor, UAVs in crop protection have been successfully commercialized, for example, in China, by the company DJI Technology Co., Ltd. In 2015, DJI introduced its first agricultural drone AGRASMG-1, and they have sold more than 7500 drones for agricultural spray. 7 The spray task is performed by the well-trained operator and spray speed can be between 2.6 and4 ha/h, which is around 40 times the manual spray speed. However, the commercialized drone works in a uniform spray method.
Irrespective of the platform used for crop protection, most research currently focuses on the sensing system and decision-making part. Unlike these studies, this article considers the optimization of the spray system, which has rarely been studied. The study also addresses the response time and target spray accuracy of the overall system. A spray simulator was built to visualize the spray droplet distribution. The parameter of spray height was taken as an example to optimize the objective function of spray deposition rate and coefficient of variance for the spray deposition. The preliminary experimental result showed that 80% of the crop had a spray deviation from 0 mm to 28 mm in the field and the system developed in this study reduced the chemical usage by 46.8% as compared to the uniform spray method.
Method
This study developed the indoor experiment setup based on conveyor and the overall system was tested especially for the optimization of response time to improve the target spray accuracy. Afterward, a tractor-based platform was built up and all of the components were integrated. Furthermore, a spray simulation framework was built to better optimize the spray height regarding the spray droplet distribution and also make the spray result visible and measurable, which is hard to obtain in the real-life application environment.
Indoor experiment setup
The indoor experiment setup was mainly used for the system integration test and parameter optimization, which can reduce a lot of stress compared to the test on the tractor-based system directly. The experimental setup is shown in Figure 1. The setup consists of a vision system and a spray control system. The plastic plants were pasted on the conveyor. The camera(2) (Point Grey Flea3 GigE, FLIR Systems, Inc., Oregon, USA) captures the images of plants on the conveyor(1) (Ruian Leadtop Co., Ltd, Zhejiang, China), and a plant detection algorithm was implemented on the computer(3) (Inspiron, Dell Inc., Texas, USA) to segment and obtain position information of the plant. The position information was sent to STM32F407 controller(5) (STMicroelectronics, Switzerland) via USB-serial converter(6) (XDU-U9011-1.8, Shenzheng, China). The pump(11) (PCP Compressor, Zhongyan Co., Ltd, Zhejiang, China) and pressure relief valve(10) (SV 29, Mankenberg GmbH, Germany) were adopted to generate a proper spray pressure based on the requirement of nozzle(9) (Spraying Systems Co., Illinois, USA) (typically 0.1–0.4 MPa). An air pump was used to press the water out of a water tank since the noise of generating the pressure water in this way is much less compared to the water pump. The spray control system fused information of the conveyor speed, the image processing overhead, and the distance between camera and nozzle to obtain the delay time for spray action. Afterward, the solenoid valve would be kept open for the spray action to allow the droplet cover of the whole plant.

(a) The overall design of the indoor target spray platform. (b) The actual setup in laboratory showing (1) conveyor, (2) camera, (3) computer, (4) touch controller, (5) STM32 controller, (6) USB-serial converter, (7) field effect transistor, (8) solenoid valve, (9) nozzle, (10) pressure relief valve, (11) pump, and (12) monitor.
Plant segmentation
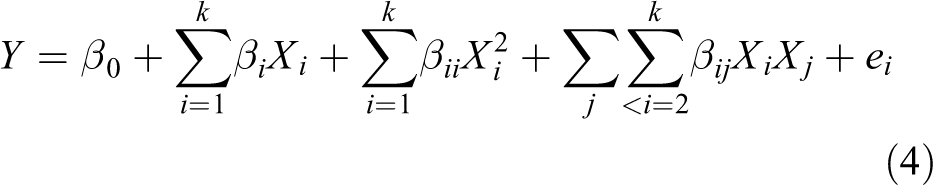
The designed target spray platform was primarily designed for the leaf fertilizer in cabbage. The leaf fertilizer was sprayed on the leaf to provide extra nutrition for growth. In this article, the main target was to build and optimize the system, so, here, the weed segmentation from the crop was not considered. Based on the color transformation, the enhanced green model can be described as

where the

where B = 0 means the background, B = 255 means the foreground, and Th is the threshold. Afterward, the spray area was obtained by calculating the bounding box of the binary image. However, one plant may generate several bounding boxes as the distance between one plant may vary from other plants. The following formula was introduced to substantiate whether two connected domains belong to one identical plant

where D is the distance between centers of two bounding boxes in pixel, (
Solenoid valve response time analysis
After the bounding box of the plant has been obtained, the next important factor considered is the response time of the solenoid valve. The response time for the solenoid valve can be considerably large due to the mechanical motion during the on and off process. Electromagnetic attraction force was generated by the coil to open the valve body against the spring force when the field-effect transistor was on, and the valve body was kept open till the electromagnetic attraction force was weaker than the spring force. Due to the inductive effect, the current could not be changed simultaneously with the state of the field-effect transistor. Figure 2(a) shows the latency between the valve press data and the control signal state. The valve press data were collected via the pressure sensor with Kalman filter. 29
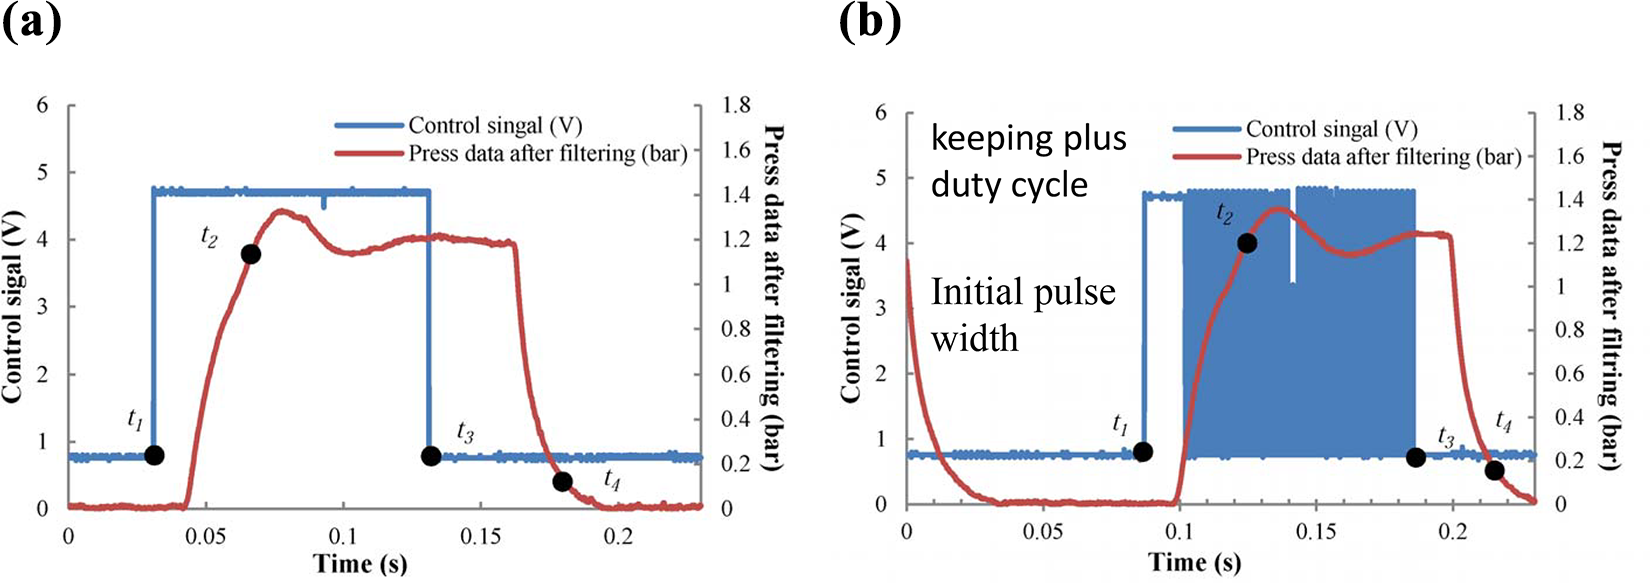
(a) The pressure data with normal on and off signal. Several key points were marked to make the response time of solenoid valve more available, where t1 is the time-point when control signal starts, t2 is the time-point when the pressure near the nozzle reaches Pa and solenoid valve is going to completely open, t3 is the time-point when control signal ends, and t4 is the time-point when the pressure near the nozzle reaches Pb and solenoid valve is going to be completely closed. (b) The pressure data with modified PWM signal. PWM: pulse width modulation.
As shown in Figure 2(a), several parameters could be controlled to generate different types of modified pulse width modulation, leading to a different response time. These parameters include driven voltage for the valve (X1), initial pulse width (X2), keeping plus frequency, and keeping plus duty cycle (X3). Considering that the inappropriate value of keeping plus frequency may disturb the control system, the keeping pulse frequency was considered as a constant value, which equals 10 kHz. Y1 is the response time for opening the solenoid valve, which equals
where

The model determination coefficient for the regressed model was 0.986, which means the model was very well presented in the test range of parameters. Based on this model, the minimum total response time of 69.9 ms was obtained under the parameters of the voltage for driving solenoid of 12 V, the delay time of 15 ms, and the duty cycle of 5%, see Figure 2(b). Compared to the normal on–off signal control method (see Figure 2(a)),
Target spray response time analysis
To achieve accurate target-oriented spray, the information processing and response time of all electronic and mechanical components should be considered. To achieve all the functions described earlier in the work, the accurate target spray software was developed, as shown in Figure 3, based on VC 2010 and OpenCV 2.3.1. It contained a camera control, serial port control, solenoid valve control, number of channel selection, and the time-delay parameter adjustment. Figure 4 shows the specific computing method of time-delay Td and time-action Ta parameters calculated as follows


where tp denotes the time (ms) for processing one frame image, d is the distance (mm) between red line in camera and nozzle on the ground projection, l denotes the number of pixels from the front edge to the red reference line, rp denotes a single pixel which represents the actual length (pixel per mm), v denotes the speed of camera refer to the movement of conveyor, h represents the distance (mm) between the nozzle and the ground, vd denotes the speed of the spray droplet from the nozzle, te denotes time latency for the command transmission from computer to STM32 controller and STM32 controller execution time for this command, and L denotes the number of pixels for the length of the bounding box for the detected plant.

The target spray software GUI. GUI: graphical user interface.
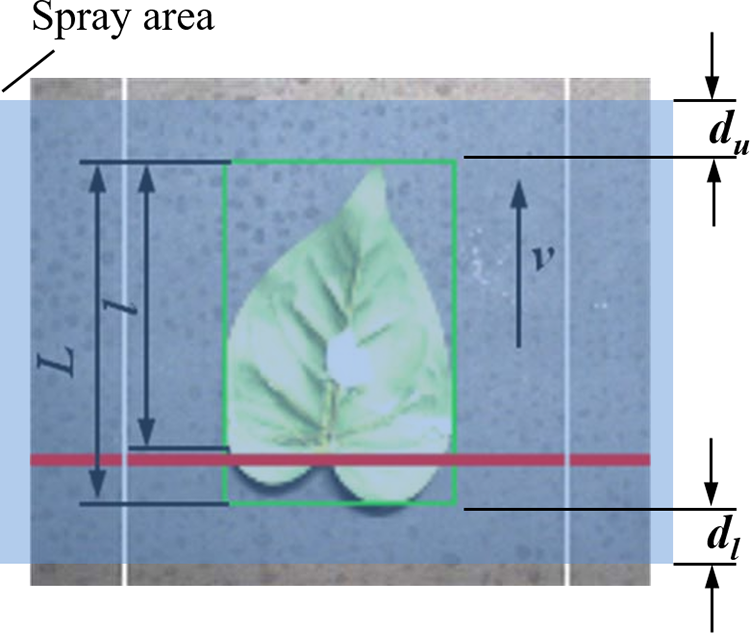
The relationship between detected bounding box, red line, and spray area.
As shown in Figure 4, the color of detected bounding for the plant was blue when the plant was in the front of the red line. When the bounding box had the intersection with the red line, the bounding box changed into green and a command line was generated and sent to the slave controller. The half-transparent color in blue presents the spray area, which was set to ensure the bounding box covered. du denotes deviation of the upper spray edge to the upper bounding box edge. dl denotes deviation of the lower bounding box to lower spray edge.
To achieve a high speed of command transmission and execution, STM32F407 was selected as the slave controller. The basic frequency of this controller was up to 168 MHz with 17 timers, which were very suitable for developing the real-time control system. One timer was used to receive and decode the command from the USART port and the other timers were triggered to check and execute the command list in every millisecond. The communication speed between the computer and slave controller was set as 115.2 kbps.
Field target spray equipment design
Based on the platform built indoor, a field target spray equipment was developed using the tractor as the moving base. The system was designed in the virtual model to predefine and verify the system setup and element arrangement, as shown in Figure 5. The liquid tank was suspended on the back of the tractor making it close to the power output shaft. The spray boom and camera were arranged at the front of the tractor. The enclosed cab can reduce the droplet drift. All the extra electronic elements on the tractor are powered by the storage battery with the power inverter. The details and connection graph of all components are shown in Figure 6.
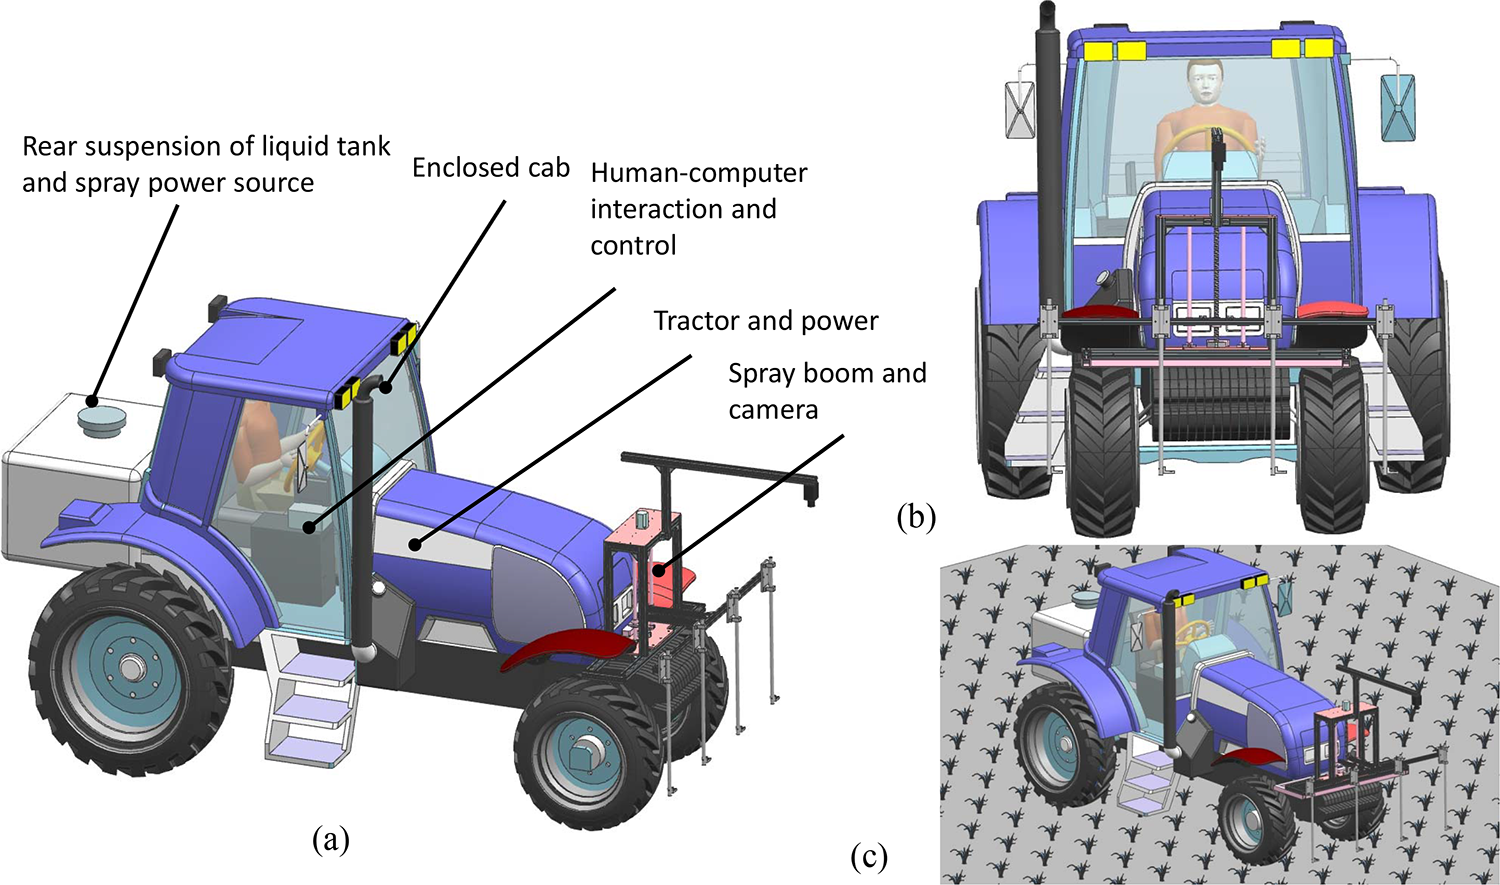
(a) The virtual design of the field target spray equipment. The spray equipment consists of four parts: (1) Rear suspension of liquid tank and spray power source, (2) tractor and power, (3) human–computer interaction and control, and (4) spray boom and camera. (b) The front view of the design. (c) The working scheme in the field.

The details and connection graph of all components.
With this preparation and design, the equipment shown in Figure 7 was built. Two control panels in the driving cab were assisting the driver to manage and inspect the work state for each component. The communication and data transmission between the human–machine interface and STM32 controller were completed by RS232 port and MODBUS communication protocol. As the port of the human–machine interface was on R232 level, it was changed to the TTL level by max232 chip and then connected it to STM32 pin.

(a) The view from the driver inside the enclosed cab and (b) the back view of assembled equipment.
Simulation system
During the physical process of spraying, the liquid comes out from the nozzle with pressure from the pump, which tears the liquid and results in many droplets with a certain pattern of distribution on the ground. The distribution pattern depends on the type of nozzle used, for example, flat fan spray pattern, even spray pattern, and hollow cone spray pattern. The selection of a specific pattern depends on the detailed spray requirement. For example, a flat fan spray pattern can provide a better even distribution of droplet with an overlap of the adjacent band, while hollow cone nozzles produce a finely atomized spray and are commonly used for spraying postemergence contact herbicides, fungicides, and insecticides. The droplet flies in the air with several forces and finally hits on the plant leaves. The actual distribution of droplets on the leaf was very hard to measure and define because of the complexity of the geometrical features of the plant and also the difficulties of quantitatively measuring the droplets. Spray deposition and location of droplet deposition are two key indexes needed to evaluate the performance of spray. Water-sensitive paper is a sampling measurement method usually used to verify the effectiveness of a spray model. The workload of sampling is tedious and the measuring precision is limited, especially when measuring the droplet distribution on the plant, which has a complicated geometric shape. The simulation could help to improve the optimization of spray technical parameters and chemicals could be saved by improving the efficiency. The simulation could also help the design of sprayer for object plants based on their special dimension and shape. Meanwhile, the design period and the cost would be shortened. Thus, simulation is very important and essential for spray optimization. While using the target spray, the nozzle with a large diameter of the droplet and lower boom height was selected to reduce the drift effect. Inspired by the research from Dorr et al., 31 the study proposed a simulation framework for the distribution of droplets on the plant during the spray process.
Distribution of the droplets
The distribution of droplets was mainly dependent on the nozzle type, spray pressure, and the spray height, with the assumption that the spray direction is vertical to the ground plane. The nozzle type dictates the pattern of droplet distribution, spray pressure influences the spray angle, and spray height scales the spray pattern in a different size. The Veejet H-VV9515 nozzle, which was used in the developed spray system, has high spray speed and low spray flow. When the spray pressure was set at 1.5 bar, the spray angle was 90°, the flow rate was 4.1 L/min, and the size of particles was between 200 m and 400 m.
Under these conditions, the image of droplet distribution on a water-sensitive paper is shown in Figure 8(a). There was a peak in the middle of a droplet, as shown in Figure 8(b). A morphological method combined with the attachment characteristics of droplets was used to complete the segmentation. Assume

where


where

(a) The image of droplets distribution on a water-sensitive paper, (b) the attachment characteristics of droplets, (c) the intensity image after image processing where the bright spot can represent the droplet hit position, (d) the schematic drawing of measuring droplet parameters, and (e) the space vector diagram of droplet speed direction with Monte Carlo method.
Droplet trajectory tracking
To calculate the trajectory of the droplet in the air, the Lagrangian method was used to track transiently a large amount of particles. 33 To simplify the problem, here, the complicated fluid interaction, for example, the conventional gas–particle coupling and the merging of the droplets during the fly in the air were not considered, but the focus was placed on the droplet distribution on the ground and also modeling the interaction between droplet and plant. Droplets with different diameters were analyzed separately. The size and speed of droplets could be analyzed accurately by phase Doppler particle dynamic analyzer and also presented in the nozzle booklet for reference. The dynamic equation of droplet can be modeled as

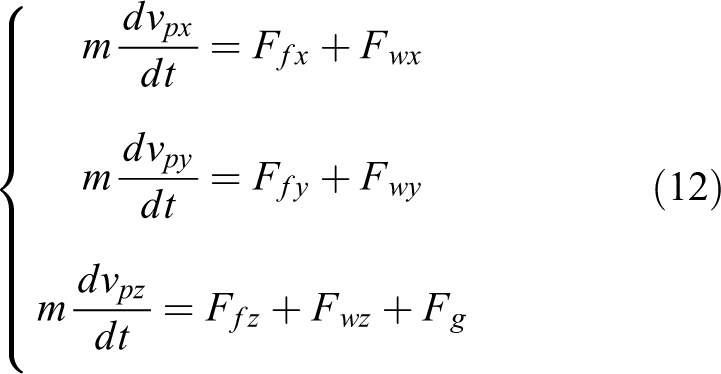
where
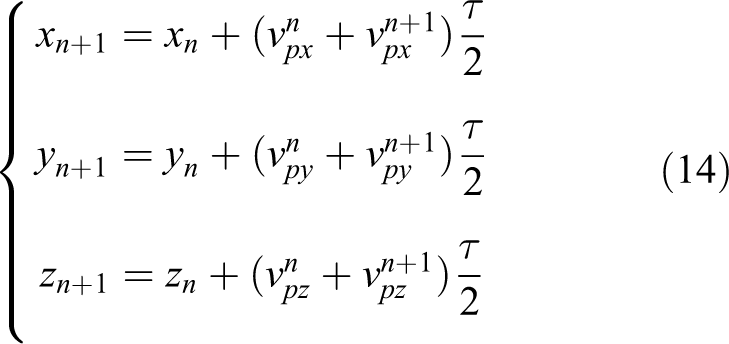
Droplet motion at each step was simplified by the time increment method. The motion state at the end of a step was determined by the motion state at the initial step. The motion trajectory of droplets in the whole process consists of the motion at each step. A simple local approximation method was used to solve the motion trajectory. The group of nonlinear ordinary differential equations of droplet motion was simplified by time increment method as follows
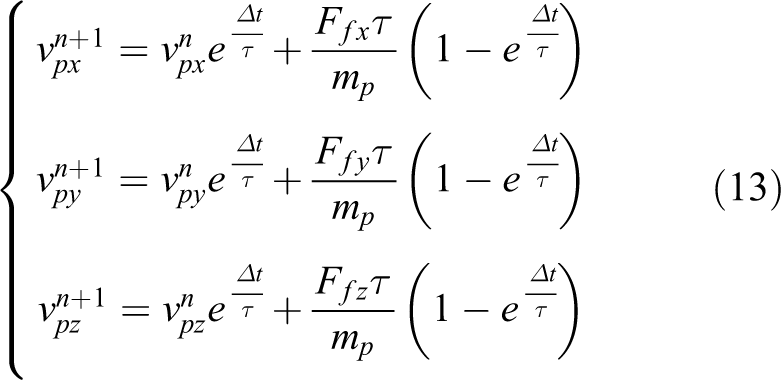
where
The simulation time of a droplet is defined as the lifecycle of the droplet. The lifecycle of a droplet would be over when any of the three situations occur: (1) the droplet was in touch with the ground, (2) the droplet was in touch with the object, and (3) the speed of the droplet was zero.
Crop modeling
The crop has a complicated geometrical morphology, which is hard to describe with a general mathematical model. To model the geometric shape of 3D crop entity clearly, a 3D commercial scanner (ZSCAN-D, Scantech Co., Ltd, China) with a resolution of 0.2 mm was used to get the whole point cloud of the crop. As shown in Figure 9, a point cloud of Chinese cabbage was obtained originally from the scanning system with 45,235 points in the resolution of 0.2 mm and the one obtained after sampling was with 4574 points in the resolution of 2 mm.
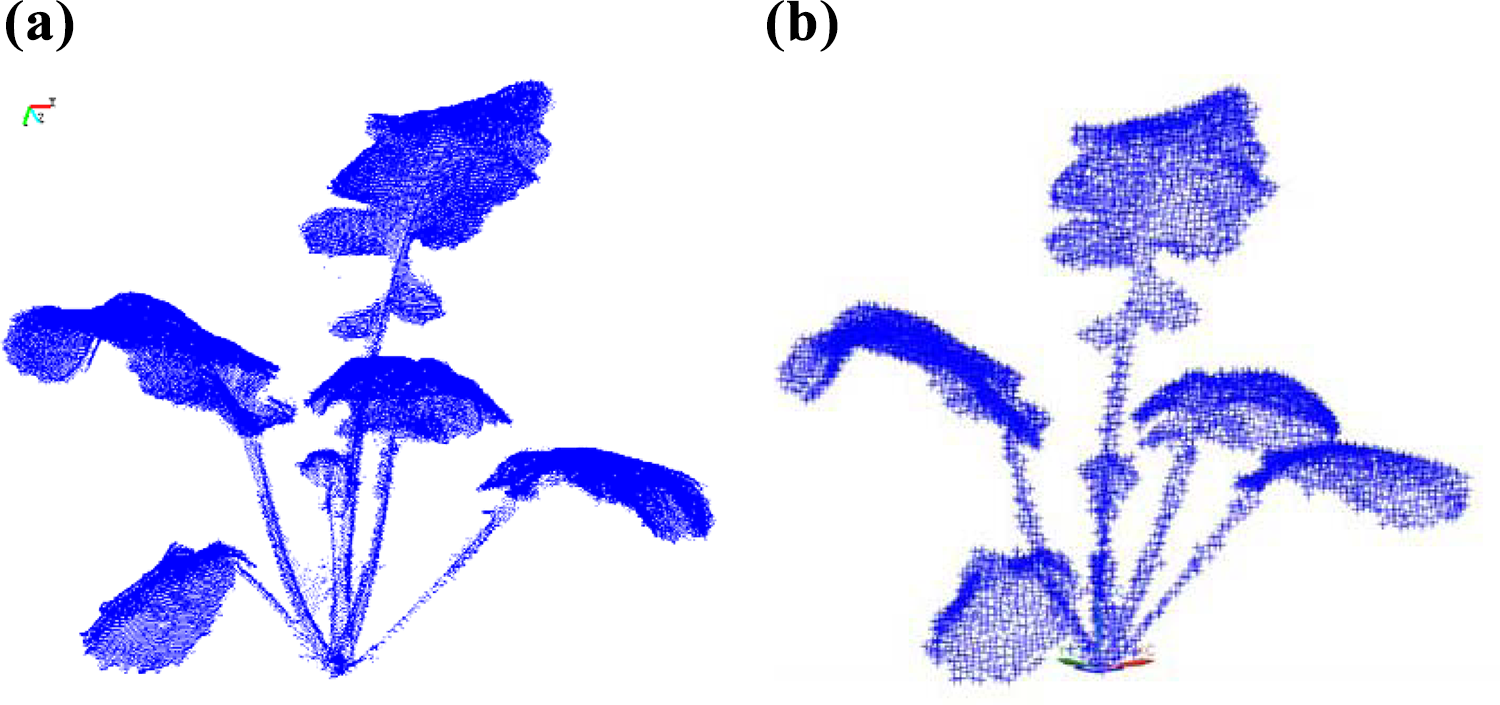
(a) Original point cloud and (b) point cloud after sampling.
Interaction between the droplet and crop
To determine whether the droplet hits on the crop or not, a discrimination method was needed to get the intersection of the trajectory of droplets and the crop model. Two solutions could be used to resolve the problem: (1) Construct surfaces consisting of the point cloud by 3D reconstruction method. The location of a droplet on the object plant could be calculated through the intersection equations of the directed line segment and surface. (2) Analyze the space position relations of point cloud and directed line segment. A criterion can be inferred to judge whether the droplet would fall on the plant and then calculate the location.
Compared to the first solution, the second one is better with the advantage of computing overhead and the easy processing of criterion. Thus, the second solution was used in this research. The relationship between point and line is shown in Figure 10(a).
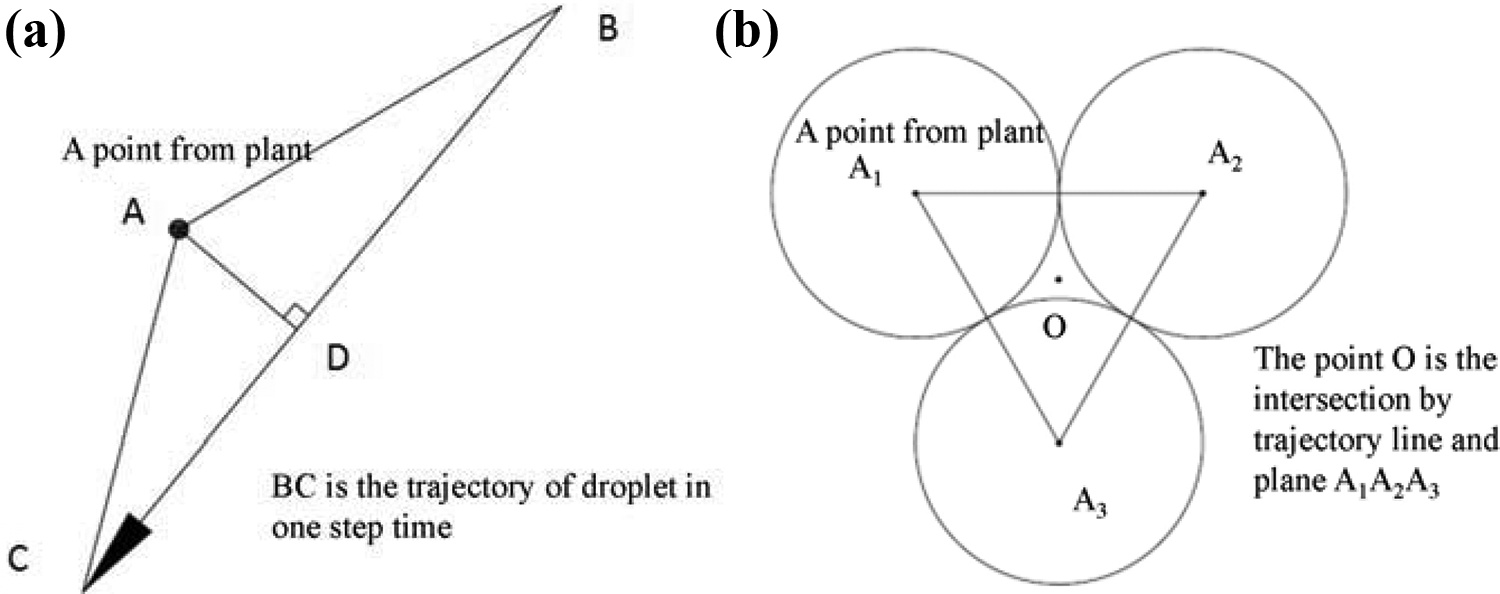
(a) The space relationship between the point and line and (b) the relationship between a drop point and crop cloud in the plane of
The following inequalities were obtained according to the properties of a triangle


After adding the two inequalities above together, the following inequalities were obtained


Assume that the point cloud data were reduced according to the distance set at ds. That is, the distance between two points would not be less than ds. Relations of points and sampling circles are shown in Figure 10(b). We can obtain that the point O is the maximum distance with the three-point (
Therefore, a droplet can be regarded as falling on the object plant if the space position relation of a point and the line segment satisfied the following inequalities

The values of AC, AB, and BC can be calculated by the coordinate. Among all the points that satisfied the inequalities above, points with maximum coordinate value in the z-axis were regarded as the location of a droplet on the object plant.
Experiments and results
The experiments have two main parts. The first part involved the simulation experiment, which selected the spray height as an example to calculate the metrics of the droplet distribution. The second experiment evaluated the indoor and outdoor platforms.
Simulation experiments
The simulation system can be used to simulate the spray progress, which could be helpful to determine the spray parameters, for example, the spray height, and the selection of nozzle to get an optimized droplet deposition and coefficient of variance for the spray deposition. Droplet deposition rate

where p is the number of spray steps, n is the number of droplets for each step,
The coefficient of variance for the spray deposition is another important metric that describes the uniform degree of droplet distribution on the crop. The coefficient of variance for the spray deposition cv can be calculated as

where
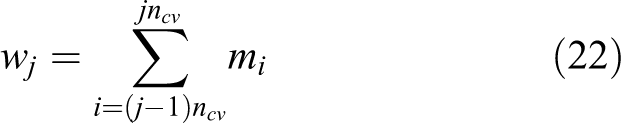
where
It can be observed from Figure 11(a) that the droplet deposition rate did not have a significant relationship with the different number of droplets. Only the variance of the droplet deposition rate would be larger when a small number of droplets were applied for simulation. The more the spraying height, the lower the droplet deposition rate obtained. This reflects an actual situation, where the nozzle is closer to the crop to allow more droplets to hit the crop. Figure 11(b) represents the cv under different spray heights and the number of droplets to demonstrate the degree of uniform distribution. The simulation results show that the cv decreases with the increase in the number of droplets, which remains stable after the number of droplets reaches 80. This means that for the evaluation of cv, enough droplets would be required to get a simulation that can better reflect the real situation. The optimized spray height needed to get the best cv was 0.2 m and the difference between spray height of 0.2, 0.3, 0.4, and 0.5 m was not significant, which also reflects the real-life application. When the nozzle is placed too close to the crop, even though more droplets would fall on the plant, only small parts of the crop can have these droplets. Therefore, to achieve good deposition rates, the spray height cannot be placed too high or too low in case of the high value of cv, which may lead to uneven droplet distribution on the crop. Figure 12 shows different spray heights with the number of droplets at 80. Figure 13 shows the front view and oblique view under the simulation droplet of 80 and spray height of 0.2 m.

(a) The droplet deposition rate under different spray height and number of droplets for simulation. (b) The coefficient of variance for the spray deposition under different spray height and number of droplets for simulation.
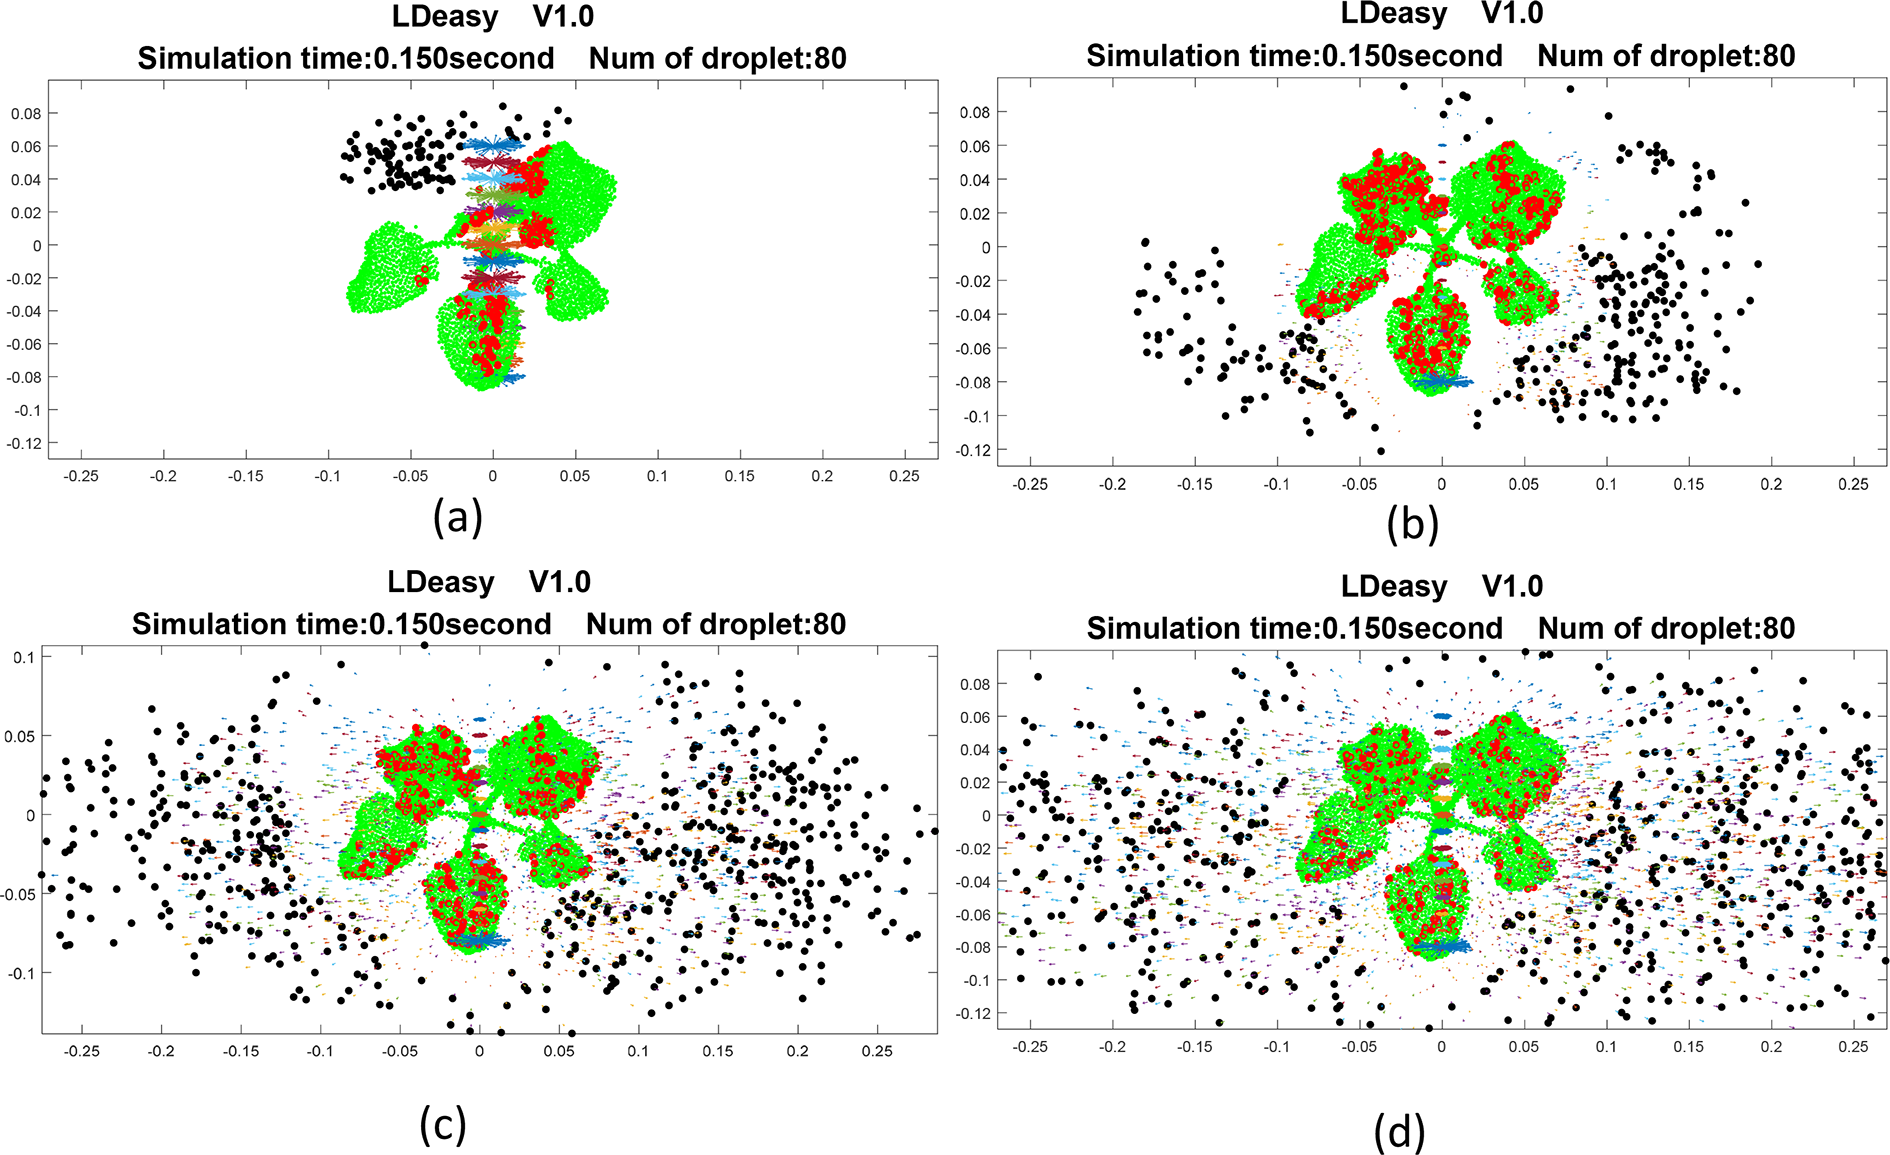
The spray simulation of top-view with different spray height: (a) 0.1 m, (b) 0.2 m, (c) 0.3 m, and (d) 0.4 m.

(a) The front view and (b) oblique view under the simulation droplet of 80 and spray height of 0.2 m.
Field experiments
The experiment was carried out using two platforms. The indoor experiment platform was mainly used to fast verify the configuration of the overall system and communication of each component. The field target spray equipment was tested under two situations, the first scenario was outdoor on the flat ground using a plastic plant with a rectangle shape, see Figure 14(a) and (c). The other scenario is in the field with the Chinese cabbages, see Figure 14(b) and (d). To make sure the full coverage of the target was achieved, the spray target bounding box was set to be 1 cm larger in the bottom and top edge sides than the detected bounding box of plant. The correct spray action is 525/530 with 99.1%, the missing targets may be due to (1) the spray time calculated by equation (2) is too small due to the small target, which was less than the response time of solenoid valve and (2) the missing detection of plant due to sudden changes in external illumination.

(a) The image processed results with four ports for plant segmentation for the plastic plant. (b) The image processed result with four ports for plant segmentation for Chinese cabbages. (c) The field target spray equipment is tested on the flat ground using plastic plant with rectangle shape. (d) The field target spray equipment is tested in the field with Chinese cabbages.
The spray deviation of du and dl (see Figure 4) was used to evaluate the spray accuracy, which is the spray water stain edge to the crop bounding box edge. The deviation was measured by a 1-mm accuracy rule with 50 sprayed crops. The result is shown in Figure 15. It can be observed that the spray deviation was getting more volatile from indoor to outdoor evaluation. This may be due to the fact that the indoor spray nozzle was fixed and steady, but the outdoor nozzle is shaking because of the vibration from the moving tractor on the uneven field. What is more, the use of real Chinese cabbage instead of plastic plant may also increase the deviation. The evaluation metrics include the average error of estimated value to the ground truth, the error of maximum estimated value and actual value, the root mean square error, 80% of estimated confidence interval (0.80CI), and the 95% of estimated confidence interval (0.95CI), as given in Table 1. The range of 0.80CI and 0.95CI was increasing due to vibration increase from E1 to E3. Around 80% of the crop had the spray deviation from 0 mm to 28 mm, which means 80% of the crop were fully sprayed with 28 mm at most spray deviation off the crop on the ground, and 95% of the crop had the spray deviation from −9 mm to 29 mm.

The spray deviation of du and dl under different experiments, where E1 denotes the indoor experiment, E2 denotes the outdoor on the flat ground experiment, E3 denotes the outdoor in the field experiment, U denotes du, and L denotes dl. The whiskers show the minimum and maximum recorded change of the distance while the first and third quartile show the start and the end of the box. Band, red dot, and cross represent median, mean, and outliers of the recorded changes, respectively.
Descriptive statistics for spray deviation (in mm).

AE: average error; ME: maximum error; RSME: root mean square error; CI: confidence interval.
In the plant growth condition like in Figure 14(b) and (d) (50 cm of plant spacing), the experiment of uniform spray and target spray results in Figure 16(a) and (b) shows that the target spray can reduce 46.8% usage of the leaf fertilizer compared to the uniform spray method.

(a) The instantaneous volume comparison of uniform spray and target spray and (b) the accumulated volume comparison of uniform spray and target spray.
Discussion
In this article, we developed and evaluated the target spray platform for reducing the leaf fertilizer in cabbage as a primary aim. The indoor platform and field equipment were designed to evaluate especially regarding the response time and target spray accuracy. Response time for the solenoid valve and target spray were analyzed to ensure the accuracy of the target spray. The target spray accuracy is a parameter that has been little evaluated in previous research. By consideration of the spray effectiveness with droplet distribution, the spray simulation was built up and optimized for the spray height. The spray simulation can also easily visualize the spray process and compare it for different spray parameters. By introducing the relationship between the detected bounding box and spray area, the spray deviation is used to demonstrate the spray accuracy. The indoor platform has the highest accuracy because of the steady nozzle and constant speed with 0.80CI of spray deviation from 13 mm to 17 mm. This result can reflect that the spray system is well calibrated. However, due to the vibration of the tractor and unevenness of the field, 0.80CI of spray deviation varies from 0 mm to 28 mm, and 0.95CI varies from −9 mm to 29 mm. This evaluation of the spray system has been little researched in the previous studies. Underwood et.al 34 introduced the real-time steerable spray for vegetable crops with a simple assumption that the drop travels in a straight line without evaluating the deviation of spray. The amount of deposits on the plants has not been considered in those studies. Özlüoymak et al. designed a target-oriented weed control system using machine vision. 35 The saving of the spray chemical was taken into as evaluation metrics, however, the spray accuracy was also not taken into account for evaluation. The evaluation method for spray accuracy could be used as further metrics for the evaluation of equipment performance. Based on our result, the vibration cancellation technique can be introduced to improve spray accuracy in the future.
In our article, we assume the droplet trajectory with simplified dynamic models. More sophisticated models can be considered in further work. The droplet will also not stay static in the crop leaves. It may flow to the ground or the other leaves based on the angle of the leaves and the weight of the droplet. A statistic model could be further built to make the simulation more realistic. It also needs to be noticed that the thickening agent is usually been added into spray liquid to increase its viscosity, 36 therefore, the droplet can be easier to attach to the target surface without flowing away.
The experimental results show that the developed system can reduce 46.8% usage of leaf fertilizer. It was reported that 3,400,000 metric tons of leaf fertilizer were consumed in 2019, which means the proposed system has the potential to save 1,591,200 metric tons of chemicals with around US$238 million (US$150 /metric tons) per year. 37 What is more, saving chemicals can reduce the pollution to the environment, which is inestimable to human society.
Conclusion
This article focused on the design and preliminary evaluation of a target spray platform. All components were effectively connected and evaluated especially regarding the response time and target spray accuracy. The indoor experiment setup was built to test and optimize the parameters of the overall system. Afterward, the tractor-based equipment was designed to verify the system for the outdoor environment. The correct spray action was 99.1% for average. Around 80% on the crop had a spray deviation from 0 mm to 28 mm. The spray deviation showed that the vibration from the field test environment will reduce the spray accuracy when the spray system is calibrated well in the static spray environment. The experimental results show that the developed system can reduce 46.8% usage of chemicals compared to the uniform spray method. Further work will focus on the implementation of deep learning methods to realize weed and crop segmentation such that the entire weeding and fertilization spray system can be developed. What is more, the spray accuracy by current system should be analyzed from view of agronomy to decide whether it is suitable for the target crop. Vibration cancellation technique could be also studied to balance the spray accuracy and spray volume.
Footnotes
Author contributions
MZ implemented the system and drafted the paper. HJ provided the founding and gave the suggestions for the experiment. AK provided the founding, gave the feedback for system design and suggestion for the experiment. ZB and HS intensively discussed, proposed, and drafted the key points of the revision, improved the quality of the figure, and revised the manuscript.
Declaration of conflicting interests
The author(s) declared no potential conflicts of interest with respect to the research, authorship, and/or publication of this article.
Funding
The author(s) disclosed receipt of the following financial support for the research, authorship, and/or publication of this article: This work was partly supported by the National Natural Science Foundation of China [Grant Number: 31870347] and Zhejiang Science and Technology Program [Grant Number: 2019C02003]. This work was supported by the German Research Foundation (DFG) and the Technical University of Munich (TUM) in the framework of the Open Access Publishing Program.