
Abstract
To overcome the problem of the low accuracy and large accumulated errors of indoor mobile navigation and positioning, a method to integrate the light detection and ranging- and inertial measurement unit-based measurement is proposed. Firstly, the voxel-scale-invariant feature transform feature extraction algorithm for light detection and ranging is studied. Then, the errors of light detection and ranging measurement due to the change of the scan plane compensated based on aiding information from inertial measurement unit. The relative position parameters and the differences of measurements of light detection and ranging at adjacent times are used to estimate the error of inertial measurement unit sensors by a Kalman filter. Several experiments are carried out in the indoor corridor and the results demonstrate that precision of the light detection and ranging/inertial measurement unit-integrated indoor mobile robot localization is higher than that of single light detection and ranging sensor.
Introduction
In the recent years, the indoor autonomous service robot has gradually become the research focus of many enterprises, with a very good application field and development prospects. 1 Many start-ups have exhibited their indoor service robots, only a small number of them have the function of autonomous indoor navigation. Based on the simultaneous localization and mapping (SLAM), the robot is able to “see” its own location and accurately move to the target’s position in an unknown environment, which is an important indicator for improving the intelligence of the robot. At present, there are two ways for indoor service robot’s self-localization and navigation system using the SLAM method, one is to use visual camera and the other is to use light detection and ranging (LiDAR). Although the precision of single-point measurement by camera is lower than that of LiDAR, it can build more dense and rich point cloud maps based on repeated observation of the texture information of pictures and improve the positioning accuracy. The camera relies heavily on lighting conditions and cannot work in dark scenes or scenes with insufficient texture information; however, the LiDAR has the characteristics of fast real-time ranging, not limited by the light environment, high ranging accuracy, and relatively constant error, and is more reliable working performance, which has been widely used in the construction of maps, navigation and positioning of robots, environmental modeling, and other aspects. 2,3 Although some problems have been solved, it is also a big challenge in the field of LiDAR SLAM, which has been attracted more attention in mobile robots. 4 –6
It should be emphasized that the positioning method relying on a single sensor has disadvantages, which is greatly affected by the signal strength, and even fails in the case of the signal occlusion. Although LiDAR scanning and matching technology can provide high-precision position and course positioning results, when the environmental characteristics are not obvious, the positioning accuracy of LiDAR will be greatly reduced and easily interfered by the external environment. Moreover, the sampling frequency of LiDAR is low. 7 Compared with LiDAR positioning technology, the inertial navigation technology has the ability of autonomous navigation, which can provide full navigation parameters of high-frequency speed, position, and attitude. However, the inertial navigation system -derived navigation and positioning errors will gradually accumulate with time, which can only provide high-precision navigation and positioning results in a very short time. The LiDAR- and inertial measurement unit (IMU)-integrated navigation combines the advantages of LiDAR and IMU navigation and positioning technologies to learn from each other and realize a combination system with high sampling rate and high precision that can work continuously indoors. 8,9 Even without global positioning system (GPS) signals, the integrated LiDAR/IMU can achieve high positioning precision in indoor environments. Research shows that LiDAR/IMU-integrated navigation positioning has become one of the hot spots in navigation technology research. 10,11
To improve the localization accuracy, an improving indoor robot positioning algorithm for LiDAR/IMU-integrated navigation using Kalman filter (KF) is investigated in this article. Firstly, collecting experimental data. Then, the kinematics parameters of the mobile robot are calculated by the inertial system, and the local features of the environment are detected by scale-invariant feature transform (SIFT) of voxel lattice (voxel-SIFT) algorithm. Over time, the accumulated environmental feature data are used to update the environmental map. Then, the mobile robot can use its environmental map to locate itself. LiDAR/IMU-integrated positioning is an important and effective method for detecting unknown environments and solving indoor positioning problems of mobile robots. To facilitate the real-time implementation of the algorithm in hardware, the relative pose parameters obtained from the LiDAR data are converted into global coordinate for the measurement of KF.
Coordinate system
Consider that the system has LiDAR and IMU sensors, calibrated the external parameters between them. The relative posture between LiDAR and IMU is calibrated by solving the hand-eye problem, 12 and the calibration method is the same as in the work of Zhang and Singh. 13 The IMU frame is in the same direction as the LiDAR frame. Figure 1 shows three related reference frames, fixed world frame {W}, the LiDAR frame {L}, and the IMU frame {I}, installed together. 14

{L} is the LiDAR frame, {I} is the IMU frame, {W} the fixed world frame which are mounted together. The subscripts “WL” represent the rotation from the LiDAR frame {L} to the world frame {W} and vice versa. The acceleration
{L} is the LiDAR frame of axes originating from the LiDAR center. The X-axis and Y-axis point the left and forward, respectively, and the Z-axis points upward coinciding with the LiDAR principal axis.
{I} is the IMU frame of axes originating from the IMU measurement center. The coordinate axis is in the same direction and parallel to {L}.
{W} is world frame of axes, this is the gravity-aligned frame of axes with the same as {L}.
Employed sensors
The LiDAR system mainly includes LiDAR and IMU, which are used to measure the distance from the sensor to the ground point and the spatial attitude parameters of the main optical axis of the measurement unit, respectively.
15
The LiDAR system mainly has the following three characteristics: LiDAR data have high precision. With a height and horizontal position accuracy of 10 cm and below 0.4 m, respectively. In addition, high-resolution digital images can be collected. LiDAR data have high density. With a large amount of point cloud, it can really reflect the terrain and topography. LiDAR adopts automatic scan measurement method; it can work all the time without much control.
LiDAR
LiDAR measures the distance and angle between the measured object and the sensor. The distance from the measured object is calculated according to the time from laser pulse to receiving pulse. 16,17
LiDAR updates IMU data by scanning indoor environmental and extracting information. The Rfans-16 LiDAR sends out infrared laser pulses, which, according to their “time of flight,” obtain the running time of LiDAR, the scan rate is 12.22 ms. The resolution of detecting angle and ranging scope of LiDAR, respectively, is 0.1° and 0.1–200 m, the collection frequency of the LiDAR is 10 Hz. By using the equations x = dcos(Φ) and y = dsin(Φ) to get the LiDAR scanning point coordinates, which d is the scan distance and Φ is the scan angle. Since the scanning point coordinates are x and y in the carrier coordinate system, as so transforms them to the navigation coordinate system to obtain navigation coordinates. 18
IMU
IMU sensor is used to measure the three-axis attitude angle and acceleration of an object. The data of gyroscope and accelerometer are processed in IMU, and the acceleration of the object in the carrier coordinate system is obtained by the three-axis accelerometer, and the angular velocity of the carrier relative to the navigation frame of axes is obtained by the three-axis gyroscope. The bias stability of IMU (MTI-100) gyroscopes is about 10°/h, bias stability of IMU accelerators is about 40 µg, and IMU data acquisition frequency is 100 Hz. Based on the acceleration and angular velocity of the object in the 3-D space, the attitude of it is then solved. 19
Due to various unavoidable interference factors, the error of gyroscope and accelerometer is generated from the initial alignment, and its navigation error increases with time. Therefore, its error and noise should be considered, where b for error and n for noise. Assuming that the noise is white Gaussian noise with zero mean value


where in equations (1) and (2), wt
is true angular velocity,
LiDAR/IMU integrated navigation positioning
Algorithm framework
The schematic diagram of the fusion algorithm is shown in Figure 2.
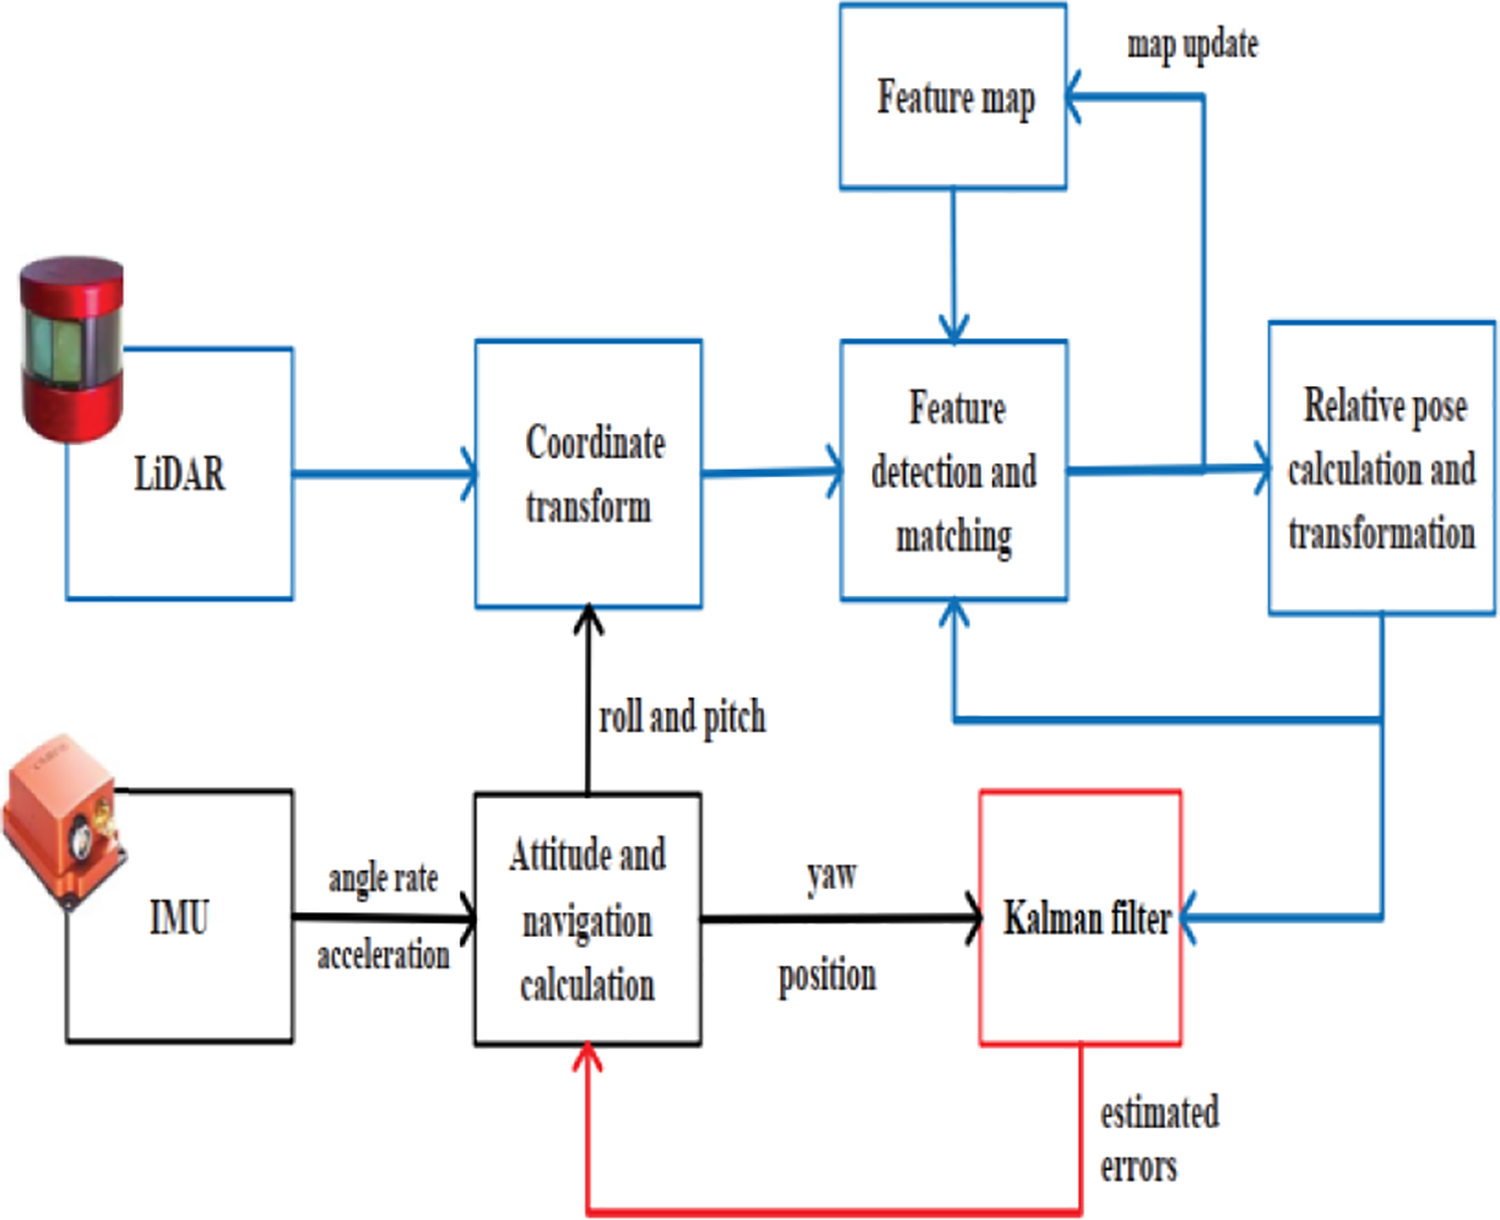
Schematic diagram of the integrated algorithm.
Principle of SINS
The basic working principle of strapdown inertial navigation system (SINS) 20 algorithm is by measuring the acceleration of the carrier in the inertial reference frame, integrating the time and then transforms it to the navigation coordinate system to obtain the speed, yaw angle, and position information in the navigation coordinate system. The function and concept of SINS are embodied in the computer. The acceleration and angular acceleration measured by the IMU directly mounted on the carrier are components along the axis of the carrier. These components can be converted to components in the required computer coordinate system through a coordinate conversion direction cosine matrix. If this matrix can describe the carrier and the relationship between the world coordinate system, then the vector coordinates measured relative to the inertial acceleration and angular velocity of the space, transformed the world coordinate system can be got after the acceleration and angular velocity components, had known bearing acceleration and angular velocity components, the navigation computer can according to the requirements of the corresponding mechanics equations of navigation and attitude parameters.
Voxel-SIFT feature extraction algorithm
Due to the disorder of LiDAR point cloud data, it is a major research difficulty to extract and identify the feature points. The selection of feature extraction method will seriously affect the registration of LiDAR point cloud, thus affecting the accuracy of LiDAR SLAM overall positioning and mapping. This article focuses on voxel-SIFT feature extraction algorithm based on LiDAR point cloud.
SIFT 21 is a common feature of 2-D image feature detection, whose application scope includes image mosaic, target recognition, object tracking and 3-D model construction, and so on. Different from SIFT’s application in dense point cloud of 2-D plane image, this article presents a feature point extraction method based on SIFT of voxel lattice, aiming at the spatial sparsity characteristics of 3-D point cloud of LiDAR. Detailed steps of voxel-SIFT feature extraction method are described below:
Step 1: On the 3D LiDAR point cloud data to construct the 3-D voxel grid, on the basis of the Z-axis point cloud information from outside to inside space of point cloud layer division, assuming that each layer of the original model for voxel grid, then the layer of the scale of the space model for the primitive voxel grid model with 3-D Gaussian filter convolution, as shown in the following equations

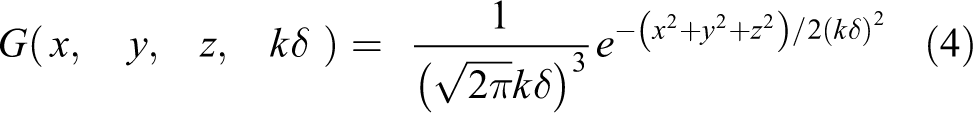
where
Step 2: Calculate the Gaussian difference model of adjacent scale layers to ensure the scale invariance of voxel mesh. Refer to formula (5)

Step 3: Detect the extreme point from different directions of Gaussian difference space, which is the maximum point or minimum point in all Gaussian difference models.
Step 4: The spatial region containing 8 × 8 × 8 small voxel meshes were redivided with the extreme point as the center, and each subregion was further divided into a 4 × 4 × 4 grid region. The normal vector of each point in the point set was calculated in each grid region after the partition.
Step 5: Use the histogram to statistics the amplitude and direction angle of the normal vector in each grid area. The horizontal axis of the histogram statistics the direction angle, while the vertical axis statistics the accumulated value of the amplitude corresponding to the direction angle. Select the vector value corresponding to the histogram peak as the characteristic vector of the subgrid area.
Figure 3 is the schematic diagram of voxel-SIFT feature extraction algorithm, which can guarantee that the extracted feature points have rotation invariance and feature vectors with high resolution, and can distinguish the feature areas with slight changes from those with less obvious information.

Voxel-SIFT feature extraction algorithm. SIFT: scale-invariant feature transform.
KF-based LiDAR/IMU-integrated navigation
Because the GPS lost its signals in the indoor environment, it was unable to positioning, individual LiDAR navigation will produce cumulative errors over time; thus, the traditional navigation system can be improved by integrating other positioning sensors. In a word, LiDAR/IMU-integrated navigation system adopts the classical KF to decrease the LiDAR error and improve the positioning precision of robot navigate autonomously indoors.
The Kalman filtering is realized by the method of error estimation, mainly state error and observation error. This indicates that the filter estimates the error of the designated attitude position, and velocity of IMU, it continuously estimates the output error of various sensors to optimize the information of each sensor. 22
Equation of state model
To integrate inertial information and LiDAR observation, KF of the translation, rotation, velocity, gyroscope, and accelerometer’s first-order Markov process with a total of 16-dimensional states is selected, and the error-state representation method is adopted to linearize it. Then, the state equation established is as follows


where
Measurement equation model
The pose of LiDAR is calculated and then used as observation quantity for KF status update.
Firstly, it is assumed that the uncertainty of LiDAR pose can be obtained, and its measured noise

Since we use the error quaternion, residuals can also be divided into translation and rotation. For the translation part, the residual has the following form


where
For the rotating part, using the definition of error quaternion, we have the following equation


Linearized error quaternion

where

Finally, we get a complete LiDAR observation Z and residual model.
KF equation
The system regards the LiDAR as a six-degree-of-freedom pose sensor and then uses the KF algorithm to fuse inertial information. As shown in Figure 2, in the whole process, IMU measured value and LiDAR output value are used as the input of KF for state prediction and update.
The combined forecasting model and observation model get the traditional KF calculation process, in particular, KF filter through the acceleration and angular velocity information of IMU measurement condition forecasting, through LiDAR measurement of position and posture information, for status updates, constantly updated and revised, the ultimate state estimation results are obtained. 23
The following equation of state and observation equation can be used


where in equations (18) and (19), k as discrete time,
Due to the unstable calculation height, the sensor is fixed at an initial height. The designed KF model integrates the position and attitude information of LiDAR sensor and IMU sensor and then uses these information to correct the trajectory generated by LiDAR data and compensate the errors accumulated over time.
Validation of the voxel-SIFT algorithm and LiDAR/IMU-integrated navigation algorithm
Voxel-SIFT algorithm verification experiments
To verify the voxel-SIFT feature extraction algorithm for the test result of laser point cloud data, choose three typical scenarios single frame of point cloud data for experiments, including passes through the point cloud pretreatment operation Karlsruhe Institute of Technology and Toyota Technological Institute (KITTI) open-source data set (16 line R-fans sensor) and the actual collected data sets (16 line R-fans sensor), Figure 4 is voxel-SIFT feature extraction algorithm of building space, indoor gallery, and indoor corridor the feature extraction effect of three kinds of situations. The blue point cloud in the figure is the original point cloud, and all the red punctuation marks on the figure are the extracted feature points.

Feature extraction results of data processed by voxel-SIFT algorithm in different scenarios. (a) Building space; (b) indoor gallery; (c) indoor corridor; and (d) to (f) feature detection results. SIFT: scale-invariant feature transform.
In Table 1, the experimental results (point cloud number, number of feature detection, and time of feature detection) of the two feature detection algorithms are compared, SIFT feature detection algorithm and voxel-SIFT feature detection algorithm. The main evaluation index is the detection quantity and detection time of feature points. To compare the detection time more accurately, the time of each detection of 100 feature points is selected for the same comparison. In the table 1, the number of feature points extracted by voxel-SIFT algorithm is more than that by SIFT algorithm in each kind of scene test, and the overall detection time is shorter. The detection time of the voxel-SIFT algorithm is relatively stable, and the more feature points detected in general, the longer the time is spent. In the comparison of feature detection time presented in Table 1, the voxel-SIFT feature detection algorithm proposed in this article takes the least time, so considering the detection time, the voxel-SIFT algorithm is more suitable than SIFT algorithm for later data processing. The proposed feature extraction method based on voxel lattice improved SIFT has high extraction efficiency and can be applied to the fast registration of laser point cloud.
Comparison of feature point detection results.

SIFT: scale-invariant feature transform.
Integrated positioning experiment
A turtlebox2 mobile robot experimental platform with high-performance laptop, LiDAR, and IMU sensor integrated navigation system was designed. During the whole real test operate online experiment, the robot moves at a speed between 0.15 m/s and 0.25 m/s, Rfan-LiDAR has the advantages of common LiDAR sensors, and with high positioning accuracy. For verifying the precision of trajectory under different experimental conditions, two experiments were performed. First, the coordinates of some key points before the relevant path of the experiment were recorded and then the coordinates were compared with those of the experiment to obtain the positioning effect of the coordinates. In Figure 5, the data acquisition of the robot platform.

The data acquisition of the robot mobile platform.
Indoor linear corridor experiment
Figure 6 shows an indoor scene in which the robot moves a distance along the ground in the experiment.

The corridor scene map in the experiment.
In Figure 7 and Table 2, with LiDAR and with LiDAR/IMU, the maximum offset of the robot trajectory is 0.17 m and 0.11 m on the Y-axis, respectively. The average errors respectively in the X-axis are 0.02 m and 0.01 m, in the Y-axis are 0.14 m and 0.08 m with LiDAR and with LiDAR/IMU in Table 3.

The straight trajectory of corridor scene map in the experiment.
Comparison among control points position for LiDAR and LiDAR/IMU in the straight line experiment (in meters).

LiDAR: light detection and ranging; IMU: inertial measurement unit.
Absolute values of the coordinate errors (in meters).

LiDAR: light detection and ranging; IMU: inertial measurement unit.
Indoor polygon trajectory experiment
The experiment in which the robot moves clockwise in an octagon and returns to the starting point. The precise position of the reference points coordinates in the carrier frame was obtained by using the tachometry. Figure 8 shows the polygon corridor scene map in the experiment.

The polygon corridor scene map in the experiment.
According to the trajectories in Figure 9 and coordinates of the reference points in Table 4 that LiDAR’s measured trajectory has an offset to the reference point and ultimately cannot return to the origin, whereas the trajectory of the LiDAR/IMU algorithm is relatively closer to the control points. In Table 4, with LiDAR, the offset of the trajectory at the X-axis and Y-axis, respectively, is −0.13 m and is −0.06 m. With LiDAR/IMU, the offset of the robot trajectory on the X-axis and on the Y-axis, respectively, is 0.08 m and 0.04 m. In the X-axis, the average errors respectively are 0.21 m and 0.12 m, in the Y-axis are 0.26 m and 0.14 m with LiDAR and with LiDAR/IMU in Table 5. In Table 6, it can be concluded that the standard deviation of the integrated measurement of LiDAR/IMU is optimal. The standard deviation from 0.46 m to 0.40 m in X-axis, 0.30 m to 0.22 m in Y-axis.

The polygon trajectory of corridor in the experiment.
Comparison among control points position for LiDAR and LiDAR/IMU in the polygon experiment (in meters).
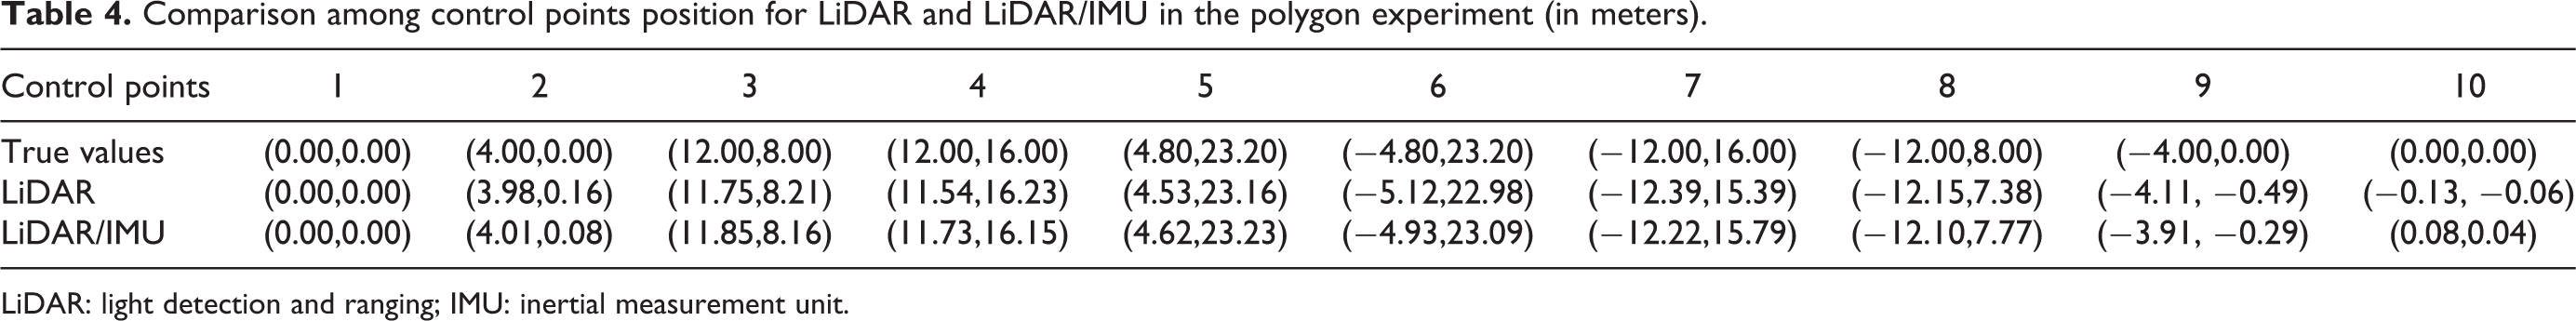
LiDAR: light detection and ranging; IMU: inertial measurement unit.
Absolute values of the coordinate errors (in meters).

LiDAR: light detection and ranging; IMU: inertial measurement unit.
LiDAR, LiDAR/IMU integrated and real measurement error analysis (in meters).

LiDAR: light detection and ranging; IMU: inertial measurement unit.
According to the above, the LiDAR/IMU KF fusion positioning is very significant in compensating the cumulative error of LiDAR and correcting the trajectory and is higher positioning precision. Considering that the robot platform itself may slip sideways during operation and other factors interfere, there are some errors in the experimental results. These results show that error accumulation is small and the positioning precision is high for the short distance fusion positioning. The results show that, compared with a single LiDAR, the average error on the X-axis decreases from 0.21 m to 0.12 m and the standard error decreases from 0.46 m to 0.40 m, and the average error on the Y-axis decreases from 0.26 m to 0.14 m and the standard error decreases from 0.30 m to 0.22 m. Other tests have shown similar results. These results verify that compared with single sensor, the proposed method can improve the positioning accuracy for the short distance fusion positioning.
Conclusions
In this article, the fusion positioning system is studied by combining LiDAR sensor with IMU sensor through KF. The integrated IMU reduces the trajectory errors of the LiDAR and corrects the accumulated error of IMU by using LiDAR; thus, the positioning precision of indoor robot is improved. Contributions are summarized as follows: With the characteristics of LiDAR point cloud, a SIFT feature based on voxel-SIFT feature is proposed. To highlight the effectiveness of the proposed method in the comparison experiment, the voxel-SIFT feature extraction algorithm was firstly studied and analyzed in detail, and the feature detection effect diagram of the feature extraction algorithm was given. Secondly, this article selected three types of laser point cloud data sets under different scenarios for experimental testing and compared the number of feature point detection and detection time of the above two feature extraction algorithms to give a detailed analysis of experimental results. The improved SIFT method based on voxel lattice proposed in this article has high extraction efficiency and can be applied to the fast registration of LiDAR point cloud. KF was used to loosely combine LiDAR and IMU data to make up for the shortage of single LiDAR sensor. The above experimental results demonstrate that compared to a single sensor, the proposed method can improve the measurement accuracy.
However, this method has still the precision limitation, the next step is to increase the measurement range of the experiment and compare multiple experiments, improving the calculation precision of navigation parameters to further eliminate errors and increase the measurement distance. At the same time, because the laser point cloud data of different scenarios characteristics vary, all kinds of the fusion feature extraction method is more sensitive to the parameter settings, the follow-up research work can be from the perspective of deep learning, for a variety of scenarios of laser point cloud data to a large number of training, to produce a complete set of deep learning network, can realize the automatic extraction of laser point cloud, improve the various disadvantages of traditional algorithm.
Footnotes
Declaration of conflicting interests
The author(s) declared no potential conflicts of interest with respect to the research, authorship, and/or publication of this article.
Funding
The author(s) disclosed receipt of the following financial support for the research, authorship, and/or publication of this article: The article was supported by the projects of the National Key Technologies Research and Development program (no. 2016YFB0502002) and the National Natural Science Foundation of China (nos 41764002 and 61803175), in part by the Shan Dong Key Research and Development Program (no. 2019GGX104026), in part by a project ZR2018LF010 supported by Shan Dong Provincial Natural Science Foundation, and in part by the China Postdoctoral Foundation (no. 2017M622204).