
Abstract
With the development of big data technology more and more perfect, many colleges and universities have begun to use it to analyze the construction work. In daily life, such as class, study, and entertainment, the campus network exists. The purpose of this article is to study the online behavior of users, analyze students’ use of the campus network by analyzing students, and not only have a clear understanding of the students’ online access but also feedback on the operation and maintenance of the campus network. Based on the big data, this article uses distributed clustering algorithm to study the online behavior of users. This article selects a college online user as the research object and studies and analyzes the online behavior of school users. This study found that the second-year student network usage is as high as 330,000, which is 60.98% more than the senior. In addition, the majority of student users spend most of their online time on the weekend, and the other time is not much different. The duration is concentrated within 1 h, 1–2 h, 2–3 h in these three time periods. By studying the user’s online behavior, you can understand the utilization rate of the campus network bandwidth resources and the distribution of the use of the network, to prevent students from indulging in the virtual network world, and to ensure that the network users can improve the online experience of the campus network while accessing the network resources reasonably. The research provides a reference for network administrators to adjust network bandwidth and optimize the network.
Introduction
With the advent of the robot era, with the rise and widespread application of big data technologies such as Hadoop and Spark, robot technology is becoming more and more mature, and people are using robots to deal with more and more things. 1,2 With the development of the times, people need to process more and more data, and the labor costs increase accordingly. People face the data of GB. In the analysis, they may feel that the load is very large and they cannot be processed as they please. The analysis work has also delayed the progress of the work. Nowadays, with the robot technology, people are no longer worried about the data. They can use artificial intelligence to process the data in any way according to their own ideas, and the load is not very high. Large, even as data grow faster and faster, people are no longer powerless when dealing with them. 3,4 From the data point of view, the data are generated by people’s behavior. If there is only a small amount of data, it is not very meaningful for the analyst, then the user can be analyzed in depth and a reasonable prediction can be made. When the amount of data reaches a certain level, the data can play a feedback role, and the specific feedback effect will have different changes according to the nature of the data holder. How to use robotics to dig out the knowledge that can guide practice from piecemeal information has become the hottest topic. 5,6
Many colleges and universities in the campus network operation and maintenance will enable some servers for students to access the Internet for authentication and billing, to prevent hackers from invading the local area network (LAN), monitoring the campus network download upload traffic and detecting sensation in the LAN. While these servers serve the LAN, a large amount of log data is stored in the back-end database. These data not only contain the usage records and behavior characteristics of each user in the entire campus but also record the use of the campus network. 7,8 When these idle data are collected and used and analyzed reasonably, based on the big data, through the distributed clustering algorithm concept, the user behavior analysis of the campus network users can be used for the users of the campus network. A more intuitive understanding can also help manage the campus network. 9,10 On the one hand, we can understand the utilization rate of the campus network bandwidth resources and the distribution of the use of the network, prevent students from indulging in the virtual network world, and ensure that the network users can improve the online experience of the campus network while accessing the network resources reasonably, so as to facilitate the network. The administrator can adjust the network bandwidth and optimize the network to provide reference. On the other hand, it can understand the interest of campus network users, provide the basis for network management department to optimize network behavior and formulate relevant strategies. At the same time, you can view the online behavior of students on campus online through behavior management. Records can detect bad online behaviors in a timely manner and provide decision support for school network management and optimization, information construction and campus network service level. 11,12
On the domestic aspect, since the art is a classic clustering analysis algorithm, it is widely used in various data mining fields. The traditional K-means algorithm randomly selects the initial centroid, and the clustering results are affected by the noise points, and the clustering results are unstable. In response to this problem, Yanfeng Zhang has proposed a K-means algorithm based on density anomaly detection. The algorithm first uses the density model to detect outliers, avoiding the selection of outliers as the initial clustering center. After clustering non-outlier points, the outliers are distributed to the corresponding clusters according to the distance from the outliers to the centroids. The algorithm effectively reduces the influence of abnormal points on K-means and improves the accuracy of clustering results. Peng H’s experimental results show that the algorithm can effectively improve the accuracy and stability of clustering. 13,14 The distributed K-means clustering algorithm based on multidimensional data has been widely used. However, the current distributed K-means clustering algorithm uses Euclidean distance as the similarity comparison of multidimensional data, which makes the algorithm more rigid to the data set. In response to this problem, Jin Zhou proposed a distributed K-means clustering algorithm based on set pair analysis (SPAB-DKMC). The experimental results of Jin Zhou on the Hadoop distributed platform show that the SPAB-DKMC algorithm can reduce the number of iterations and improve the efficiency of the distributed K-means clustering algorithm. 15 –26
In foreign countries, Poonam Ghuli has proposed an improved density-based distributed clustering (DBDC) algorithm. The algorithm uses the data grid mapping method to map the data objects to the local spatial grid first, which improves the efficiency of local clustering. Poonam Ghuli proposed a global clustering method based on the intersection of representative points on the global clustering level of the new algorithm and used the center point of the representative point to reduce the clustering error. Experimental results show that the improved DBDC algorithm is more accurate than the DBDC algorithm. 17,18 Distributed data mining technology and data mining technology based on distributed clustering have been widely used in the past decade because they deal with massive heterogeneous data sets that cannot be collected centrally. Current distributed clustering methods typically generate global models by aggregating local results obtained at each site. When this method mines data sets at the location of the data set, the aggregation phase is complex, which can result in incorrect and ambiguous global clusters. Anu Rathee has proposed a new clustering method for distributed heterogeneous large spatial data sets. The method is based on the K-means algorithm to dynamically generate global cluster numbers. In addition, this method uses a detailed aggregation phase. The aggregation phase is designed in such a way that the entire process is efficient in terms of time and memory allocation. Preliminary results show that the method can produce high-quality results with good scalability. Anu Rathee also compared it with two popular clustering algorithms. 19,20 Whether in China or abroad, the research on distributed clustering algorithms for big data has achieved certain results. However, these are far from enough. The research proposed in this article is of great significance for applying the distributed clustering algorithm of big data to the research of users’ online behavior.
Based on the big data, this article selects a campus network user as a research object and uses distributed clustering algorithm to study and analyze the user’s online behavior. This article first introduces big data and clustering model, distributed clustering algorithm, and applies the algorithm to the research of users’ online behavior. The research in this article finds that most campus network users will choose the library as the venue for use. The time is concentrated in 1–2 h and 2–3 h. The number of weekends is more frequent, so the sophomores are relatively said that the amount of Internet access is more.
Proposed method
Definition of big data
There is no single standard definition for big data today, because many authorities have different definitions. This leads to the very common use of the term big data, and it is easy to create a chaotic concept, so only by finding an accurate definition of big data can you better use big data technology. Big data will be effectively defined from four dimensions, namely quantity, diversity, speed, and authenticity. 21,22 First, the quantity. The quantity here refers to the amount of data. Big data has a very large number, and this amount of data is still increasing at a very fast rate. The quantity is also the key point of big data. Second, diversity. There are very rich types of data and data sources in big data. The data are structured, unstructured, and semi-structured. This fully demonstrates the diversity of big data. Applying big data requires these. Complex traditional and nontraditional data are analyzed and integrated to get the information you want. Third, speed. Speed refers to the speed of data activities. Nowadays, people process, create, and analyze a large amount of data every day, which requires faster processing to complete the related work. 23,24 At the same time, due to the increasing speed of modern data generation, traditional systems cannot effectively store, collect, and analyze such data. In some time-sensitive processes, it is necessary to analyze specific types of data in real time and improve the efficiency of using big data. Fourth, authenticity. There are very complicated data in big data, and various data are uncertain, which is a hindrance to improve the quality of big data, so we must ensure the authenticity of big data as much as possible. 25,26
Clustering algorithm
Definition of clustering algorithm
Clustering is the process of collecting statistics on various abstract or realistic objects and then grouping similar objects into multiple types. In a nutshell, clustering can divide objects with similarities into the same group and then group the objects with similarities. 27,28 There are currently two classification methods for semantic analysis; one is clustering technology, and the other is clustering analysis. By applying clustering analysis to big data, it can combine the semantics of various text data collected and identify the correlation characteristics among these data to effectively measure the degree of difference in text data of these various categories. Nowadays, a large number of relevant researchers mainly rely on various types of text requirements and their data characteristics for analysis, and can also be applied in specific research topics, combined with the data field, efficiency and scale, and then adopted. The comparative experiment of multiple feature classifications effectively explores the advantages and disadvantages of various clustering methods. Moreover, according to the results of the research, various clustering methods are effectively optimized. 29,30 At the same time, in the actual experimental analysis, it is also possible to accurately judge the advantages and disadvantages of various clustering methods according to the relevant evaluation indicators and to better select the appropriate clustering method.
The concept of cluster analysis
Cluster analysis is the process of dividing data objects into subsets. As the main method of data mining, it is an unsupervised machine learning method. It can automatically find hidden rules from massive data, and does not need any prior knowledge, classify objects according to their similarity, and has high similarity. Objects are grouped into the same group, and objects of different groups are less similar. Through proper clustering, it is more beneficial for people to study the internal laws of things. For a large amount of user behavior data, it is almost impossible to explore the online behavior of each user. Therefore, clustering algorithm is used to analyze the online behavior of users. By dividing the user’s online behavior by similarity, the main online behavior patterns are found to improve the efficiency and ease of analysis.
Traditional K-means algorithm model
Data mining is a process of discovering potential information and patterns in data. Data mining can provide decision support for enterprises and bring direct economic benefits. Therefore, it has been widely concerned. Cluster analysis is the process of dividing a data set into meaningful groups. Cluster analysis can make the data easier to understand. Cluster analysis technology plays an important role in many practical problems and is widely used in biotechnology, machine learning, social science, data mining, pattern recognition, and data analysis. Clustering can be seen as a process of classification, which is used as the object’s mark by the number of the cluster, so clustering is often referred to as unsupervised classification. The K-means algorithm is a prototype-based unsupervised clustering technique and is the most widely used clustering analysis method. The main advantage of the traditional K-means algorithm is that the method is simple and easy to implement in a distributed platform. The disadvantage is that the time complexity of the algorithm is relatively large, especially in the big data environment.
The main flow of the traditional K-means algorithm is shown in Figure 1.
As can be seen from Figure 1, first, input the original data set D, set the number of cluster centers k, and generate the initial cluster center set

K-means algorithm flowchart.
Calculate the distance to the k cluster centers for each data point in D, and assign the data points to the nearest cluster class, the d of the vector distance between the data point


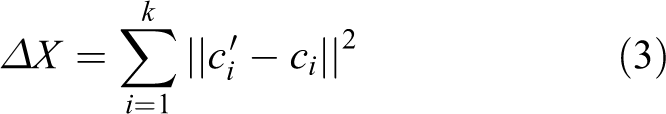
Then, the convergence of the cluster center is judged. If the cluster center converges or reaches the set maximum number of iterations, the algorithm ends, otherwise the iterative process continues. Whether the range of variation of the cluster center is smaller than the set threshold is used as a criterion for convergence. The variation range of the cluster center is calculated according to formula (3), where ci
represents the vector coordinate of the cluster center before the update and
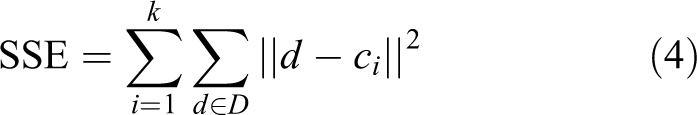
Sum of the squared error (SSE) is usually used as a measure of the clustering quality of the K-means algorithm. Suppose the original data set is D, the number of cluster centers is k, and the final cluster center is
The time complexity of the K-means algorithm is O (kmn), where k is the number of cluster centers, m is the number of iterations of the algorithm, and n is the total number of data points. The time complexity of the algorithm is relatively large, especially in the process of data point allocation, the amount of redundancy in distance calculation is too large. For the K-means algorithm, the process of distance calculation is more time-consuming than other steps. In particular, in the process of assigning a data point to the nearest cluster, the k sub-distance calculation is needed to find the nearest cluster center. For the case of large data size and k value, the computational efficiency of the traditional algorithm is relatively low. The K-means algorithm is a highly practical clustering analysis algorithm and is also suitable for parallel execution. The K-means algorithm has obvious advantages when the processing data size is not large. However, with the increasing data size, the traditional K-means algorithm cannot effectively complete the clustering task in the big data environment. Even with the distributed computing framework, this shortcoming is difficult to avoid.
Distributed K-means clustering algorithm
If you carefully observe the process of the K-means algorithm, it is not difficult to find that K-means itself contains a distributed idea, the process begins with a data set and a set of random cluster centers, in each iteration process, assign each object to the cluster closest to it. Only in this way is the K-means algorithm executed by a single processor. The memory of the processor must contain the structure of all clusters, and the algorithm steps are repeated until the final cluster center is estimated. In a distributed environment, however, a number of processors (sites) are connected through a network to execute the K-means algorithm, that is, a data set is distributed on several sites in the network, and the processing of these sites affects each other. The key problem to be solved by the distributed K-means algorithm is the global center calculation, which is also the biggest difference from the centralized K-means. This article proposes a distributed K-means central algorithm for computing global centers. The implementation process of the improved distributed clustering algorithm will be described in detail below.
Process of distributed clustering algorithm
For convenience of description, first assume that the initial data distribution is absolutely random and independent. Each station Si
arbitrarily initializes one set of center vector
The calculation of the center is the most important feature of the distributed clustering algorithm. It is also the main difference between the distributed K-means algorithm and the centralized K-means algorithm, which can be expressed by the following mathematical formula. K-means is
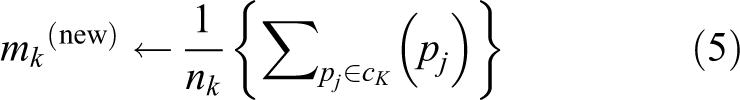
The central formula for distributed K-means is

The new central vector is distributed across all sites and operates in a broadcast manner. Each site Si
calculates the average through its own center and the centers received from other sites, and replaces the
Complex K-means algorithm complexity analysis
For any parallel and distributed clustering algorithm, there are two aspects of complexity, namely time complexity

Similarly, the complexity of calculating distances is

where

Due to the developed network, the time to establish a connection is negligible. Therefore, the complexity expression of the algorithm in this article can be written in the following form

The algorithm in this article is superior. The time complexity is not only
Data preprocessing
Data preprocessing is an indispensable part of any data mining project, especially for data preprocessing with noise, inconsistent records, and incomplete data to improve processing speed and quality of mining results. The main methods of data preprocessing are as follows: data integration is to aggregate data from different databases; data cleaning is to delete the duplicate records in the database, complete the missing records in the database, smooth the noisy data, and eliminate the outliers in the database; data reduction mainly consists of constructing data cubes to aggregate data, reducing the size of data by reducing the field value of data records and so on in order to reduce the scale of mining; and data conversion is to standardize data.
Experiments and discussion
Experimental objects and data sources
Campus network users have a variety of network behaviors, generally divided into two categories: access to the overall overview of the Internet and access to the specific content of the Internet. This article selects a college student as the research object and uses the distributed clustering algorithm to analyze the university students’ Internet access based on the premise of big data.
The data studied in this article are derived from the database of the school campus network authentication and accounting server. The university’s certified billing system is the city’s hotspot Drcom system. The data content of the system only includes the online time and offline time of the online user login, as well as related information such as continuous online time and traffic usage, and cannot analyze the specific content of the user accessing the Internet. Therefore, in the research of this article, the online behavior of campus network users refers to the online duration and traffic usage of campus users (including total traffic and download traffic), and we can infer whether users tend to be addicted to the Internet through the continuous time of surfing the Internet and the usage of traffic.
Experimental implementation
Experimental steps
The online behavior analysis process consists of five parts.
Figure 2 shows the entire experimental process, namely:
Data extraction. Select the authentication and accounting server data of a university campus network as the source data, and select according to the needs of the research and analysis according to the field attribute values.
Data conversion and loading. According to the data structure of the data warehouse set in the previous stage, each data record in the data source is converted and then stored in the data warehouse. The converted and aggregated data are stored in the target data warehouse through data loading.
Statistical analysis. This part is more important in the whole process. From the number of online lines, Internet traffic and download traffic, the time network segment and the traffic segment are used to analyze the campus network users, and some valuable features and rules are found out. Prepare for the next online behavior analysis.
Data analysis. This part occupies the core position in the whole process. Clustering algorithm can realize the characteristics of most users in the network with a few users’ models, which is beneficial to analyze the network profile and provide decision reference for network managers.
Analysis results. The results of online behavior analysis are summarized.

Online behavior analysis experiment flowchart.
Data selection
Since the extracted database of the university network authentication and accounting server is the data from June 2017 to the whole year of June 2018, each time the campus network user’s authentication is recorded in the database, the amount of data is quite large, and the amount of data stored is also millions of records, taking up too much memory space. Since the amount of data is too large, if all the extracted data are analyzed, the workload is increased, and the work difficulty is increased, so it is difficult to achieve in the specific research process, because the research value of the students’ use of the network during the summer and winter vacations is low, so combined with the actual situation and research environment, the final selection of this article is the recorded data in April 2018, the total number of records in April is 400,825.
Research tools
Combined with the specific online behavior analysis needs and actual conditions, the online behavior analysis tool used in this study is Microsoft SQL Server 2012 software. SQL is a structured query language. SQL Server 2012 provides new data types and uses language query integration to handle many different data types. The Master Data Services server component is added on top of the SQL Server 2008 architecture. The SQL Server 2012 component includes the database engine service (the core component for storing, processing, and protecting data), Reporting Services, Master Data Services, Analysis Services, and Integration Services.
Analysis of experimental results
Analysis of the distribution of online lines on users based on distributed clustering algorithm of big data
The selected university’s Internet IP address is uniformly planned and assigned by the school network management department, and all of them are dynamically obtained IP addresses. When the campus network user logs in for the first time, the media access control (MAC) address of the device is bound to the IP address. For users who access the Internet in the teaching building, the network IP address is uniformly assigned by the dynamic host configuration protocol (DHCP) server to obtain the IP address segment of the teaching building area; for users who access the Internet in the office building, the network IP address is also uniformly assigned by the DHCP server; for a few other accounts, a separate authentication policy is used, which is ignored here. The IP address segment of the office area is obtained. Students usually spend most of their time online in the dormitory. The student’s online account number is the student number. Some information of the students, such as department information and grade information, can be used to count the students’ online access through the online account and the Internet IP address. Here, the statistical analysis of the online status of each grade is made. The statistical analysis was carried out on the total number of online uploads, usage flow, and download traffic.
(1) Analysis of the distribution of Internet sites
In the context of big data, the distributed clustering algorithm is used to analyze the distribution of colleges and universities online. The results are shown in Table 1.
Network usage of major buildings.
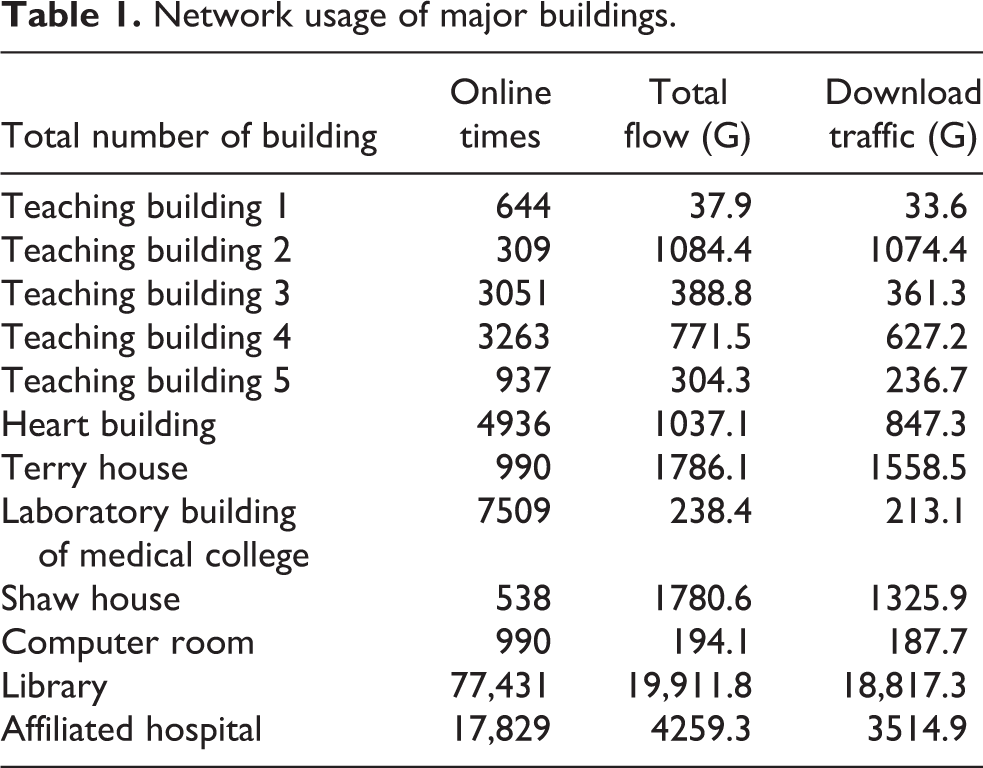
The data in Table 1 are plotted as a chart to make the data expression more intuitive. The result is shown in Figure 3.

Network usage of the main building.
It can be seen from Table 1 and Figure 3 that the library uses the most network resources, followed by affiliated hospitals, and the use of the network in office buildings, laboratories, and teaching buildings is relatively small, so in the specific optimization network, when resources and configuration load balancing, the results of the above statistics can be used as a reference.
(2) Analysis of network usage in each grade
In the context of big data, the distributed clustering algorithm is used to analyze the network usage of each grade in colleges and universities. The results are shown in Table 2 and Figure 4.
Uses network distribution for each grade.

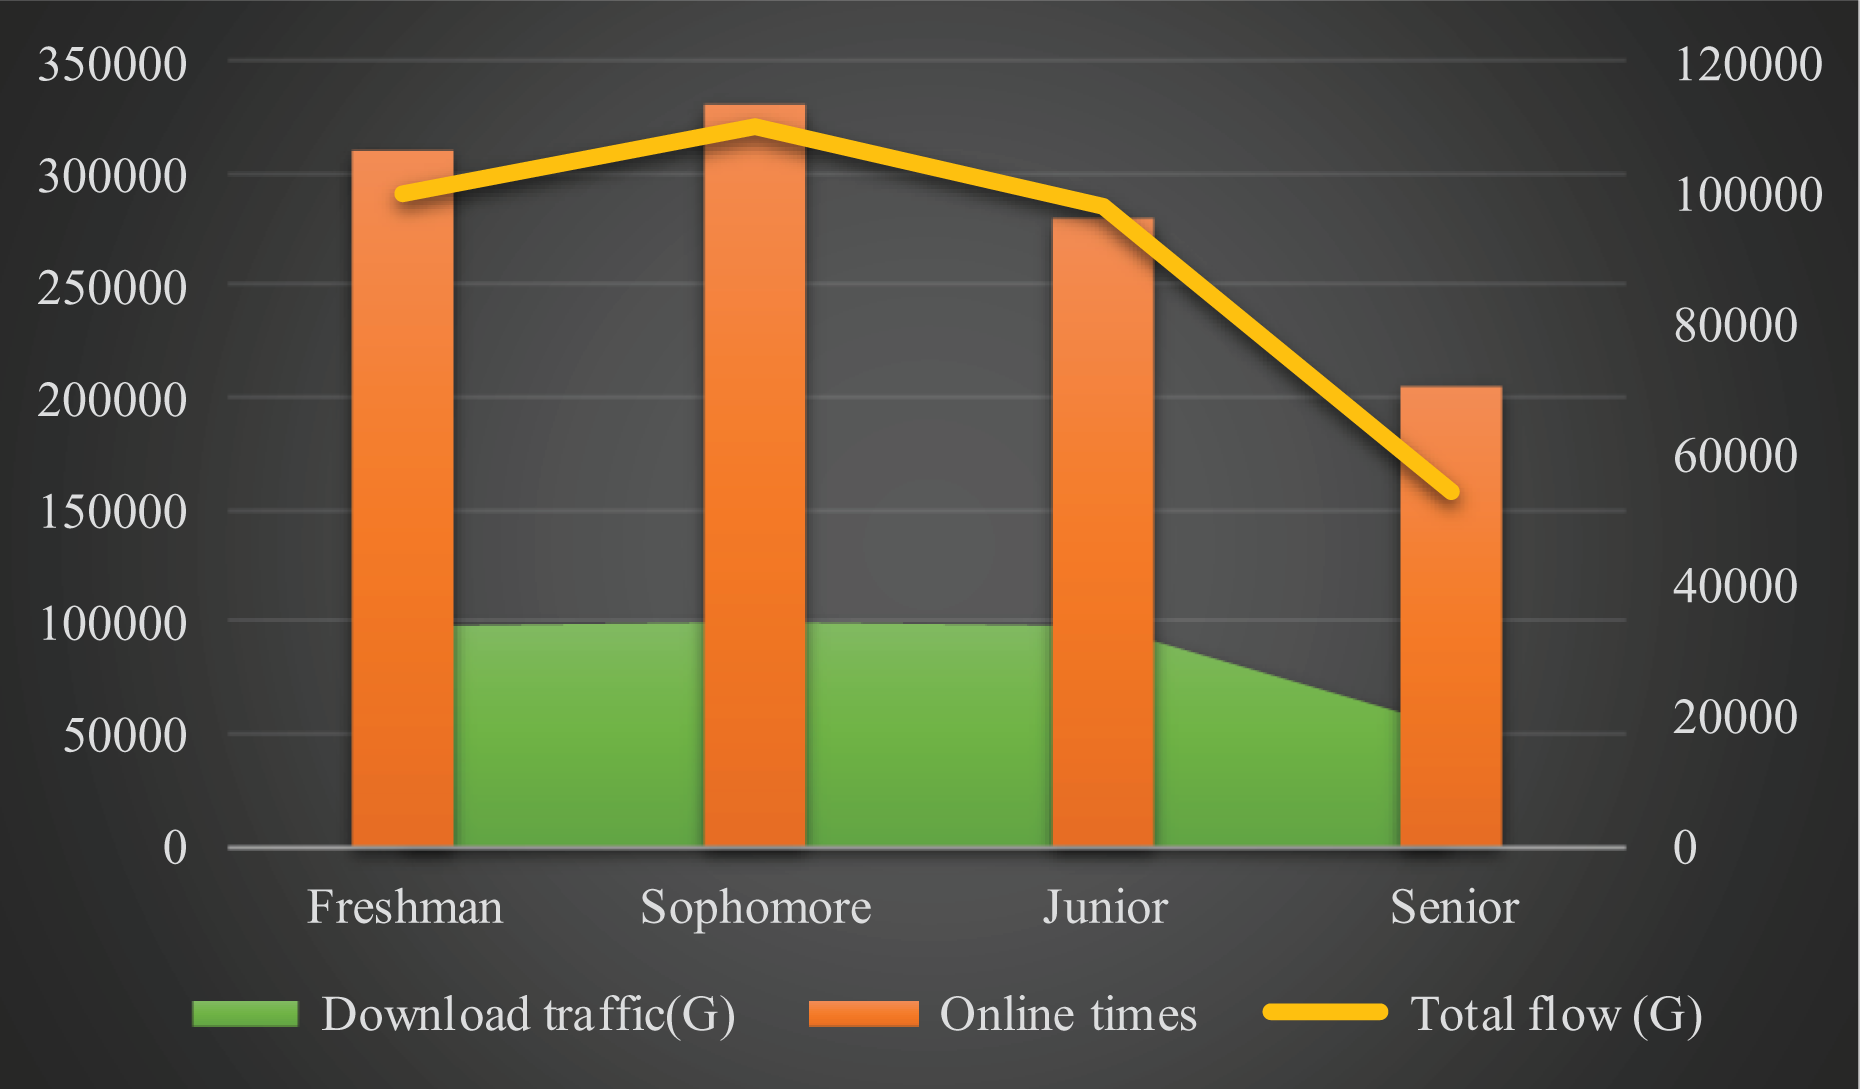
Network distribution map for each grade.
It can be observed from Table 2 and Figure 4 that the students in the lower grades use the most networks, especially the sophomores. The sophomore students use up to 330,000, which is more than doubled by 60.98%. In terms of time, sophomore users are relatively adequate, and economically, most of them have personal PCs, and the time spent online is naturally not small. Relatively speaking, the fourth-grade users use the least amount of network resources. Because the seniors are about to graduate, the students are faced with important tasks such as finding a job and further education. Therefore, there will not be a lot of time on the Internet.
Analysis of users’ online time based on distributed clustering algorithm based on big data
Based on the background of big data, the distributed clustering algorithm is used for statistical analysis of users’ online time. The statistics of student users are mainly in the dormitory Internet, while the statistics of office users are the Internet access of office buildings and administrative buildings. The statistical results are shown in Figure 5.

Online time distribution map.
As can be seen in Figure 5, most of the connection time between the student user and the office user is concentrated in the three hours, 1–2 h, 2–3 h; for a user with a connection duration of 1 min, the network is generally considered to be an unstable network. As a result of instability, it can be seen from the figure that there are still many occurrences in the student dormitory. We can optimize the configuration of the student apartment network for these results that may cause network instability, including creating multiple virtual local area networks (VLANs) to isolate the broadcast domain, configure the broadcast suppression ratio for each port of the switch, enable loop detection configuration for each port of the switch, enable DHCP snooping globally to prevent fake DHCP servers, and limit the rate of each switch port. Measures to reduce the impact on other network resources on the LAN. Configure the optimized trunk port of the switch to allow only the user’s VLAN and managed VLAN to pass. The remaining VLANs are not allowed to pass through the interface, including the default VLAN1. The interface of the network cable is not connected to prevent the user from connecting to the network cable to generate a network fault. The connection duration is from a minimum of 1 min to up to 8 h.
Analysis of daily network usage of users based on big data distributed clustering algorithm
Based on the big data background, a distributed clustering algorithm was used to statistically analyze the daily network situation of users in April, and compared with the actual results. The results are shown in Figure 6.

The distribution of the total number of online connections per day compared to the actual Internet.
It can be seen from Figure 6 that the use of a distributed clustering algorithm to calculate the daily network situation of users in April is about the same as the actual number of people in the network, and the difference is not large. In addition, it can be seen from the above figure that the daily number of users going online is not very different. Relatively, the number of online logins on weekends is slightly higher than during the class during the week. In particular, the total number of online users on April 1 was significantly higher than other dates. The specific feature is that the overall number of online logins is not much different, and there are more online users on weekends than during the week.
Conclusions
The arrival of the era of artificial intelligence provides people with a lot of convenience. The university system stores a large amount of data about student behaviors. Using robotic processing analysis technology to analyze user behaviors, students can use the data level to reflect students’ learning and guide schools To make the right decisions. In this article, artificial intelligence and big data technology are introduced into the campus network. The purpose is to mine the log of the campus network deep accounting and authentication system, analyze the behavior of the user, and know the students’ online situation, which is conducive to the school to formulate relevant policies. Robot technology brings great convenience to data processing.
In the context of robotics and big data, this article uses distributed clustering analysis algorithm to study the online behavior of a university campus network user. This article collects and records the original data of the campus internal network data, collects representative data from it, and analyzes the online behavior of users in the campus network more comprehensively and accurately, studies the online behavior of users, and realizes the user’s online behavior. Real-time forecasting of network traffic usage, online duration, and download traffic usage.
This study found that in colleges and universities, the location where users use the network more frequently is the library, and the frequency of the students in the lower grades is higher. The online time of the students is mostly concentrated within 1 h, 1–2 h, 2–3 h. During these three periods, the number of users surfing the Internet increased during the weekend, and most users use the network not for office but for entertainment. The research results of this study can provide reference value for colleges and universities to formulate relevant network management policies. By studying the user’s online behavior, you can understand the utilization rate of the campus network bandwidth resources and the distribution of the use of the network, to prevent students from indulging in the virtual network world, and to ensure that the network users can improve the online experience of the campus network while accessing the network resources reasonably. In order to provide a reference for network administrators to adjust network bandwidth and optimize the network, on the other hand, they can understand the interests of campus network users, and provide a basis for network management to optimize network behavior and formulate relevant policies.
Footnotes
Declaration of conflicting interest
The author(s) declared no potential conflicts of interest with respect to the research, authorship, and/or publication of this article.
Funding
The author(s) disclosed receipt of the following financial support for the research, authorship, and/or publication of this article: This work was supported by the 2018 “Thirteenth Five-Year Plan” Research Project of Education Science in Shaanxi Province, China: Research on the E-commerce Innovation and Entrepreneurship Practice Platform for College Students (Project no. SGH18H511).