
Abstract
The spatial information of the signal is neglected by the conventional frequency/time decompositions such as the fast Fourier transformation, principal component analysis, and independent component analysis. Framing of the data being as a three-way array indexed by channel, frequency, and time allows the application of parallel factor analysis, which is known as a unique multi-way decomposition. The parallel factor analysis was used to decompose the wavelet transformed ongoing diagnostic channel–frequency–time signal and each atom is trilinearly decomposed into spatial, spectral, and temporal signature. The time–frequency–space characteristics of the single-source fault signal was extracted from the multi-source dynamic feature recognition of mechanical nonlinear multi-failure mode and the corresponding relationship between the nonlinear variable, multi-fault mode, and multi-source fault features in time, frequency, and space was obtained. In this article, a new method for the multi-fault condition monitoring of slurry pump based on parallel factor analysis and continuous wavelet transform was developed to meet the requirements of automatic monitoring and fault diagnosis of industrial process production lines. The multi-scale parallel factorization theory was studied and a three-dimensional time–frequency–space model reconstruction algorithm for multi-source feature factors that improves the accuracy of mechanical fault detection and intelligent levels was proposed.
Introduction
Robotic system prediction and fault diagnosis integrate the latest achievements in the fields of machinery, electronics, computers, sensors, automatic control, artificial intelligence, and so on and are increasingly replacing operators to complete dangerous, frequent, and repetitive long-term work. With the complexity and diversification of the process industry structure, its maintenance costs are higher than other mechanical equipment, which places higher requirements on the ability of maintenance operators. The remote monitoring and fault diagnosis technology of industrial robots can provide reliable information for the daily maintenance and fault diagnosis of industrial production. The system architecture is divided into several sub-modules: remote monitoring system, signal acquisition, processing and fusion system, fault diagnosis system and so on. Centrifugal pump (CP) vibration measurement was generally used in the quality control and condition monitoring. It is significant to detect and diagnose the vibration and process quantity parameters of the CP to avoid accidents. 1 –4 The hydraulic and mechanical vibrations of CP are caused by flow distribution and the high-speed interaction between the impellers and the volutes, especially when the impeller is rotating in the tongue area of the volute. The fault characteristic signals are hidden in complex signals and cannot be effectively achieved by the simple spectrum diagnosis due to the many causes of vibration, different transmission paths, and the external noise. Various diagnostic methods, which were focused on the early warning time of failures, were used to extract the valid information from the original vibration signals and improve the accuracy of diagnosis. 5 –8 Bordoloi and Tiwari 9 reported that the average classification accuracy was 56% at low CP speeds and only 10% of the light suction limit could be identified at lower CP speeds. The method of the fast Fourier transformation was used by Zargar 10 to analyze the vibration signals about the pump in time and frequency domain in the robotic condition monitoring system and found the cavitation phenomenon in the pump. The analysis of the acoustic signal was carried out to predict cavitation in the pump under different operating conditions. 11 The vibration signal is characteristic of an obvious frequency shift when the mechanical equipment is subjected to unsteady excitation in the process industrial production line. The fault feature signal flows at each vibration collection point with the various nonlinear failure mode, thus resulting in fuzzy, uncertain, and incomplete 2-D time–frequency characteristics of the extracted signal. What’s more, the method of single-channel signal extracting 2-D time–frequency feature such wavelet theory cannot reflect the intrinsic relationship of nonlinear changes between multi-source channel feature signals and eliminate information interference.
The acquisition, processing, fusion, and diagnosis of live signals of industrial equipment are basis for industrial intelligent monitoring and fault diagnosis. The signals obtained from the on-site multi-sensors cannot be directly used to evaluate, diagnose, and predict the operating status of industrial production, because the large amount of data of multi-sensor signals may have redundancy and contradictions for the information to make it difficult to directly analyze and apply. The parallel factor analysis (PARAFAC) decomposition method is based on the “parallel proportional distribution” principle proposed by Cattell in 1944. The term “PARAFAC” was then proposed by Harshman and applied to psychology and was named “canonical decomposition” by Carroll and Chang. 12,13 Presently, the PARAFAC decomposition method is generally referred to the canonical decomposition) is a low-order decomposition technique for tensor (CANDECOMP/PARAFAC) model. With the rapid advancement of computer technology, the parallel factor model is fitted by trilinear alternating least square (TALS), which greatly improves the running time and convergence accuracy of the signal processing algorithm. Generally, the decomposition of the matrix only yields the principal component decomposition of the mathematically multiplied matrix, however, the PARAFAC decomposition provides the sum of the three components of the physical sense. In PARAFAC, the data of three-way arrays are decomposed as a sum of components (corresponding to the “atoms”), each of which is the trilinear product of one score vector and two loading vectors (corresponding to the “signatures”). The important advantages by the PARAFAC compared with principal component analysis (PCA) or independent component analysis are that the decomposition of multi-way data is unique even without additional orthogonality or independence constraints and PARAFAC can be employed for a space/frequency/time atomic decomposition of the fault signal, which is based on the fact that multichannel evolutionary spectra are multi-way arrays indexed by time, frequency, and space. The inherent uniqueness of the PARAFAC solution makes a time/frequency/topographic decomposition with the minimum priori assumptions. This model has no ambiguity as the obtained model parameters, so it is widely used in the fields of environmental science and resource utilization, clinical medicine, communication, and signal processing. In fault diagnosis, the PARAFAC technology was applied for the underdetermined blind separation of weak fault signals in the gearbox. 14 Besides, a fault feature detection algorithm based on PARAFAC was proposed in the concurrent engine bearing failures. 15 Firstly, the PARAFAC model is used to obtain the vibration source path response function and the virtual sensor signal and the original sensor signal are used to form a new observation signal. Then, the source signals that reflect the fault characteristics are accurately estimated by the PARAFAC algorithm. The PARAFAC and PCA can be combined for the estimation of engine bearing concurrency fault source numbers. 16 The hidden information from the connection between signals can be extracted by the multidimensional data decomposition combining information with time, energy distribution, space, and so on. Morteza Bahram and Rasmus Bro presents a novel strategy for solving matrix effects using the second-order advantage and a new method called parallel profiles with Linear Dependencies (PARALIND). 17 This model is used to solve multiuser detection problem for asynchronous code division multiple access (CDMA) signals in multipath channels. 18,19 Based on the theory of compressed sensing, a joint estimation of the angle and Doppler shift of a single-base multiple-input multiple-output (MIMO) radar based on the parallel analysis of compressed sensing was proposed. 20 In environmental monitoring, 3-D excitation-emission matrix fluorescence spectroscopy and PARAFAC was used to monitor organic pollution in swimming pools by Seredyńska et al. 21 One hundred fifty-nine values given by gas phase chromatography and 9 sensory evaluations given by experts were obtained in the reaction of 11 amino acids and 6 reducing sugars. 22 For the two 3-D data arrays, the effects of various amino acids and sugars were analyzed by Tucker3 and PARAFAC methods, and the results of the two methods were compared. The Italian traditional food ABTM was analyzed by taking 6 different fermentation time products from 7 manufacturers and giving 16 evaluation indicators by 8 professional tasters. 23
Wald introduced the basic flow of a sequential probability ratio test (SPRT) algorithm for solving hypothesis testing problems. Assuming null hypothesis and surrogate hypothesis, the results of the SPRT satisfy one of the following three conditions: (1) accept the null hypothesis; (2) reject the null hypothesis; (3) continue sampling and testing until the condition (1) or until (2), the sequence detection program will stop. In Wald’s work, samples are not analyzed until all samples have been collected and a decision is made. Test analysis was immediately performed by the SPRT method after a sample was collected and the test was stopped to make a decision once the threshold was reached. The optimality of the SPRT was also demonstrated in Wald’s work. The least size of average sample was required in the SPRT when other test conditions are the same. 24 However, the application of SPRT in fault diagnosis is still a relatively new research direction. Kalman filter and SPRT algorithm were used by Wei et al. to detect the soft fault of aeroengine system sensors. 25 A new method for setting two constraint thresholds in a SPRT based on the cumulative curve and the expected stop time was proposed by Liu et al. The decision time for each category, which we call the balanced threshold SPRT, was balanced. 26 Parras and Zazo studied the statistical performance of the SPRT chart to monitor the dispersion of the normal distribution process. 27 A new method was proposed for monitoring multiple fault states of slurry pumps based on PCA and SPRT. 28 Based on the sequential hypothesis test, Chen et al. proposed a new fault state recognition method, in which the existing data was used in the recognition system to adaptively and intelligently query the propagation channel. 29 In the vehicle’s reversing system failure, Abdel-Hafez proposed a sequential fault detection and identification algorithm, in which the assumptions were defined and a fixed error rate was set to identify the failure by calculating the probability distribution of signals collected from the reversing system. 30
Dual-channel signal feature extraction methods such as holographic spectrum and global vector spectrum, by which each channel signal is analyzed independently, are used for the axis motion of the rotating machinery to establish signal frequency, amplitude, cross-section frequency, or cross-sectional phase. The multi-source signal cannot be separated into a single signal to independently extract the 2-D time–frequency features. Multi-fault mode multi-source dynamic feature extraction is a multi-scale parallel factorization of multi-source signal matrix including process state variables, vibration signals, and so on. 31 –34 The nonlinear time–frequency fault feature information of the single-source signal can be extracted and the fusion of the multi-source feature signals is completed at the same time. The optimization of the nonlinear relationship between process state variables, failure modes, and multi-source vibration signatures in time, frequency, and spatial feature vector space after feature extraction is ensured by the parallel factorization theory. 35 Remote fault diagnosis is an advanced diagnostic method for implementing industrial robot fault diagnosis. It does not require workers to visit the site to diagnose industrial robots. This will greatly improve the efficiency of industrial robot fault diagnosis and help reduce the cost of industrial robot fault diagnosis.
Parallel factorization model
Any element can be represented as

In equation (1),

Parallel factor model.
Define three 2-D matrices

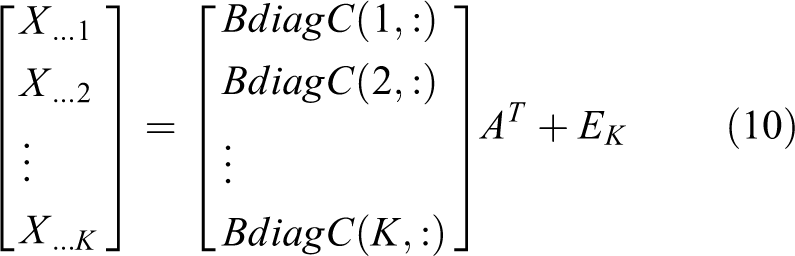
The A, B, and C are the three loading matrices of the parallel factor model. The scalar form of the PARAFAC model can be expressed as equation (2), marking

Equation (2) shows that the elements in the 3-D matrix X can also be expressed as the sum of the products of the R elements. Because
The process of matrix low-rank decomposition can be extended to the cases of higher dimensionality. An N-dimensional matrix

where

There are N independent degrees of freedom, which can also be called N “modes,” in the elements of the N-dimensional matrix. This article mainly discusses abstract and complex 3-D matrices as high-dimensional matrix forms.
The uniqueness of parallel factorization
The fundamental difference between PARAFAC model decomposition and principal component analysis (PCA) is that PARAFAC decomposition is unique while PCA decomposition is multiple. Under the premise of column ambiguity and scale ambiguity, the loading matrix A, B, C through the 3-D matrix X can be uniquely obtained. The uniqueness theorem of PARAFAC model decomposition was first proposed by Kruskal. The uniqueness theorem of PARAFAC model in real case lays the foundation for the application of PARAFAC model in signal processing. Then Sidiropoulos confirmed the uniqueness theorem of the PARAFAC model in the complex domain. And Kruskal proposed the concept of matrix k-rank in the PARAFAC model.
The ith sub-matrix matrix of the X-axis of the PARAFAC model can be obtained through the PARAFAC uniqueness theorem

where

then matrices A, B, and C are unique under the condition of scale ambiguity and column ambiguity. If there exists a matrix group

then the relationship between

where ∏ is a column fuzzy matrix.
Trilinear alternating least square
A lot of algorithms for solving the PARAFAC model have studied by previous scholars. 37 This article mainly describes the TALS algorithm, which is an important method for data detection of trilinear models. In TALS, a matrix is firstly updated through each step, and then the least squares (LS) is used to update the remaining matrices according to the results of the previous estimation; finally, the other matrices are updated. All of the above steps are repeated until the algorithm is converged. It can be known that the TALS algorithm is globally monotonically convergent.
Assuming a 3-D data set X of I × J × K, the trilinear model has the following form in the equation (9)

where F is the number of factors, 1. Calculation of matrix A
where

where
2. Calculation of matrix B

where

3. Calculation of matrix C

where

4. The matrix is updated by looping steps (1)–(3) until the algorithm is converged.
Multidimensional feature extraction and reconstruction of nonlinear signals
It is easy to extend factor analysis algebra from 2-D to 3-D by the parallel factor trilinear model. The form is as follows

where Xij is the data of row i, column j of matrix X. “ai l fj 1,…, airfjr ,…, aiRfiR ” represents the contribution factor of the observed value. “eij ” is the residual value and its properties depends on whether it fits the principal component or the common factor model. The parameters air and fjr , which have different standardized rules and evaluation methods, represent loading factors and component factors, respectively. In general, the two sets of factors play the same role as representing a specific layer of factor influence and importance values in a particular pattern of data. The two sets of parameters affect the variable, proportionally reducing or increasing the contribution of the factor from one layer of the specific pattern to the next. If a set of parameter modes C is added, the model is trilinear. A multi-linear module is obtained if other additional modes are added. The trilinear model is defined as

If the influence variables of each factor in the three patterns of data have different rules from other factors, one load factor of the data matrix subset increases or decreases in proportion to the other factor, which is known as the uniqueness principle of the parallel factor model. The study of the uniqueness of trilinear decomposition is a continuous research hotspot. Uniqueness is the determination of the direction of the vector axis of the most scientifically significant factor in a certain factor space. This principle provides a method to determine the direction of the unique axis, which is looking for a subset of the data matrix in a certain factor space along a set of consecutive directions stretching or contracting proportionally. The reliability of the factor vector axis direction should be further tested by other methods. The best direction of the factor vector axis is to optimize the three-linear factor model to fit 3-D data.
In this section, the multi-scale parallel factorization theoretical algorithm is introduced. The “load” factor and “component” factor of the parallel factorization are defined, and the most scientific factor vector axis selection method and standard in the specific factor vector space are analyzed. A multi-scale parallel factorization optimization algorithm for extracting nonlinear single-source fault feature signals is established by combining multi-scale analysis theory. The accuracy of time–frequency space 3-D feature analysis of nonlinear feature signals was improved by the multi-scale analysis theory so that the feature factor signals are successfully obtained from matrix factors. The data matrix

The model of multi-scale parallel factor (PARAFAC) decomposition. PARAFAC: parallel factor analysis.

The key issue of the model is to find the matrix A, B, and C with the elements of
The multi-scale parallel factorization algorithm is presented as follows: Decompose multi-scale time–frequency. Determine the number of factors F. Initialize load matrix B and C. Load matrices B and C to estimate A by the least-squares regression algorithm, that is Similarly, estimate B and C. Calculate continuously from step (3) until convergence


Slurry pump fault diagnosis experimental equipment and signal acquisition system
The slurry pump fault diagnosis experimental system as shown in Figure 3 is designed to simulate the mechanical multi-source nonlinear fault state in the process industrial process and verify the multi-scale parallel factorization algorithm proposed in this article. Figure 3(a) displays the slurry pump fault diagnosis experimental equipment system and Figure 3(b) demonstrates the vibration signal acquisition system and sound collection system. The power system is a motor including a frequency converter and a transmission control device. The impeller of slurry pump of different fault types and wear degrees are selected to simulate the working state of the actual mud pump. The speed of the mud pump is controlled by motors with different speeds (1200 r/min, 1400 r/min, 1600 r/min,…, 2800 r/min). The signal acquisition system are installed in different positions of the mud pump system and the pipelines are used to simultaneously acquire real-time signal data through the sensors including pressure, speed, vibration, flow signal, density signal, pipeline temperature signal, and so on. A sound signal acquisition system, by which the sound signal of the sediment pump providing the required data for fault diagnosis was obtained, was installed at the mud pump. In the sand and water addition control system, the flow and pressure of the process loop can be controlled to form a nonlinear multi-fault mode, simulating the nonlinear operating state of the mechanical process of the process industrial process. Ethylene glycol as a medium cooling system and steam heating system are used to control the temperature in experimental pipelines for the medium of sediment.

Experiment system of slurry pump. (a) Experimental equipment system. (b) Signal acquisition system.
Figure 3(b) illustrates the panoramic view of the vibration signal acquisition and the sound collection system. The system contains the acoustic signal acquisition subsystem, the vibration signal acquisition subsystem, the system operation switch, and so on. The multichannel signals were acquired, multi-source signals were collected and the intrinsic mechanism of interaction between fluid flow and vibration response under nonlinear working conditions were analyzed simultaneously by the sediment pump experimental system. Then the signal of pipeline pressure, pipeline flow, motor rated power, motor speed, pump inlet and outlet pressure, and corresponding spectrum in the nonlinear mode of the process industrial process were collected. The experiment was controlled for the nonlinear operation state of the mechanical system by adjusting the flow and pressure of the process loop to form a nonlinear multi-fault mode in the process of adding water. The relevant vibration, sound, pressure, and other test data were collected under different working conditions of the motor speed for the different failure modes and wear degree failures of each type of mud pump. There are four different modes of impeller in Figure 4, normal impeller, impeller with damaged edges, impeller perforation, and damaged impeller blade. Figure 5 shows the vibration signal, flow signal, CP inlet and outlet pressure signal acquisition system.

Impellers in four different modes. (a) Normal impeller. (b) Impeller with damaged edges. (c) Impeller perforation. (d) Damaged impeller blade.

(a) Vibration signal, (b) flow signal, (c) CP inlet and outlet pressure signal acquisition system. CP: centrifugal pump.
Slurry pump fault test system setup and experimental design
Figure 6 shows a schematic diagram of the slurry pump fault diagnosis test loop system. It contained slurry pumps, motors, conveyor belts, sand troughs, glycol cooling tanks, pressure control tanks, pressure gauges, densitometers, flow meters, ball valves, data acquisition systems, piping and sampling ports, control instruments, and other equipment. The impellers with different fault modes and different damage were selected. The signal data of rotational speed, flow rate, mud density, and the pump inlet and outlet pressure of mud pump are collected during the test.

Schematic diagram of slurry pump fault diagnosis test system.
The flow chart of the slurry pump fault diagnosis test system is depicted in Figure 7. The direction of the arrow is the flow direction. The serial numbers 1-mud pump, 2-motor, 3-inverter, 4-power meter sensor, 5-accelerometer, 6-pressure sensor, 7-flow meter, 8-hole plate, 9-heat exchanger, 10-cooler, 11-temperature sensor, 12-sand, 13-suction pressure control tank, and 14-suction pressure sensor were listed. The microphone represented the sound collector and the process water was municipal water. Ethylene glycol was used as the medium for the cooler and steam was used as the heat exchanger medium. For the success of test loop piping design, heat exchanger/cooling system design, and safety and environmental risk assessment should be considered if a complete mud pump fault diagnosis experiment was set up. In this article, the slurry pump fault diagnosis test system was mainly focused.

Flow chart of the mud pump fault diagnosis test system.
In the experiment, the engineering calculations were firstly performed, and then the system was designed, installed, tested, and debugged. The main equipment included mud pumps, data acquisition systems, sensors, and laptops for vibration data acquisition, as well as other equipment such as pipes, tanks, valves, meters, drive motors, sealed pumps, and control instruments. A detailed description of the main components of the system was described in the following paragraph. Slurry pump: The Weir/Warman 3/2 CAH slurry pump with impeller C2147 (8.4″) was installed. The inlet and outlet diameters were 3″ and 2″, respectively. It is a 40 HP pump with radial split casing, 2-piece bushing, gland packing shaft seal, closed impeller design, and maximum pump shell pressure of 300 psi. The C55 (Ferralium) liners and impellers instead of the standard A05 (high chrome white iron) material were chosen for easy creation of damages on these components. The NPSH of the device is 11 m. A V-belt drive transmission with a speed increase ratio of 13/6 was supplied. The installation, operation, and associated maintenance manual for the Weir/Warman 3/2 CAH slurry pump were given by Weir Slurry Group. Drive motor: The drive motor of model HIS364SR06U3P, in which a fully enclosed and compact frequency converter was included, was supplied by HYUNDAI with three-phase motor. The voltage is 230/460 V with a horsepower of 40 HP, a torque of 177.2 LB-FT, and a maximum speed of 1200 r/min. The safety factor of the motor is 1.15 and the ambient temperature limit (maximum) is 40°C. Data acquisition system: The data acquisition system, collecting and measuring electrical signals through sensors or other instruments, is a combination of PC-based measurement hardware and software. The NI Lab View 7.0 was chosen as it is easy to create a set of large tools and objects with the help of a measurement interface. The hardware is provided by NI DAQ due to its high compatibility with our software applications. Modules are selected according to the specifications of the instrument. For example, the selected four-channel integrated circuit piezoelectric (ICP) accelerometer module provides a 20 kHz low-pass filter for each channel to match the range of the accelerometer. Laptop computers: The Dell Inspiron 9200 laptop is used to collect data signals, and a separate laptop is used to acquire acoustic data. Control panel: A control panel with the features of automatic and manual safety shutdown was designed to control the operation of the system. It was also used to monitor flow rate, pump speed, pump horsepower, inlet and outlet temperatures, and pressures of pump. Accelerometer: Since the vibration signals in three directions at the same time should be collected, a three-axis accelerometer is preferred. Accelerometers with shorter range and higher sensitivity were selected in view of the vibrations with relatively low amplitudes in the monitoring system. Two three-axis ICP accelerometers were selected with a sensitivity of 100 mV/g and a frequency range of 2–5 kHz. One triaxial ICP accelerometer with a sensitivity of 1000 mV/g and a frequency range of 0.5–3 kHz was also selected. Pressure sensor and thermocouple thermometer: Two PCB dynamic piezo sensors, which are located in the suction and discharge respectively, were used with a maximum range of 1000 psi, a sensitivity of 5 mv/psi, and a resolution of 0.01 psi. The Omega CO1-E-20 thermocouple thermometer with the range of −195°C to 260°C was used to monitor the temperature of the pipe medium during the experiment. Other components and instruments: Other components include sealed water pumps, inlet pressure control boxes, water level indicators, sandboxes, safety rupture disks, various valves, pipes, and glycol cooling boxes.
Parallel factorization through decomposing CP diagnostic signal into space–time–frequency components
The multi-scale PARAFAC algorithm is used to perform channel/frequency/time factor decomposition on the multi-source signal matrix, which was decomposed into a series of different components or modes. In the signal time–frequency analysis, spatial information was introduced to form a 3-D feature analysis of space/time/frequency for each factor. The topographic map, frequency spectrum, and time profile of the fault feature factor were extracted based on the multi-source feature factor decomposition path to maintain correspondence and overall consistency. At the same time, the spatial signal, frequency spectrum signal, time domain signal, and 3-D fault feature expression of the fault feature factor are generated and the nonlinear multidimensional dynamic fault feature is successfully extracted. This article presents a multi-scale parallel factorization method for multi-source characteristic signal extraction in nonlinear fault modes. The mutual relationship of the optimal decomposition paths of the characteristic factors of multi-source signals is analyzed, and the optimal optimized nonlinear correspondences of nonlinear state variables, failure modes, and characteristic signals in time, frequency, and space are established. Based on the correspondence and overall consistency of multi-source feature factor decomposition paths, this article reconstructs a 3-D fault feature model of fault feature factor spectrum, time profile, and spatial information. Finally, the nonlinear multidimensional dynamic fault characteristic signals were successfully extracted and the law of motion of nonlinear fault mode characteristics in multi-source signals was revealed.
Single-source dynamic feature extraction of CP in fault diagnosis
The multi-scale parallel factorization algorithm was applied to analyze the single-channel vibration signal and the distribution of the dynamic characteristic signal in a direction of the mechanical structure was explored, which provides a basis for revealing the multi-dynamic dynamic mechanism. Figure 8 shows the vibration signal multi-scale parallel factor decomposition. The original vibration signal is decomposed by multi-scale wavelet to obtain the 3-D time–frequency signal. The amplitude loading factor, time loading factor, and frequency loading factor are obtained after multilayer decomposition by parallel factorization. The frequency loading factor is effective and the fault identification can be successfully implemented due to the significant difference between the decomposition results of the normal state and those of the fault state in the frequency loading factor component.
Multi-scale parallel factorization of vibration signals: (a) normal state (left) and (b) fault state (right).
Multi-source dynamic feature extraction of CP in fault diagnosis
Multi-source fault signals of CP are characteristic of coupling, aliasing, and other phenomena. The vector analysis, space geometry, optimization theory, noise reduction principle, and error theory were used based on the matrix signal analysis theory, and the multi-source signal matrix was used to decompose fault characteristic factors. The independent characteristics of each channel on the surface of the mechanical structure were found and the mutual interference and overlap of the characteristic signals between the channels were eliminated by the optimization of the path of the decomposition process.
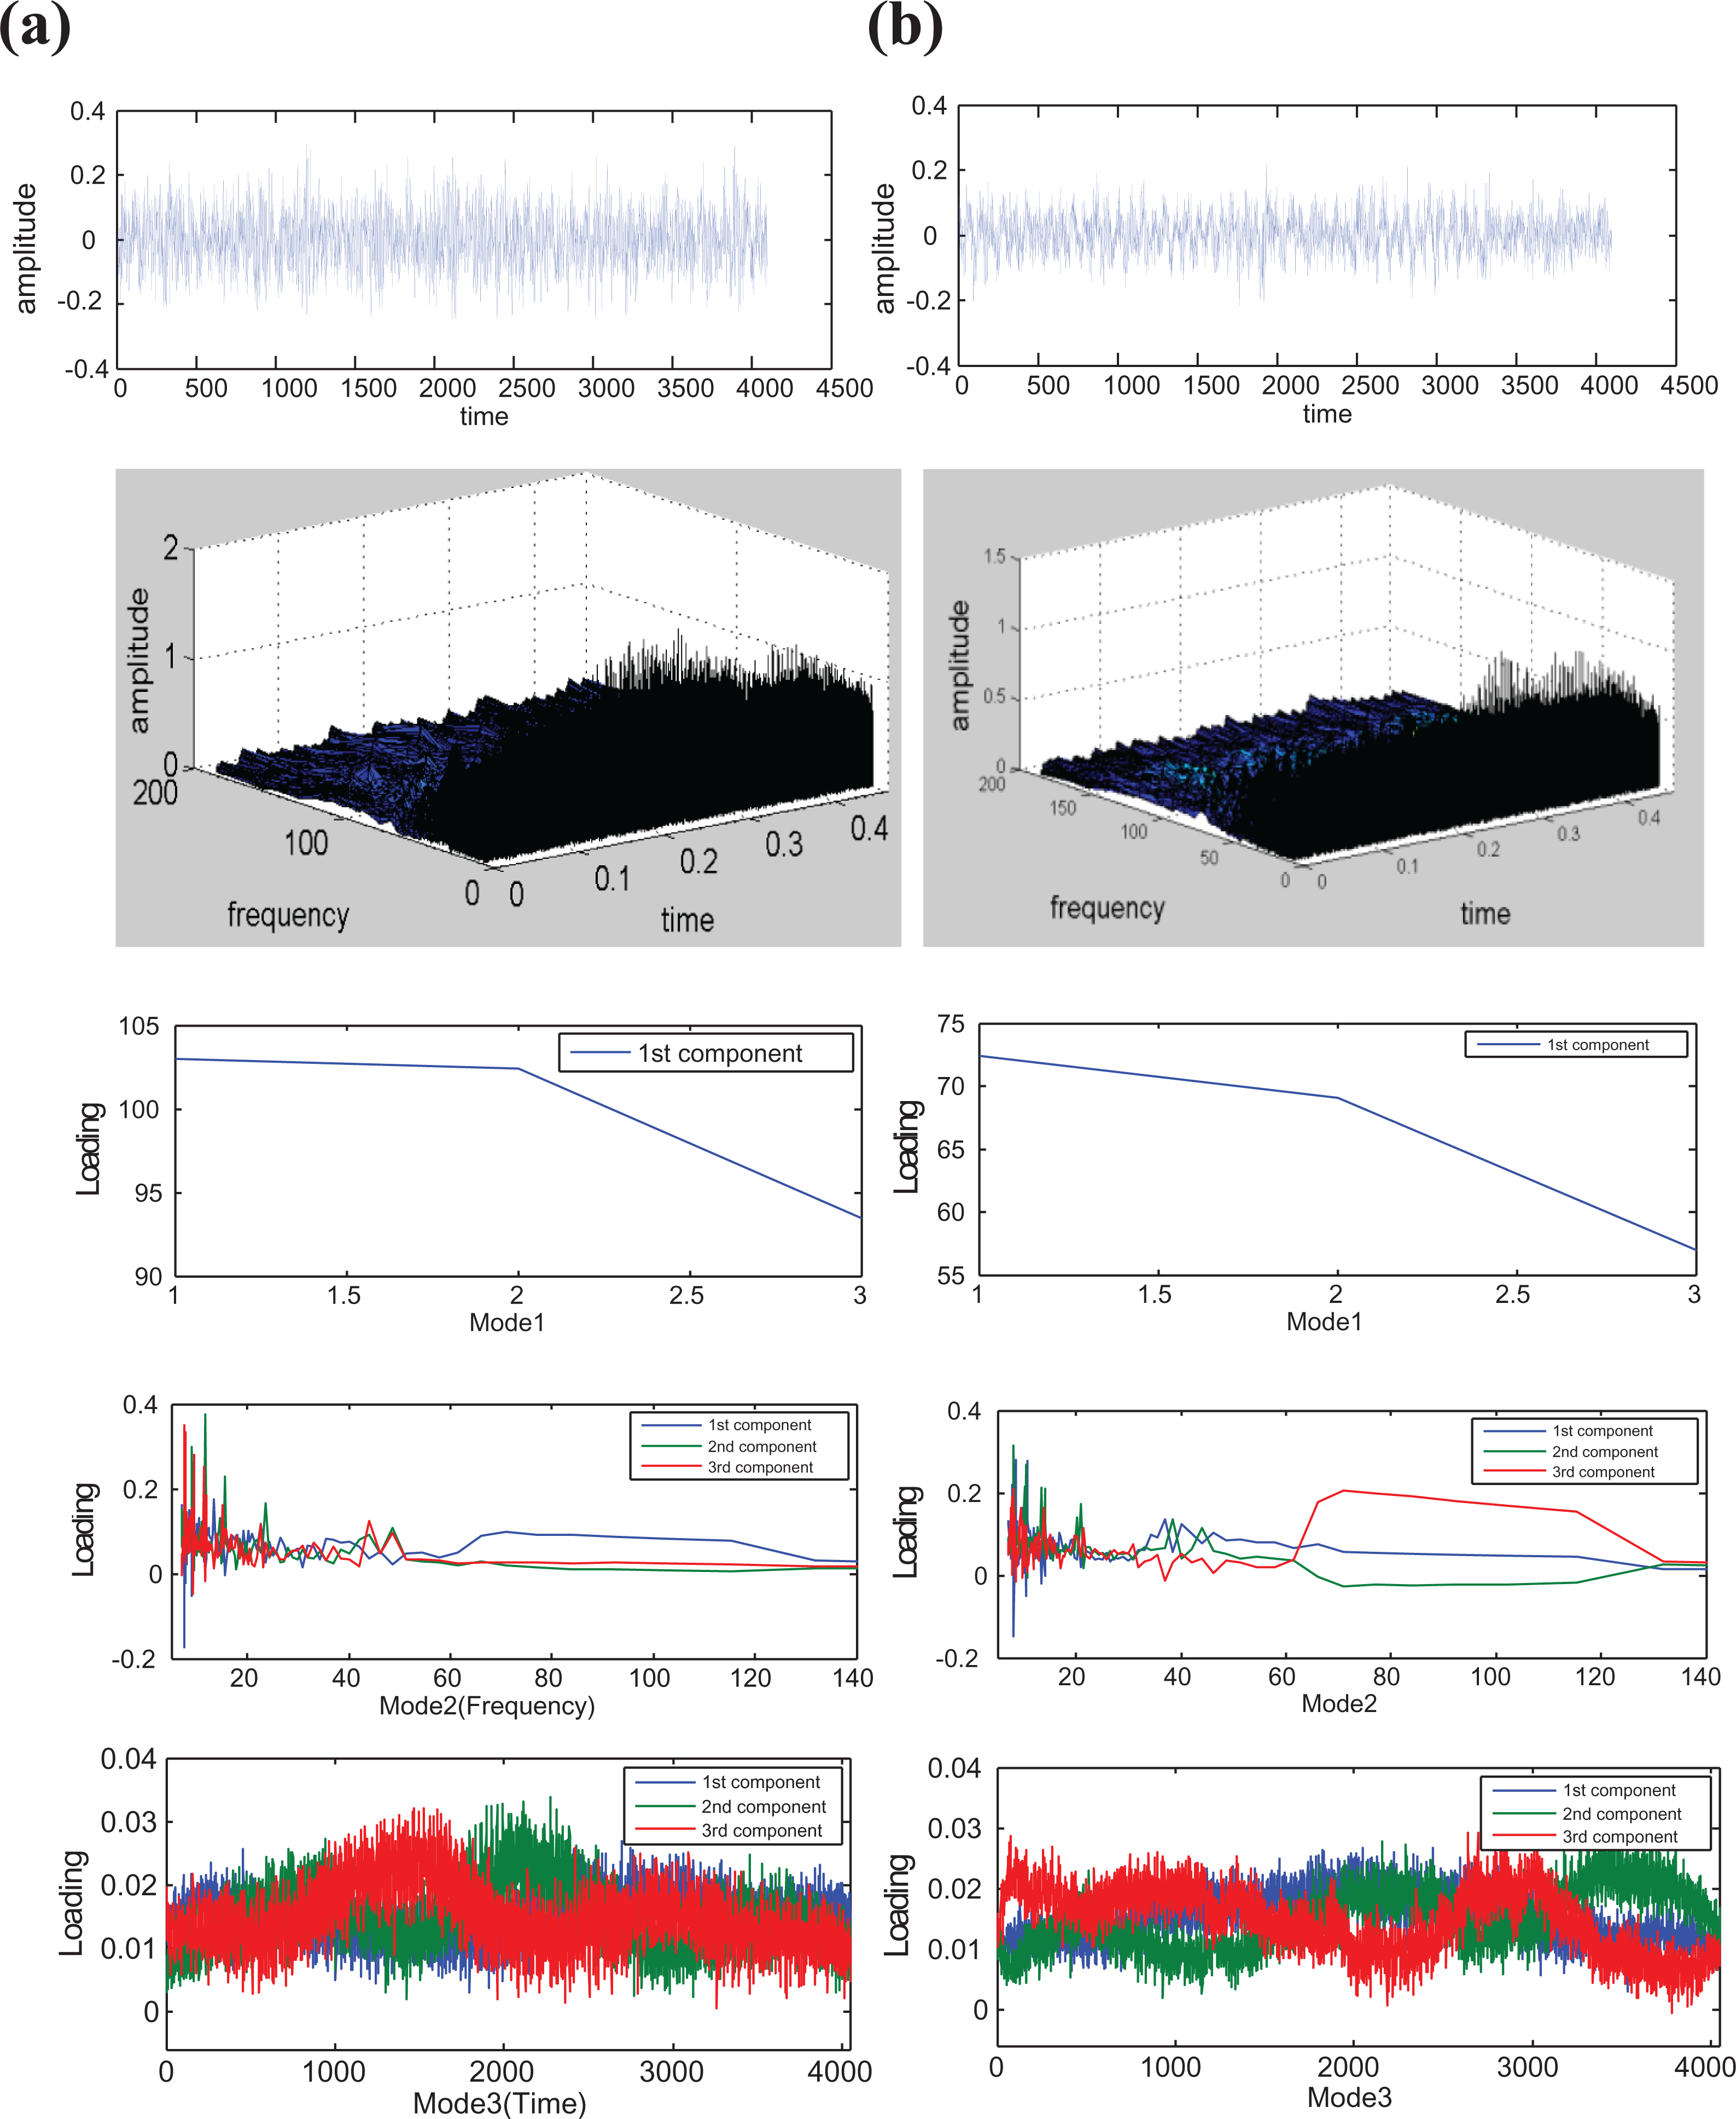
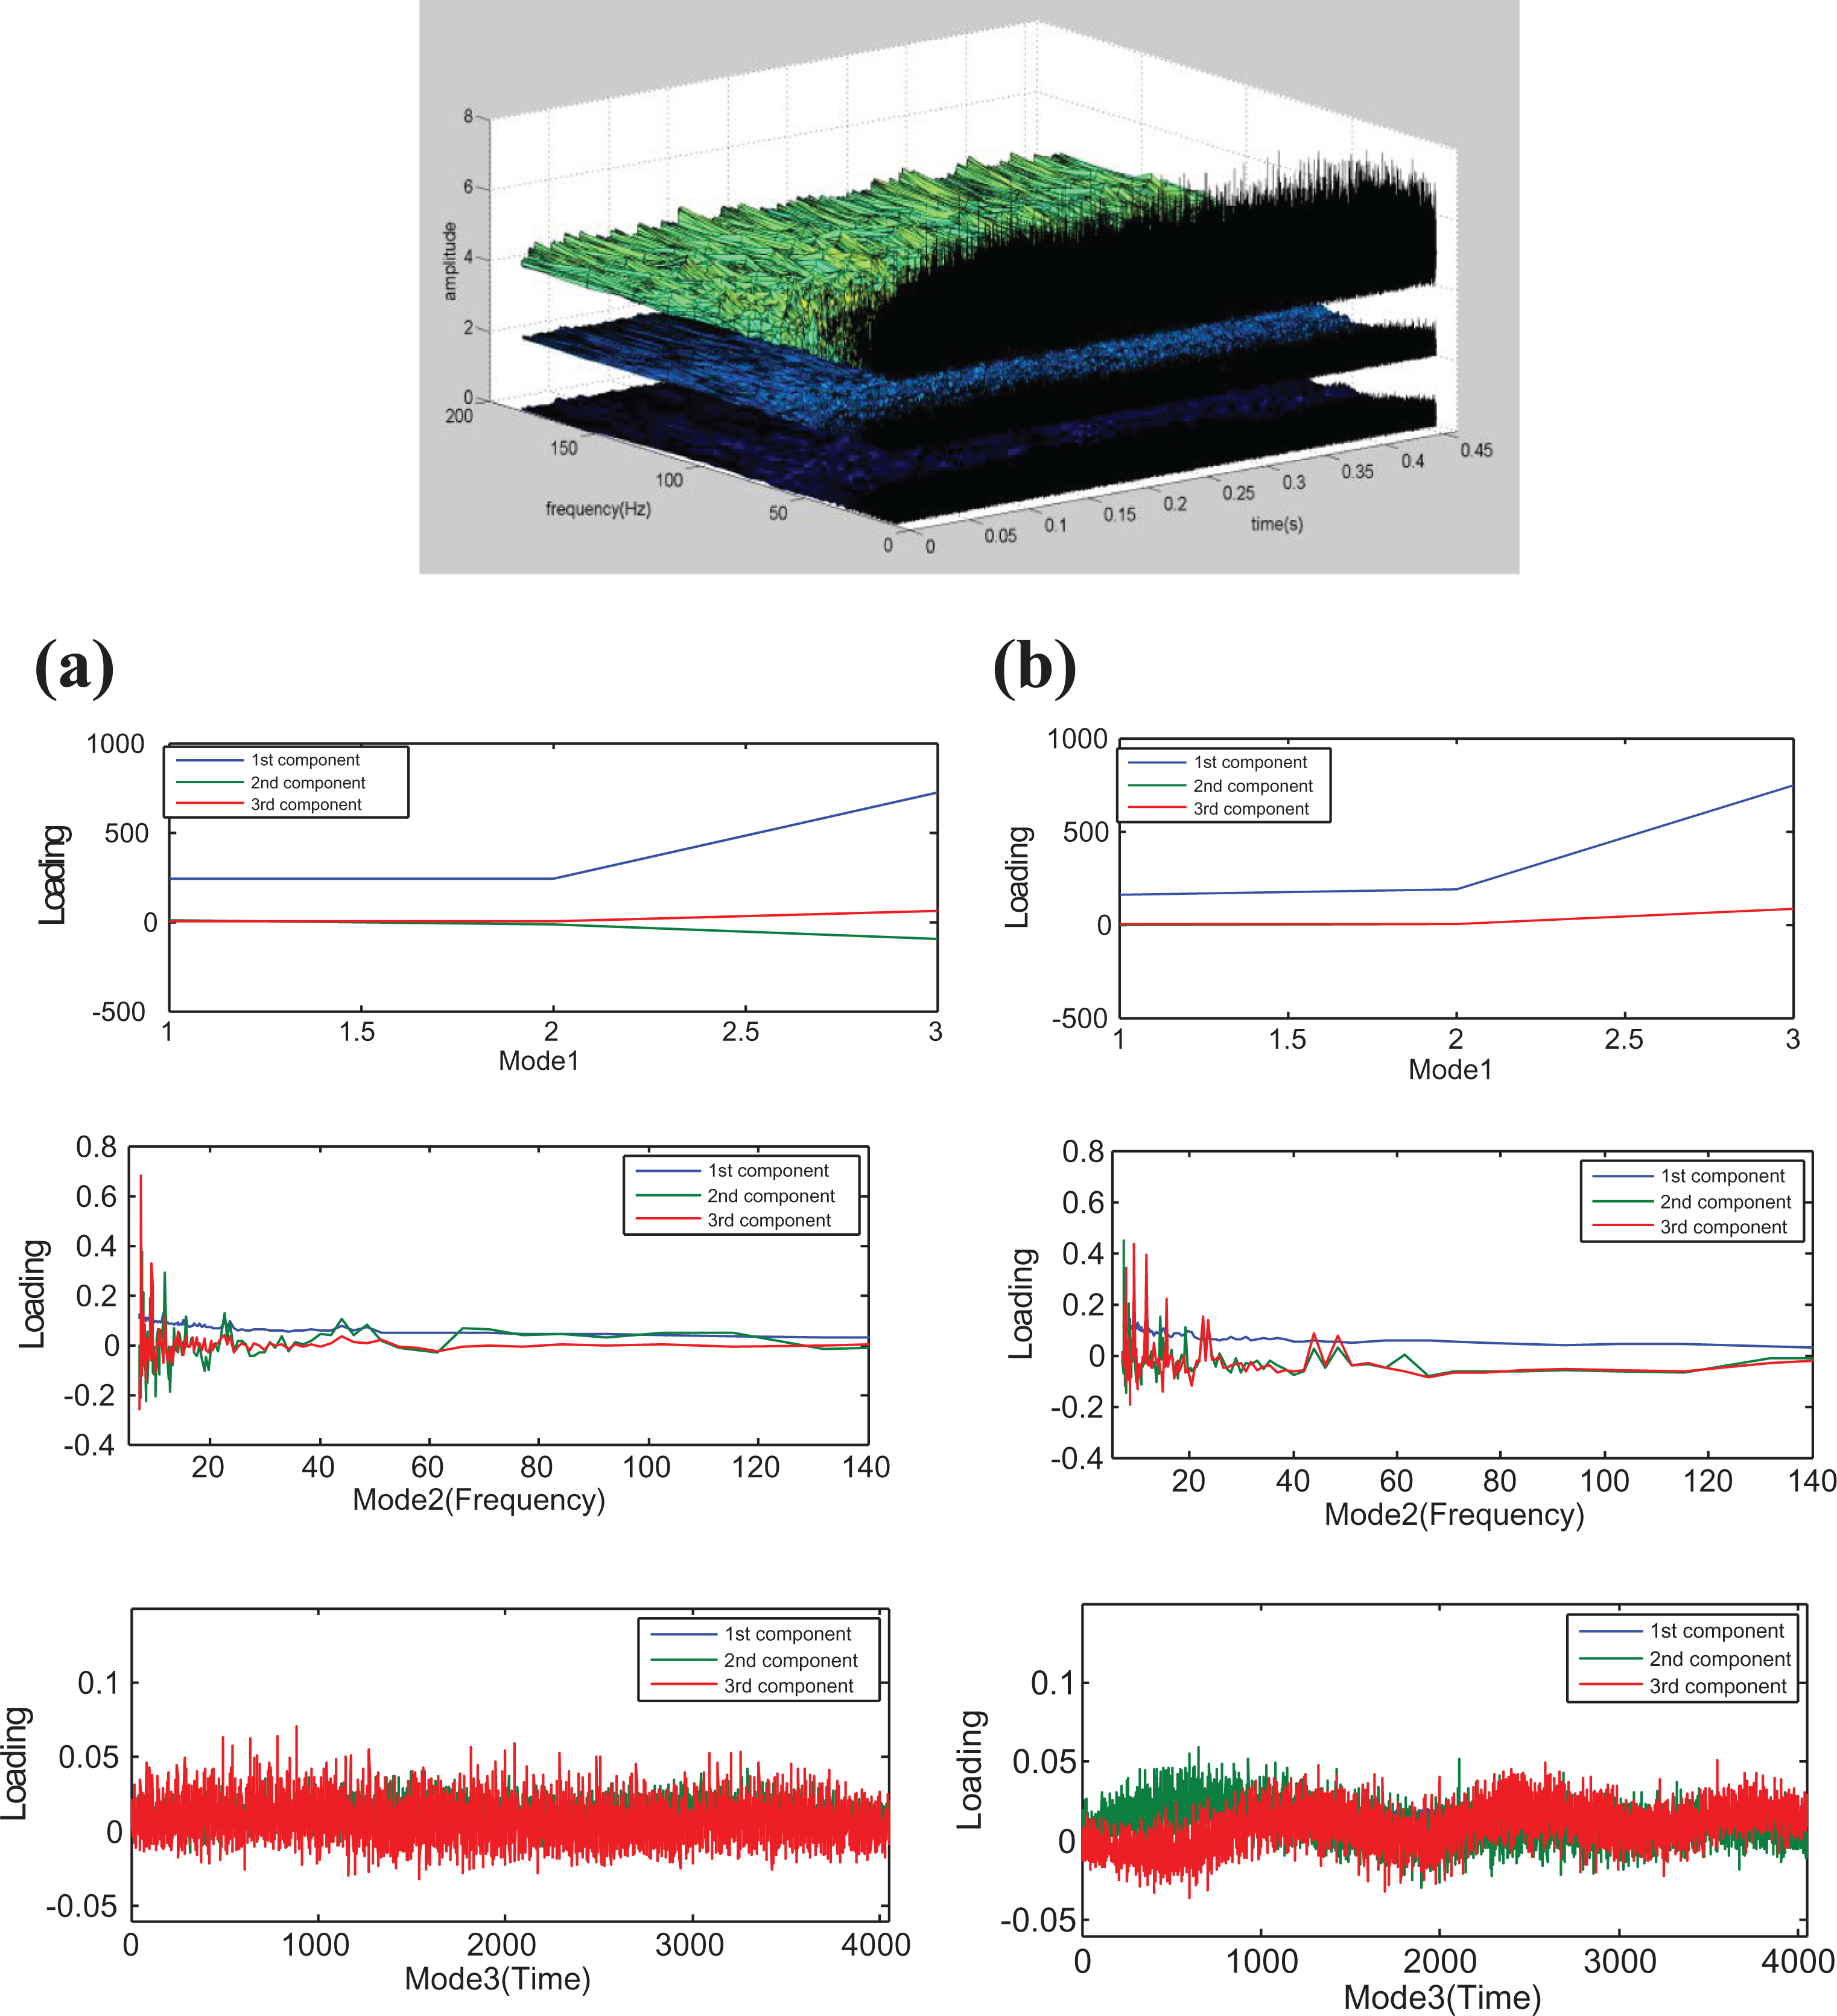
Figure 9 shows the multi-scale PARAFAC of vibration signals in three directions(X, Y, Z) at one measurement point. To analyze the 3-D dynamic characteristics of vibration signals in three directions (X, Y, Z) at one measurement point, a 3-D feature matrix was formed with the 3-D time–frequency–space 3-D features. After multi-scale parallel factor decomposition of the matrix, the amplitude loading factor, time loading factor, and frequency loading factor can be obtained and redundant mixed signals of vibration signal characteristics in three directions were eliminated. The independent characteristic signal factor in each direction is measured. Then, the difference between the frequency loading factor and the time loading factor under normal and fault conditions was obtained. In the fault state, the fluctuation range of the third component of the time loading factor (Mode 3) is larger, which could be serve as the basis for our further research. At the same time, the fluctuation range of the third component in the frequency factor (Mode 2) is larger and the range of the corresponding loading value is larger.

Multi-scale PARAFAC of vibration signals in three directions (X, Y, Z) at one measurement point: (a) normal state (left) and (b) fault state (right). PARAFAC: parallel factor analysis.
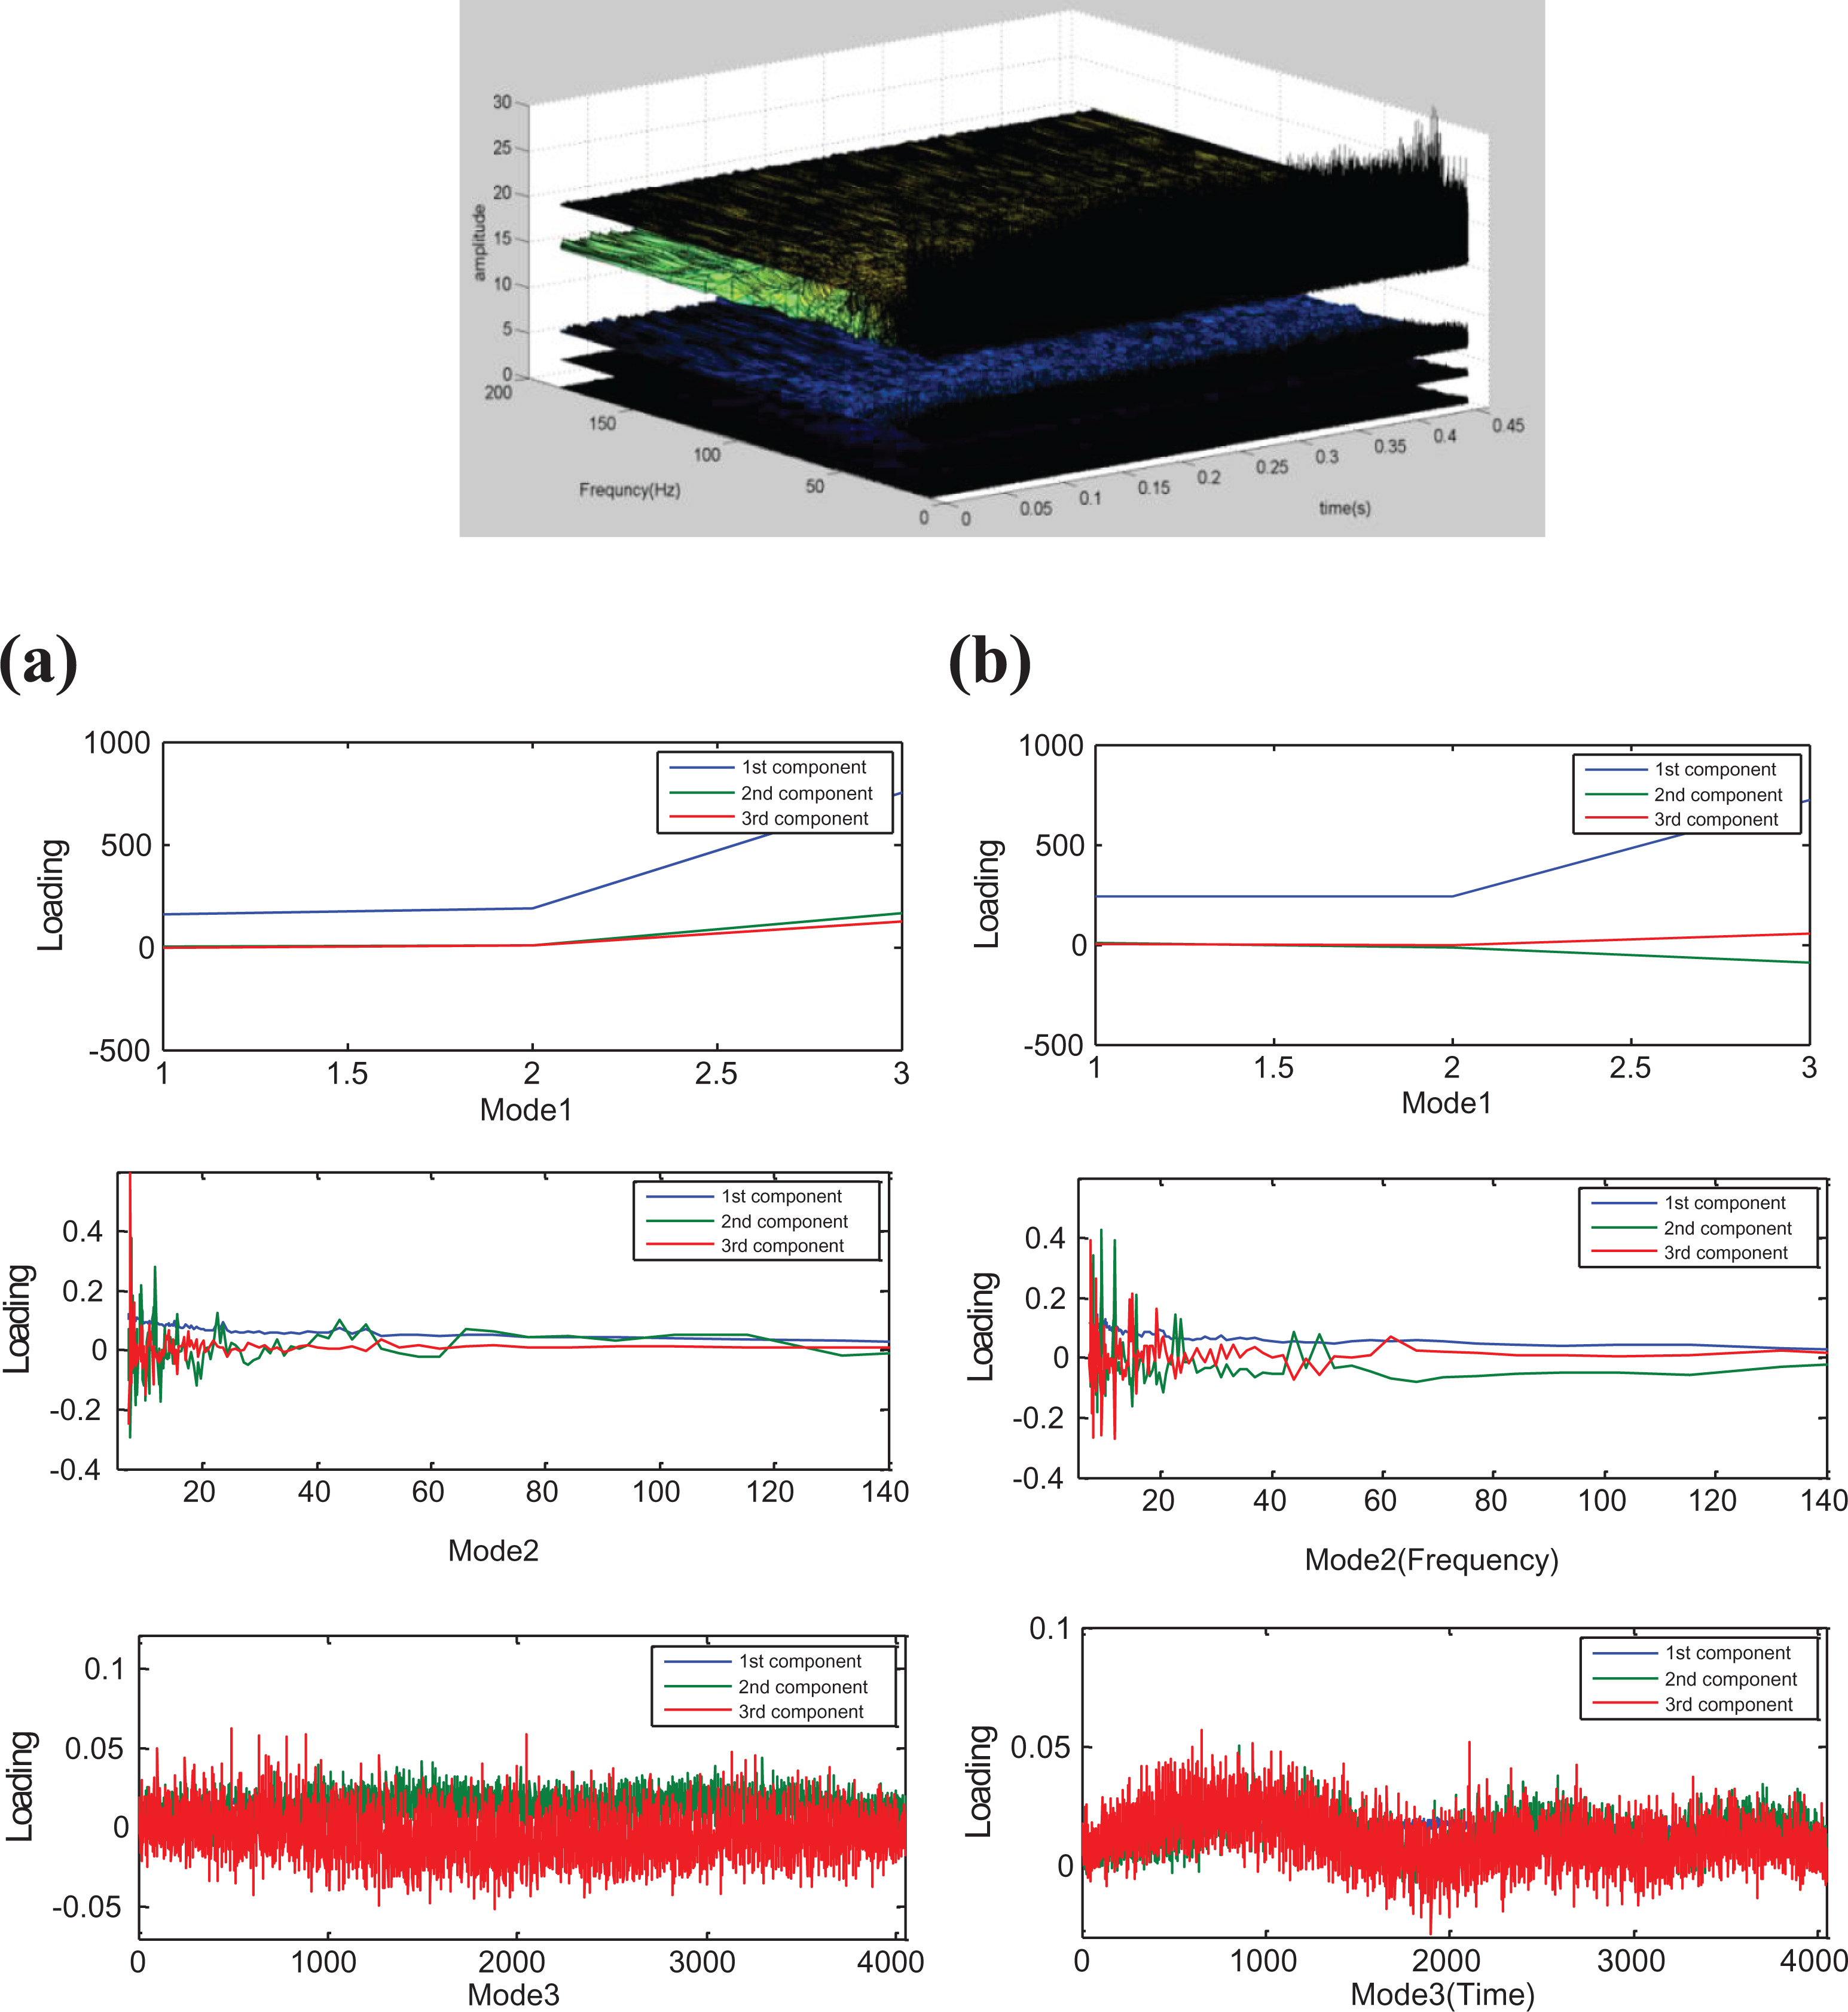
Figure 10 shows the multi-scale PARAFAC of the vibration signals at the three measurement points in the X-axis direction, where three vibration sensors were installed. The three-point vibration signals were analyzed to explore the 3-D spatial distribution of dynamic characteristics and the characteristic propagation path on the mechanical structure of the sand pump. A 3-D feature matrix was constituted from the X-axis vibration signals of the three measurement points. After multi-scale parallel factorization, the time loading factor, the frequency loading factor, and the space loading factor are obtained. Similarly, the difference between the characteristics of the amplitude loading factor and time loading factor in the normal and fault states after the parallel factor decomposition was also obtained.
Multi-scale PARAFAC of X-axis vibration signals at three measurement points: (a) normal state (left) and (b) fault state (right). PARAFAC: parallel factor analysis.
Multi-source signal fusion in nonlinear operation mode
The nonlinear failure modes of mechanical systems were produced by the rheological excitation of process fluids in the process industry. In this experiment, transient speed fluctuations were engendered by controlling the flow and pressure of the process loop, and a non-linear operating state was simulated to form a non-linear multiple fault mode. Multi-source signals and multichannel signals are simultaneously acquired. The multi-scale parallel factorization method is used to analyze the five channel signals including the flow rate, inlet and outlet flow rate, pressure signal, and rotor speed signal of the sand pump process. Figure 11 shows the multi-scale PARAFAC of the five data channels of the CP flow, inlet and outlet flow, pressure signal, and rotor speed in the experiment. In the range of 1–2 of the third component of Model 1 (channel factor), the load value of the fault state on the right is significantly larger than that of the normal state on the left. In the range of 0–4000 of the third component of Model 3 (time factor), the loading value of the fault state on the right side is significantly larger than that of normal state on the left side. It was demonstrated that the multivariable characteristics of the nonlinear process and multiple failure mode identification were successfully achieved with the nonlinearity of the mechanical failure mode.

Multi-scale PARAFAC of various data channels such as process pressure, flow rate, speed, and so on. (a) Normal state (left) and (b) fault state (right). PARAFAC: parallel factor analysis.
Multi-fault and multi-source characteristic signal identification of nonlinear mode
As a mechanical equipment mud pump in a process industry production line, there is interaction between pump components and mechanisms due to the complex internal flow. Nonlinear mechanical multi-fault vibration characteristics are mainly used to study the vibration characteristics of mud pumps under unsteady flow conditions. Under the working condition of mechanical fault, the relationship between the characteristics of nonlinear flow conditions, fault sources, various vibration sources, and multi-source nonlinear vibration signals is established. Figure 12 shows the multi-scale PARAFAC of each data channel of the CP (pressure, flow rate, and vibration). In the 0–30 range of the third component of Model 2 (frequency factor), the load fluctuation value of the fault state on the right is significantly larger than that of the normal state on the left. In the range of 0–4000 of the third component of Model 3 (time factor), the load fluctuation value of the fault state on the right is significantly larger than that of the normal state on the left.
Multi-scale PARAFAC of various data channels such as process pressure, flow, and vibration in the process industry: (a) normal state (left) and (b) fault state (right). PARAFAC: parallel factor analysis.
Conclusion
This article presents a multi-scale parallel factorization method for multi-source characteristic signal extraction in nonlinear fault modes. The mutual relationship of the optimal decomposition paths of the characteristic factors of multi-source signals is analyzed, and the optimal optimized nonlinear correspondences of nonlinear state variables, failure modes, and characteristic signals in time, frequency, and space are established. Based on the correspondence and overall consistency of multi-source feature factor decomposition paths, a 3-D fault feature model of fault feature factor spectrum, time profile, and spatial information was reconstructed. Finally, the nonlinear multidimensional dynamic fault characteristic signals were successfully extracted and the law of motion of nonlinear fault mode characteristics in multi-source signals was revealed.
The relationship between the characteristics of nonlinear flow conditions, fault sources, various vibration sources, and multi-source nonlinear vibration signals is established under the mechanical fault conditions. The vibration characteristics of various sources of vibration and faulty parts of the mud pump are analyzed under flow field conditions, and the relationship between the nonlinear flow conditions and vibration characteristics is established. Multi-fault mode multi-source dynamic feature extraction is a multi-scale parallel factorization of multi-source signal matrix including process state variables, vibration signals, and so on. The nonlinear time–frequency fault characteristic information of a single-source signal is extracted and the optimization of multi-source characteristic signal fusion is completed, so that the process state variables, fault modes, and multi-source vibration signals have the best non-linear correspondence. It guarantees the time, frequency, and space after feature extraction in the 3-D feature vector space. A unique time–frequency–space 3-D vector space nonlinear fault feature model corresponding to multi-source signals was reconstructed to achieve adaptive identification of multi-source fault features and improve diagnostic accuracy.
Intelligent manufacturing has become a new trend in the development of global manufacturing. Industrial robot is synonymous with “smart factory” and “smart production.” The remote monitoring and fault diagnosis technology of industrial robots breaks the time and space limitations of traditional data transmission and exchange and plays a role of prevention and regulation to ensure the normal work of industrial process. It is increasingly receiving more and more attention from manufacturing companies and research scholar. Industrial robots have become increasingly intelligent, structurally integrated, widely used, miniaturized products, and highly accurate and highly reliable. It puts forward higher requirements for remote monitoring and fault diagnosis technology, and the application of new theory and new technology is still in the research and exploration stage.
Footnotes
Authors’ note
The experimental data are provided by the Reliability Research Lab in the Department of Mechanical Engineering at the University of Alberta in Canada.
Declaration of conflicting interests
The author(s) declared no potential conflicts of interest with respect to the research, authorship, and/or publication of this article.
Funding
The author(s) disclosed receipt of the following financial support for the research, authorship, and/or publication of this article: This work was supported by the Special Major Project of the Ministry of Science and Technology of Hubei Province of China (grant no. 2016AAA056), Major project of Hubei Provincial Department of Education (grant no. Z20101501), and the National Natural Science Foundation of China (grant no. 51775390).