
Abstract
A novel centrifugal pump with axial directional inlet and outlet flow was presented. The system fluid was employed as the lubricant for the hydrodynamic bearings by which the pump can operate at the maximum speed of 8100 r/min without oil lubrication or rigid support. The performance curves related to the efficiency, head, and volume flow rate were obtained via a water cycle test rig. The efficiency at best efficiency point reached 36.14% with a volume flow rate of 4.13 m3/h and a head of 27.34 m at 7800 r/min. The maximum head reached 37.28 m, with a volume flow rate of 0.568 m3/h at 7800 r/min. The maximum volume flow rate of 6.05 m3/h was obtained with a head of 19.45 m at 8100 r/min. Then, the three-dimension computational fluid dynamics model with Reynolds-averaged Navier–Stokes equations and shear stress transport k-ω turbulence model for the pump and bearings was set up individually. The numerical results agreed well with the experimental data.
Introduction
Thanks to their high single-stage head, compact structure, convenient maintenance, and reliable performance, high-speed centrifugal pumps are widely used in aerospace, petroleum, and chemical fields. 1 The requirements for a high-performance compact pump in systems, such as pump-driven free cooling systems2–4 and vehicular thermal-control systems, 5 are increasing. In these potential applications, the size and stability of conventional high-speed pumps with sliding bearings are the problems to be solved. Usually, an oil-lubricated sliding bearing rotor system needs a separate oil-supply system, which leads to a large body size, a complex structure, and potential pollution. 6
Vibration is another key factor that affects the performance of the pump. The bearing friction is one of the main sources of vibration. 7 Although the centrifugal pumps with ball bearings do not contain those problems caused by oil, the vibration could affect the performance of the pump severely. Furthermore, the inner vibration is delivered to the pump surface and acts as noise. 8
The pump rotor presented in this article is supported by a system operating with fluid-lubricated oil-free hydrodynamic bearings, and the main advantages of which are that they have a simple structure and are oil-free, lubricant-free, and environmentally friendly. 9
Experimental research on traditional high-speed centrifugal pumps mainly focused on hydraulic tests, internal unsteady flow measurement,10–12 and flow cavitation research.13,14 Westra et al. 15 investigated the secondary flow and its generation with the structures of a centrifugal pump by particle image velocimetry. Feng et al. 16 used the laser Doppler velocimetry technique to investigate the complex flow velocity distributions in the rotor–stator interaction region. Computational fluid dynamics (CFD) is widely used in the centrifugal pump design and optimization. Asuaje, 17 Kergourolay, 18 Grapsas, 19 Goto, 20 and Anagnostopoulos 21 developed this method for impeller design and optimization, and their results confirmed the effectiveness of this method. Zhou et al. 22 simulated the internal flow of a new type of three-dimensional surface return diffuser to improve the hydrodynamic performance of the deep-well centrifugal pump. Muijderman 23 extended the hydrodynamic bearing for the low-viscosity fluid and developed the spiral-groove bearings’ analytical expression of the pressure distribution. Kink and Reul 24 first studied the hydrodynamic bearings using in an axial blood pump experimentally. The hydrodynamic bearings with different installation methods were applied in different types of blood pumps, such as those with upper and lower spiral grooves structure,25–27 and hydrodynamically levitating impellers. 28 The artificial blood pump with hydrodynamic bearings was typical designed for achieving a head of 80 mm Hg at a flow rate of 5 L/min. Thus, those pumps were too small to meet the flow rate and the pressure rise for conventional use.29,30
In this article, a 1-kW industrial-level high-speed pump with oil-free hydrodynamic bearings was designed and proposed by our team. A numerical model was established to predict the performance of the pump’s hydraulic components at different rotational speeds. The water cycle test rig was employed to test the hydraulic performance of the high-speed pump. Then, the experimental and numerical results were compared. The feasibility and reliability of the pump were validated.
Numerical modeling
Pump structure
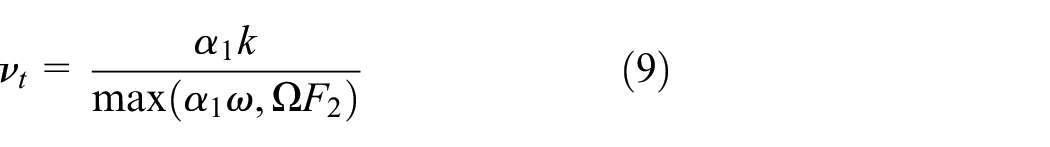
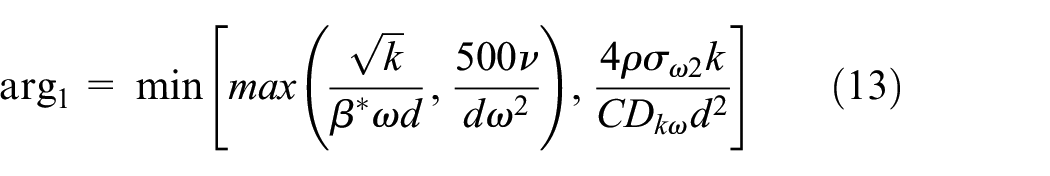
The key parts and cross-sectional view of the pump are shown in Figure 1. It is mainly composed of the inlet cover plate, inducer, impeller, guide vane, DC motor stator, shaft with inlaid permanent magnets, hydrodynamic bearings, outlet volute, and shell. Owing to the limitation of processing conditions, the semi-open impeller was applied. To achieve high-speed oil-free operation, the spiral-type thrust hydrodynamic and herringbone radial bearings were used to support the motor shaft. Two herringbone-groove hydrodynamic radial bearings and two spiral-groove thrust bearing were employed. System fluid was used as the lubricant (see Figure 2).

The high-speed pump structure.

Details of hydrodynamic bearings.
As shown in the right part of Figure 1, the flow direction of fluid in the pump was axial in and out. The working fluid enters the inducer vertically from the pipeline. After speeded up by the high rotating impeller, the working fluid enters the guide vane and the volute, and the majority of the kinetic energy transfers into potential energy. Then, the fluid flows through the diversion channel into the flow path, which is composed of the shell and the motor stator, to the front and rear hydrodynamic bearings. When it flows through the pump body, the working fluid could flow into the lubrication gap as lubricant.
The pump was designed for a volume flow rate of
Numerical model
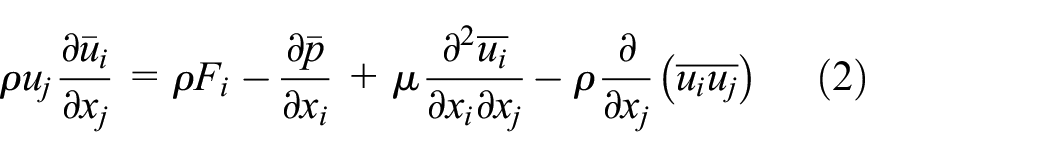
The Reynolds-averaged Navier–Stokes (RANS) equations were used to describe the internal flow of the pump. Due to the steady simulation of the pump, the steady-state Navier–Stokes equations were applied to describe the conservation of the mass and momentum of the fluid flow in the pump.
The continuity equation is

The momentum equations is
The shear stress transport (SST) turbulence model based on the
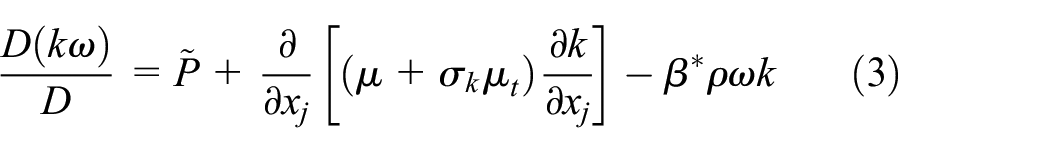

where
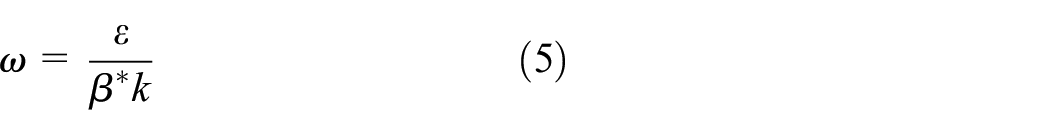
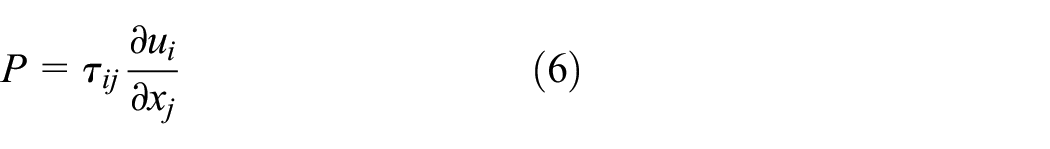

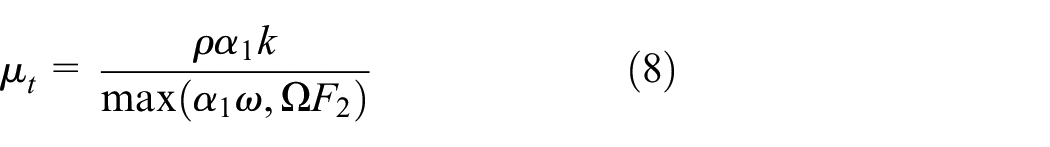


In the given equations,
The governing equations were discretized in space by finite-volume method. The second-order upwind scheme was used for the convective terms and the second-order central scheme for the diffusion terms. The semi-implicit method for pressure-linked equations algorithm was used to solve the discrete equation. The convergence criterion was that the relative residual error of each variable was decreased by 10 × 10−5, and the pressure difference between the inlet and outlet of the computational domain became stable.
Boundary conditions and solution of pump
As shown in Figure 3, the fluid region contains five subdomains: the inlet pipe, inducer, impeller, guide vane, and outlet pipe. The tip clearance of the inducer and the impeller was 0.5 and 0.35 mm, respectively. The inlet and outlet extension subdomains were divided by hexahedron grids via ANSYS ICEM and the inducer, impeller, and guide vane subdomains were divided by hexahedron grids via Turbogrid. The number of grids was 4,461,117, and the grids’ independence is confirmed in Table 1. In the calculation, the inlet total pressure was 1 bar. The outlet was the mass flow rate outlet.

Computational model and mesh.
Independence of the model elements number.

Boundary conditions and solution of thrust bearings and radial bearings
The fluid regions of the thrust bearing and radial are shown in Figure 4. The fluid regions were divided by hexahedron grids. The total thickness was fixed at 100 µm. The bearing film thickness was set from 10 to 50 µm by 5-µm step. In the calculation, the total pressure of inlet was calculated from the pump outlet. The outlet was set as the pressure outlet. In the working process, with an increase in the impeller axial force, the different clearances liquid film was formed in the clearance of the thrust bearings. Total bearing capacity of the front and rear thrust bearings is balanced with the axial force of impeller.
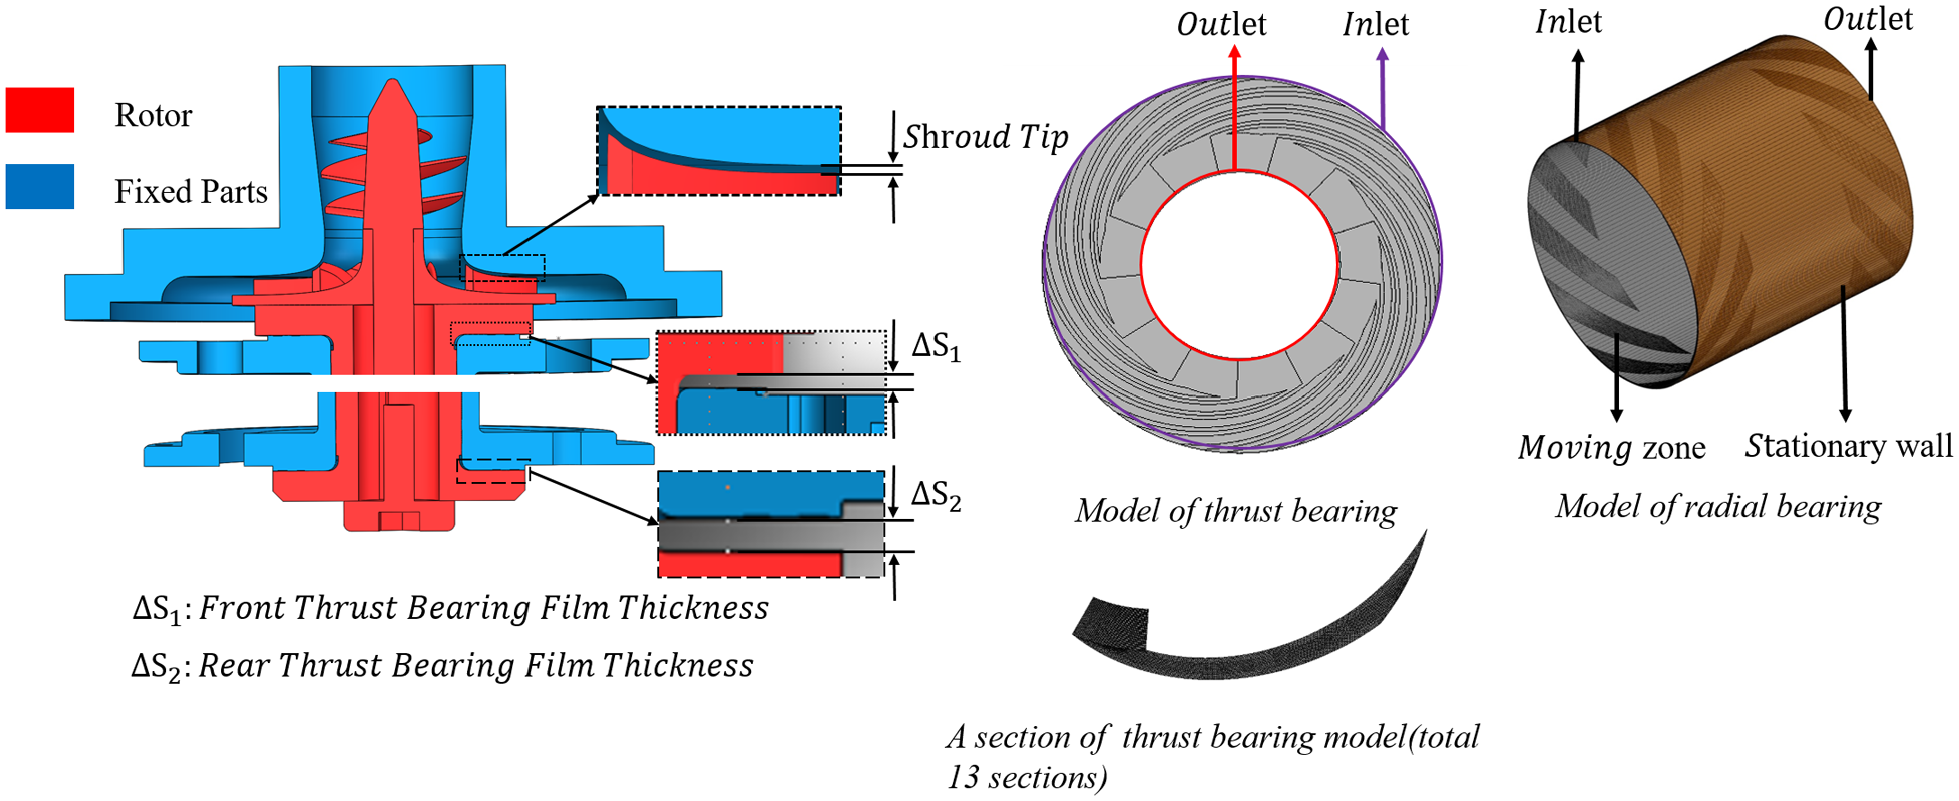
Model and mesh of bearings.
For the radial bearing, both inlet and outlet were set as pressure boundary. The average liquid film thickness between rotor and the bearing was set as 25 µm. The eccentricity of the rotor was set from 0.1 to 0.7 by 0.2 step.
Experimental test
Test rig
Figure 5 shows the test rig. It is mainly composed of a storage tank, a surge tank, two float-level gauges, connecting pipelines, valves, and data-acquisition devices. A pressure sensor was fixed on each of the pump inlet, pump casing, and pump outlet. The input power, including the motor power and the power consumed by the frequency converter, was measured by a three-phase electric power meter. Pressure sensors (PSE560-01, SMC, Japan) with an accuracy of ±0.5% (full range 0–1 MPa) were used. The power meter (PZ9930, HZK Co., China) with an accuracy of

where

High-speed pump test rig.
Uncertainties of test parameters.

The test procedure has three steps. First, open the data-acquisition system and turn on the pump to 1800 r/min to reduce the friction caused by the low-rotational-speed shaft. Second, speed up the pump and record the data after 20 min of stable operation. Third, adjust the opening of the flow-control valve to investigate the relationship between the flow rate and pump head and record the data under different operating speeds.
Test method
The head of the pump can be calculated by equation (16)

The head of the pump acquired from the impeller can be calculated by equation (17)

For the same inlet and outlet pipeline, velocity, and horizontal position, the total head of the pump can be calculated by equation (18)

where Hl is the head loss along the internal flow passage and the outlet pipe.
The efficiency of the hydraulic components was defined as the ratio of the output power to the input electric power

The total efficiency of the pump was defined as the ratio of the output power and input electric power as shown in equation (20)

The hydraulic performance was tested for speeds from 6600 to 8100 r/min. The same working conditions related to the designed point at different rotational speeds were set. The conversion formulas for the same working conditions are 34
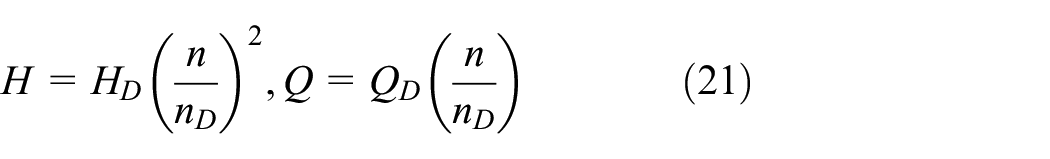
where
Table 3 shows the results of the formulas for the same working conditions at different rotational speeds. A pump working in the same conditions should have a similar flow state. The test head was 17.25, 20.33, 24.43, 26.54, 29.73, and 31.93 m at the flow rate from the same working conditions.
Similarity working conditions.
Results and discussion
Test results
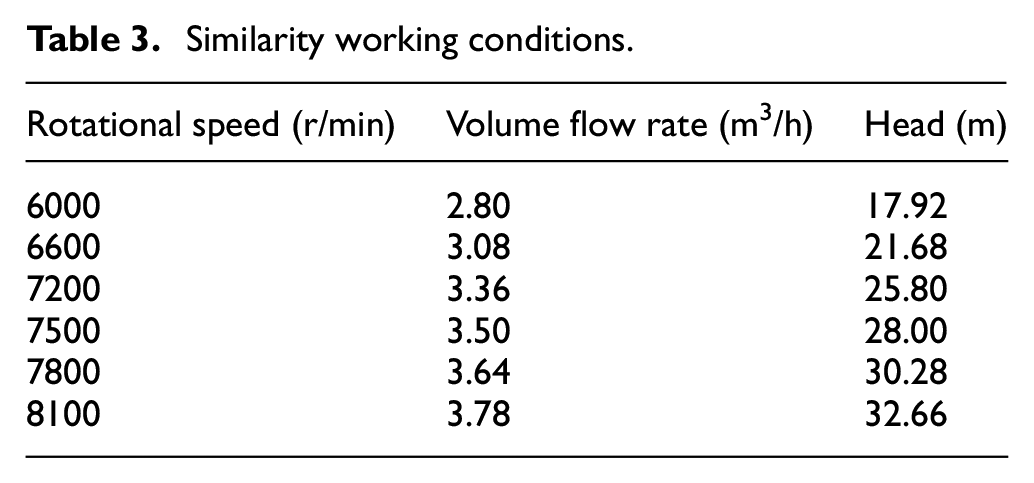
The test was carried out under different pump speeds: 6000, 6600, 7200, 7500, 7800, and 8100 r/min. The test results of the high-speed pump are shown in Figure 6. Through valve-opening adjustments, a volume flow rate from 0.95 to 5.63 m3/h was achieved and the total head of the pump ranged from 16.60 to 32.51 m. At the designed point, with a total efficiency of 34.11%, the pump could supply water with 3.50 m3/h flow rate and 26.54 m head. When the maximum efficiency reached 35.43%, the flow rate reached 4.54 m3/h, the total head reached 22.47 m, and the second-highest hydraulic component efficiency of
Test results of pump at 7500 r/min.
The efficiency values at best efficiency point (BEP) for different rotational speeds are shown in Table 4. The maximum efficiency reached 37.97% with 4.54 m3/h flow rate and 27.34 m total head. The flow rate of each efficiency at BEP was around the designed flow rate 3.50 m3/h, and the fixed guide vane only worked efficiently in a narrow range of flow rate.
BEPs at different rotational speeds.

BEP: best efficiency point.
Results comparison
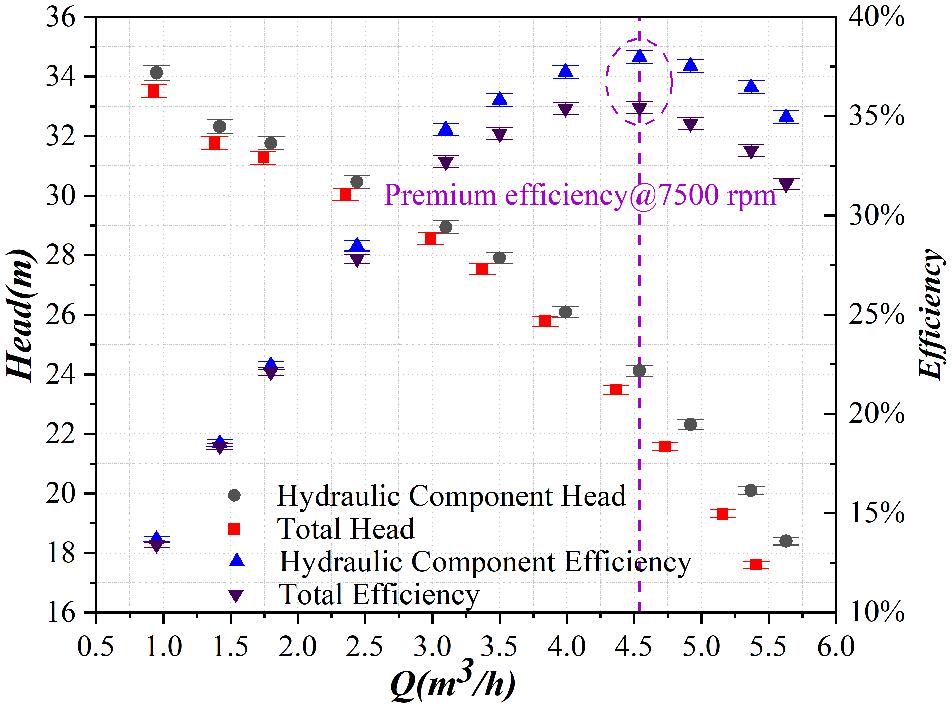
The comparison between the test results and the numerical results under the design rotational speed (7500 r/min) is shown in Figure 7. The maximum difference in the head and hydraulic efficiency was 8.3% and 3.23% respectively.
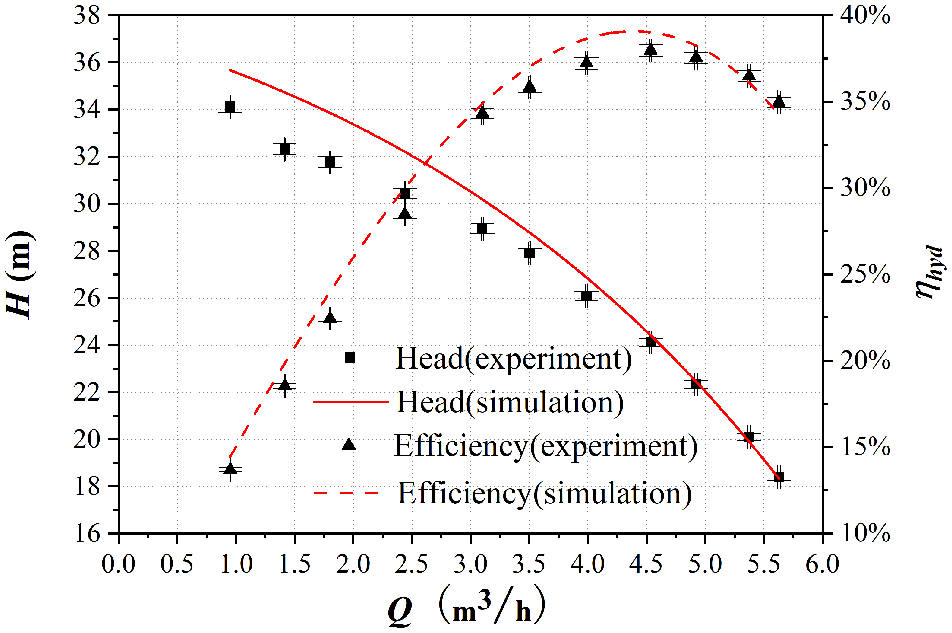
H-Q and ηhyd-Q curves at 7500 r/min.
Figure 8 shows the comparison between the experimental and the numerical results under different pump speeds. The experimental results are very close to the numerical prediction and the relative differences are 4.38%, 4.68%, 2.79%, 3.81%, 1.95%, and 3.32% under the rotational speeds of 6000, 6600, 7200, 7500, 7800, and 8100 r/min, respectively. As seen in Figure 8, the pump head decreases gradually with the increase in the volume flow rate. With the increase in the rotational speed, the volume flow rate increased. The maximum water head increased with increasing the rotational speed, but the increment size decreases. The behavior of the present high-speed oil-free pump is in agreement with that of a general centrifugal pump.

H-Q curves.
As shown in Figure 9, the efficiency at BEP of each rotational speed was achieved under different flow rates. Because of the narrow working range of the fixed guide vane, the pump performance is sensitive to working conditions. On the left side of the efficiency at BEP, the curve slopes are relatively consistent, but those curve slopes show different trends on the right side of efficiency at BEP, especially for the smaller rotational speed. The numerical results agreed well with the tested results; the relative errors for the head of the pump and efficiency are 7.42% and 9.11%, respectively. The above comparison shows that the numerical method can be used to predict the hydraulic performance of the present pump.

ηhyd-Q curves.
Internal flow under different flow rates
Based on the validated theoretical model, the further performance of the present pump was analyzed. Figure 10 illustrates the total pressure distribution and velocity streamline on the middle-span surface of the impeller and guide vane under different flow rates at 7500 r/min. The streamline distribution in the impeller and guide vane passage is very uniform, with few vortices and refluxes at the designed and large flow conditions. As the flow rate decreased, the flow-separation phenomenon appeared on the suction side of the blade, and a vortex-like flow was formed at the tail of the impeller blade. This phenomenon can be considered as the jet-wake phenomenon, which can also be illustrated by the total pressure distribution on the impeller. For the case at low flow rates, due to the large gap between the impeller and the guide vane, the flow-separation phenomenon continued to develop in the impeller passage. Another distinct vortex structure was formed at the entrance of the guide vane for the low flow rate. The vortex could block the guide vane passages and lead to a rapid decline in efficiency, which can be validated by the variation trends of the tested efficiency in Figure 9.

Total pressure contours and velocity streamline on impeller and guide vane at different flow rates with 7500 r/min (middle span): (a) 1.61QD, (b) QD, (c) 0.69QD, and (d) 0.27QD.
Figure 11 illustrates the static pressure distribution on the inducer blade’s suction and pressure sides under different flow rates when the rotational speed is 7500 r/min. The inlet pressure of the impeller was promoted in the inducer by 3.78%–3.99% over the corresponding total pressure. The pressure promotion was more pronounced for the smaller flow rate. It can be seen from Figure 11 that the inducer is effective for pressure promotion before the impeller. The inducer could lead to a 0.98-m increase in the pump net-positive suction head (7500 r/min). Although it presents a limited effect for water, it is important for other fluid working at near-saturation states.

Static pressure distributions on the suction and pressure side of inducer: (a) 1.61QD, (b) QD, (c) 0.69QD, and (d) 0.27QD.
Internal flow under similarity conditions
Figure 12 shows the static pressure distributions in the inducer and the impeller under different speeds for the same conditions according to equation (21). Although the static pressure increases from Figure 12(a)–(f), the static pressure distributions of the internal flow under the same conditions are extremely similar. Due to the similar internal flow, the losses for the same conditions are nearly the same. This was validated by the slight difference of the efficiency (from 35.61% to 37.25%) for the same condition, as shown in Figure 9.

Static pressure distributions in inducer and impeller under different speeds: (a) n = 6000 r/min, (b) n = 6600 r/min, (c) n = 7200 r/min, (d) n = 7500 r/min, (e) n = 8100 r/min, and (f) n = 7800 r/min.
Figure 13 illustrates the relative velocity, static pressure, and total pressure along the streamline. The streamline is divided into three parts: 0-1 refers to the inducer, 1-2 referring to the impeller, and 2-3 refers to the guide vane. The details of inducer, impeller and guide vane were shown in Figure 3. As shown in Figure 13(a)–(c), the relative velocity, static pressure, and total pressure along the streamline have the similar variation trends. In Figure 13(a), the relative velocity increases in the inducer and impeller. After reaching the maximum speed near the tailing edge of the impeller, it begins to drop until the middle of the guide vane. Figure 13(c) shows the total pressure rise in the rotating parts. A small amount of energy was transferred to the fluid through the inducer. Most of the energy was transferred through the impeller. The pressure energy was converted to kinetic energy in the guide vane, accompanied by partial energy-conversion loss, and the total pressure decreased through the guide vane. In Figure 13(a) and (b), due to the gap between the impeller and guide vane, the static pressure rose and the velocity dropped when the fluid flowed through the impeller to the fixed guide vane.

Hydraulic performance along the streamline.
The influence of thrust bearing
Figure 14 shows the pressure distribution of the thrust bearing at 7500 r/min. The result shows that one thrust bearing can supply about 265 N load capacity with a 15-μm fluid film thickness at 7500 r/min. At the same time, the fluid film thickness of the other thrust bearing was 75 μm. As shown in Figure 14, the bearing capacity nearly reduces to 0 at film thickness greater than 50 μm. Thus, the load capacity can be considered as the single thrust bearing load capacity. Combined with Figure 15, when the film thickness is smaller than 18 μm, the load capacity can reach 200 N, which is larger than the maximum axial force point at 1.2 m3/h with 18.34 m head under 7500 r/min. The load capacity can meet the axial force requirements from the pump.

Thrust bearing capacity under different film thicknesses at 7500 r/min.

Axial force for the pump and the thrust load capacity under different flow rates.
Figure 15 shows the axial force of the impeller and the load capacity from the thrust bearing at different rotational speeds. The axial force of the impeller at different rotational speeds was decrease with the increase of film thickness. And the axial force under minimum flow was obvious larger than large flow rate, which matched the flow-head curve. There are different intersections between the load capacity curve and three axial force curves. This shows that in the pumping process, the rotor system will have a very small displacement in the axial direction.
Figure 16 shows that with an increase of the rotating speed, the larger tip clearance caused a larger head loss. This result is more obvious at the small flow rate. Under the minimum flow rate of different rotation speeds, the head losses of small tip and large tip are 0.33, 0.48, and 0.56 m, respectively. The relative losses are 1.19%, 1.34%, and 1.37%, respectively. Compared with the experimental results, the curve of experimental results fluctuates to some extent. The reason is the axial force of impeller changed with the change of the rotating speed or flow rate. And, it leads to the change of the thickness of liquid film in the hydrodynamic bearing and the shroud tip clearance. The film thickness in single thrust bearing varies between 0 and 50 μm. And, the tip clearance varies between 0.3 and 0.4 mm. Under different tip clearances, the loss is different. There is a certain fluctuation in the experimental results.

Influence of tip clearance on head–flow rate curve.
Numerical results of radial bearing
Figure 17 shows the change of the radial bearing capacity with increasing rotating speed under different eccentricities. The capacity increased with the rotating speed and eccentricity. In the case of larger eccentricity, the larger bearing capacity increases with the rotating speed. The minimum bearing capacity was 1.37 N at 6000 r/min with the eccentricity of 0.1. The bearing capacity was larger than the rotor weight at 0.32 kg.
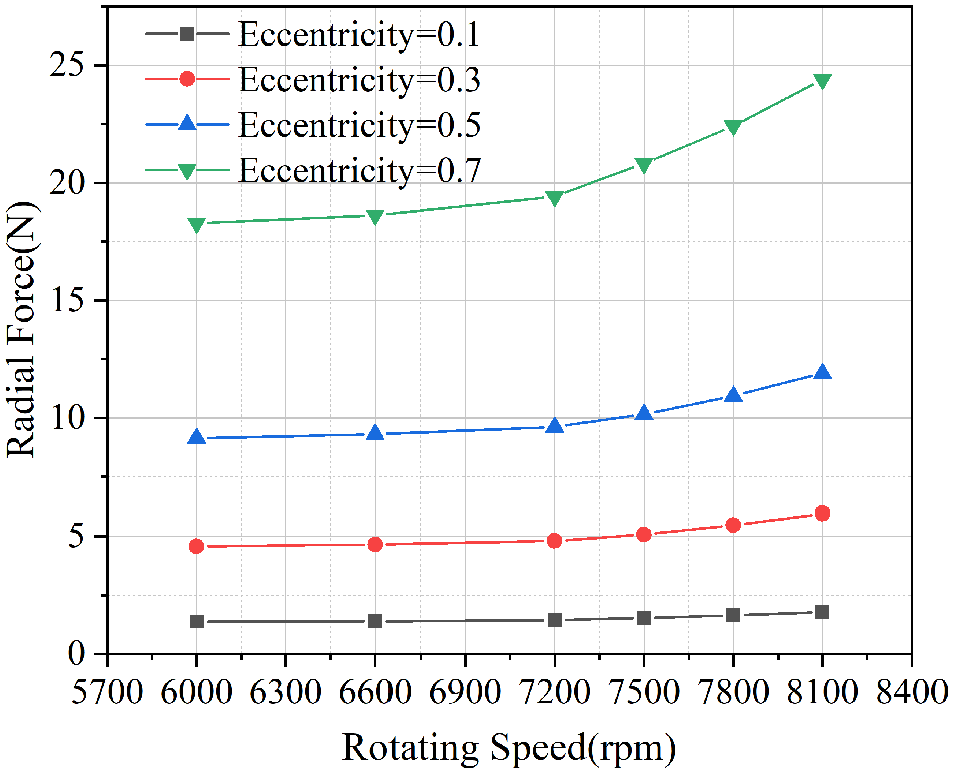
Radial capacity varies with rotating speed.
Conclusion
A novel high-speed oil-free centrifugal pump supported by liquid-lubricated hydrodynamic bearings was proposed in this study. The hydraulic performance of the pump was investigated experimentally and numerically.
With the liquid lubrication hydrodynamic bearings, the pump could operate stably at high speeds up to 8100 r/min under oil-free conditions. A water flow rate ranging from 0.59 to 6.05 m3/h and corresponding head of the pump ranging from 21.43 to 40.13 m were achieved through the test. The maximum efficiency reached 36.14% with a flow rate of 4.13 m3/h and head of the pump of 26.54 m under the rated speed (7500 r/min).
The theoretical prediction showed good agreement with the experimental data. The maximum differences in the hydraulic efficiency and head of the pump under rated speed were 8.3% and 3.23%, respectively. The three-dimensional CFD model with RANS equations and SST k-ω turbulence model was effective for the performance prediction of high-speed pumps with oil-free hydrodynamic bearings.
The numerical results of the thrust bearing and radial bearing proved the reliability of the pump. The results showed that the change of liquid film thickness in thrust bearing also affects the hydraulic performance of the pump.
Footnotes
Appendix 1
Handling Editor: James Baldwin
Declaration of conflicting interests
The author(s) declared no potential conflicts of interest with respect to the research, authorship, and/or publication of this article.
Funding
The author(s) disclosed receipt of the following financial support for the research, authorship, and/or publication of this article: This project was supported by the National Key R&D Program of China (2018YFB2000100), the Youth Innovation Team of Shaanxi Universities, and the Key Research and Development Plan of Shaanxi Province (2018ZDXM-GY-057).