
Abstract
There are a large number of cloud-covered areas in most unmanned aerial vehicle images and lead to the loss of information in the image and affect image post procession such as image fusion and target identification. Finding the cloud-occluded area in an image is a key step in image processing. Based on the differences of color and texture characteristics between cloud and ground, a cloud detection algorithm for the unmanned aerial vehicle images is proposed. Simulation results show that the proposed algorithm is better than the classical cloud detection algorithms in accuracy rate, false-positive rate, and kappa coefficient.
Keywords
Introduction
Based on the long-term observations of International Satellite Cloud Climatology Project in Li et al., 1 66.7% of the Earth is covered by clouds. So, there are clouds in most unmanned aerial vehicle (UAV) images that lead to the loss of information in the image and affect image post procession such as image fusion and target identification. So, cloud detection evokes much attention and research result. The difference of blue value between cloud and non-cloud area is utilized to detect the thick cloud in Wang and Huang. 2 Digital elevation model is combined with F-mask algorithm in Qiu et al. 3 to decrease the interference of the cloudlike area on the detection results. Multiple detection charts of multiple thresholds are used to distinguish cloud and shadow of cloud in Zhong et al. 4 The above methods fit for specific sensors and scenes as relying on the spectrum and physical characteristics. In Zhang and Xiao, 5 the bilateral filter in edge-preserving filter is used to decompose the image at multiple scales, and the texture is obtained to distinguish the cloud from the non-cloud target. Texture feature is used in Shi et al. 6 to merge pixel blocks with similar characteristics after super-pixel segmentation and establishes a corresponding segmentation map model, which can better distinguish cloud and non-cloud regions. With the development of artificial intelligence, fully convolutional networks for pixel division is combined with network for edge detection in Yuan et al. 7 Super-pixel division method is combined with convolutional neural networks (CNN) to distinguish thick and thin clouds in Liu et al. 8 The thin and thick clouds are detected from remote sensing images using 10 bands of spectral data based on the multiscale eeatures-CNN in Shao et al. 9 In Zhiyuan et al., 10 the cloud and cloud shadows are detected in remote sensing images based on multilevel feature fused segmentation network. But the above pattern recognition methods need a lot of training datum, and there is no high precision training datum available.
The relative characteristics of cloud and ground are as follows: that the cloud texture hopping and structural level difference is little, there are rich details in the non-cloud area and the textures of high reflective ground area are complex. By synthesizing color and detail characteristics, a general cloud detection algorithm for high resolution UAV images is proposed with higher accuracy and lower false detection rate for image cloud detection.
The paper is organized as follows: In the second section, color and texture features of high resolution UAV images are introduced. The cloud detection algorithm is described in the third section. Simulation results are shown in the fourth section. Finally, the conclusion of this work is summarized in the fifth section.
Color and texture features of high-resolution unmanned aerial vehicle images
Generally, there are two contrast features of the cloud and non-cloud area in UAV images. According to Zhang and Xiao,
5
The reflection rate of cloud area is larger than the non-cloud area, so the brightness of cloud area is greater than that of non cloud area, while the hue and saturation of the cloud area is low. According to Zhang and Xiao,
5
the areas covered by clouds usually have less detail information than those without clouds in color images. The cloud area is smooth while the texture information of the non-cloud area is richer.
According to the first feature, we can extract significance map of the cloud area in hue–saturation–intensity (HSI) space of a UAV image. Based on the second feature, we can diminish non-cloud area with high reflection rate lying in the significance map by edge detection using the texture feature. So, from the features above, we can get preliminary division of cloud and non-cloud area by means of brightness, hue, and texture of the UAV images.
Algorithm flow
Based on the color and texture features of high resolution UAV images, we propose a cloud detection algorithm in combination with the common detail detection algorithms. The detailed flow is shown in Figure 1. 1. Extract the significance map based on HSI. i. Transfer the image from RGB color space to HSI

Flowchart of HSI and texture feature based cloud detection algorithm. HSI: hue–saturation–intensity.
The brightness of cloud area in UAV image is generally higher, and cloud area can be preliminarily screened by brightness. The mean of R, G, and B components are taken as the intensity value of brightness in Zhang and Xiao. 5 But it cannot reflect the brightness well owing to the RGB color model is one of the non-uniform color models. HSI color space is designed according to the visual characteristics of human eyes and it can extract cloud region preliminarily. Transfer the image from RGB color space to HSI according to formula (1)

where H is tonal component, I is brightness component, and θ can be calculated by
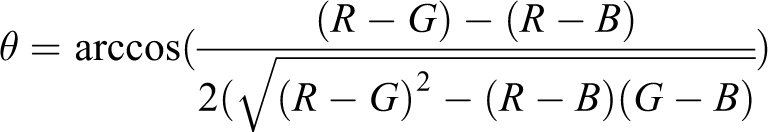
ii. Extract the significance map according to formula (2)
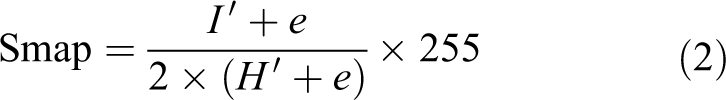
where

and the symbol Smap in formula (2) means significance map.
iii. Threshold segmentation of significance map using the method in Otsu 11 and get X 1.
2. Construct detail image and take preliminary detection
Cloud areas are generally smooth and have fewer textures in UAV images. On the contrary, non-cloud areas have complex details and many textures. Therefore, non-cloud areas can be extracted from texture features.
i. Take X 1 as the input image, extract edge details using Sobel algorithm in Conzalez and Woods, 12 get the horizontal G 1 and vertical gratitude G 2, get detail image Xd according to formula (3)

ii. It is just a regular culling operation. Using OTSU method for detail image Xd
, detail binary graph

Through ∧ operation, we can get the rich details of terrain in X 1. Through ⊕ operation, these abundant details can be removed from X 1, and X 2 can be obtained.
3. Detailed detection and refinement process
i. Extract and exclude the connected area little than s using the connected region notation in morphological image processing,
13
where
ii. After removing the connected area whose number of pixels is less than s by the first step, we get

where

where
iii. Take fine segmentation of the edge of the pending cloud area in X 3 using guided image filtering in He et al. 14

where F is the guided image filter, X is the input raw image, X
3 is the image to be filtered,
iv. Take binarization of
Through the above steps, the difference in brightness, saturation, and detail information between cloud and ground can be comprehensively utilized. For the case that the brightness of non-cloud area and cloud area is basically the same due to reflection and other reasons, it can be effectively distinguished by detail processing.
Simulation results
To test the detection effectiveness and superiority of the proposed algorithm, on the one hand, four different raw UAV images will be detected, as shown in Figure 2. The images used include UAV images with simple, complex, and man-made terrains. And the manual detection results for cloud areas in four raw images are also shown in Figure 2. They will be used as ideal detection results to judge the accuracy of cloud detection algorithms. On the other hand, we take K-means in Lin et al., 16 mean-shift in Comaniciu and Meer, 17 Chan–Vese in Vese and Chan 18 as compared algorithms and take subjective and objective assessment.

(a) Raw and (b) manually labeled cloud area images.
Accuracy rate, false-positive rate, and kappa coefficient are used to assess the detection result quantitatively. Kappa coefficient k is between 0 and 1 and is the indicator for measuring classification accuracy. Detailed correspondence is as follows:
if
if
if
if
Accuracy rate A is defined as

where
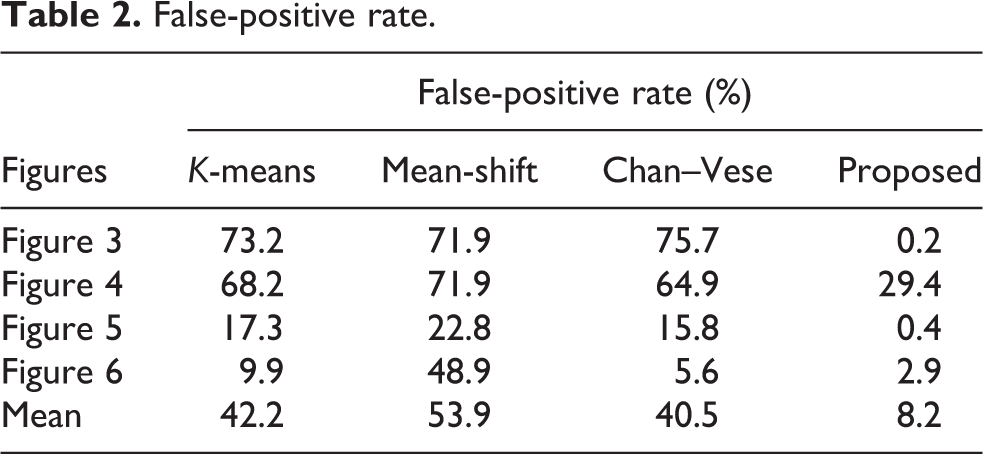
False positive rate F is defined as

where
And kappa coefficient is defined as

where

Figure 3 shows the first original image, the manual labeling cloud area and its cloud detection results using K-means, mean shift, Chan–Vese, and the algorithm proposed in this paper. It is shown in Figure 3 that the K-means, mean-shift, and Chan–Vese algorithms often misjudge the non-cloud area with similar brightness to the cloud, while the test result of the proposed algorithm is closest to the manual labeled image and it takes much less misjudge as utilization both the brightness and texture characters. The values of accuracy rate, false positive rate, and kappa coefficient of K-means algorithm are 70.9, 73.2, and 0.23, respectively. The values of accuracy rate, false-positive rate, and kappa coefficient of mean shift algorithm are 74.1, 71.9, and 0.25, respectively. The values of accuracy rate, false-positive rate, and kappa coefficient of Chan–Vese algorithm are 67.1, 75.7, and 0.20, respectively. In contrast, the proposed algorithm only includes the detected cloud areas in the detection image. The values of accuracy rate, false-positive rate, and kappa coefficient of proposed algorithm are 95.3, 0.2, and 0.95, respectively. Obviously, the detection indexes of the proposed algorithm are the best.

Detection results contrast of the first raw image: (a) raw, (b) manual, (c) k-means, (d) mean shift, (e) Chan–Vese, and (f) proposed.
Figure 4 shows the second original image, the manual labeling cloud area and its cloud detection results using K-means, mean shift, Chan–Vese, and the algorithm proposed in this paper. It is shown in Figure 4 that the K-means, mean shift, and Chan–Vese algorithms often misjudge the non-cloud area with similar brightness to the cloud, while the test result of the proposed algorithm is closest to the manual labeled image and it takes much less misjudge as utilization both brightness and texture characters. The values of accuracy rate, false-positive rate, and kappa coefficient of K-means algorithm are 73.5, 68.2, and 0.34, respectively. The values of accuracy rate, false-positive rate, and kappa coefficient of mean shift algorithm are 67.1, 71.9, and 0.29, respectively. The values of accuracy rate, false-positive rate, and kappa coefficient of Chan–Vese algorithm are 76.7, 64.9, and 0.39, respectively. In contrast, the proposed algorithm only includes the detected cloud areas in the detection image. The values of accuracy rate, false-positive rate, and kappa coefficient of proposed algorithm are 93.6, 29.4, and 0.72, respectively. Obviously, the detection indexes of the proposed algorithm are the best.

Detection results contrast of the second raw image: (a) raw, (b) manual, (c) k-means, (d) mean shift, (e) Chan–Vese, and (f) proposed.
Figure 5 shows the third original image, the manual labeling cloud area and its cloud detection results using K-means, mean shift, Chan–Vese, and the algorithm proposed in this paper. It is shown in Figure 5 that the K-means, mean shift, and Chan–Vese algorithms often misjudge the non-cloud area with similar brightness to the cloud, while the test result of the proposed algorithm is closest to the manual labeled image and it takes much less misjudge as utilization both brightness and texture characters. The values of accuracy rate, false-positive rate, and kappa coefficient of K-means algorithm are 91.1, 17.3, and 0.80, respectively. The values of accuracy rate, false-positive rate, and kappa coefficient of mean shift algorithm are 90.3, 22.8, and 0.79, respectively. The values of accuracy rate, false-positive rate, and kappa coefficient of Chan–Vese algorithm are 91.9, 15.8, and 0.82, respectively. In contrast, the proposed algorithm only includes the detected cloud areas in the detection image. The values of accuracy rate, false-positive rate, and kappa coefficient of proposed algorithm are 97.4, 0.4, and 0.94, respectively. Obviously, the detection indexes of the proposed algorithm are the best.

Detection results contrast of the third raw image: (a) raw, (b) manual, (c) k-means, (d) mean shift, (e) Chan–Vese, and (f) proposed.
Figure 6 shows the fourth original image, the manual labeling cloud area and its cloud detection results using K-means, mean shift, Chan–Vese, and the algorithm proposed in this paper. It is shown in Figure 6 that the K-means, mean shift, and Chan–Vese algorithms often misjudge the non-cloud area with similar brightness to the cloud, while the test result of the proposed algorithm is closest to the manual labeled image and it takes much less misjudge as utilization both brightness and texture characters. But as some part of the Figure 6 is smooth with high reflection rate which is similar to the features of the cloud area, so all the algorithms take it as cloud. The values of accuracy rate, false-positive rate, and kappa coefficient of K-means algorithm are 91.8, 9.9, and 0.80, respectively. The values of accuracy rate, false-positive rate, and kappa coefficient of mean shift algorithm are 70.7, 48.9, and 0.45, respectively. The values of accuracy rate, false-positive rate, and kappa coefficient of Chan–Vese algorithm are 93.1, 5.6, and 0.83, respectively. In contrast, the proposed algorithm only includes the detected cloud areas in the detection image. The values of accuracy rate, false-positive rate, and kappa coefficient of the proposed algorithm are 95.1, 2.9, and 0.88, respectively. Obviously, the detection indexes of the proposed algorithm are the best.

Detection results contrast of the fourth raw image: (a) raw, (b) manual, (c) k-means, (d) mean shift, (e) Chan–Vese, and (f) proposed.
Tables 1 to 3 present the comparison of detection indexes of different algorithms for different images.
Accuracy rate.

False-positive rate.
Kappa coefficient.
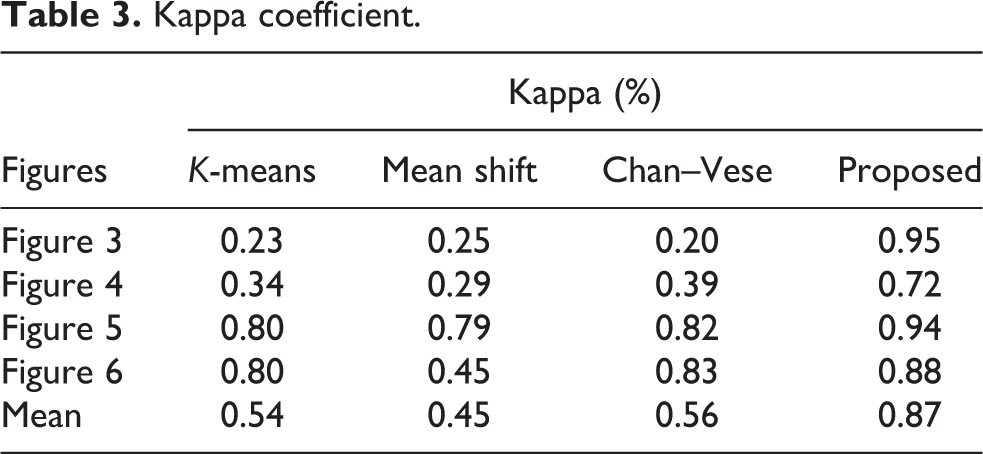
From Tables 1 to 3, we can see that the accuracy rate of the proposed algorithm is much higher and the false-positive rate is much lower than the other algorithms. Taking the kappa coefficient, we can see that the detection result of the proposed method is almost identical to the man judged and better than the other three obviously.
Conclusion
In this article, the brightness, hue, and texture difference of cloud and non-cloud area in high-resolution UAV images are utilized to put forward a general cloud detection algorithm. The simulation results show the high accuracy, low false-positive rate of the algorithm, and its high consistency to the manual judgment.
Footnotes
Declaration of conflicting interests
The author(s) declared no potential conflicts of interest with respect to the research, authorship, and/or publication of this article.
Funding
The author(s) received no financial support for the research, authorship, and/or publication of this article.