
Abstract
Accurately detecting the appropriate grasp configurations is the central task for the robot to grasp an object. Existing grasp detection methods usually overlook the depth image or only regard it as a two-dimensional distance image, which makes it difficult to capture the three-dimensional structural characteristics of target object. In this article, we transform the depth image to point cloud and propose a two-stage grasp detection method based on candidate grasp detection from RGB image and spatial feature rescoring from point cloud. Specifically, we first adopt the recently proposed high-performance rotation object detection method for aerial images, named R3Det, to grasp detection task, obtaining the candidate grasp boxes and their appearance scores. Then, point clouds within each candidate grasp box are normalized and evaluated to get the point cloud quality scores, which are fused with the established point cloud quantity scoring model to obtain spatial scores. Finally, appearance scores and their corresponding spatial scores are combined to output high-quality grasp detection results. The proposed method effectively fuses three types of grasp scoring modules, thus is called Score Fusion Grasp Net. Besides, we propose and adopt top-k grasp metric to effectively reflect the success rate of algorithm in actual grasp execution. Score Fusion Grasp Net obtains 98.5% image-wise accuracy and 98.1% object-wise accuracy on Cornell Grasp Dataset, which exceeds the performances of state-of-the-art methods. We also use the robotic arm to conduct physical grasp experiments on 15 kinds of household objects and 11 kinds of adversarial objects. The results show that the proposed method still has a high success rate when facing new objects.
Introduction
Recently, robots play an important role in logistics, factories, medicals, and other fields. Among all functions of the robot, the grasp ability is the basis for robot to complete complex tasks such as packing, sorting, and feeding, which has gradually attracted the attention of academia and industry. The procedure of robotic grasp usually includes grasp detection, manipulator path planning, and grasp execution. Among them, high-quality grasp detection is the key to the success of grasp execution, and unreliable grasp detection result is likely to lead to the failure of the whole task. The rise of deep learning provides a new way for robotic grasp research, and the performances of grasp detection methods are gradually improved. Particularly, the Amazon Picking Challenges, 1 –3 held since 2015, greatly promoted the research upsurge of robot grasping detection technology. Most of the winning solutions adopted a composite grasp solution combining vacuum suction cups and parallel jaw grippers. The vacuum suction grasp model is simple and practical, but it has limitations when facing objects with complex shapes or furry surfaces. The parallel jaw gripper-based method can make up for this defect and is worthy of in-depth research. Previous grasp detection methods 4 –6 often use RGB image or a combination of RGB image and depth image, which have achieved good results on the Cornell Grasp Dataset. 7 However, when facing transparent or highly reflective objects, the quality of RGB image is poor and the depth image has many invalid points. In such scenarios, convolutional neural networks cannot extract effective appearance and spatial features, and the detection results of existing algorithms are usually not ideal. Besides, existing methods use rectangle metric 8 to evaluate their accuracy, in which only the detection result with the highest confidence score is selected for evaluation. If the output high-confidence grasp result executes unsuccessfully during actual grabbing, the entire grasp system is likely to fall into an infinite loop of grasping the fixed position. Therefore, a more comprehensive grasp evaluation measurement needs to be designed for the actual grasp condition of manipulator.
To address the above issues, we propose a novel two-stage grasp detection method fully utilizing the characteristics of RGB and point cloud information. We first get grasp candidates and their appearance scores from RGB images by introducing and improving the R3Det
9
algorithm to grasp detection area, establishing candidate grasp detection network. Then, we calculate the spatial scores from point clouds within each grasp candidates by establishing grasp point cloud scoring network that comprehensively considers the quantity and quality of point clouds. Finally, appearance scores and spatial scores are fused, according to which grasp candidates are reordered. Moreover, in order to evaluate the reliability of the grasp detection method more comprehensively, we conduct an overall evaluation of the algorithm based on multiple grasp detection results. Our main contributions can be summarized as follows: The high-performance rotation object detection method for aerial images, named R3Det, is introduced to the field of grasp detection for the first time, and the adaptability of the algorithm is improved according to the requirements of the task. Point clouds quantity is for the first time considered in spatial feature scoring, and we propose grasp point cloud scoring network that comprehensively considers the number and quality of the point cloud. A two-stage grasp detection method called Score Fusion Grasp Net (SFGNet) that combines the appearance features of RGB image and the spatial features of point cloud is proposed. SFGNet exceeds all code available state-of-the-art methods on Cornell Grasp Dataset, and code will be available soon. In response to the actual grasp requirements of the manipulator, we design a new grasp evaluation metric that can effectively evaluate the grasp accuracy of single target.
The other parts of this article are organized as follows: The second section introduces related work; the third section gives a formal description of the grasp detection problem; the fourth section introduces the specific details of the proposed method; the fifth and sixth sections respectively verify the validity of the proposed method from the two aspects of data set and physical experiment; the seventh section draws the main conclusions.
Related work
In this section, we will briefly review the work related to robot grasping detection technology, which can be roughly divided into three types: empirical methods, analytical methods, and detection-based methods.
Empirical methods usually generate grasp positions on known models through physical analysis or virtual environment simulation, and then store these grasp positions and their corresponding models as a database. For the objects in the actual grasp scene, the corresponding grasp configuration is generated by searching for the most similar model in database. Vahrenkamp et al. 10 proposed a part-based grasp planning method. This method first segmented the target into parts with different grasp labels and semantic information according to the geometric shape and category, and then used the grasp transformation measurement method to evaluate the probability that grasp tags can be successfully implemented, and finally output the grasp tag with the highest probability. Tian et al. 11 first segmented the target in 3D according to the geometric shape and semantic features, and then established the corresponding relationship between the current target and the various parts of the sample, and finally selected the current target’s grasp position by the grasp results calculated on the sample. Empirical methods can often generate reliable grasp configurations with a higher success rate when the object type is fixed in the scene, but the generalization performance is poor when facing unknown objects. In addition, 3D models for flexible objects and nonstandard objects are usually difficult to obtain, which limits the development of empirical methods.
Analytical methods usually first obtain candidate grasp positions according to geometric analysis, mechanical analysis, or model reasoning, and then establish a deep neural network model to extract the features of the grasp position and scores the grasp reliability, and finally select the candidate with the highest score as result. DexNet 12 –14 first conducted geometric antipolarity analysis on point cloud data to obtain candidate grasp positions, and then established grasp quality convolutional neural network (GQ-CNN) to score the confidence of grasp locations, and finally selected the candidate with the highest confidence as the final grasp position. PointNetGPD 15 used object surface grasp point sampling and PointNet 16 to realize the generation of candidate grasp positions and the evaluation of the grasp quality of point cloud in candidate grasp boxes, respectively. The accuracy of analytical methods is relatively high. However, in order to ensure the grasp quality, it is usually necessary to output a large number of candidate grasp positions involving complex 3D geometric analysis or physical analysis, which is difficult to implement and has high computational complexity.
Detection-based methods use the neural network as a fitter to directly estimate the parameters of the grasp position from the point cloud or image. This kind of method is simple and easy to implement, thus it has gradually become the mainstream method in grasp detection area. Most of these methods take the grasp detection as a special target detection task to complete and select the grasp location by detecting grasp boxes on the RGB-D or RGD image. REGNet 17 first used PointNet to segment the point cloud from which candidate grasp points were selected, and then point cloud data around the grasp points were input into the network for classification and regression, followed by refining the initially generated grasp position according to the point cloud in gripper closing area to obtain the final grasp result. Redmon and Angelova 8 used AlexNet 18 to divide an image into multiple regions and predicted a grasp box for each region. The grasp box with the highest confidence score was selected as the final result, achieving 88% image-wise (IW) accuracy on Cornell Grasp Dataset. Kumra and Kanan 5 used ResNet 19 as the backbone network for extracting image features and added another ResNet branch to extract the features of the depth map in parallel. The features of the depth map and the features of the RGB image were merged to improve model accuracy. Chu et al. 4 used Faster-RCNN, 20 a method in object detection, as the detection framework and converted the angle regression problem to a classification problem which divided the grasp box from different angles into different angle types. This method reduced the difficulty of angle regression for grasp detection, achieving 96% IW accuracy on Cornell Grasp Dataset. Zhang et al. 6 introduced the rotation anchor box to grasp detection problem and used a new positive and negative sample allocation strategy to train the network, which accelerated the training speed of the entire network. Kumra et al. 21 used ResNet and deconvolutional network to generate a grasp quality map and a grasp parameter map with the same size as the original image and filtered the final grasp center point and grasp parameters based on the two maps. However, existing detection-based methods treated point cloud as depth images, losing the 3D spatial geometric information near the grasp position, thus performed unsatisfactory when facing transparent objects or highly reflective objects, such as glass bottles and scissors.
The proposed method combines the advantages of detection-based methods and analytical methods. Our method draws on the idea of detection-based methods to obtain a small number of relatively reliable candidate grasp positions from RGB image, avoiding the implementation difficulties and high computational complexity of analytical methods when generating candidate grasp positions. Meanwhile, our method makes full use of the advantages of the higher accuracy of analytical methods, and further integrates the appearance features of RGB image and the spatial features of point clouds to improve the effectiveness of grasp candidate evaluation. In addition, we introduce the latest R3Det to grasp detection task, establish a point cloud quantity evaluation model and introduce it to analytical methods, and propose the top-k grasp metric to achieve multidimensional grasp quality evaluation, which enriches grasp detection technology at multiple levels.
Problem formulation
This article focuses on obtaining the grasp detection results in image coordinate system from RGB image and point cloud information. We use the five-dimensional representation proposed by Jiang et al. 22 to formulate a grasp result g detected from the image, which can be described as

where
In the physical experiment, it is necessary to obtain the grasp detection result G in world coordinate system, which can be described as

where
Method
In this section, we will firstly introduce the overall architecture of the proposed method called SFGNet, and then elaborate on the two main modules which are candidate grasp detection network and grasp point cloud scoring network. In the end, we will give the motivation and calculation process of the proposed top-k grasp metric.
Overall architecture
Figure 1 shows the overall architecture of SFGNet. SFGNet firstly uses the candidate grasp detection network to obtain the grasp candidates and its appearance feature score vector for scene object from the RGB image, and then get the spatial feature score vector from point cloud within grasp candidates by grasp point cloud scoring network. Finally, it merges the appearance and spatial scores to reorder the candidate grasps, and output k high-quality grasp detection locations with the highest fusion scores.

The overall architecture of SFGNet.
Candidate grasp detection network
Given an input image

Among them,
Grasp point cloud scoring network
For a depth image, we convert it to point cloud data format

In which,
Grasp detection combining appearance and spatial scores
The fusion of appearance feature scores and spatial feature scores is expected to more accurately evaluate the quality of candidate grasps. We assume that high-quality grasp results must have high appearance and spatial scores at the same time, thus the fusion rules adopted are as follows

where
Candidate grasp detection network
The candidate grasp detection network is modified from R3Det 9 for grasp detection task, and its network structure is shown in Figure 2. For a given input image I, we firstly use backbone network (ResNet50 + FPN) to get feature maps of three levels denoted as P3, P4, and P5, which are then processed individually to get grasp box regression results at different scales. For each feature map, we firstly use anchor box prediction module to obtain the regressed grasp boxes and appearance feature scores for every rotation anchor box at each position. After that, the best regressed grasp box at each position among all rotation anchor boxes is selected according to appearance feature scores, and feature reconstruction module is followed to obtain the enhanced features which contain the information of the target center and the four corner points of the best regressed grasp box. On this basis, the refined prediction module is further used to obtain optimized grasp box regression results and their appearance feature scores. In the end, the m candidate grasp boxes with the highest optimized appearance feature scores from all the hierarchical prediction results will be saved as grasp candidates.
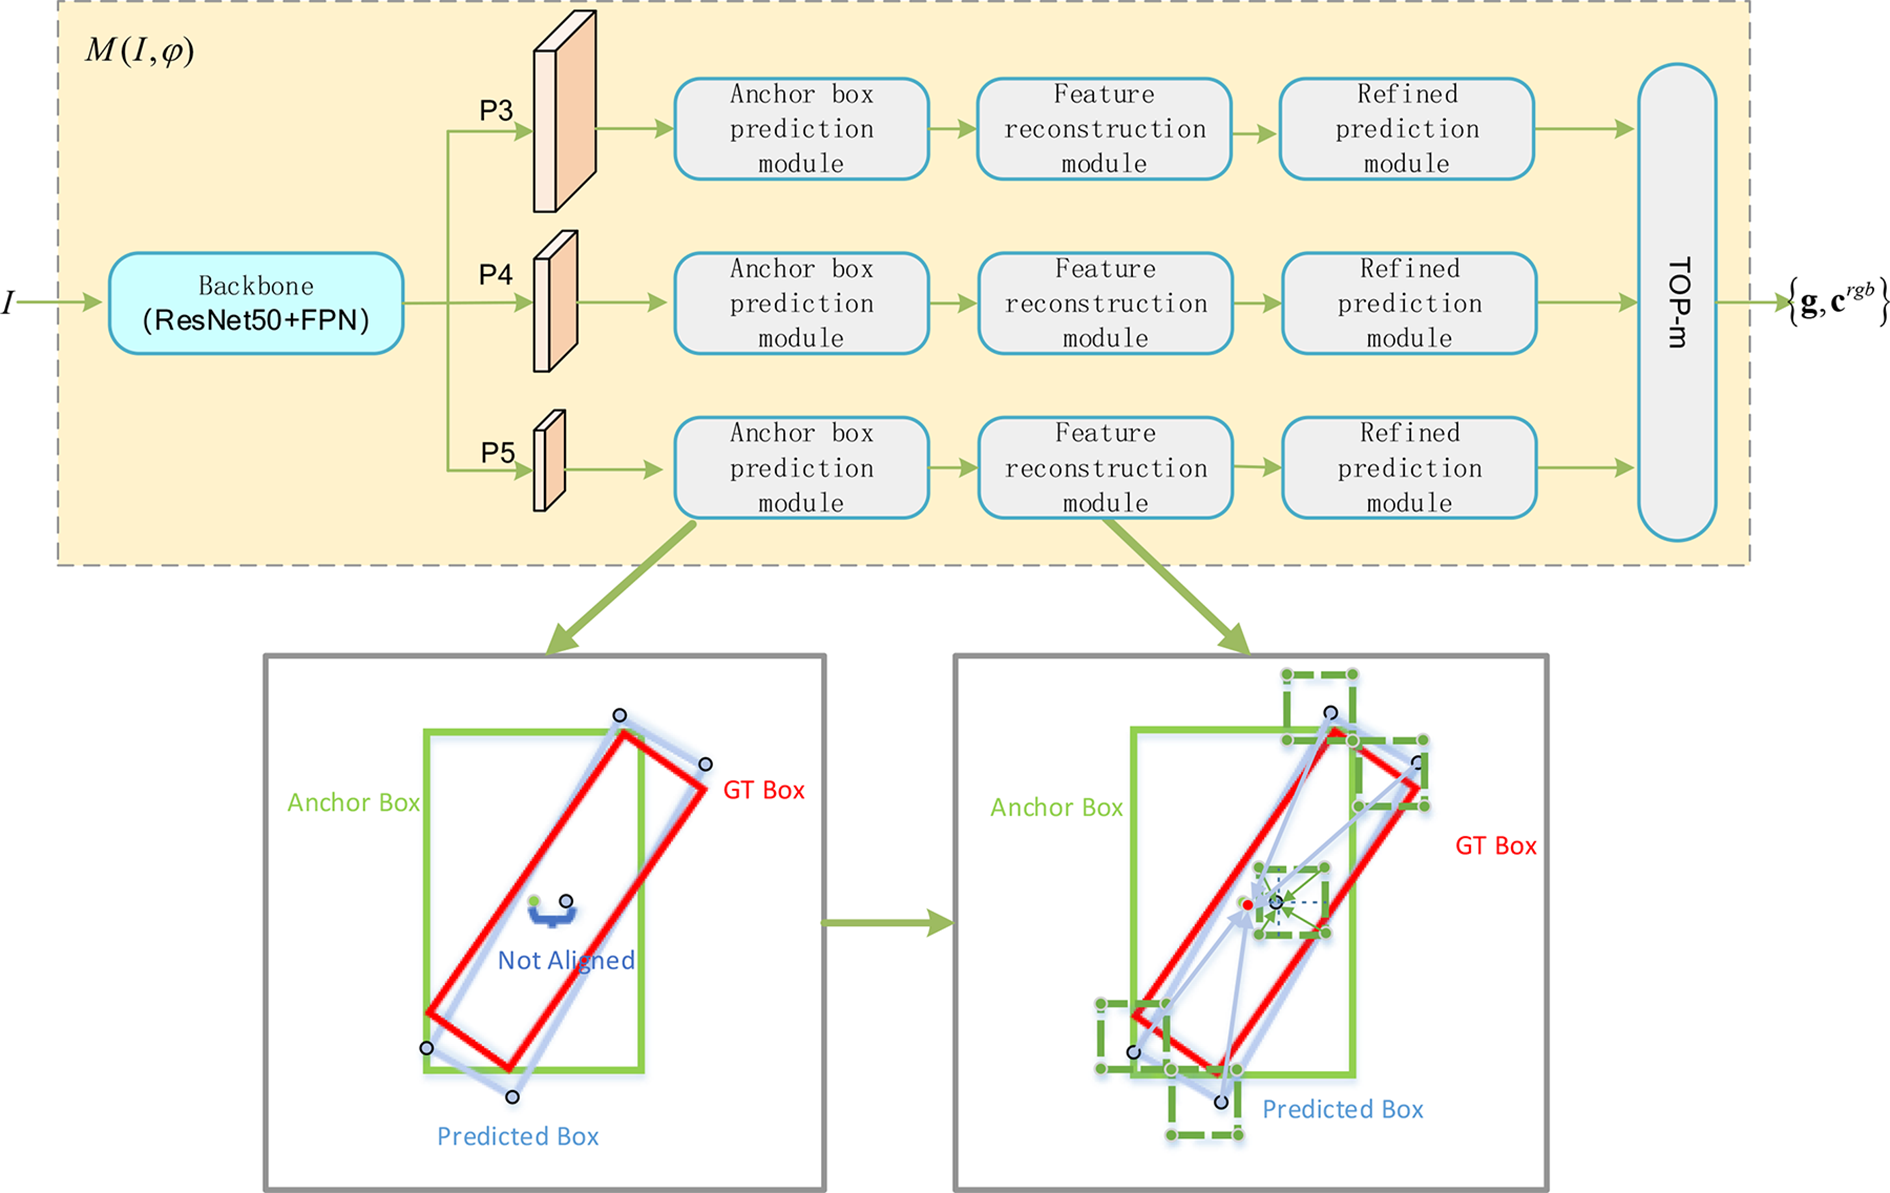
The architecture of candidate grasp detection network.
Anchor box prediction module
Considering that the opening width of the parallel jaw gripper and the gripper length are usually fixed, the aspect ratio of all anchor boxes is set to be 1:1 in this article. Based on the excellent performance of rotation anchor box,
6
we set three rotation anchor boxes with different angles as
Feature reconstruction module
Due to the misalignment between the center position of anchor box and the center position of grasp box (as shown in Figure 2), the accuracy of the output result which is predicted directly by anchor box prediction module is not high. For each position, only the prediction result with the highest appearance feature score among all rotation anchor boxes will be retained for reconstructing the feature map, obtaining five-channel grasp box offset map and two-channel appearance feature score map. Then, we use bilinear interpolation to calculate the aligned features at the four corner points and the center point of the predicted grasp box, and add them to the feature at anchor point to obtain a refined P3/P4/P5 feature map, improving the feature representation ability of candidate grasp detection network.
Refined prediction module
Based on the refined P3/P4/P5 feature map, we respectively establish the grasp box regression prediction branch and appearance feature score prediction branch to obtain the refined grasp box regression results and appearance feature score results. Specifically, we predict the five-dimensional anchor box offset parameter and the two-dimensional classification probability for each position, obtaining the five-channel grasp box offset map and the two-channel appearance feature score map after feature alignment. Finally, we select top-m refined grasp box offsets with the highest appearance feature scores from all levels and positions as the output candidate grasps. Denote the acquired five-channel grasp box offsets as

where
Network training
We use SmoothL1 loss of the grasp box offset map and cross-entropy loss of the appearance feature score map to train candidate grasp detection network end-to-end base on Cornell Grasp Dataset.
7
We execute data augmentation by taking a center crop of 320 × 320 pixels with randomly translation up to 50 pixels in both x and y directions. This image patch is then randomly rotated up to 180° in both clockwise and anticlockwise direction. The whole network is trained for 30 epochs. In order to meet the needs of intensive prediction, only the loss of positive samples is considered in training. The existing positive sample allocation rule is that the Intersection over Union (IoU) of anchor box and ground truth box is greater than 0.25, but we found that this strategy increases the difficulty of angle regression. Since three rotation anchor boxes each of which has a coverage of
Grasp point cloud scoring network
Grasp point cloud scoring network is designed to score the spatial features of point clouds within candidate grasps. The network structure is shown in Figure 1. Based on the point cloud data
Point cloud quantity scoring module
Based on the correspondence between point cloud data and image pixels, point clouds within candidate grasps can be obtained by tailoring the whole point cloud data. Since the size of the candidate grasp boxes are different and the distribution of invalid point clouds are unevenly distributed, the number of point clouds within candidate grasps are different, denoted as
1. Linear saturation model (LSM), that is, when the number of point clouds is less than N, it is in line with the linear relationship, and when it is greater than N, it is saturated. LSM can be formulated as

where
2. Gate bias model (GBM) in which the point cloud quantity score is centered on N and decays or increases at an exponential speed. GBM can be expressed as

where

Function curves of point cloud quantity scoring modules.
Point cloud quality scoring module
In order to score the quality of point cloud data with different quantities, the cropped point cloud data need to be normalized to a fixed number as N firstly (256 in this article). For the case where the number of point clouds is less than N, we generate virtual point clouds by randomly sampling point cloud pairs and then interpolating between them. For the case where the number of point clouds is greater than N, we directly use random sampling to remove redundant point clouds. Given the normalized point cloud data, we use PointNet
16
to extract the local features of each sampling point with rotation invariance, and then obtain the global features of the point cloud set through the maximum pooling layer. Finally, multilayer perceptron with softmax activation function is followed to output the point cloud quality score
Spatial feature score integrating the quantity and quality scores
Combining the point cloud quantity score and the point cloud quality score is expected to achieve a more accurate spatial feature score for grasp evaluation, and the fusion rule adopted is as below

Network training
We use the inference results of the candidate grasp detection network to generate training data for grasp point cloud scoring network, totally getting about 290,000 positive samples and 160,000 negative samples. Since some of the training samples are similar, we downsample the training data to avoid over-fitting of the network, and finally retain about 150,000 positive samples and 90,000 negative samples. The acquired training data is divided into training set and validation set according to the ratio of
Top-k grasp metric
Existing works usually use rectangle metric
8
to evaluate the grasp accuracy for the detection result with the highest confidence score. In rectangle metric, a predicted grasp is regarded as a correct detection result if it satisfies: (1) The IoU of the ground-truth grasp and the predicted grasp is larger than 25%; (2) the rotation angle difference between the predicted grasp and the ground-truth grasp is below

In actual applications, there may be cases where the predicted grasp is regarded as correct according to the labeled data set while the grasp execution fails in the real world. At this time, if a single grasp detection result is output, the entire grasp system may fall into an endless loop of grasping the same fixed position. Therefore, in order to evaluate the grasp algorithm more comprehensively, one may output k highest-scoring grasps to calculate the average accuracy, denoted as

By averaging the average precision, top-k grasp metric realizes the enhancement of grasps with higher scores. We can see that existing rectangle metric is a special case of the top-k grasp metric
Data set validation experiment
Grasp data set and evaluation metric
We conduct grasp detection result evaluation on Cornell Grasp Dataset
7
to verify the effectiveness of the proposed method. Cornell Grasp Dataset is captured by RealSense camera, which contains 885 pictures of RGB images and their corresponding point cloud data under various scenes and involves more than 240 targets with different poses. Each picture is manually labeled to give several ground-truth graspable locations and ungraspable locations. Like previous works, we divide the data set into training set of 708 images and test set of 177 images in two different ways: Image-wise: IW split randomly divides all the images in the data set into training set and test set, which is helpful to test the comprehensive generalization ability of the network for different positions, postures, backgrounds, and object types. Object-wise: object-wise (OW) split divides the data set at object instance level. All the images of the same instance are put into the same set. This aims to test the generalization ability of the network to new object.
In terms of evaluation metrics, in addition to the commonly used methods of grasp accuracy, IoU thresholds stability analysis and angle difference thresholds stability analysis, we also use the proposed top-k grasp metric to evaluate the accuracy and stability of the model.
Ablation study
This subsection will conduct ablation experiments under various conditions to analyze the effectiveness of the proposed method. We first evaluate the effect of the proposed method with different score fusion fashions, then do the algorithm’s stability analysis on different IoU thresholds and angle difference thresholds, and finally verify the effectiveness of the proposed method based on the proposed top-k grasp metric.
Evaluation of score fusion methods
We experiment with a variety of score fusion methods which may affect the accuracy of the model, and the experimental results are shown in Table 1. In terms of spatial feature scoring, the model without using point cloud quantity scoring module only improves the IW accuracy and OW accuracy by up to 0.6% and 1.5%, respectively. Experiments on different point cloud quantity scoring module show that LSM is significantly better than GBM, indicating that increasing the score after the number of point clouds is greater than the sampling value will bring negative effects. The proposed LSM module improves the IW accuracy and OW accuracy by up to 4.1% and 5.5% respectively, which shows the great significance and necessity of scoring the number of point clouds. In terms of the appearance and spatial score fusion method, we test addition fusion besides the proposed Hadamard product fusion. Results show that the model with addition fusion also improves the IW accuracy and OW accuracy by up to 3.0% and 3.6% respectively, indicating that the fusion of appearance and spatial score can significantly improve the grasp detection accuracy of the proposed method. Besides, the improvements of OW accuracy are always higher than those of IW accuracy, indicating that score fusion can improve the generalization ability of the model for unknown types of objects. Based on the above experiments, the point cloud quantity scoring model in the subsequent experiments of this article adopts LSM, and the fusion method adopts Hadamard product fusion.
Accuracy of different score fusion methods on Cornell Grasp Dataset.a

a Results show that combining point cloud quantity scoring model of LSM and fusion method of Hadamard product achieves the best results.
The bolded result is the best result in the same group.
IoU threshold condition evaluation
In order to evaluate the influence of Jaccard threshold on stability of the proposed method, we conduct an ablation experiment of integrating the spatial score under different Jaccard threshold evaluation conditions. The experimental results are shown in Table 2. For the convenience of presentation, we abbreviate the model that only uses appearance feature score as the basic method, and the model that integrates appearance feature score and spatial feature score as the fusion method (the same below). The results show that the accuracy of the fusion method significantly exceeds that of the basic method under all Jaccard threshold on both IW and OW, which proves the effectiveness of integrating the proposed spatial feature score under different Jaccard thresholds. In addition, we can see that the accuracy improvements of the fusion method increase together with IoU thresholds. The more stringent IoU thresholds are, the higher accuracy improvements achieves. The accuracy improvements of the fusion method under 35% Jaccard threshold reach 5.9% and 6.6% on IW and OW, respectively, indicating that the fusion method tends to choose the candidate grasp location with higher regression accuracy, which verifies that the fusion score can better reflect the reliability and quality of the grasp location.
The evaluation results of the proposed method on the Cornell Grasp Dataset under different Jaccard threshold conditions.a

a The results show that the fusion method exceeds the basic method under all Jaccard coefficient indicators, and improvements of the fusion method are higher under more stringent indicators.
The bolded result is the one with the maximum improvement in the same group.
Angle difference threshold condition evaluation
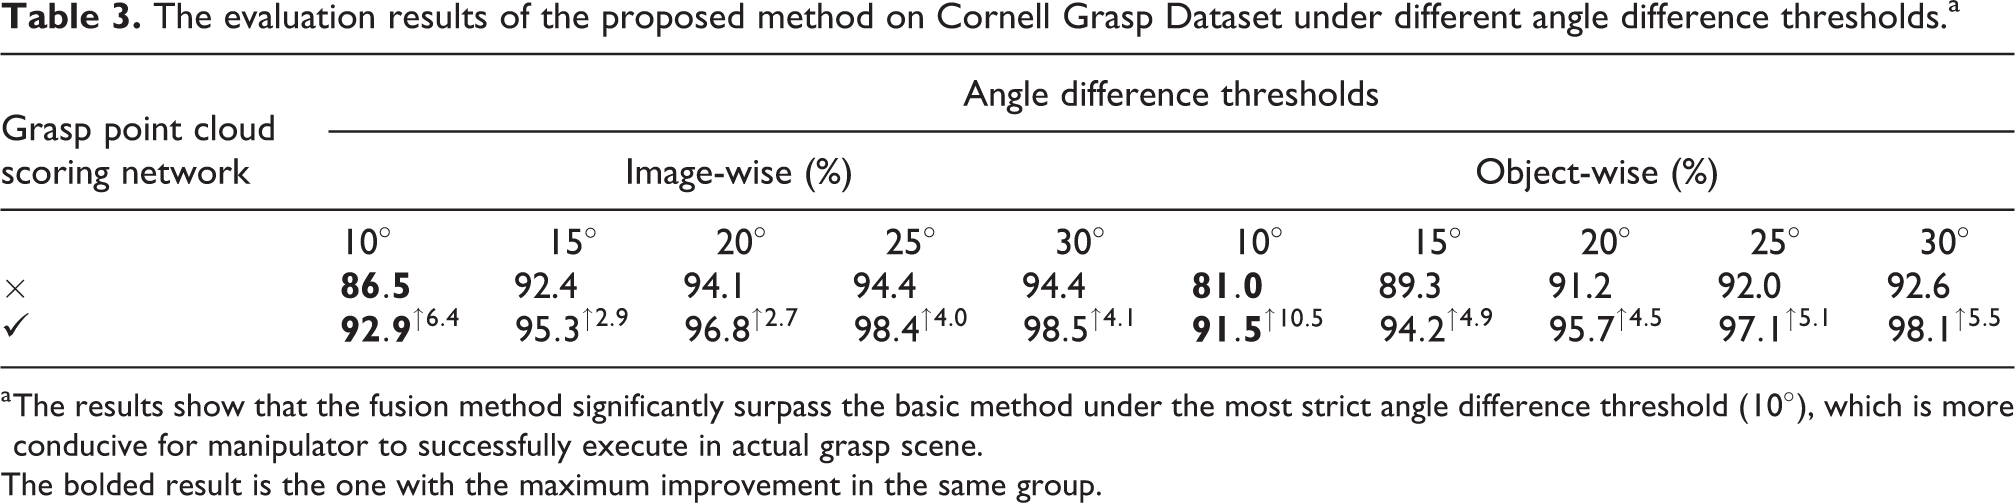
Some previous works have shown that when using rectangle metric to evaluate the accuracy of model, the angle difference threshold will greatly affect the evaluation result. Moreover, physical analysis and manipulator experiments also indicate that accurate angle estimation plays an important role in the success of grasp execution. Therefore, we not only evaluate the accuracy of the proposed method under different IoU threshold conditions but also test the results of the proposed method under different angle difference thresholds. The experimental results are shown in Table 3. It’s obvious that the fusion method significantly exceeds the basic method under all the angle difference threshold conditions on both IW and OW accuracy, which proves the effectiveness of integrating the proposed spatial feature score under different angle difference threshold conditions. In addition, the accuracy of the fusion method on both IW and OW increases the most when the angle difference threshold is 10°, reaching 6.4% and 10.5%, respectively. This indicates that the fusion method tends to choose more credible candidate grasp box, and able to obtain stable detection results under a more stringent angle difference threshold, which is more conducive for manipulator to successfully execute grasp in real grasp scene.
The evaluation results of the proposed method on Cornell Grasp Dataset under different angle difference thresholds.a
a The results show that the fusion method significantly surpass the basic method under the most strict angle difference threshold (
The bolded result is the one with the maximum improvement in the same group.
Top-k grasp metric evaluation
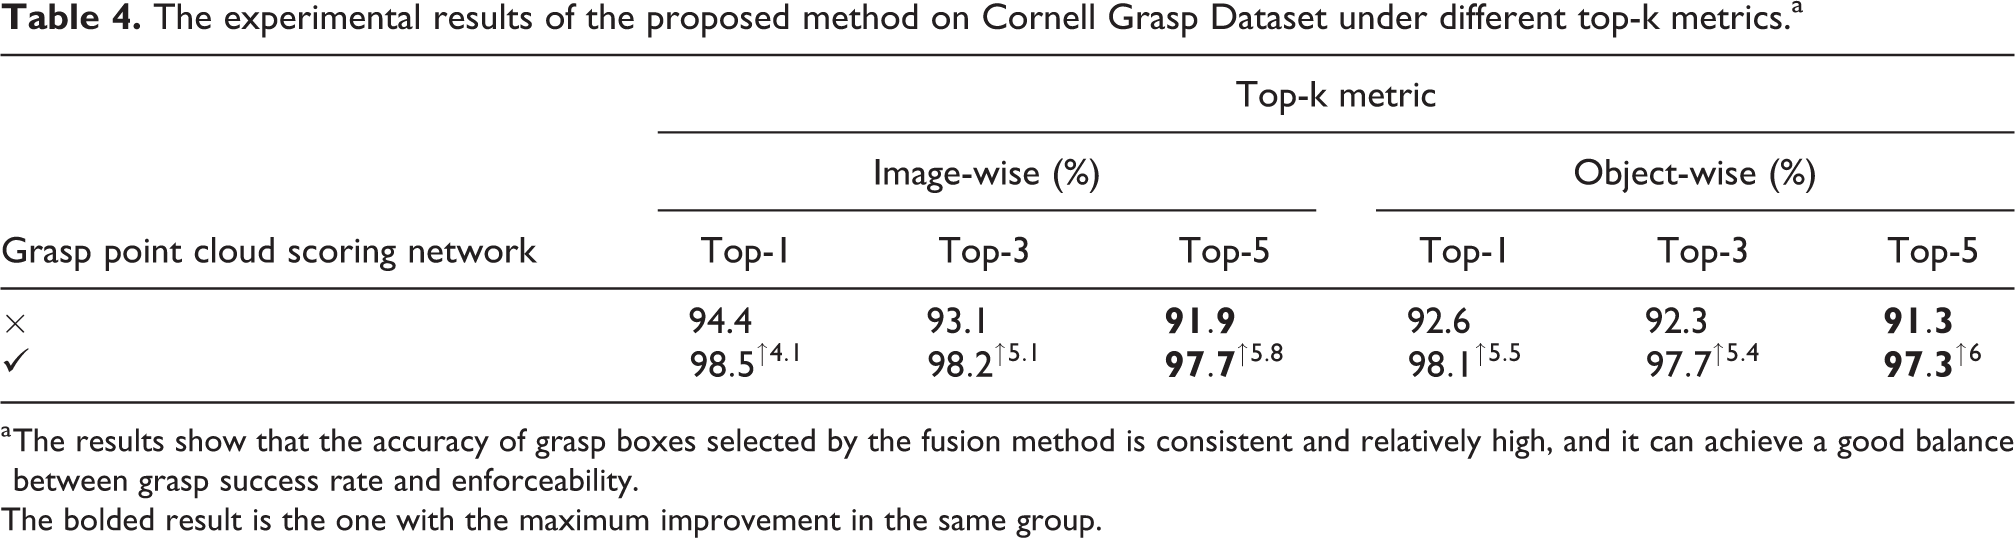
The above experiments only evaluate the optimal grasp result output by the model. However, we usually need to output 3 to 5 high-quality grasp results to avoid falling into an infinite loop of grasping the same position in the physical grasp experiment. To this end, we use the proposed top-k grasp metric to evaluate the model, and the experimental results are shown in Table 4. It’s obvious that the accuracy of the fusion method significantly exceeds the basic method under multiple indicators, which proves the effectiveness of the fusion method in actual scene which requires multiple effective outputs. Besides, the IW and OW accuracy of the fusion method under the top-5 index has the largest improvement, increasing by 5.8% and 6%, respectively. This means that the accuracy of the grasp results selected by the fusion method are generally higher, that is, the fusion score can more accurately responses to the graspable possibility of grasp location.
The experimental results of the proposed method on Cornell Grasp Dataset under different top-k metrics.a
a The results show that the accuracy of grasp boxes selected by the fusion method is consistent and relatively high, and it can achieve a good balance between grasp success rate and enforceability.
The bolded result is the one with the maximum improvement in the same group.
In order to intuitively show the effect of integrating the proposed spatial feature score, we visualize the detection results of some image samples, as shown in Figure 4. The visualization results show that the basic method has obviously unreasonable grasp detection results in shoes (first column), earphones (third column), and spoon (fifth column). It’s obvious that the fusion method effectively suppresses those false detection results of the basic method and meanwhile selects a set of grasp boxes with higher accuracy, indicating that the integrating the proposed spatial feature score can evaluate the graspable probability of candidate grasp results more accurately, thereby outputting more stable grasp positions.
Finally, in order to explicitly indicate which areas of the item our method is more likely to produce detection results, we visualize the heatmap of the detection results of the method on some items in data set according to the distribution of the detection result center on the image and its confidence score, as shown in Figure 5.

Visualization of grasp detection results of typical objects (basic method for the first row; fusion method for the second row).

Visualization of grasp detection heatmap (RGB image for the first row; heatmap for the second row).
Comparison with SOTA
We select and compare the performances of several representative SOTA grasp detection methods with that of the proposed method on the Cornell Grasp Dataset. The results are shown in Table 5. The methods involved in the comparison include RGB group represented by MultiGrasp, 8 ZF-net, 23 FCGN 6 and RGB-D group represented by SAE, 24 Multi-Modal Grasp, 5 GraspNet, 25 Multi-object Multi-grasp, 4 GR-ConvNet. 21 We refer to the proposed methods as “SFGNet w/o score fusion” and “SFGNet” according to whether grasp point cloud scoring network is used or not, which belong to RGB group and RGB-D group, respectively. It is worth noting that most methods in RGB-D group are open-source and are more widely used.
Comparison of evaluation results between the proposed method and other SOTA methods.a

a The bolded result is the best result in the same group, and the underlined result is the suboptimal result in the same group.
It can be clearly seen from Table 5 that SFGNet has achieved the highest IW accuracy and OW accuracy in RGB-D group, realizing the new SOTA, while having acceptable time efficiency. Although “SFGNet w/o score fusion” only achieves suboptimal results in RGB group, its accuracy is greatly improved compared with the open-source method MultiGrasp in the same group, and the accuracy of “SFGNet w/o score fusion” is just slightly lower than the unreleased FCGN model but has the highest inference speed in the same group. Meanwhile, the accuracy of our reproduced FCGN model is not as good as “SFGNet w/o score fusion”, and the FCGN model uses the ResNet101 backbone network with more parameters, so the computational efficiency is low. Therefore, it is necessary and beneficial to introduce and adopt the recently proposed high-performance visual rotation object detection method R3Det to grasp detection area.
More importantly, the proposed grasp point cloud scoring network in SFGNet can be easily used as a plug-in module with other methods in RGB group. By replacing the candidate grasp detection network with a better open-source algorithm in RGB group, SFGNet can achieve a better performance.
Robot experiment
Experiment setup
In physical experiment, we use a RealSense D415 depth camera to capture the RGB image and the corresponding depth image of the area where the object to be grasped is located, and it is easy to convert the depth image to the point cloud data which is corresponding to the captured scene. D415 consists of two image sensors, a depth sensor and an infrared transmitter. The camera is installed on a fixed bracket outside the robotic arm to shoot targets within the graspable range of the robotic arm. The experiment platform is a 4-DOF DOBOT magician manipulator arm, and the execution end is a two-finger grasp clamp to perform grasping actions. SFGNet is deployed on a server with two GeForce GTX 1080 Ti graphics cards through ROS. The server system is Ubuntu 16.04, the CPU unit is Intel Core i7-6850K clocked at 3.60 GHz, and the CUDA version is 10.2.
Experiment objects
To verify the performance of the proposed method in actual grasp scenes and when facing adversarial samples, we conduct a physical grasp experiment on robot arm and compare it with the previous works. The experiment objects include two categories: (1) household objects and (2) adversarial objects. The collection of household objects includes 15 types of objects selected from daily life, and that of adversarial objects consists of 11 types of 3D printed objects with abstract geometric shapes.
Household objects
We select total of 15 types of household objects to test the proposed method. Household object set is mainly composed of metal spoons, scissors, tweezers, and other items with high reflection or complex geometric shapes. For all the household objects, we carry out a grasp test for each item under 10 different positions and postures, that is, we conduct a total of 150 grasp attempts on the collection of household objects to verify the generalization ability of the model in face of new common items. Figure 6(a) shows the collection of household objects we selected.

The collection of selected household objects (a) and adversarial objects (b).
Adversarial objects
The adversarial object set consists of 11 types of 3D printed objects of different shapes. These 3D printed objects have a relatively abstract geometric shape, which makes it difficult for detection model to perceive the grasp position of the object. For all the adversarial objects, we conduct grasp tests on each adversarial object under 10 different angles and positions, that is, we conduct a total of 110 grasp attempts on the adversarial object set to verify the generalization ability of the model when facing of new items of the adversarial sample. Figure 6(b) shows the collection of adversarial objects we selected.
Experimental results
The robotic arm has successfully grasped 139 times out of all 150 grasp attempts for 15 kinds of household objects, which obtains 90% accuracy. In the mean time, it has successfully grasped 96 times out of all 110 grasp attempts for 11 kinds of adversarial objects with 87.3% accuracy. Since few previous methods carry out physical grasp experiments on both household objects and adversarial objects, we select several methods that conduct actual grasp experiments on household objects for comparison, and the results are shown in Table 6. It should be noticed that there are differences in experimental objects and test conditions between these method and the proposed method, thus the experiment data of the comparison method are all taken from their corresponding papers. For example, SAE 24 and Multi-object Multi-grasp 4 differ in the grasp accuracy on Cornell Grasp Dataset by more than 20%, while the physical grasp accuracy reported in the papers is the same. Therefore, the data under different experimental conditions are only for reference. The results show that SFGNet has good generalization performance when facing new household objects. Besides, SFGNet don’t show a significant performance degradation when facing specially designed adversarial objects, which proves that the proposed method is still effective in the face of adversarial objects. Figure 7 shows a successful grasp example of adversarial object.
Physical grasp experimental results.a
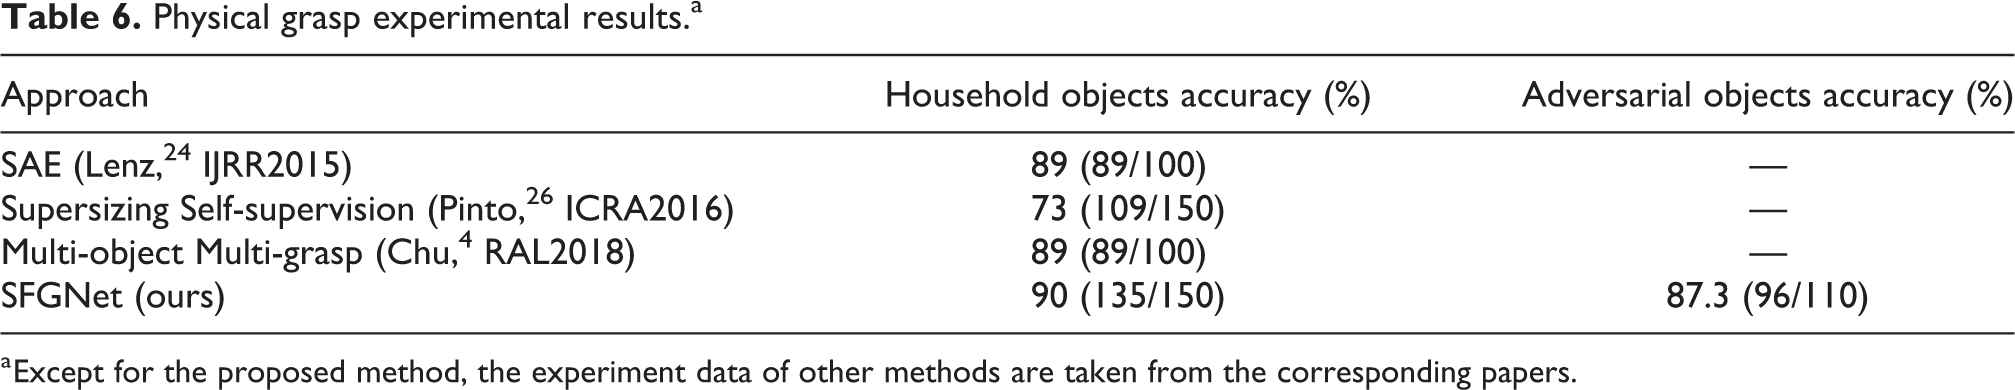
a Except for the proposed method, the experiment data of other methods are taken from the corresponding papers.

An example of grasping an adversarial object.
Analysis of results
There are three kinds of failure cases in the physical grasp experimental results: algorithm detection failure; slipping or not clamping during the grasp process; grasp failure due to the insufficient maximum opening width of the grasp clamp. Among all the cases, the most frequently failed one is a cup in adversarial objects. The proposed method often produces a larger grasp width when detecting the grasp position of the cup. As a results, the grasp clamp of manipulator cannot be opened to the width, which will lead to failed grasp.
At last, we visually analyze the impact of top-k grasp metric and rectangle metric 8 to show their differences for grasping the same target in the physical experiment. Figure 8 shows a visual analysis result. The result indicates that if we use rectangle metric to evaluate the detection results, we only output a failed detection result with the highest confidence on the target, which may cause the robotic arm to fall into an endless loop of continuously grasping this position. By comparison, the top-k metric evaluation outputs k candidate grasp positions and comprehensively considers their influence on the actual grasp success probability, which can avoid the infinite loop of continuously grasp a single fixed position, thereby realizing multi-dimensional evaluation of model performance.

The left image is the visualization of top-k detection result, and the image on the right is the visualization of the highest confidence detection result.
Conclusion
We propose a novel two-stage grasp detection method based on visual rotation object detection and point cloud spatial feature scoring. Our proposed method achieves the reliable evaluation of candidate grasps by fusing the appearance feature score and the spatial feature score. What’s more, the proposed point cloud scoring network used for fusion is universal and can be combined with any RGB-based grasp detection method to further improve the performance of the model. We evaluate the performance of the proposed method on Cornell Grasp Dataset, and the results show that the proposed method achieves the new SOTA performance. In addition, we also use a robotic arm to conduct physical grasp experiments, and the results show that the proposed method has a high accuracy and strong generalization ability when facing new objects and adversarial objects. In the future work, we will explore a multi-item grasp detection method that combines point cloud information and RGB images to achieve stable grasp in a simple stacked item scene.
Footnotes
Declaration of conflicting interests
The author(s) declared no potential conflicts of interest with respect to the research, authorship, and/or publication of this article.
Funding
The author(s) disclosed receipt of the following financial support for the research, authorship, and/or publication of this article: This work is partly supported by National Natural Science Foundation of China (Grant No. U19B2033, Grant No.62076020).