
Abstract
In this work, a way to identify the performance and adjustment of the gripper was proposed by isocline analysis. This isocline analysis method is processed in three steps. Initially, the performance of the original gripper was tested, followed by adjusting the size factors of the gripper, and finally the boundary curve of the catch range was translated inside. Through these three steps, three results were obtained. First, the original performance of the gripper by step 1 was understood, then the difference between the adjusted gripper and the original gripper by step 2 was noted, and finally, the best position or boundary for this gripper by step 3 was identified. This is a feasible performance test, and it has three advantages. Most important of all, the working range of the gripper is understood. Moreover, the most appropriate working position of the gripper is identified. The results showed that the obtained gripper has the potential to improve performance.
Introduction
Mobile robots are always autonomous and capable of navigating an uncontrolled environment without physical or electromechanical guidance devices. Catching object has always been a difficult task for mobile robots, 1 –3 especially for robot competition. This research aims to build an image model method, which can be used to analyze an effective and easy-to-build gripper for mobile robots to search for objects and catch them. The gripper is formed by an integrated easy-to-build structure, which includes just rock link and ground link. The Rocker–Finger gripper can be droved by controllable motor. The choices of arms or grippers decide whether to catch object, but this choice is usually based on the experience of competitors. Based on the experience, it needs a lot of time, but it is not always possible to choose the right arms or grippers. 4 –6 The purpose and significance of this research is to solve this problem of arms or grippers choice, and this research is able to identify the performance of the choice arms and grippers. There are three types of performance identification methods in the research field. First is the mathematical model, second is the image model, and last is the mock-up. In the field of identifying performance for arm or gripper, mathematical model is the most common one used by a researcher, followed by mock-up, and finally the image model. 7 –13 Mathematical models can quickly analyze the performance of arms or grippers, but it can be too different from real performance. The mock-up can analyze the real performance of the arms or the grippers, but it takes a lot of time and money. And the image model method is somewhere in between. In this research, the image model method was used to analyze the performance of the grippers.
For parameters of the optimization, there are size parameters of gripper and the geometrical dimensions of the objects. 9,14 –16 So first of all, this research analyzed the performance of the gripper by isocline image model analysis, followed by adjusting the geometry of grippers and objects, then analyzing the geometry of adjusted gripper and object again, and finally optimizing the performance of the grippers.
Materials and methods
Figure 1 shows the preparation of this research: first, select testing gripper; second, decide testing boundary; third, select testing object; forth, test and mark; fifth, identifying points or areas that are easy to catch; sixth, determine whether the boundary has been found; seventh, inward offset this boundary to find the optimal catching point or areas; and finally, adjust the gripper to the best, according to result.

Flow chart.
Select testing gripper
This research selects Rocker–Finger gripper to test, as shown in Figure 2, and then fix it on mobile robot to catch object, as shown in Figure 3. There are seven factors for this gripper. This gripper’s factors and object’s factors will affect each other, so there is a best ratio between them. The factors of Rocker–Finger gripper are L1, L2, L3, L4, L5, θ1, and θ2, as shown in Figure 4.

Rocker–Finger gripper.

Testing process.

The factors of Rocker–Finger gripper.
Decide testing boundary
The testing boundary can be determined by the researchers. The boundary of this research is shown in Figure 5. The range is 10,000 mm2 (100 × 100 mm2) and the sampling rate is 1 point/10 mm. The testing boundary’s origin position is 70 mm above the Rocker–Finger’s origin.

Boundary of scatter diagram.
Select testing objects
The testing object can be determined by the researchers. For researchers, they can choose cubes, cylinders, or any shape. In this research, the grasping objects are cubes, and their edge line (L) is changed from small to large. For this study, L is 20, 25, 30, 35, and 40 mm, as shown in Figure 6.

The factors of grasping objects.
Testing and mark
After selecting gripper, objects, and testing boundary, the research can start for their test. The way is moving the gripper to the point where you want to catch object, and researchers start testing at this location. If this testing point of gripper can catch the object, it can be marked as O, otherwise it is marked as X, as shown in Figure 7.
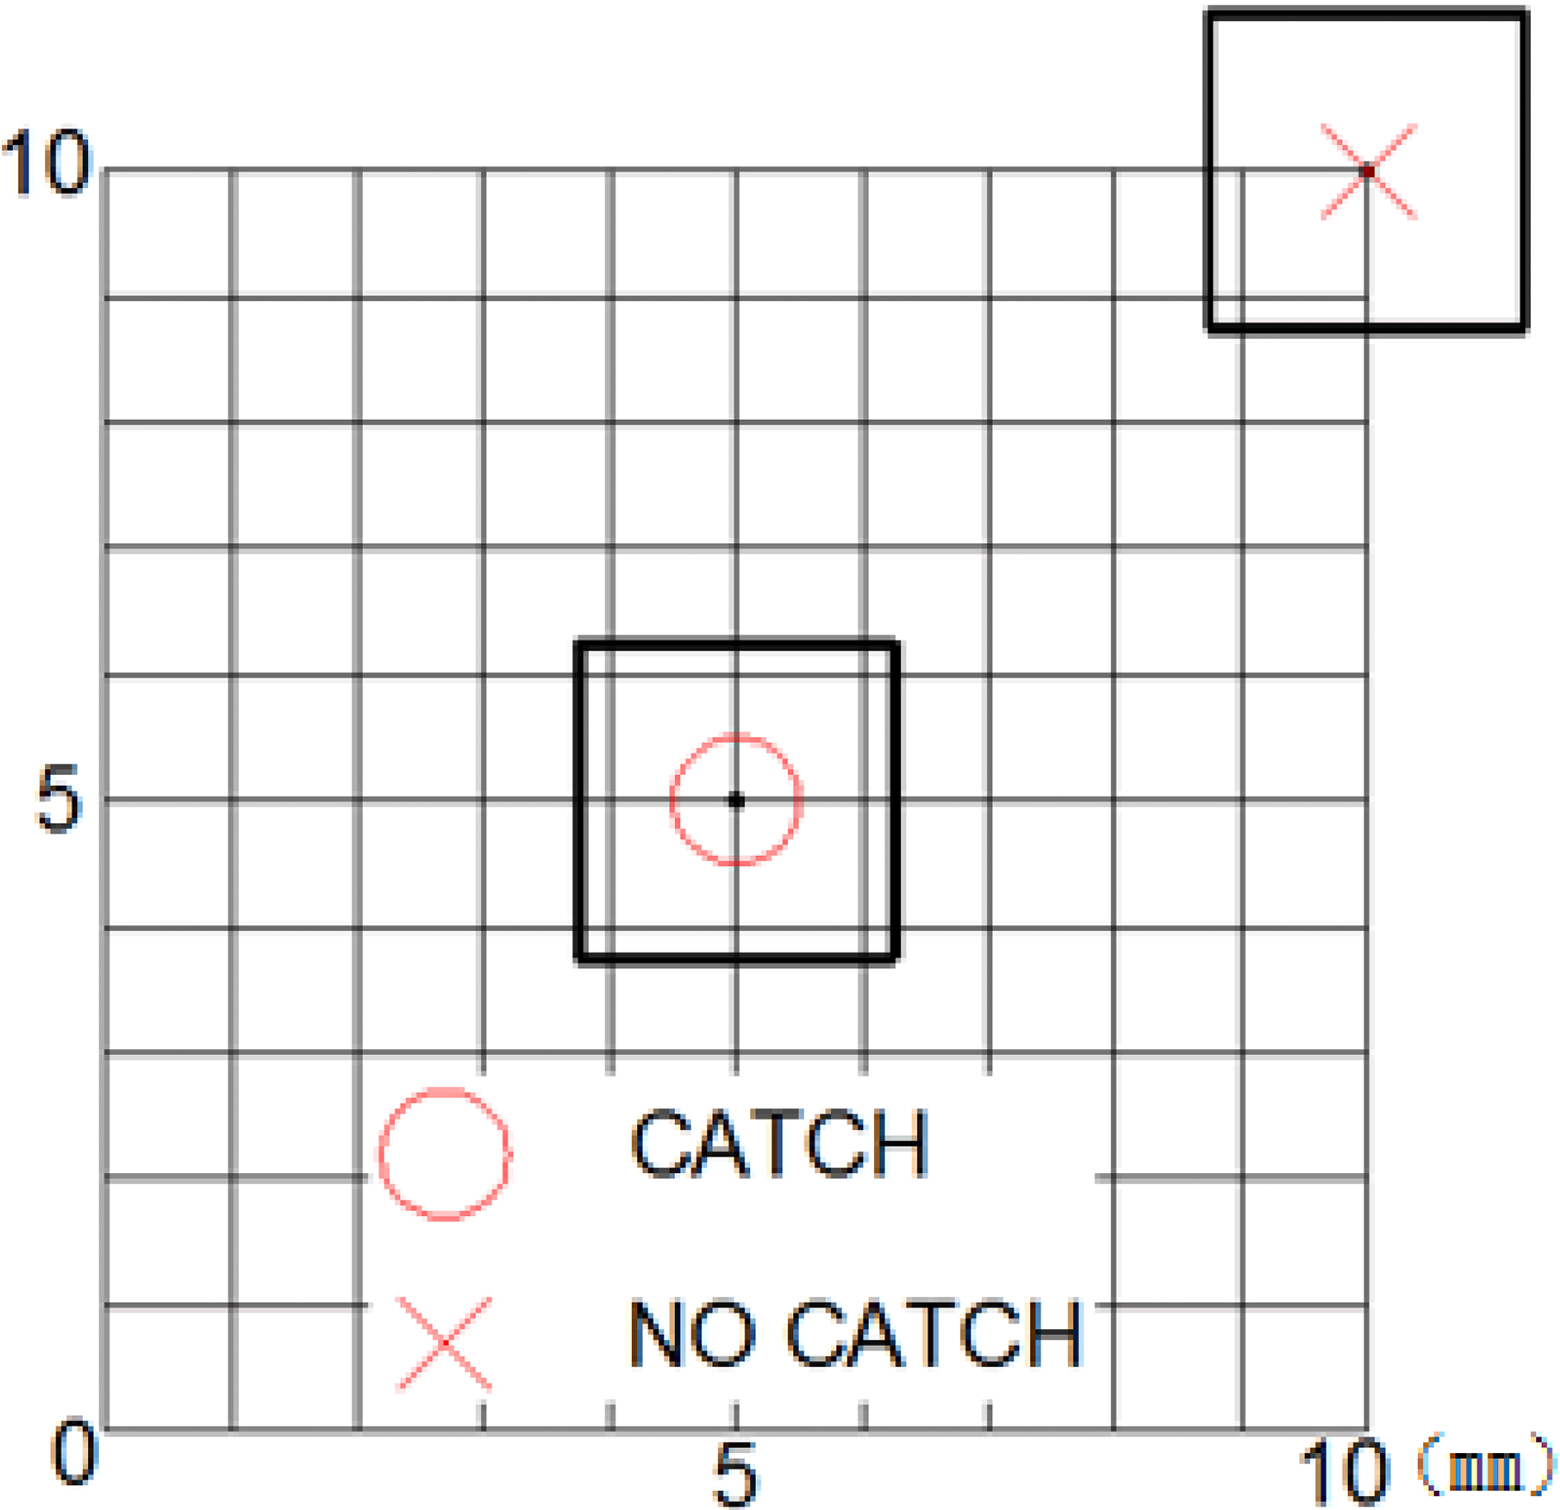
The marks for catch or no catch.
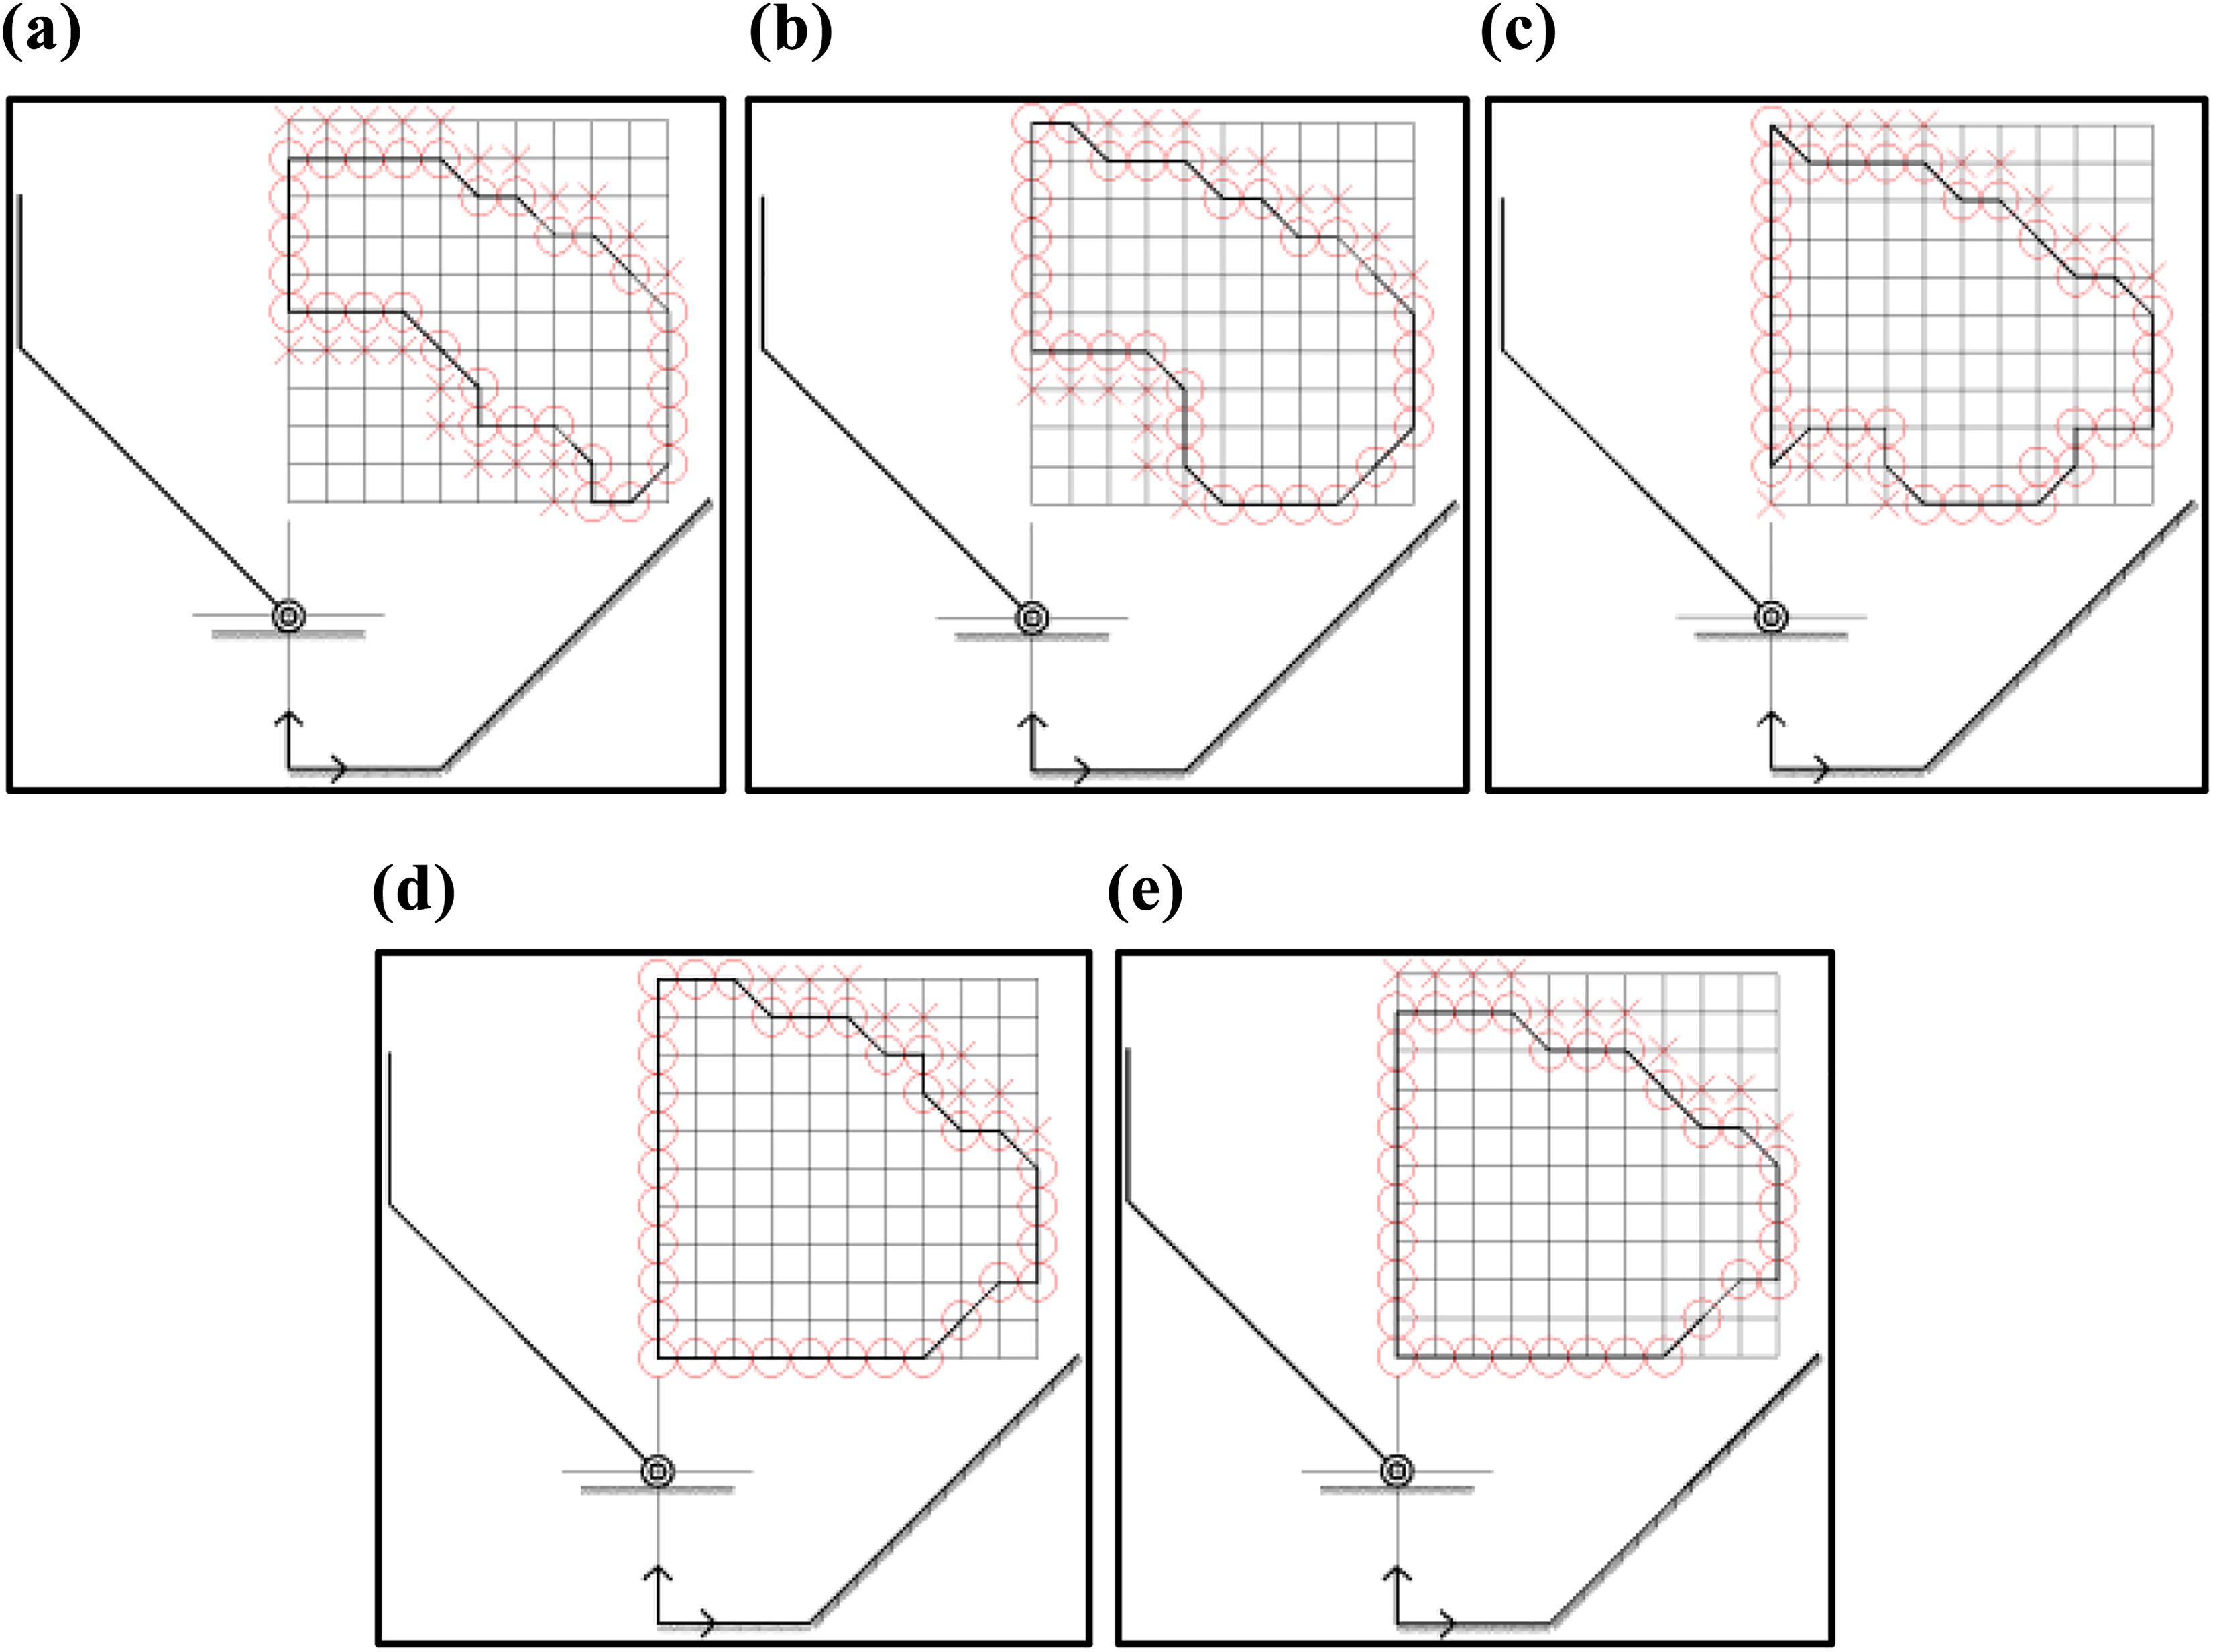
Identifying points or areas that are easy to catch
It is like a target. Sampling range is the range where we can shoot for this target, and catch range is the range where we can get point for this target. So the performance is the ratio of catch range to sampling range, as shown below

P is performance.
C is catch range.
S is sampling range.
In order to find the best catch points or areas, the researchers can offset catch range. And then researchers can obtain level 1, level 2, level 3, and so on. If the level range is smaller, it means that the best catch points or areas have been found, as shown in Figure 8.

Inward offset.
Results
This research shows how to use the isocline method to analyze performance and adjust the Rocker–Finger gripper. This research presented below a set of control group and 14 experimental groups.
Control group
Factors
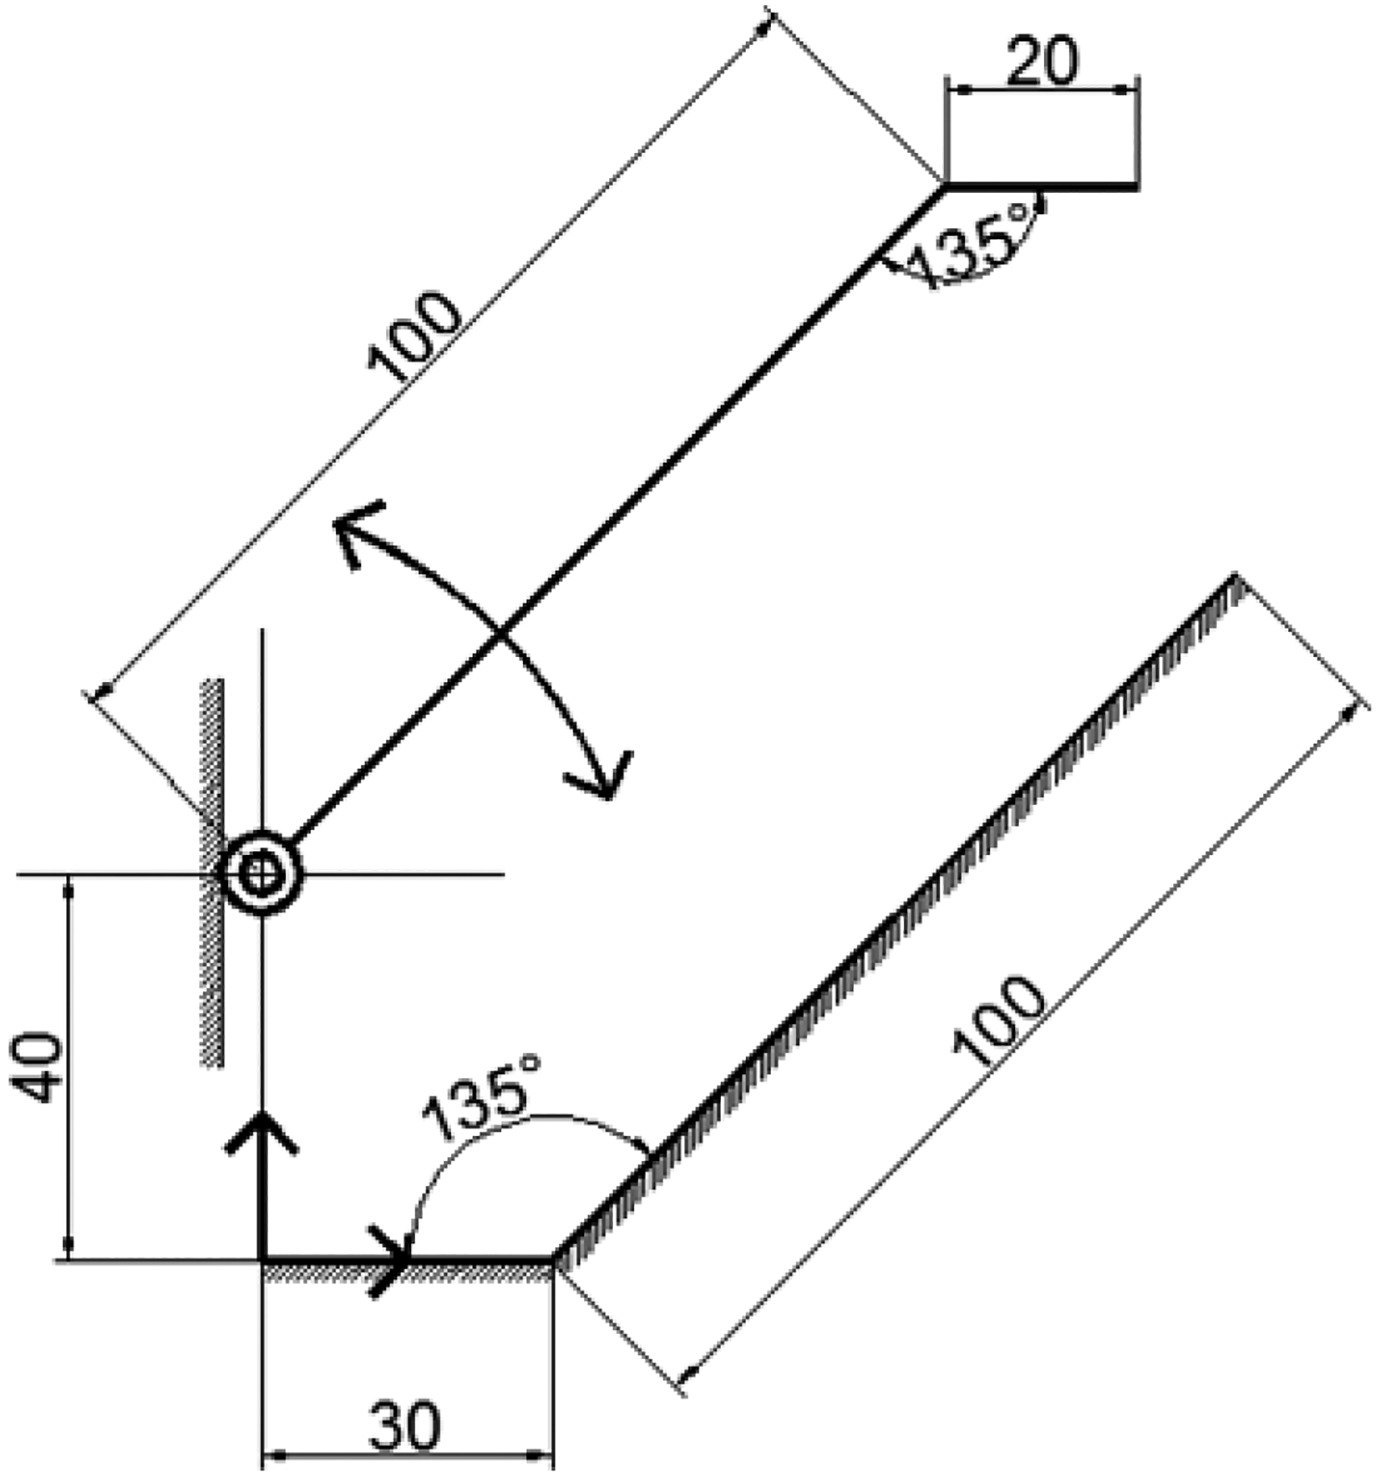
The control group factors, as shown in Figure 9, are as follows:

The factors of control group.
L1 = 40 mm.
L2 = 100 mm.
L3 = 100 mm.
L4 = 20 mm.
θ1 = 135°.
θ2 = 135°.
Performance
Control group’s performance is 31–56.5% for catching these grasping objects in the sampling range, as shown in Figure 10.
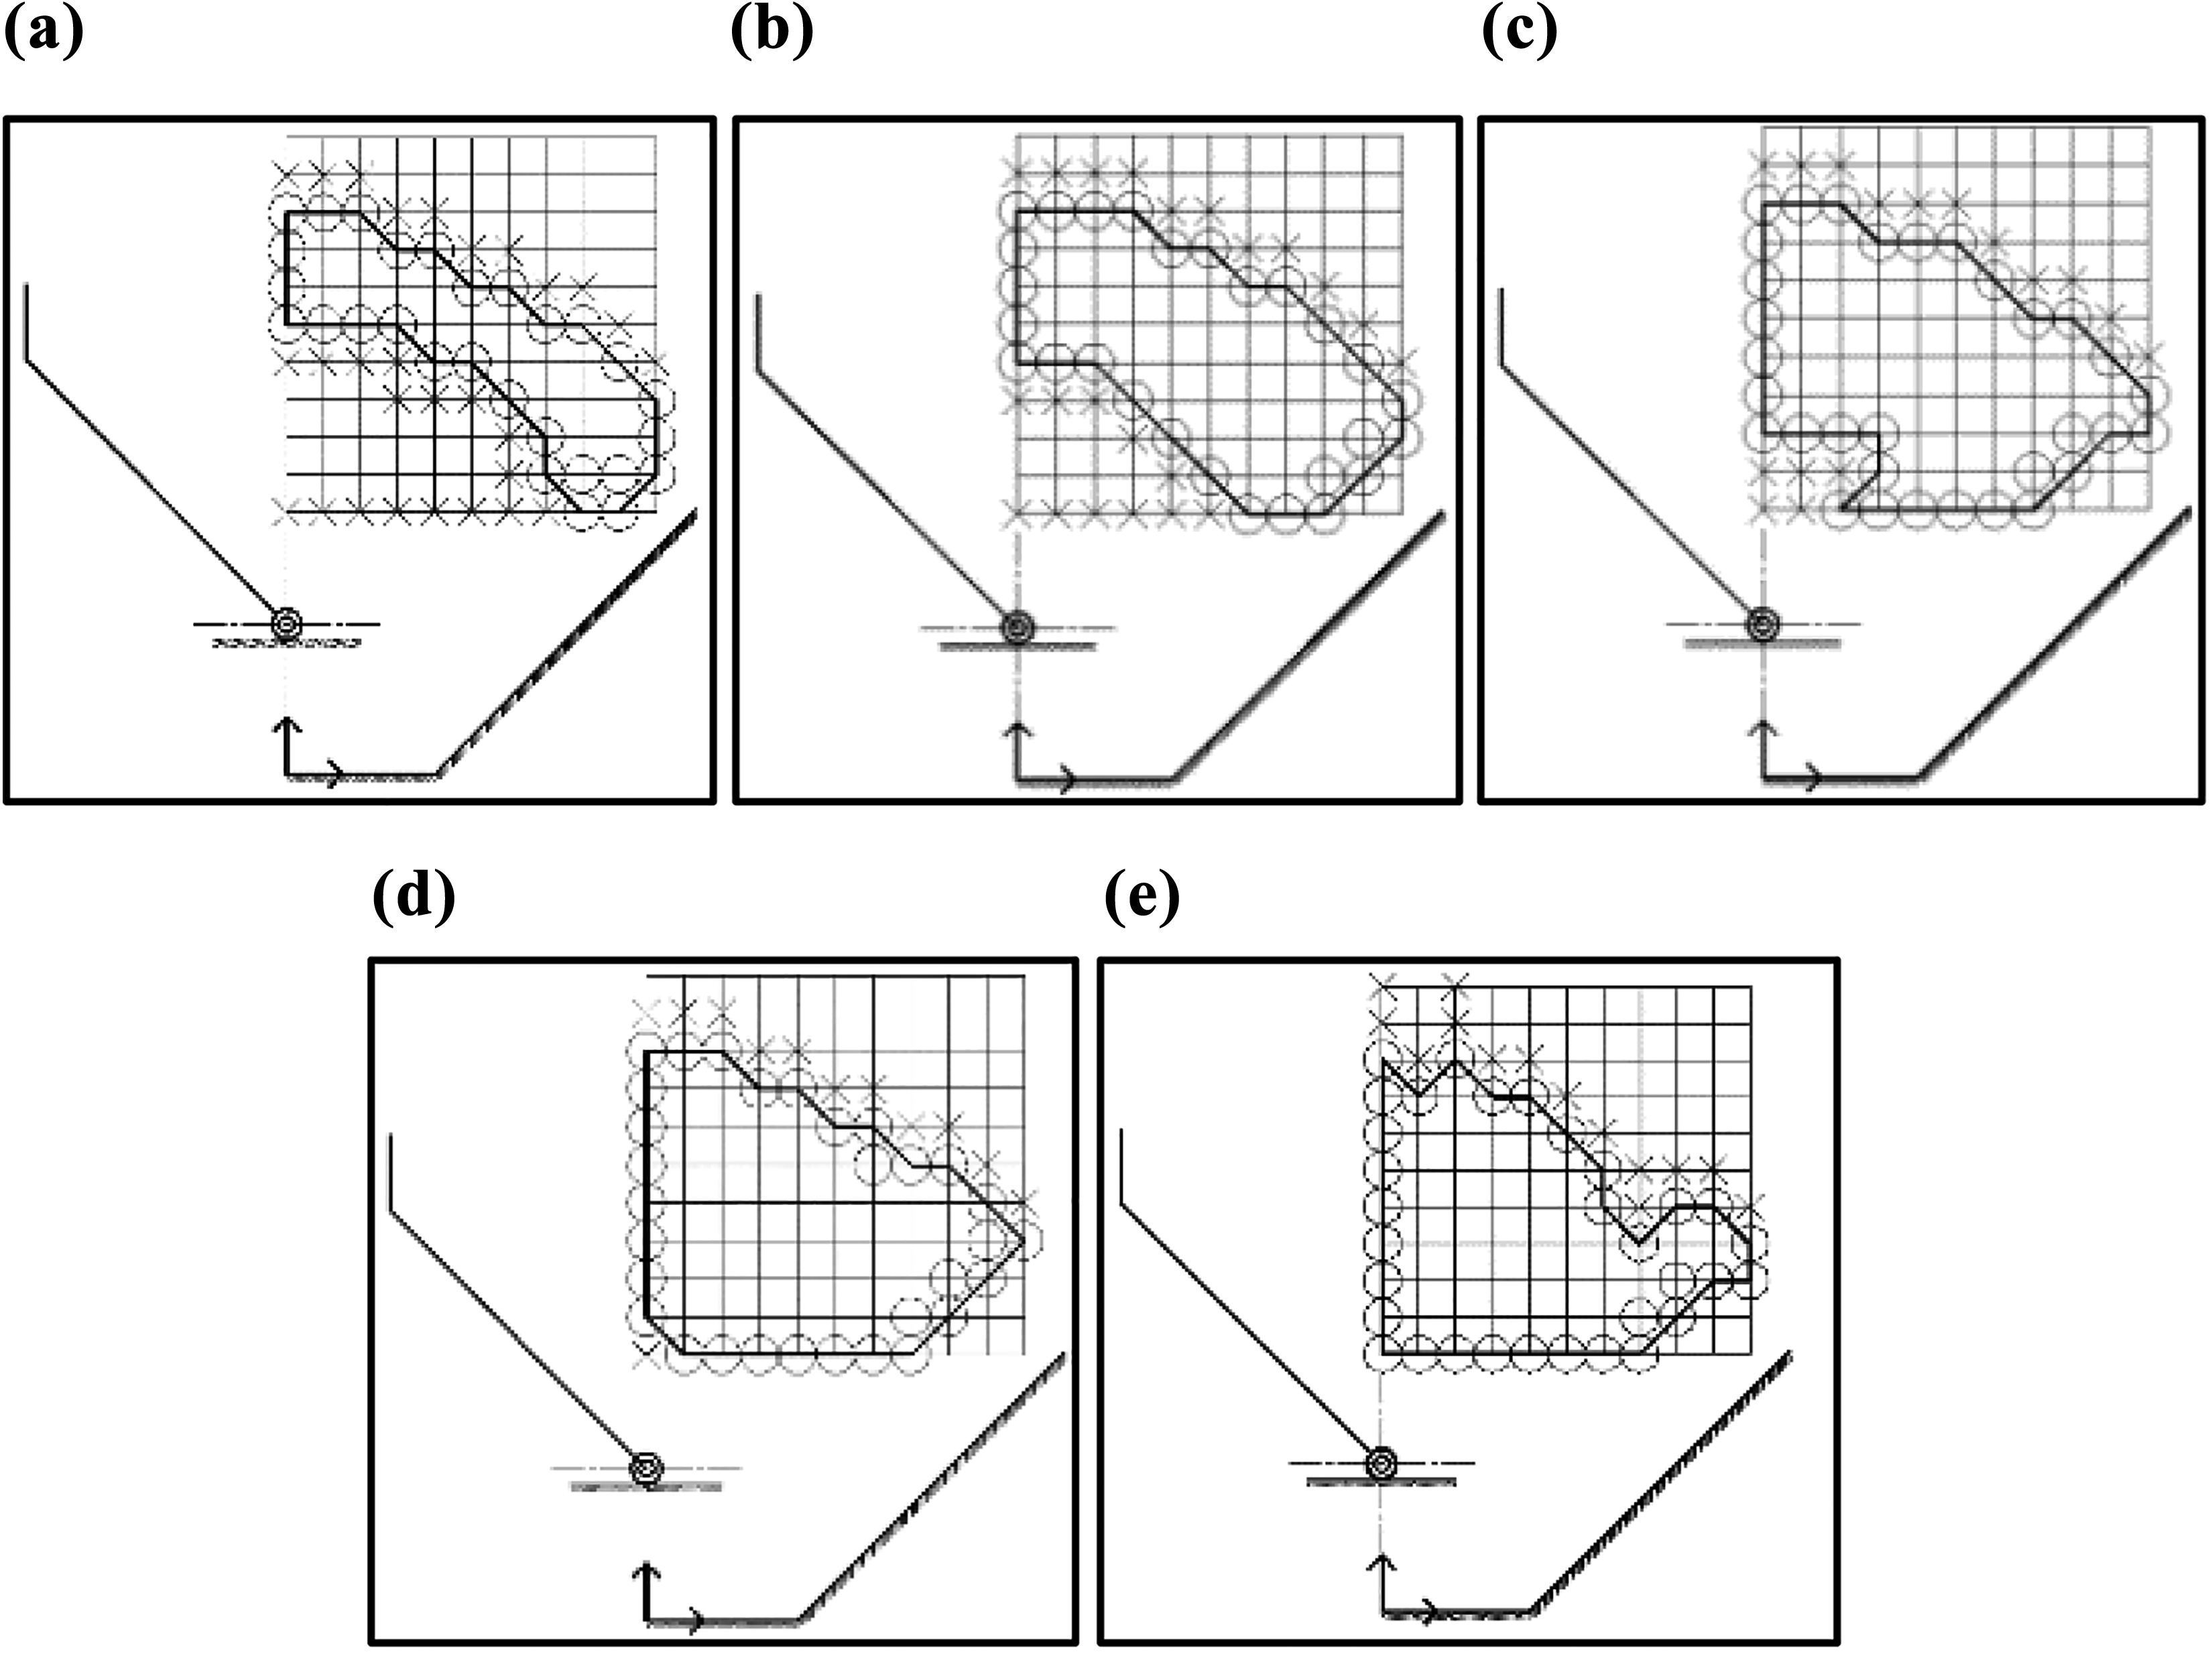
The performance of control group. (a) 20 mm; (b) 25 mm; (c) 30 mm; (d) 35 mm; and (e) 40 mm.
Different levels of comparison
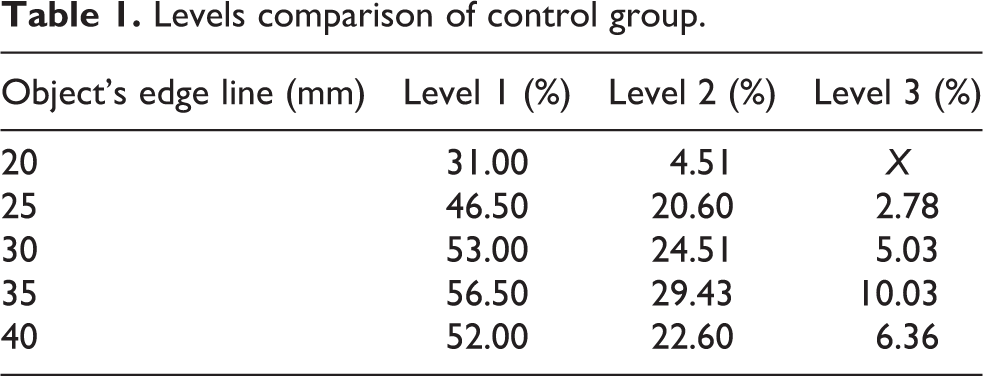
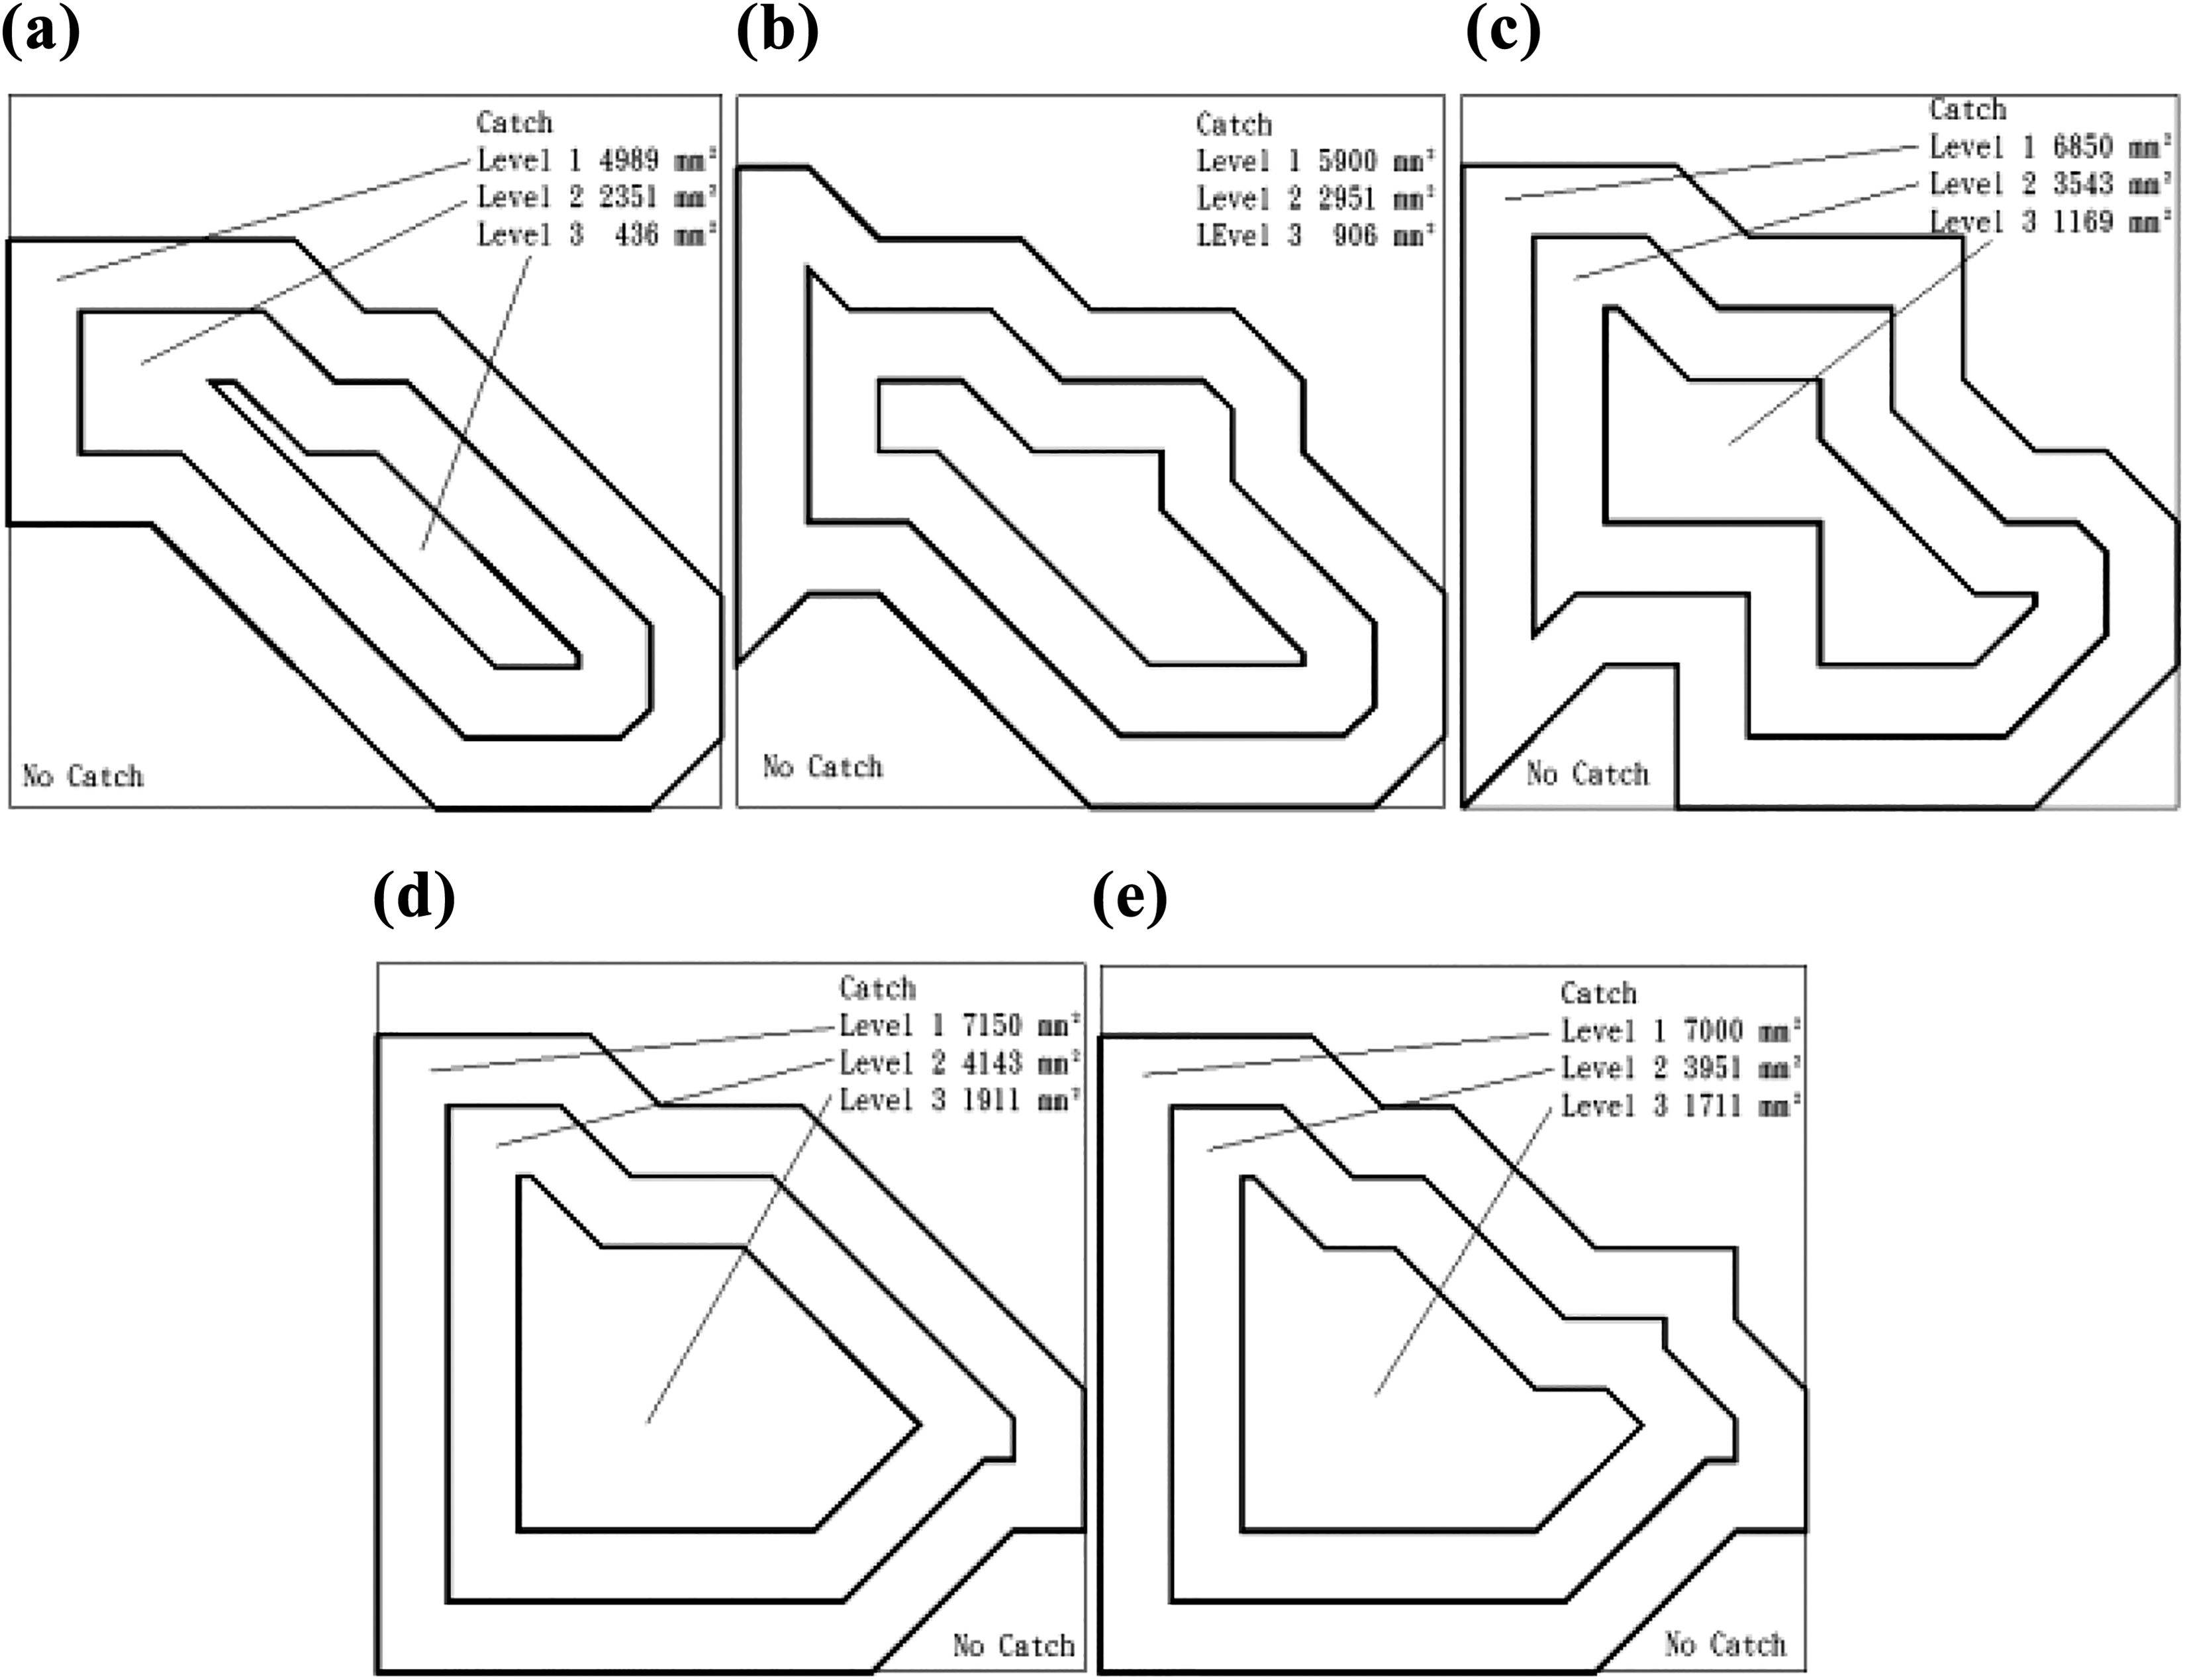
For control group’s different levels of comparison, researchers compared three levels. After this comparison, researchers will be able to identify the size of the object that is suitable for control group. Control group’s three levels are presented in Table 1 and shown in Figure 11.
Levels comparison of control group.

Different levels of control group. (a) 20 mm; (b) 25 mm; (c) 30 mm; (d) 35 mm; and (e) 40 mm.
Small L1
Factors
For small L1 of experimental group, L1 is 30 mm, as shown in Figure 12.
Small L1’s factors.
Performance
Small L1’s performance is 40–47.5% for catching these grasping objects in the sampling range, as shown in Figure 13.

Performance of small L1. (a) 20 mm; (b) 25 mm; (c) 30 mm; (d) 35 mm; and (e) 40 mm.
Different levels of comparison
For small L1’s different levels of comparison, researchers compared three levels. After this comparison, researchers will be able to identify the size of the object that is suitable for small L1. Small L1’s three levels are presented in Table 2 and shown in Figure 14.
Levels comparison of small L1.


Different levels of small L1. (a) 20 mm; (b) 25 mm; (c) 30 mm; (d) 35 mm; and (e) 40 mm.
Long L1
Factors
For long L1 of experimental group, L1 is 60 mm, as shown in Figure 15.
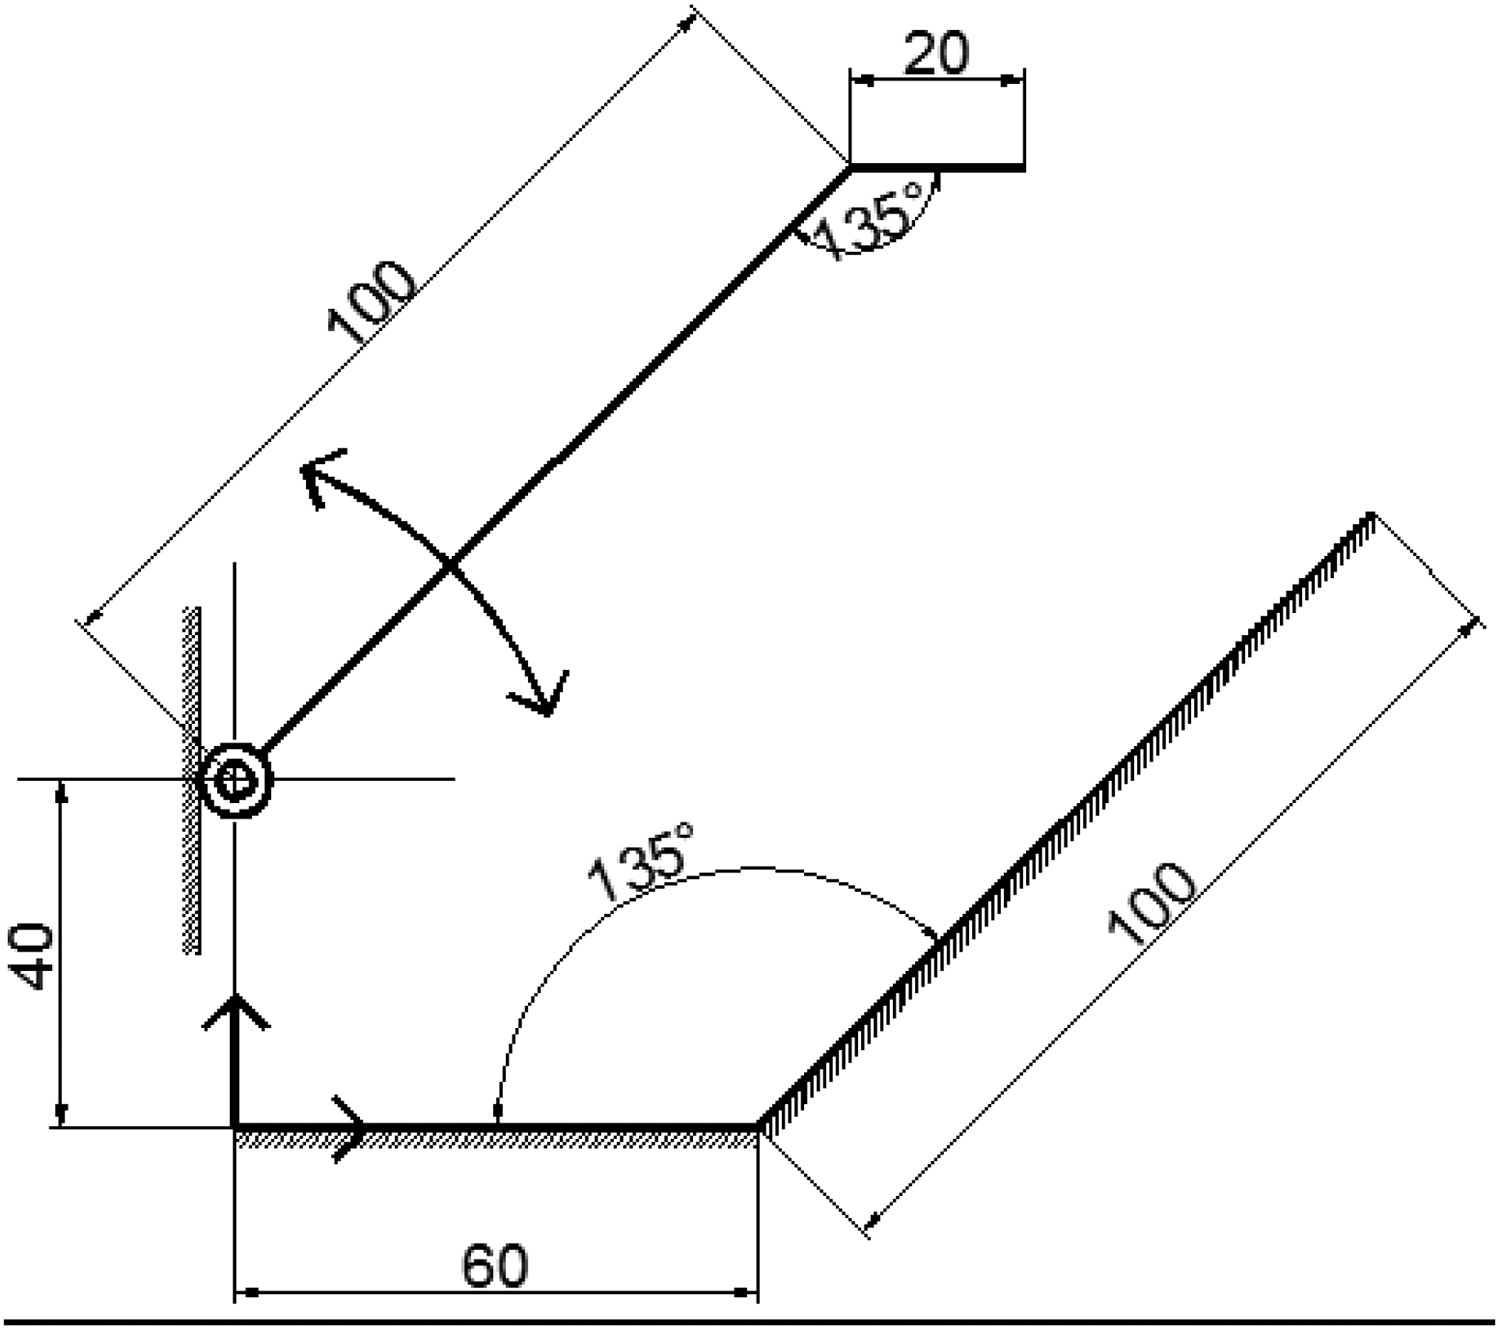
Long L1’s factors.
Performance
Long L1’s performance is 13–49.5% for catching these grasping objects in the sampling range, as shown in Figure 16.

Long L1’s performance. (a) 20 mm; (b) 25 mm; (c) 30 mm; (d) 35 mm; and (e) 40 mm.
Different levels of comparison
Levels comparison of long L1.
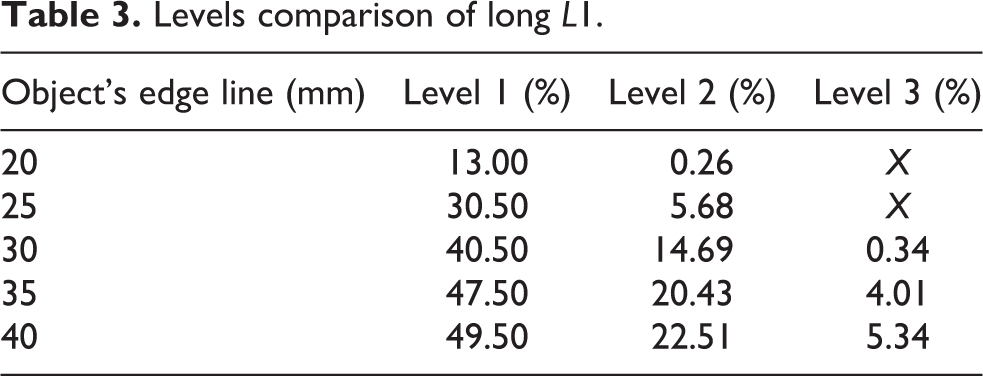

Different levels of long L1.(a) 20 mm; (b) 25 mm; (c) 30 mm; (d) 35 mm; and (e) 40 mm.
Small L2
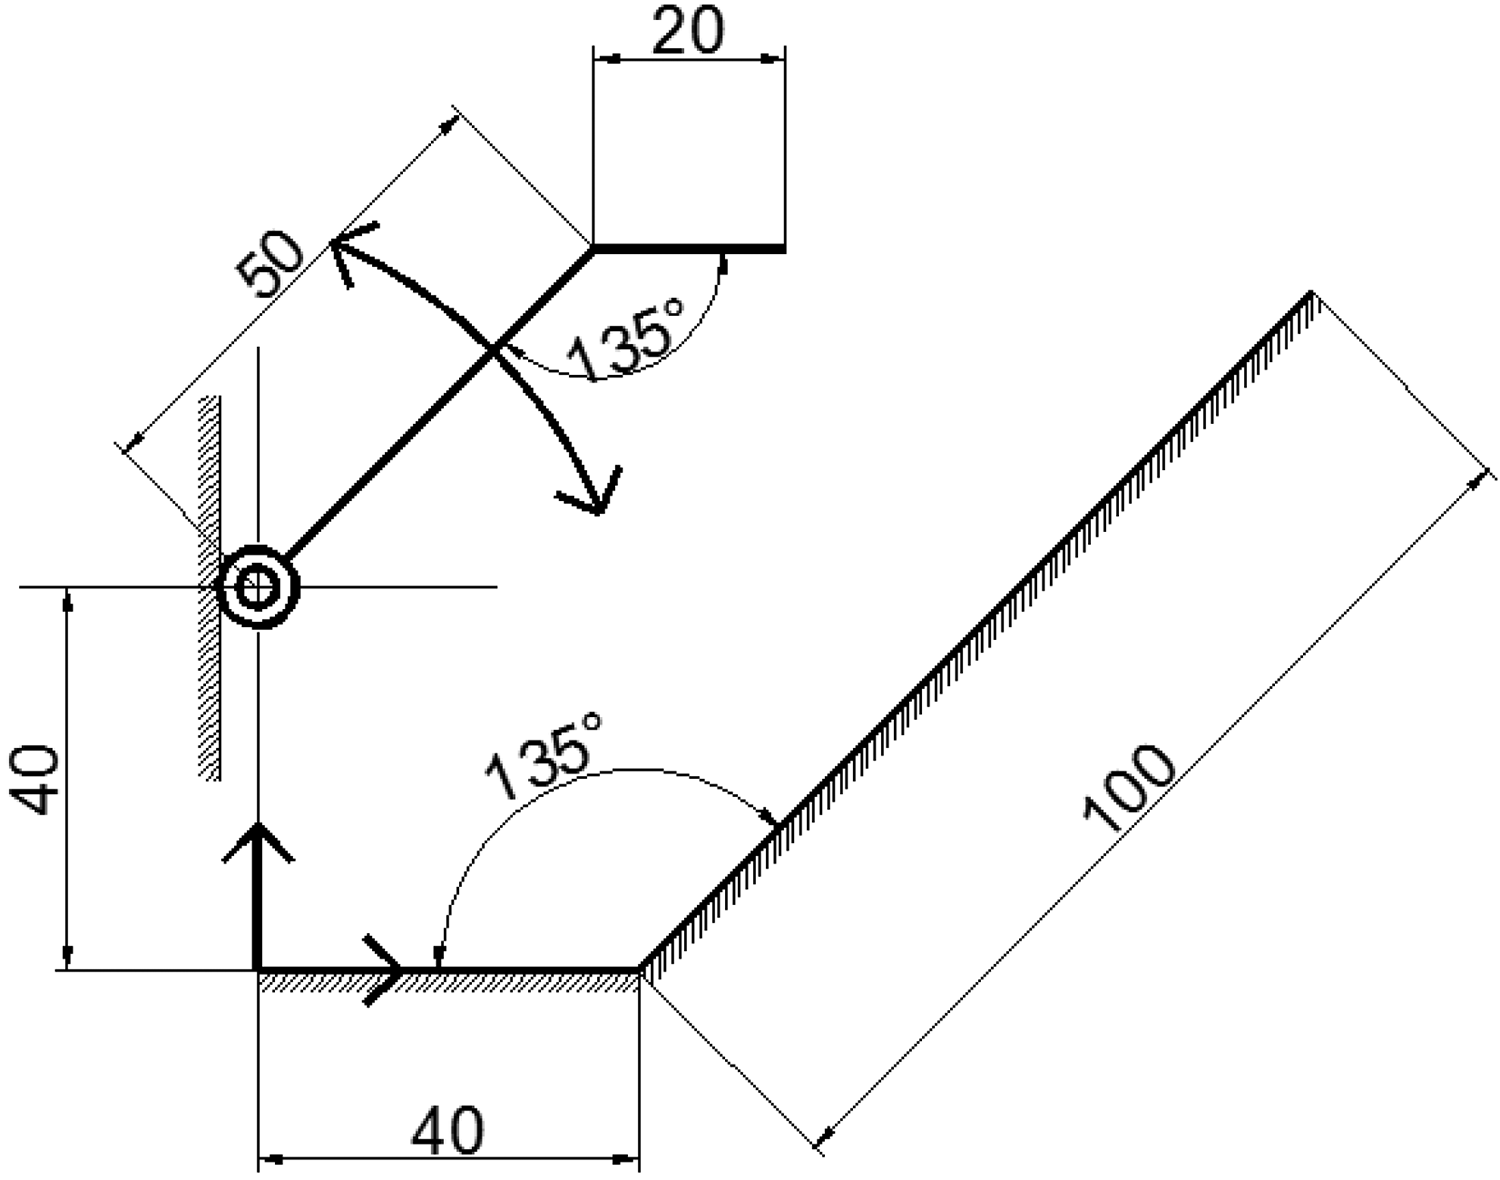
Factors
For small L2 of experimental group, L2 is 50 mm, as shown in Figure 18.

Small L2’s factors.
Performance
Small L2’s performance is 12.5–29.5% for catching these grasping objects in the sampling range, as shown in Figure 19.

Small L2’s performance. (a) 20 mm; (b) 25 mm; (c) 30 mm; (d) 35 mm; and (e) 40 mm.
Different levels of comparison
For small L2’s different levels of comparison, researchers compared three levels. After this comparison, researchers will be able to identify the size of the object that is suitable for small L2. Small L2’s three levels are presented in Table 4 and shown in Figure 20.
Levels comparison of small L2.


Different levels of small L2.(a) 20 mm; (b) 25 mm; (c) 30 mm; (d) 35 mm; and (e) 40 mm.
Long L2
Factors
For long L2 of experimental group, L2 is 150 mm, as shown in Figure 21.

Long L2’s factors.
Performance
Long L2’s performance is 30.5–53% for catching these grasping objects in the sampling range, as shown in Figure 22.

Large L2’s performance. (a) 20 mm; (b) 25 mm; (c) 30 mm; (d) 35 mm; and (e) 40 mm.
Different levels of comparison
For large L2’s different levels of comparison, researchers compared three levels. After this comparison, researchers will be able to identify the size of the object that is suitable for large L2. Large L2’s three levels are presented in Table 5 and shown in Figure 23.
Levels comparison of large L2.
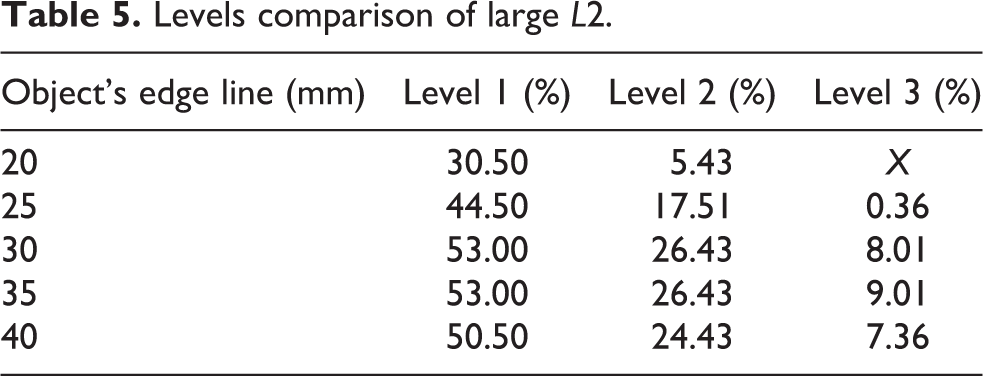

Different levels of long L2. (a) 20 mm; (b) 25 mm; (c) 30 mm; (d) 35 mm; and (e) 40 mm.
Small L3
Factors
For small L3 of experimental group, L3 is 50 mm, as shown in Figure 24.
Small L3’s factors.
Performance
Small L3’s performance is 0.05–15.5% for catching these grasping objects in the sampling range, as shown in Figure 25.

Small L3’s performance. (a) 20 mm; (b) 25 mm; (c) 30 mm; (d) 35 mm; and (e) 40 mm.
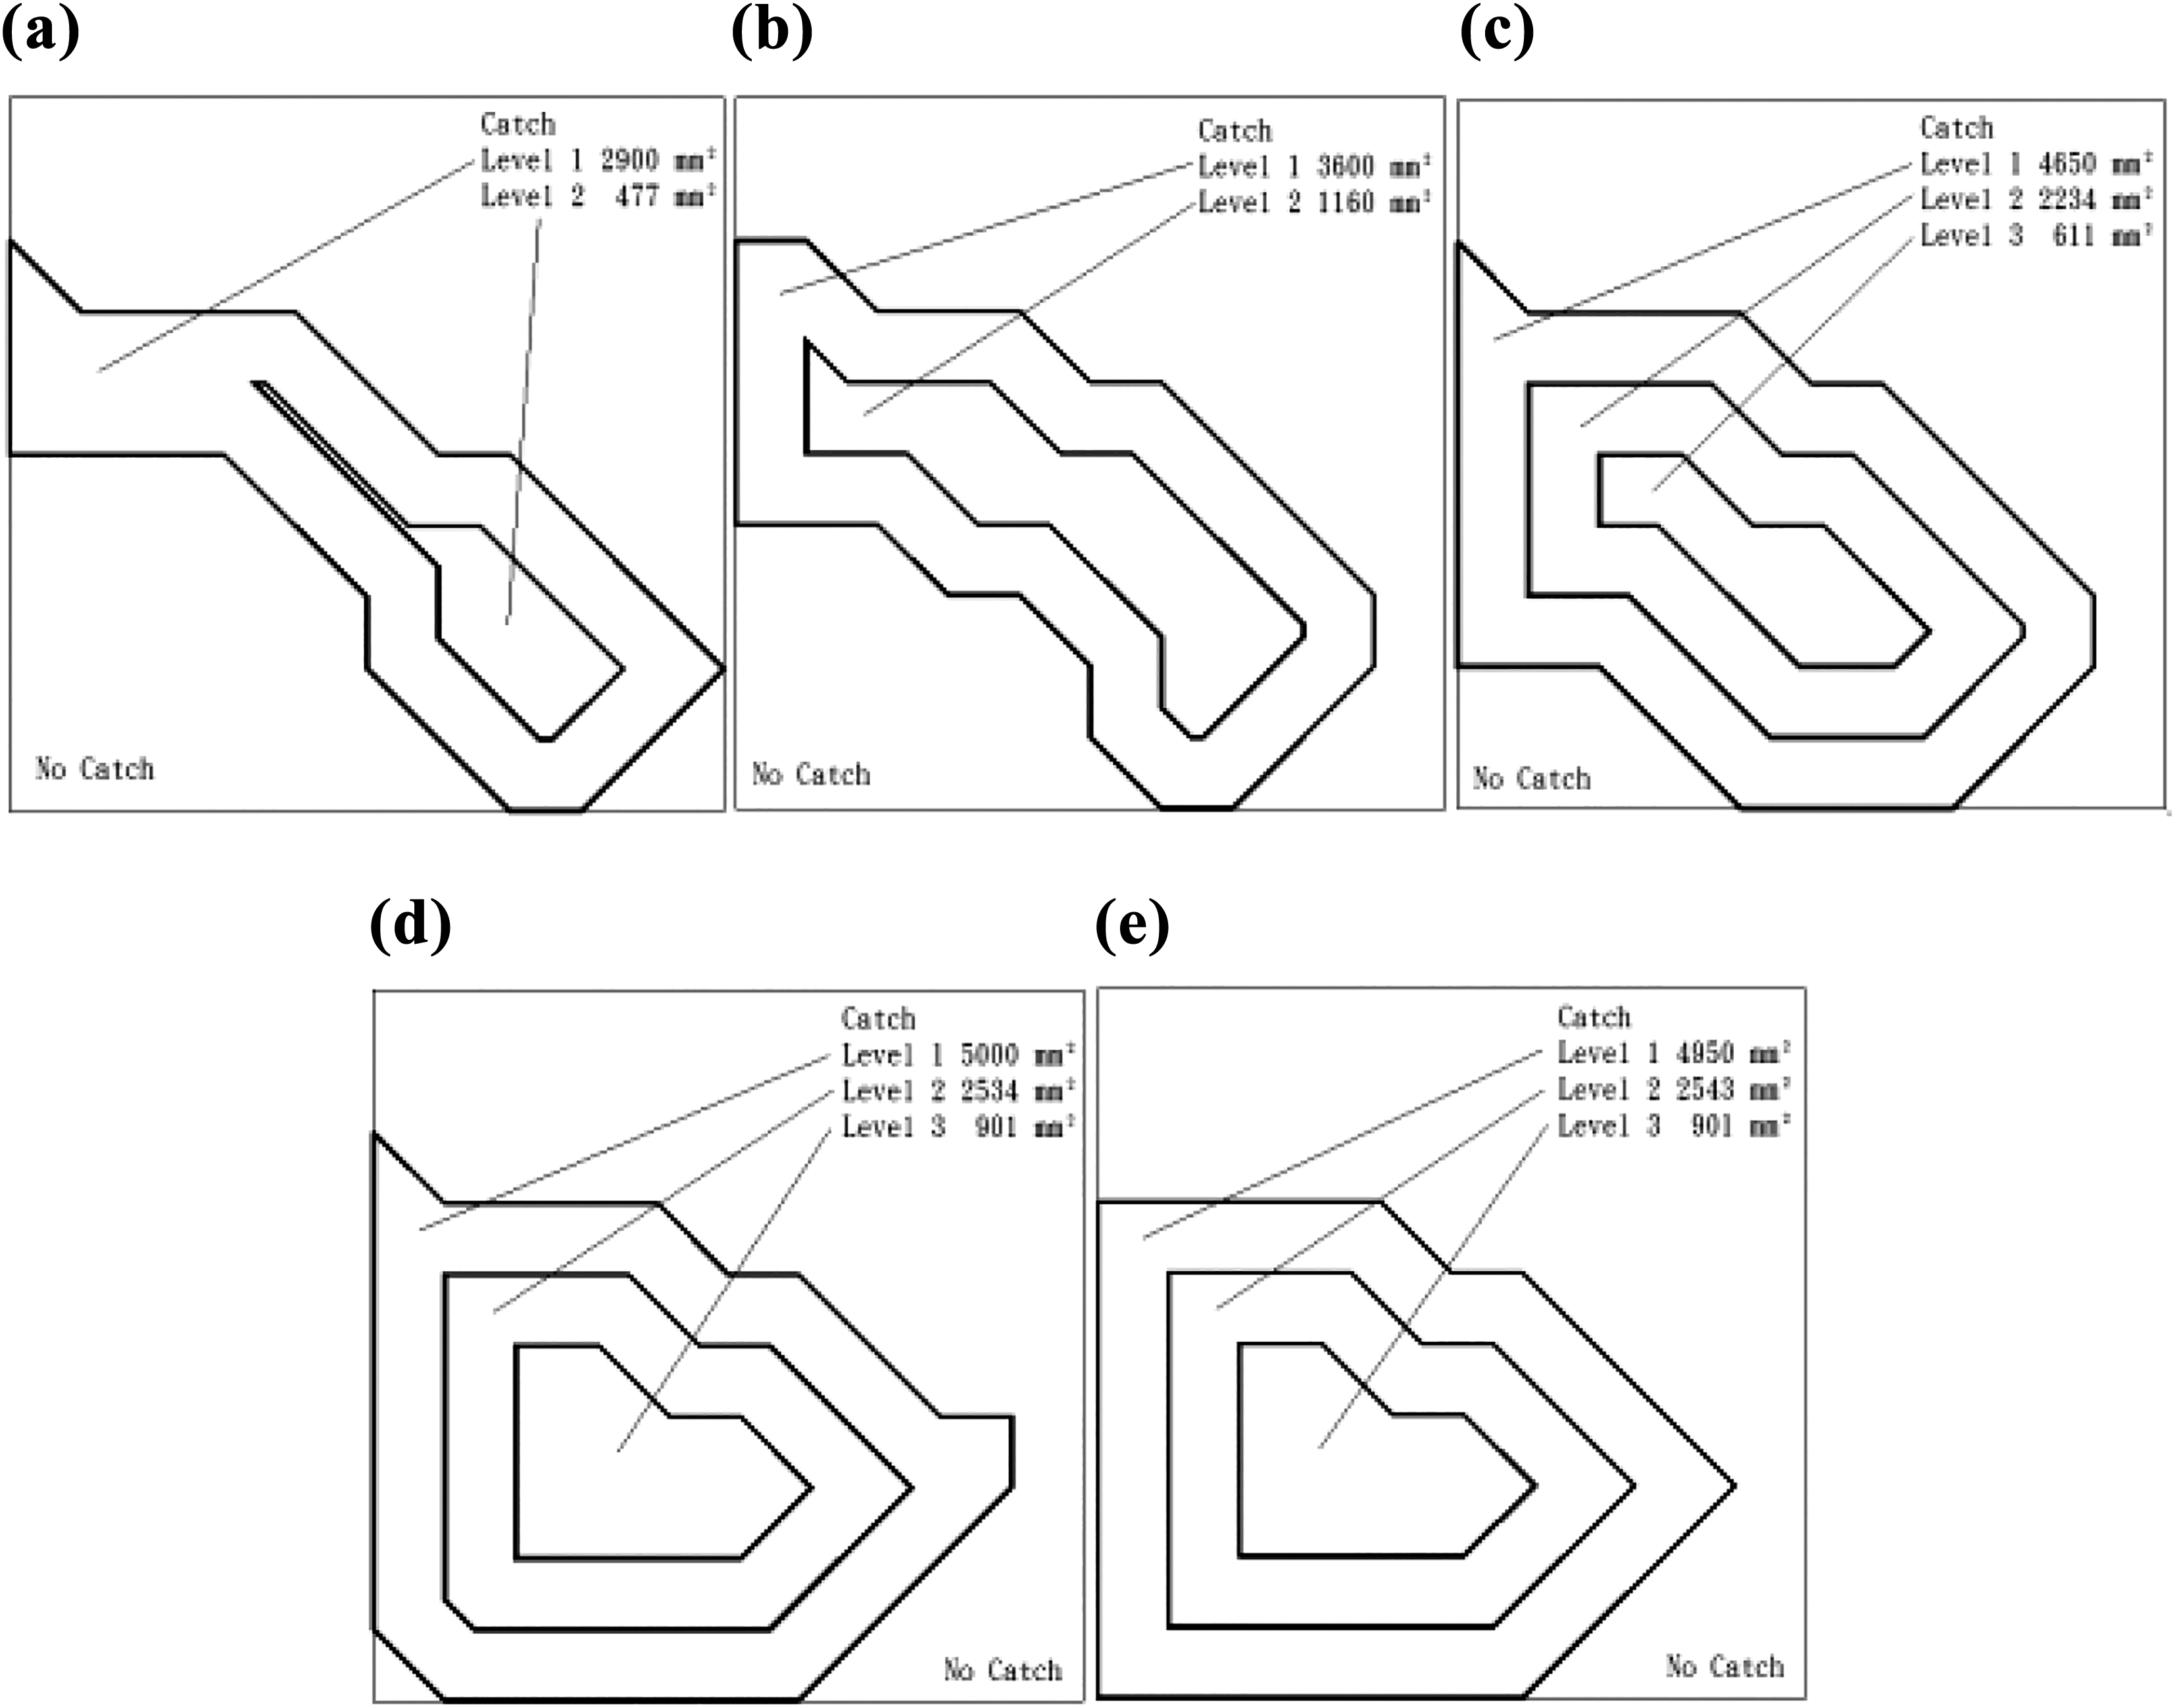
Different levels of comparison
For small L3’s different levels of comparison, researchers compared three levels. After this comparison, researchers will be able to identify the size of the object that is suitable for small L3. Small L3’s three levels are presented in Table 6 and shown in Figure 26.
Levels comparison of small L3.


Different levels of small L3. (a) 20 mm; (b) 25 mm; (c) 30 mm; (d) 35 mm; and (e) 40 mm.
Long L3
Factors
For long L3 of experimental group, L3 is 150 mm, as shown in Figure 27.

Long L3’s factors.
Performance
Long L3’s performance is 49.89–71.5% for catching these grasping objects in the sampling range, as shown in Figure 28.

Long L3’s performance. (a) 20 mm; (b) 25 mm; (c) 30 mm; (d) 35 mm; and (e) 40 mm.
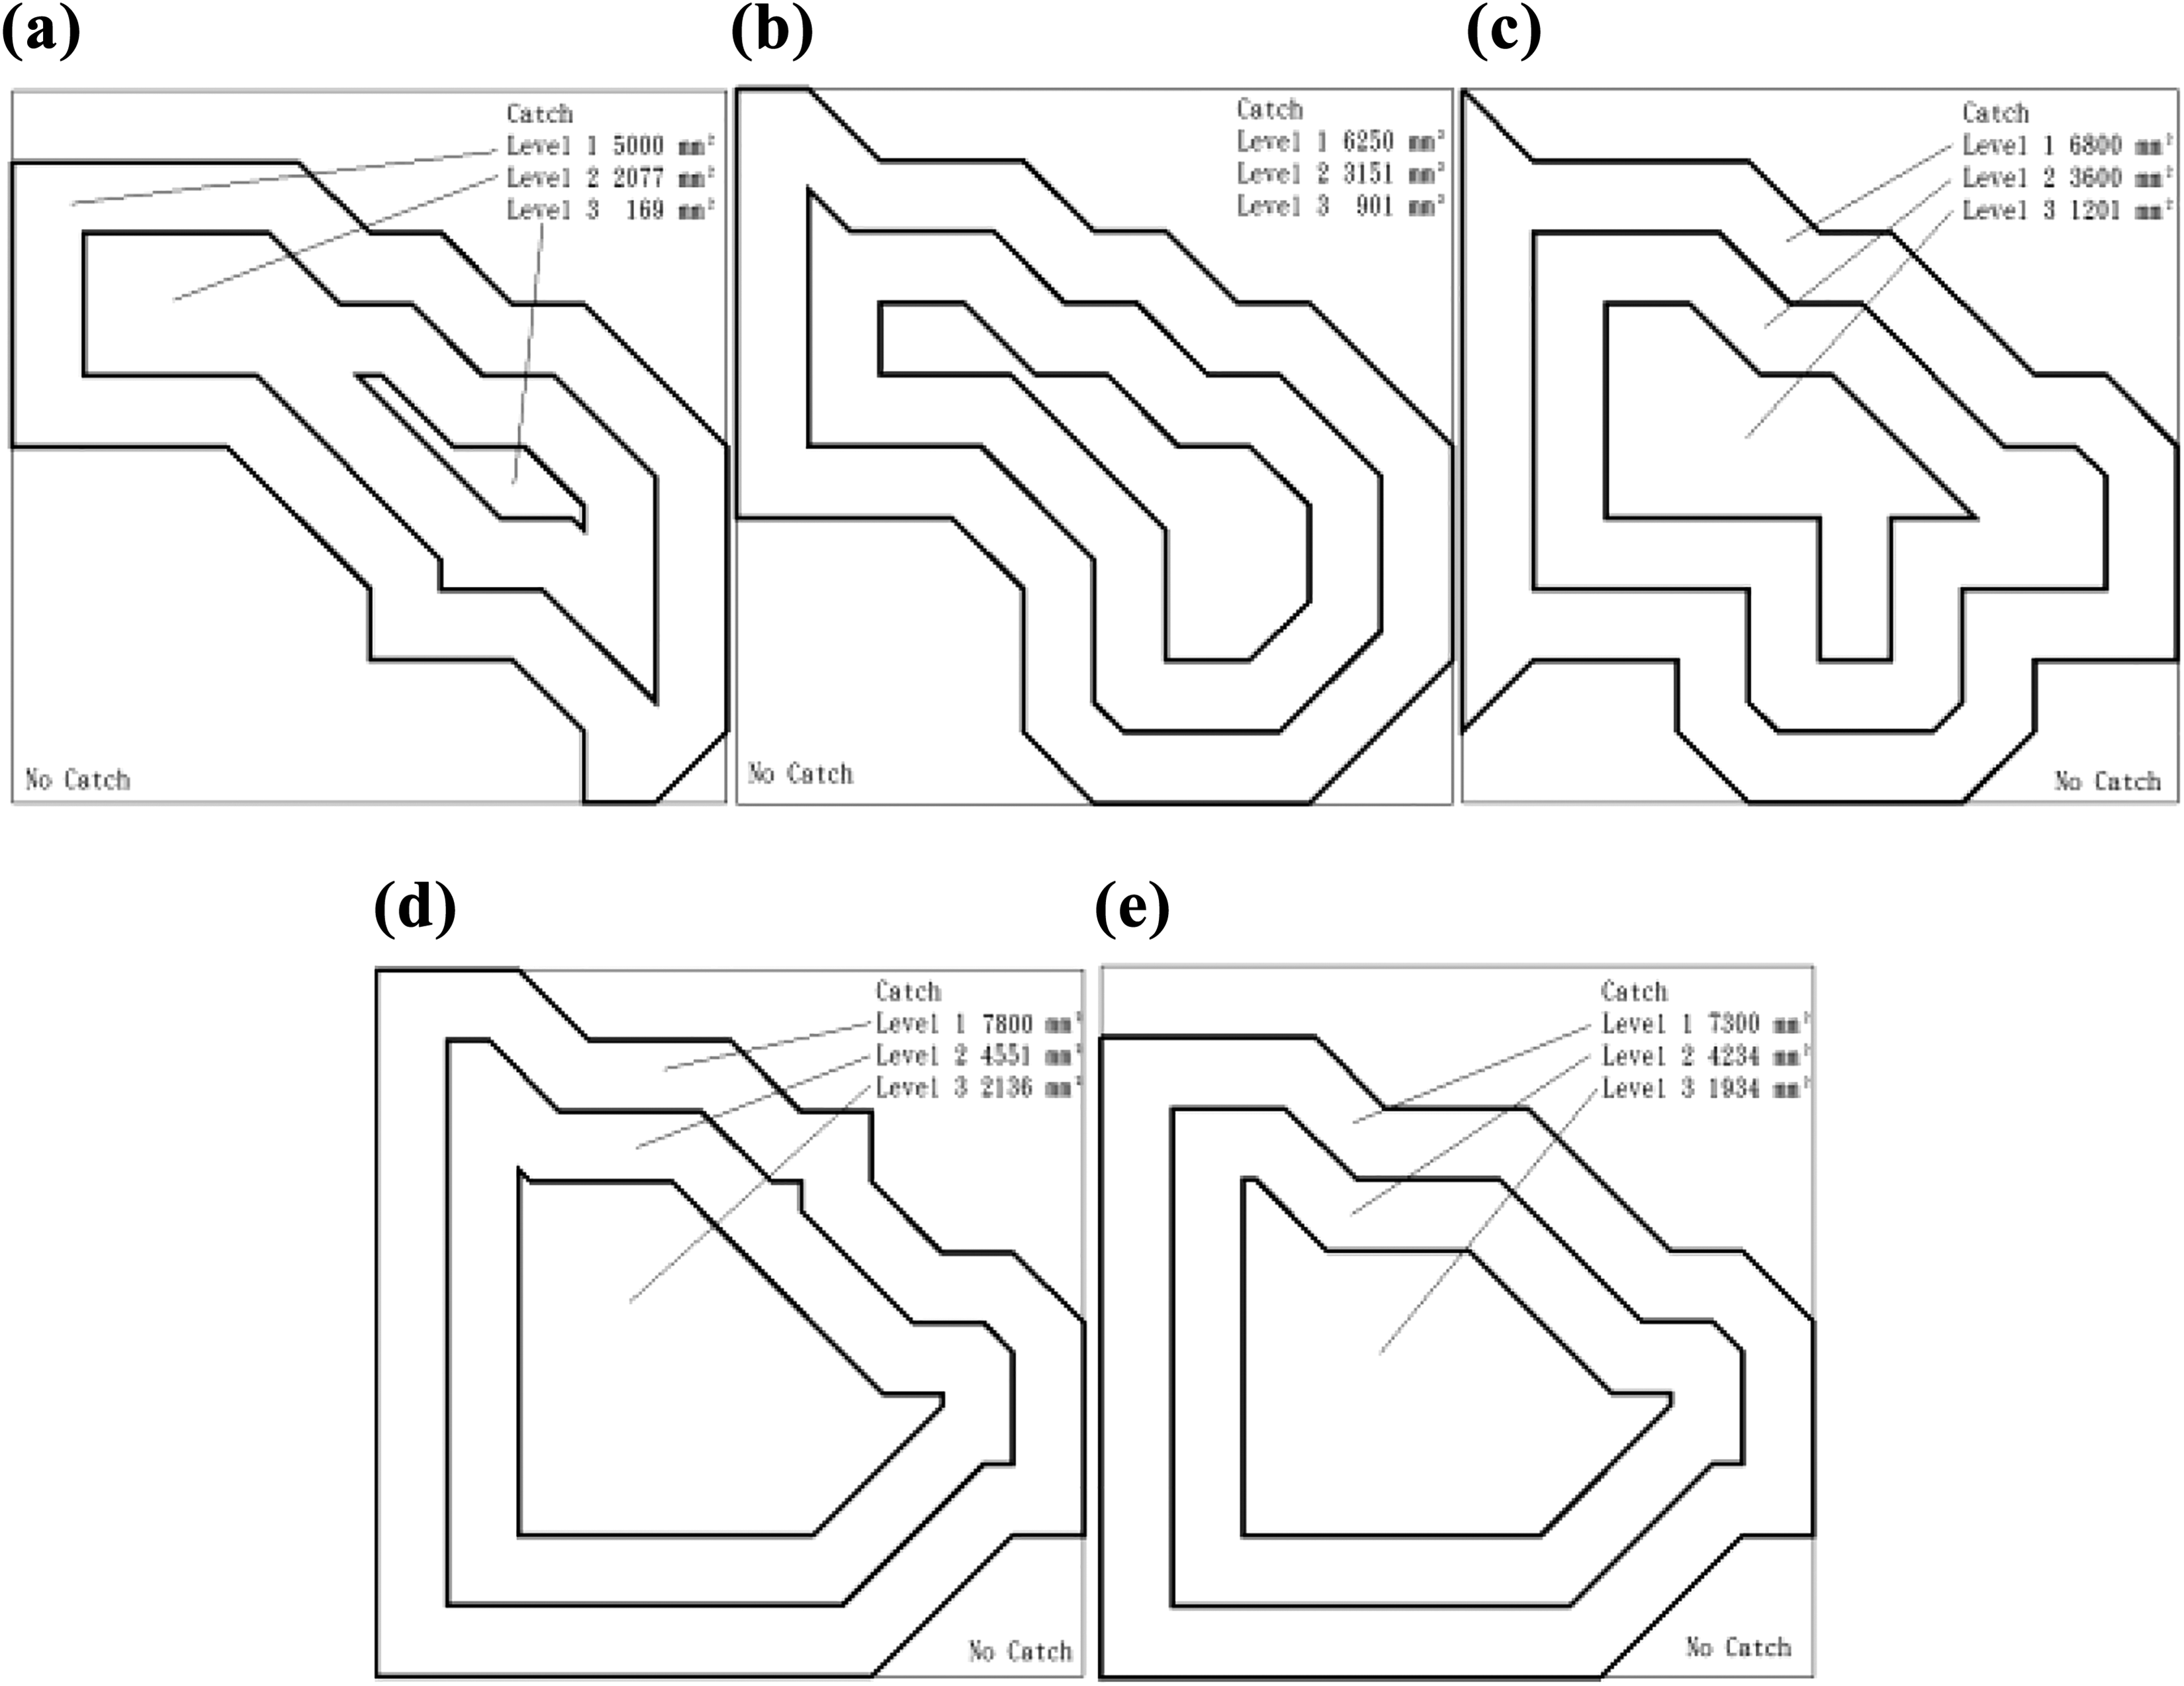
Different levels of comparison
For long L3’s different levels of comparison, researchers compared three levels. After this comparison, researchers will be able to identify the size of the object that is suitable for long L3. Long L3’s three levels are presented in Table 7 and shown in Figure 29.
Levels comparison of long L3.

Different levels of long L3. (a) 20 mm; (b) 25 mm; (c) 30 mm; (d) 35 mm; and (e) 40 mm.
Small L4
Factors
For small L4 of experimental group, L4 is 10 mm, as shown in Figure 30.

Small L4’s factors.
Performance
Small L4’s performance is 29–50% for catching these grasping objects in the sampling range, as shown in Figure 31.

Small L4’s performance. (a) 20 mm; (b) 25 mm; (c) 30 mm; (d) 35 mm; and (e) 40 mm.
Different levels of comparison
For small L4’s different levels of comparison, researchers compared three levels. After this comparison, researcher researchers will be able to identify the size of the object that is suitable for small L4. Small L4’s three levels presented in Table 8 and shown in Figure 32.
Levels comparison of small L4.

Different levels of small L4. (a) 20 mm; (b) 25 mm; (c) 30 mm; (d) 35 mm; and (e) 40 mm.
Long L4
Factors
For long L4 of experimental group, L4 is 40 mm, as shown in Figure 33.

Long L4’s factors.
Performance
Long L4’s performance is 29–50% for catching these grasping objects in the sampling range, as shown in Figure 34.
Long L4’s performance. (a) 20 mm; (b) 25 mm; (c) 30 mm; (d) 35 mm; and (e) 40 mm.
Different levels of comparison
For long L4’s different levels of comparison, researchers compared three levels. After this comparison, researchers will be able to identify the size of the object that is suitable for long L4. Long L4’s three levels are presented in Table 9 and shown in Figure 35.
Levels comparison of long L4.

Different levels of long L4. (a) 20 mm; (b) 25 mm; (c) 30 mm; (d) 35 mm; and (e) 40 mm.
Small L5
Factors
For small L5 of experimental group, L5 is 30 mm, as shown in Figure 36.

Small L5’s factors.
Performance
Small L5’s performance is 26–45.5% for catching these grasping objects in the sampling range, as shown in Figure 37.

Small L5’s performance. (a) 20 mm; (b) 25 mm; (c) 30 mm; (d) 35 mm; and (e) 40 mm.
Different levels of comparison
For small L5’s different levels of comparison, researchers compared three levels. After this comparison, researchers will be able to identify the size of the object that is suitable for small L5. Small L5’s three levels are presented in Table 10 and shown in Figure 38.
Levels comparison of small L5.


Different levels of small L5.(a) 20 mm; (b) 25 mm; (c) 30 mm; (d) 35 mm; and (e) 40 mm.
Long L5
Factors
For long L5 of experimental group, L5 is 60 mm, as shown in Figure 39.

Long L5’s factors.
Performance
Long L5’s performance is 33.5–71.5% for catching these grasping objects in the sampling range, as shown in Figure 40.

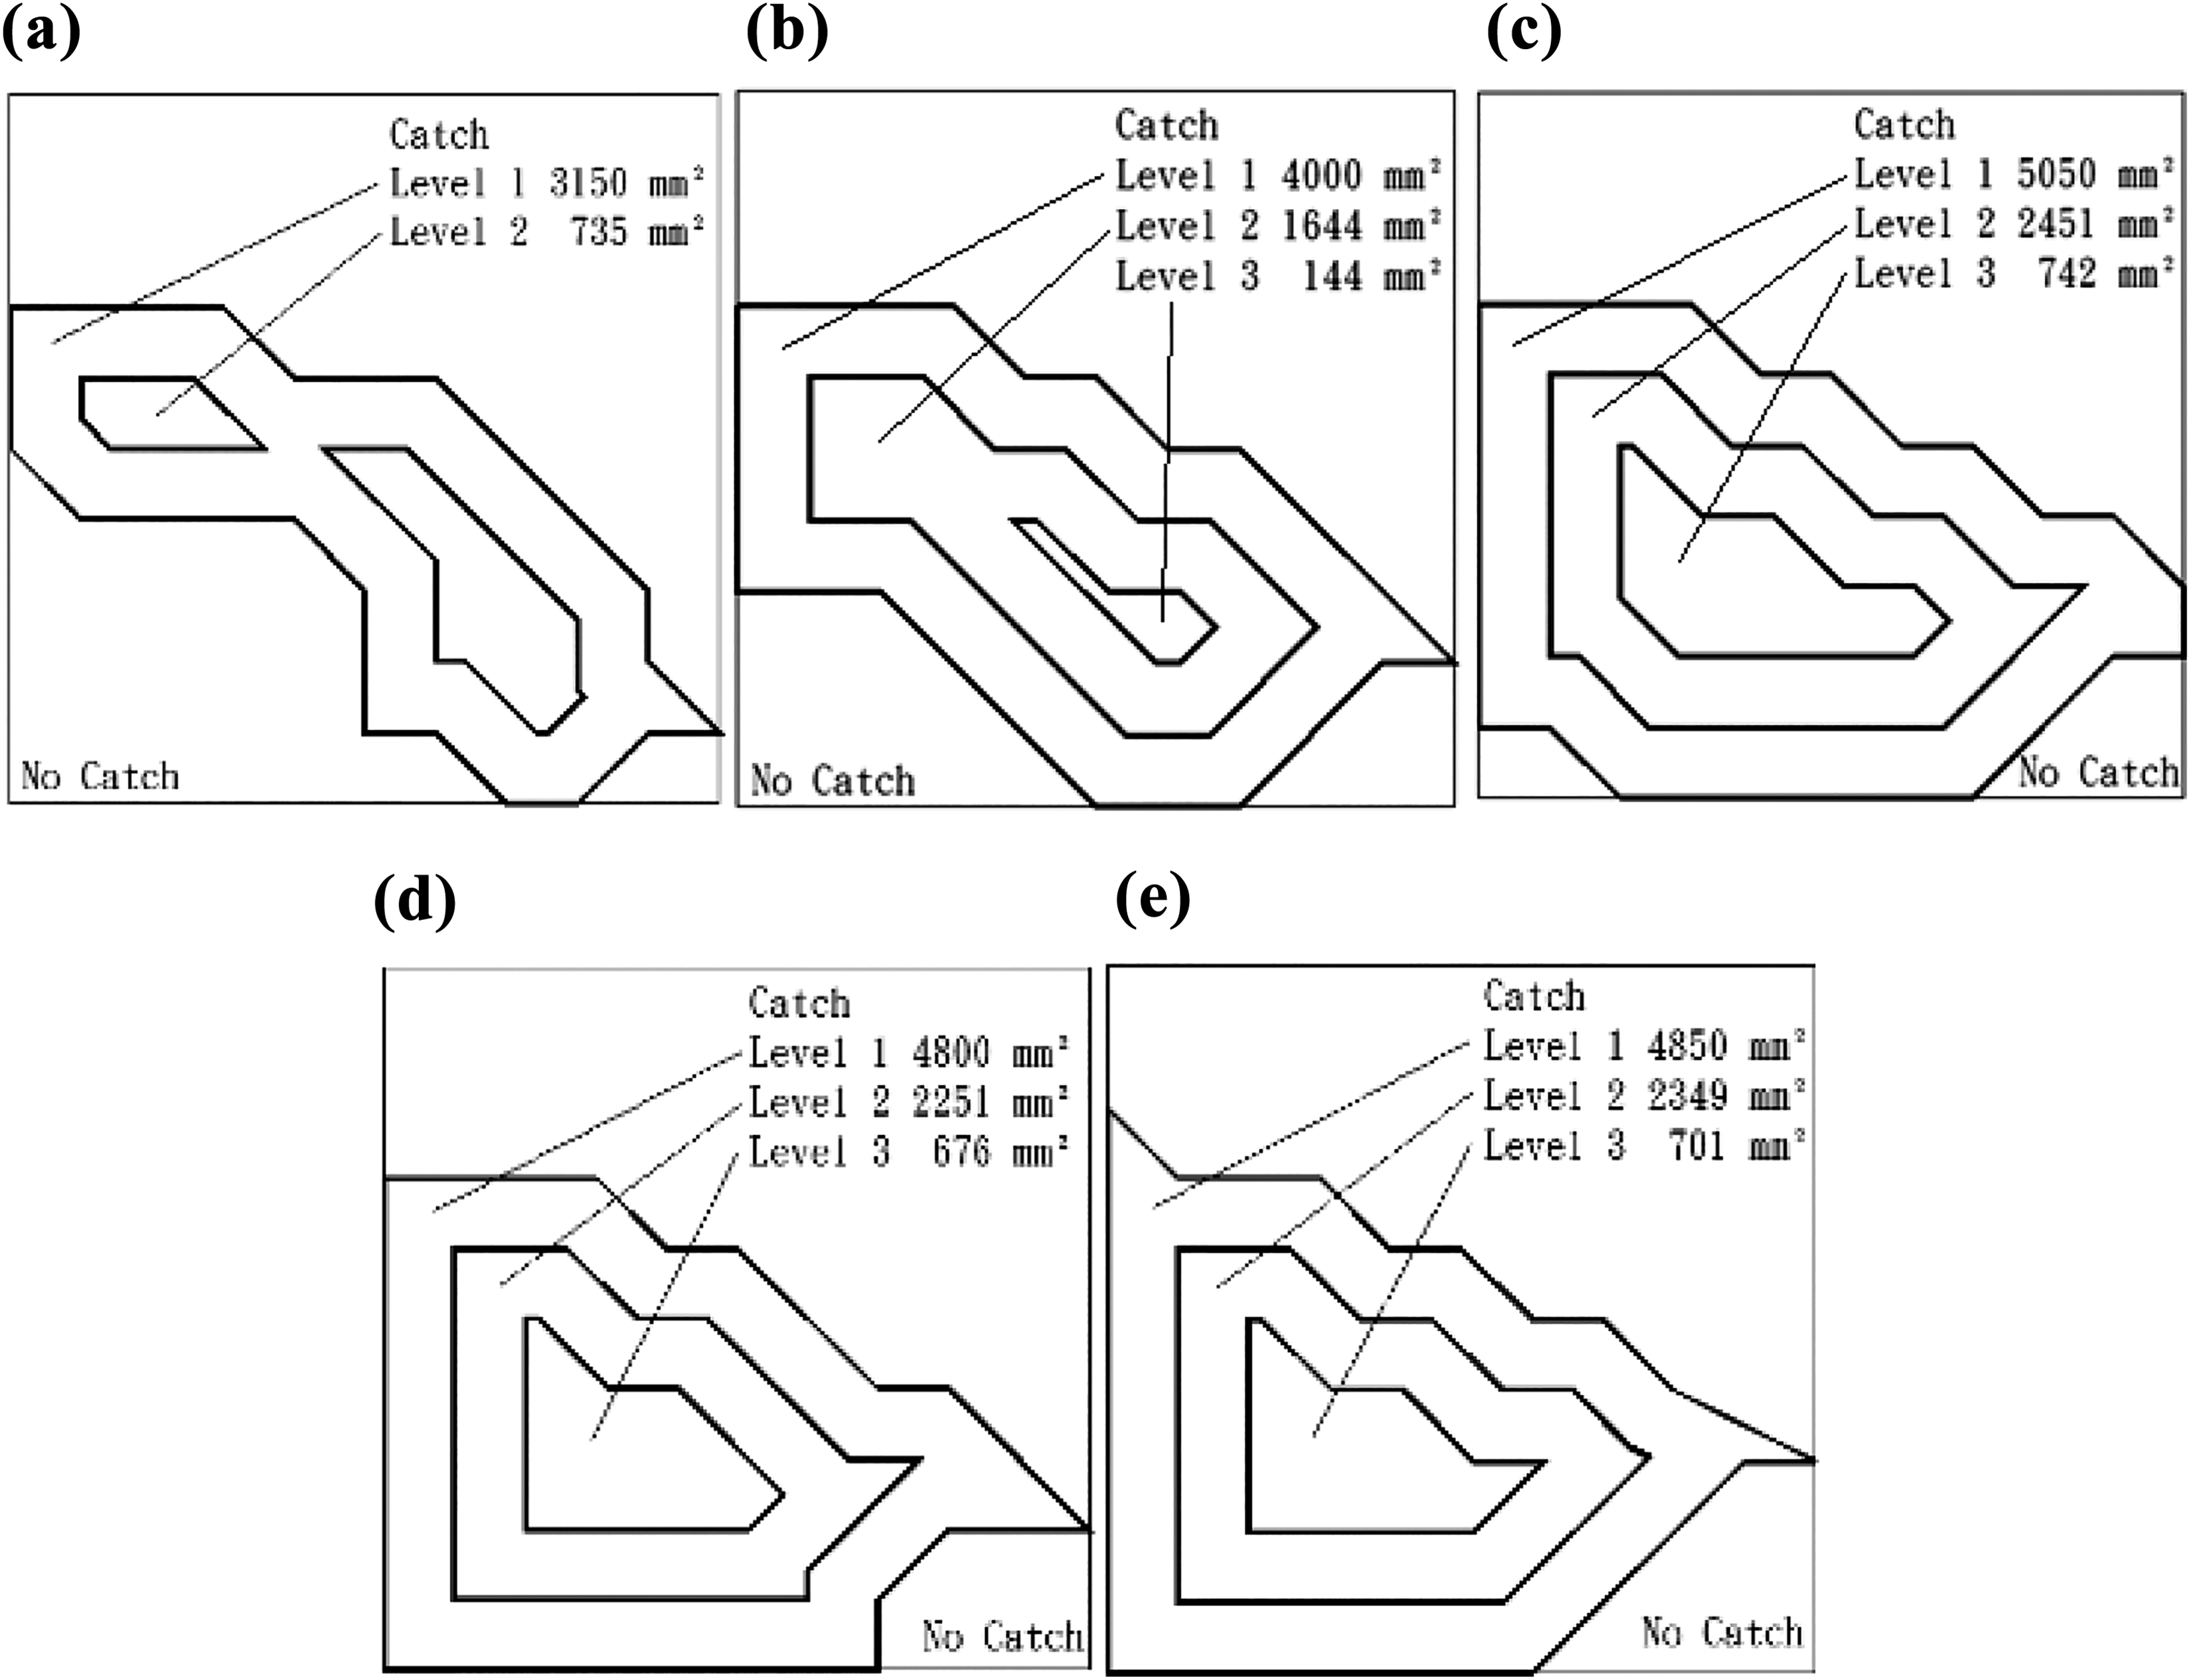
Long L5’s performance. (a) 20 mm; (b) 25 mm; (c) 30 mm; (d) 35 mm; and (e) 40 mm.
Different levels of comparison
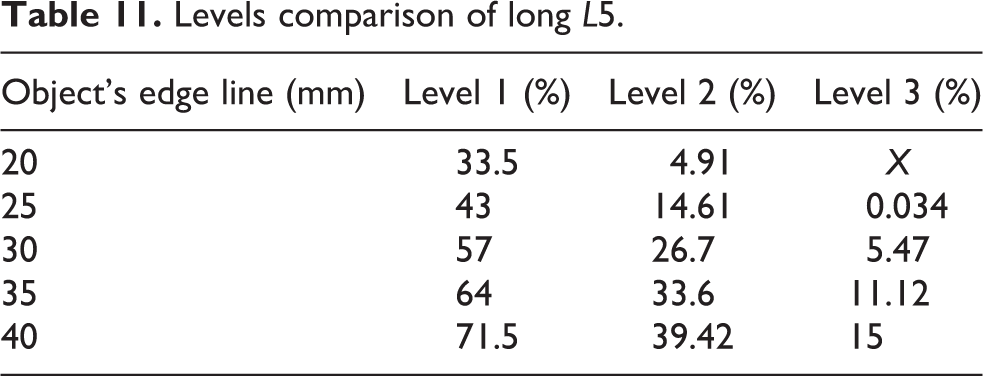
For long L5’s different levels of comparison, researchers compared three levels. After this comparison, researchers will be able to identify the size of the object that is suitable for long L5. Long L5’s three levels are presented in Table 11 and shown in Figure 41.
Levels comparison of long L5.

Different levels of long L5.(a) 20 mm; (b) 25 mm; (c) 30 mm; (d) 35 mm; and (e) 40 mm.
Small θ1
Factors
For small θ1 of experimental group, θ1 is 120, as shown in Figure 42.
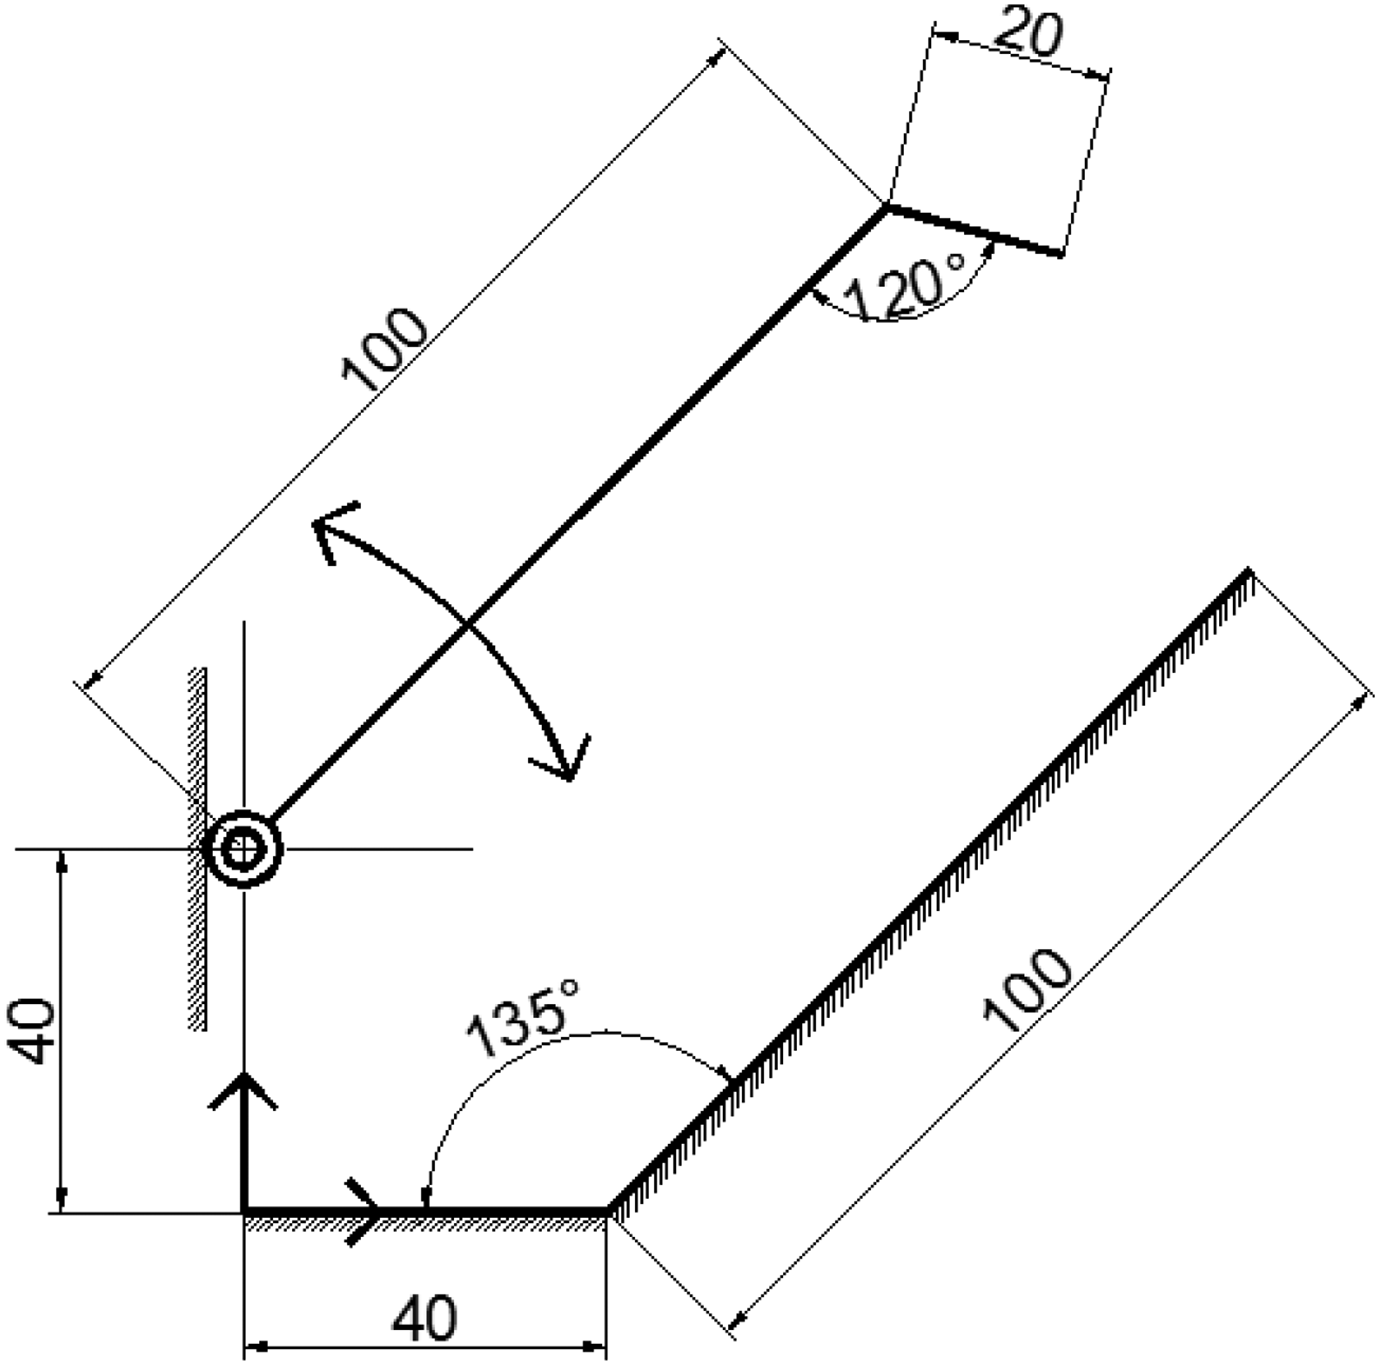
Small θ1’s factors.
Performance
Small θ1’s performance is 16–42.5% for catching these grasping objects in the sampling range, as shown in Figure 43.

Small θ1’s performance. (a) 20 mm; (b) 25 mm; (c) 30 mm; (d) 35 mm; and (e) 40 mm.
Different levels of comparison
For small θ1’s different levels of comparison, researchers compared three levels. After this comparison, researchers will be able to identify the size of the object that is suitable for small θ1. Small θ1’s three levels are presented in Table 12 and shown in Figure 44.
Levels comparison of small θ1.


Different levels of small θ1.(a) 20 mm; (b) 25 mm; (c) 30 mm; (d) 35 mm; and (e) 40 mm.
Large θ1
Factors
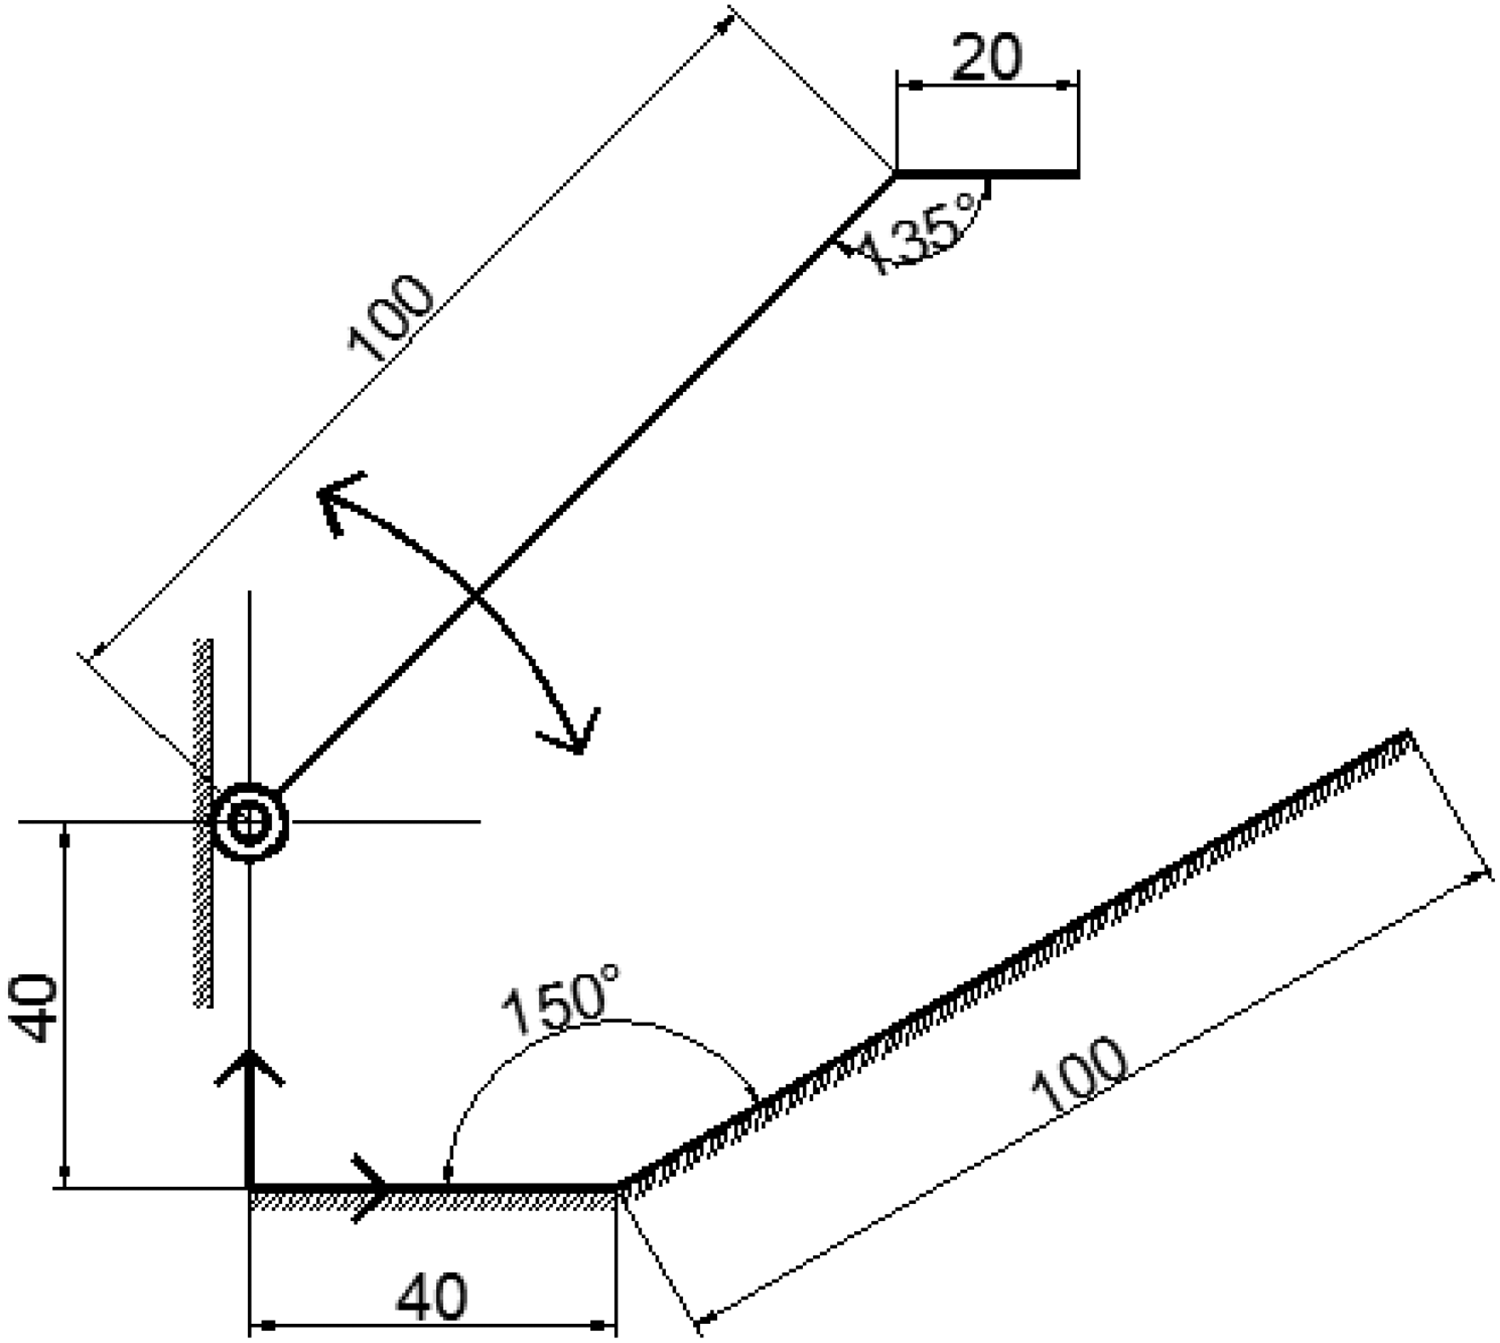
For large θ1 of experimental group, θ1 is 150°, as shown in Figure 45.

Large θ1’s factors.
Performance
Large θ1’s performance is 16–42.5% for catching these grasping objects in the sampling range shown in Figure 46.

Large θ1’s performance. (a) 20 mm; (b) 25 mm; (c) 30 mm; (d) 35 mm; and (e) 40 mm.
Different levels of comparison
For large θ1’s different levels of comparison, researchers compared three levels. After this comparison, researchers will be able to identify the size of the object that is suitable for large θ1. Large θ1’s three levels are presented in Table 13 and shown in Figure 47.
Levels comparison of large θ1.

Different levels of large θ1. (a) 20 mm; (b) 25 mm; (c) 30 mm; (d) 35 mm; and (e) 40 mm.
Small θ2
Factors
For small θ2 of experimental group, θ2 is 120°, as shown in Figure 48.

Small θ2’s factors.
Performance
Small θ2’s performance is 42.5–49% for catching these grasping objects in the sampling range, as shown in Figure 49.

Small θ2’s performance. (a) 20 mm; (b) 25 mm; (c) 30 mm; (d) 35 mm; and (e) 40 mm.
Different levels of comparison
For small θ2’s different levels of comparison, researchers compared three levels. After this comparison, researchers will be able to identify the size of the object that is suitable for small θ2. Small θ2’s three levels are presented in Table 14 and shown in Figure 50.
Levels comparison of small θ2.


Different levels of small θ2. (a) 20 mm; (b) 25 mm; (c) 30 mm; (d) 35 mm; and (e) 40 mm.
Large θ2
Factors
For large θ2 of experimental group, θ2 is 150°, as shown in Figure 51.
Large θ2’s factors.
Performance
Large θ2’s performance is 31.5–66% for catching these grasping objects in the sampling range, as shown in Figure 52.

Large θ2’s performance. (a) 20 mm; (b) 25 mm; (c) 30 mm; (d) 35 mm; and (e) 40 mm.
Different levels of comparison
For large θ2’s different levels of comparison, researchers compared three levels. After this comparison, researchers will be able to identify the size of the object that is suitable for large θ2. Large θ2’s three levels are presented in Table 15 and shown in Figure 53.
Levels comparison of large θ2.


Different levels of large θ2. (a) 20 mm; (b) 25 mm; (c) 30 mm; (d) 35 mm; and (e) 40 mm.
Discussion and conclusions
In this research, the image model method was successfully used to analyze the performance of an effective and easy-to-build grippers in mobile robots to search for objects and catch them.
This method can identify the exact boundary of catch. Isocline of level 1 shows that long L3, long L4, long L5, and large θ2 are the best performance grippers in control and experimental groups, as shown in Figure 54.
This method has filtering characteristics. Isocline of level shows that isocline has a filtering characteristic that helps the user find the suitable factor. The closer the boundary area is to zero, the closer it is to the best catch ranges.
This method can find the best catch point or range. Isocline of level shows that the isocline can be filtered continuously to explore the best catch ranges until the boundary area is zero. This means that the method will surely find the best point to catch.
For this gripper, adjustment to increase L3, L4, L5, and θ2 can increase the original performance by 20–50%.
The gripper is formed by an integrated easy-to-build structure, which includes just Rocker–Finger and Fixed–Finger grippers. In warehouses, an innovative gripper technique can be installed for a mobile robotic to efficiently move and gather materials from floor to specified zones. The materials are like cube goods (e.g. box, stone, bricks, plastic, metal blocks, and wood blocks).
In order to reduce the time and money for building and manufacturing a gripper for a mobile robot to catch objects, this research implements gripper technique to reduce the error of catching the object, and competitors can win a mobile robot competition.
This research can be used for improving sweeping capability of road and street sweepers, which can more ideally remove debris from the gutter and roadsides that would otherwise go into storm drains, causing water pollution.
The next generation of an effective and easy-to-build structure gripper for mobile robots will be upgraded for not only better kinematics capabilities but also much better dynamics performances, which will be revealed in the future.

Performance comparison.
Footnotes
Declaration of conflicting interests
The author(s) declared no potential conflicts of interest with respect to the research, authorship, and/or publication of this article.
Funding
The author(s) received no financial support for the research, authorship, and/or publication of this article.