
Abstract
Crack is one of the most important defects to evaluate the health of concrete buildings. Hence, accurate detection is of great significance for the infrastructure maintenance. In this article, an efficient multichannel active contour model for crack extraction is proposed, which integrates various features of the cracks. Firstly, the nonlocal means technique is adopted to eliminate the effects of noise while preserving the edge details. Then, the novel multichannel active contour model energy function is constructed, which considers three characteristics of the cracks: (a) the intensity features map, which is on the basis of the distinct intensity of the cracks; (b) the saliency feature map, which is obtained by the frequency-tuned salient region detection; and (c) the line-like feature map, which is enhanced by the multi-scale Hessian filtering. Also, the line-like feature map is binarized by a set of morphological operations and the Otsu thresholding to initialize the active contour. The proposed approach has been compared with the existing detection models on the public database and the real-world cracks. The experimental results show the effectiveness and efficiency of the proposed model.
Keywords
Introduction
Concrete architectures are the most common infrastructures in cities. Due to the low tensile strength of the concrete architectures and the aging of buildings, various concrete diseases are easy to occur, resulting in engineering accidents, and even causing huge economic losses and personal injuries. Among these defects, cracks are the early diseases of the concrete structures. Therefore, the accurate crack detection means a lot for the health evaluation of concrete buildings. Early crack detection mainly relies on the experienced manual operation, which is time-consuming and laborious. With the development of the machine vision, the image processing-based techniques have been paid more and more attention. 1 –3 The difficulty of image-based detection is due to the irregular shapes and sizes of the cracks, the noise, the uneven lighting conditions, and complicated environment. 4 Various attempts have been made to develop the image-based crack detection, which can be roughly divided into the following major categories: intensities-based methods, 5,6 edge-based methods, 7,8 shape-based methods, 9,10 and the integrated methods. 10,11
Due to the fact that the crack intensity is in sharp contrast with the surroundings, some basic methods such as the thresholding approaches 5,6,12,13 and the salient detection 14,15 have been widely used in the past decades. For the thresholding methods, each pixel is assigned to the crack/non-crack according to the threshold value obtained in a global way 12 or local way. 13 These methods are affected by the noise and lack the global constraints, which lead to poor detection. On the other hand, the salient detection techniques use the low-level visual feature information, such as the color, brightness, and direction, to obtain the salient map, 14,15 the results of which are likely to be incomplete and inconsistent. The edge-based technologies, such as the Canny, Sobel, and others, calculate the gradient magnitude across the images, 7,8,16 which in essence take advantage of the gray-level contrast information between cracks and non-cracks. However, there is a restricted application for the cracks without obvious intensity contrast with the surroundings. The local crack patches are approximately linear, including longitudinal, transverse, diagonal, and the like. 9 As a consequence, more efficient information, 9,10 such as the shape 7,10,17 and texture (such as Gabor and local binary patterns (LBP)), 17,18 has been introduced into the advanced detection methods. Given the linear structures of the crack, the multi-scale Hessian-based filter is employed to enhance the linear characteristics of the crack. 19 The defect of the model lies in that the step edges would be mistaken for crack. 10
Actually, all the above mentioned methods can be regarded as unsupervised methods. Various supervised learning techniques have been a significant branch for crack detection task. 9,20,21 Considering the specific geometric features 9 and the intensity statistical information of the cracks, the classifiers, that is, support vector machine (SVM), 21 the neural network, 22 the Bayesian classifier, are trained to identity the crack and non-crack. However, the techniques are performed on pixels or local sub-images, and hence have disadvantages in detecting the complete objects. Recently, some deep learning algorithms are developed for automatic crack detection, 23,24 which show higher accuracy compared with the existing detection methods. However, for the training of the deep convolutional neural networks, a large number of annotated crack images are required, which restrict their real application.
In fact, it is difficult for a single detection algorithm to achieve ideal results. In consequence, some hybrid systems are designed in this field to incorporate the merits of various algorithms. 25,26 Zou et al. 25 have explored an automatic crack detection for pavement images, which uses the geodesic shadow-removal algorithm to remove the shadow, the tensor voting to obtain crack probability map, and the graph model to represent the seeds of the sampled map. Zhang et al. 26 have proposed an efficient and reliable coarse-to-fine approach for asphalt pavement crack detection, which integrates the adaptive thresholding method, the region of belief, and a novel region growing algorithm. The energy functions of the active contour models (ACMs) 10,11,27 are established based on the characteristics of the cracks (intensity, edges, textures, etc.), which could be regarded as general and flexible frameworks. In general, the problems existing in the aforementioned methods could be solved to certain extent by ACMs. The region-scalable fitting (RSF) model and the related extensions, as described in the work of Li et al. 28 and Liu and Peng, 29 work in locally varying regions, and hence perform well in segmenting images with uneven intensity. In addition, some constraint terms on the basis of the area and length information could be introduced to ensure the global performance of the models.
Inspired by the success of ACMs for image segmentation task, an efficient multichannel ACM for crack extraction is proposed, which integrates various features of the cracks. Since the crack images often contain noise, the nonlocal means (NLM) model is utilized to eliminate noise while preserving the edge details. Three characteristics of the cracks assist to establish the energy function of the proposed multichannel ACM: (a) the intensity features map, which is based on the distinct intensity of the crack; (b) the saliency feature map, which is obtained by the frequency-tuned salient region detection; and (c) the line-like feature map, which is emphasized by the multi-scale Hessian filtering. The Otsu thresholding and a group of morphological operators are adopted to binarize the line-like feature map, the result of which is set as the initial contour. Note that the proposed method was first presented in the work of Xie et al.,
30
and the differences and extensions in this article are as follows: Different from the previous method,
30
the proposed model in this article is a novel multichannel ACM framework which uses more features maps. More detailed derivation procedures are provided. In addition, numerous comparison experiments are carried out to demonstrate the performance.
The next section introduces the detailed description of the whole algorithm. The third section presents the experiments and analysis; finally, the conclusion is drawn in the fourth section.
Methodology
This section focuses on the detailed description of the proposed crack detection technique, flowchart and brief description of which are shown in Figure 1. The whole detection system consists of three parts: In the first part, the NLM technique is employed to smooth the crack images without destroying the structures of the target. The second part concentrates on the multichannel ACM which establishes the integration region-scalable fitting energy over three types of maps, that is, the intensity-based map, the visual salience map, and the multi-scale line-like feature map. Note that the morphology operators of the dilation reconstruction and the erosion reconstruction are implemented on the Hessian-based feature map to remove the noise and the small pseudo-targets. Then the Otsu thresholding is introduced to achieve a binary map which solves the initialization of the ACM. Finally, the post-processing operation is also performed, which favors a fined result.
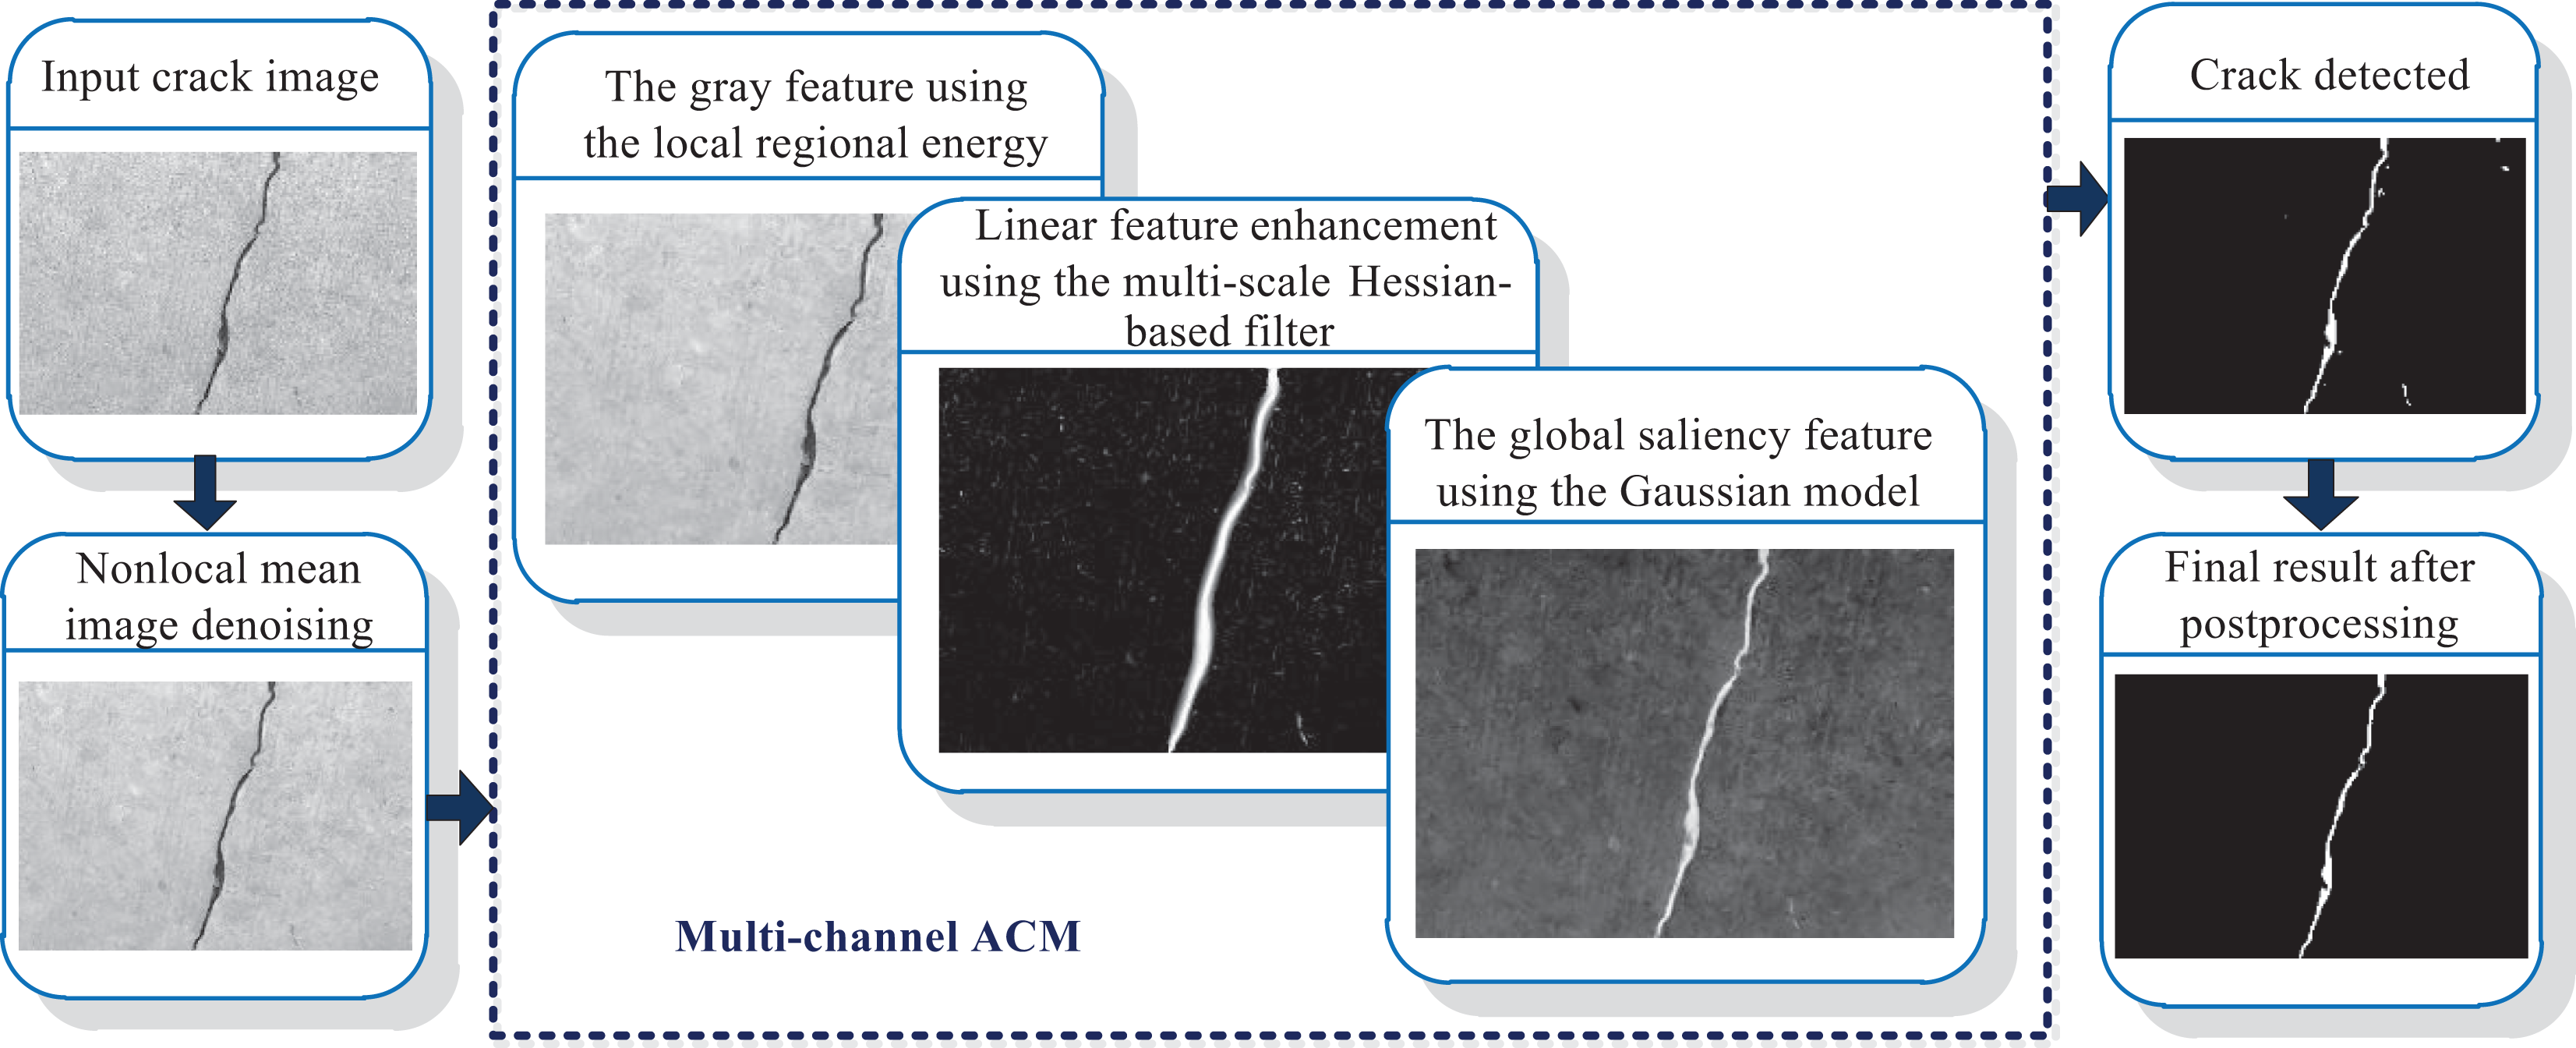
Flowchart and description of the proposed model.
The NLM image denoising
The NLM filter
31
fulfills the image denoising task by estimating the weight of the center pixel according to the similar structures in the neighborhood of the image. In order to calculate the weight of the pixel, the NLM takes the related block as the reference unit to find the similar regions over the image. Further, various fast NLM models, benefiting from different principles, for example the integral image technique, have emerged to speed up the denoising process.
32
In this article, the fast NLM filter proposed in the work of Darbon et al.
32
is adopted to smooth the image. It only computes and handles the integral image in one offset direction at a time, which avoids solving all integral images at one time and thus saves time. To facilitate the following description, the original input image is denoted as

The denoising results using three filters: (a) input image, (b) result of bilateral filter, (c) result of guided filter, and (d) result of NLM filter. NLM: nonlocal means.
Multichannel ACM
This subsection begins by recalling the multichannel local region ACM and three types of maps.
The multichannel ACM and the intensity-based map
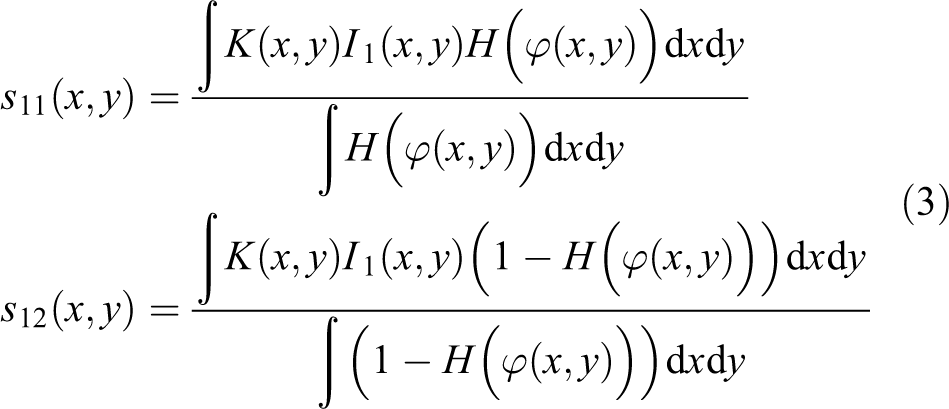
The ACM represents the object boundaries as the zero level set of a higher dimension level set function, which does well in handling complex topology structures. The integration method in this article integrates the merits of the local region-based Chan-Vese model (LRCV) 29 and the multichannel strategy. The LRCV model replaces the averages of the global regions by that of the local regions centered at the current pixels. Thus it is suitable for segmentation of images with uneven intensity. In this article, the energy function is composed of five terms. The first two are the multichannel fitting energy terms which measure the differences between the center pixel and the local average intensity in each image channel. The third and fourth ones are penalties for the length and area terms, respectively, which are devoted to smoothing the curves. The last penalty term penalizes the deviation of the level set function from the signed distance function. The energy function is defined as

where

where the fix parameter ε = 1. In terms of grayscale feature, the intensity of crack pixels is darker than that of the background. The image I
NLM which is filtered by the NLM is input as one channel feature of the multichannel ACM, that is,
where the kernel function

Visual saliency map
Inspired by human visual attention mechanism, the saliency detection algorithms distinguish the regions of interest from the background automatically. The colors, brightness, edges, and other features of the image are used to measure the difference between the desired region and its surrounding pixels, and then the significance of the image region is calculated. In this article, the visual saliency detection presented in the work of Acosta et al. 12 is performed on the image I NLM to obtain a feature map which is then incorporated into the multichannel ACM. The saliency map is defined as

where

where the kernel function
Multi-scale Hessian-based feature map
From a shape perspective, the local crack patches could be treated as line-like geometric structures with various sizes. The multi-scale Hessian-based technique is adopted to characterize the line-like objects. The Hessian matrix computes the second order derivatives at pixel point

Note that

where the constant normalization factor c controls the sensitivity of measures Rb . Actually, the value of equation (8) measures the likelihood that a pixel belongs to the crack target. Different scale parameters s are responsible for different width of cracks. The appropriate scale s makes the likelihood function achieve large value at a certain crack width. Hence, the multi-scale Hessian technique is adopted to deal with the cracks with different widths. The final result is the maximum response of all responses at different scales
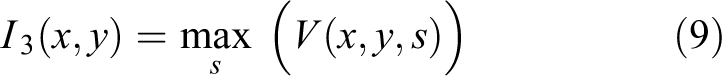
where

where the kernel function
Active contour initialization
The contour initialization in ACMs has always been a concern. Typically, a binary region is set on the tested image either manually or automatically, which further derives the signed distance function. In general, the binary area is selected on the principle that it contains part of the object at least. The initial contour of the proposed model is derived from the line-like feature map. Unfortunately, some noise and small linear non-cracks are also enhanced. Therefore, some subsequent processing techniques are required to optimize the results to obtain a binary result.
Morphology processing
The morphological open operators with linear structural element are applicable for the line-like crack detection. Since the cracks are oriented in arbitrary directions, the structural elements of different angles and sizes are required. To eliminate noise and retain the tiny and tortuous cracks, the supremum of opening and reconstruction operators 34 are performed on the feature map. Subsequently, the supremum of closing operator is utilized to fill in the holes of the result as described in the work of Heneghan et al. 34
Otsu thresholding
After the morphological operations, the Otsu thresholding is adopted to obtain a binary mask. On the basis of the threshold value, the pixels inside the detected object are set to 1, while pixels outside are set to 0. The output binary mask (seen in Figure 1) could be treated as a crude detection, which is marked as

where
Implementation and post-processing
The position relation between the contour and the target determines the movement direction of the curve. To accelerate the evolution, the signed balloon force is introduced into the area term, the positive sign of which is responsible for the shrinkage and negative sign takes charge of the expansion. Thus, the balloon force is defined as

where γ is a positive constant parameter which is set to 0.5 in this article. Minimizing the energy function (equation (1)) in terms of the level set function

With the initialization
According to the final contour, some noise points are also detected. Thus, some improvements could be made further to achieve satisfactory results. Usually, the post-processing is done based on the area size of region. The threshold of the area size is set to 30 in this article. If the area size is smaller than the threshold, the object is regarded as the noise which is eventually removed.
Experimental
In this section, some experiments are performed to verify the effectiveness of the proposed method. The experimental part starts from the comparisons between the improved Hessian response filter and the model proposed in the work of Frangi et al.
33
Then the proposed approach is compared with the existing ACM models. Finally, comparisons between some state-of-the-art crack detection algorithms and the proposed method are conducted on the real-world crack images. Unless otherwise noted, the parameters are set as
To evaluate the results quantitatively, four metrics, that is, the True Positive Ratio (TPR), the False Positive Ratio (FPR), the Precision, and the Dice Similarity Coefficient (DSC), are adopted, which are defined as

where TP (true positives) denote object pixels which are detected correctly while FN (false negatives) refer to the object pixels which are misclassified as background. TN (true negatives) represent the background pixels which are classified correctly while FP (false positives) are the background pixels which are misclassified as objects. The closer TPR, DSC, and Precision values are to 1, and the closer FPR values are to 0, the better the detection performance.
The experiment in Figure 3 shows the performance of the improved Hessian-based enhancement technique. The popular Frangi model 33 has been widely used in line-like objects enhancement, which has proved to be an effective approach as exhibited in Figure 3(b). Nevertheless, the Frangi model suffers from low responses at the special locations, for instance, the transition and bifurcations, as highlighted with yellow circles in Figure 3(b). As a consequence, some small and thin cracks may not be detected. In contrast, the novel approach has the ability to enhance various types of cracks, as seen in Figure 3(c).

The enhancement results using two types of Hessian-based approaches: (a) original image, (b) results of the model proposed in the work of Frangi et al., 33 and (c) results of our model.
To further demonstrate the performance of the improved Hessian-based filter, more details of the results are presented in Figure 4. Figure 4(a) shows the raw image and the response map in local area bounded by blue dotted line. A line position is chosen as shown in the response map, and the intensity distribution curve at that position is drawn as displayed in Figure 4(b). It is observed from Figure 4(b) that the improved Hessian enhancement model obtains a flatter response at the narrow turn of the crack. On the contrary, the classical Frangi model could obtain more thinner responses which would have an adverse effect on some types of cracks. It is concluded that the improved model has the ability to detect a continuous crack and provide better initial contour.

Responses of two filters: (a) original image and the Hessian responses in local area bounded by the blue dotted line and (b) responses of two filters along a line through the crack marked with red line in (a).
The features maps of the proposed model play vital roles in detecting the cracks. In Figure 5, three channel maps are used to construct three different detection models, respectively, and the results are compared with that of the multichannel model. Five real crack images with different backgrounds are tested in Figure 5. As shown in Figure 5(a), the first channel model, which is only based on the intensity feature map, achieves the best performance among the three single-channel models. It is worth to point out that the intensity is quite important feature for the crack. The second feature model, which only relies on the visual saliency map, could capture some other cracks, as seen in Figure 5(b). Figure 5(c) provides the third channel model, that is, the Hessian-based map, which detects the least cracks. The three single-channel models are capable of detecting the cracks more or less, the results of which are somewhat complementary. However, the results of the proposed multichannel model are more complete and continuous, which demonstrate the effective comprehensive utilization of multichannel features.
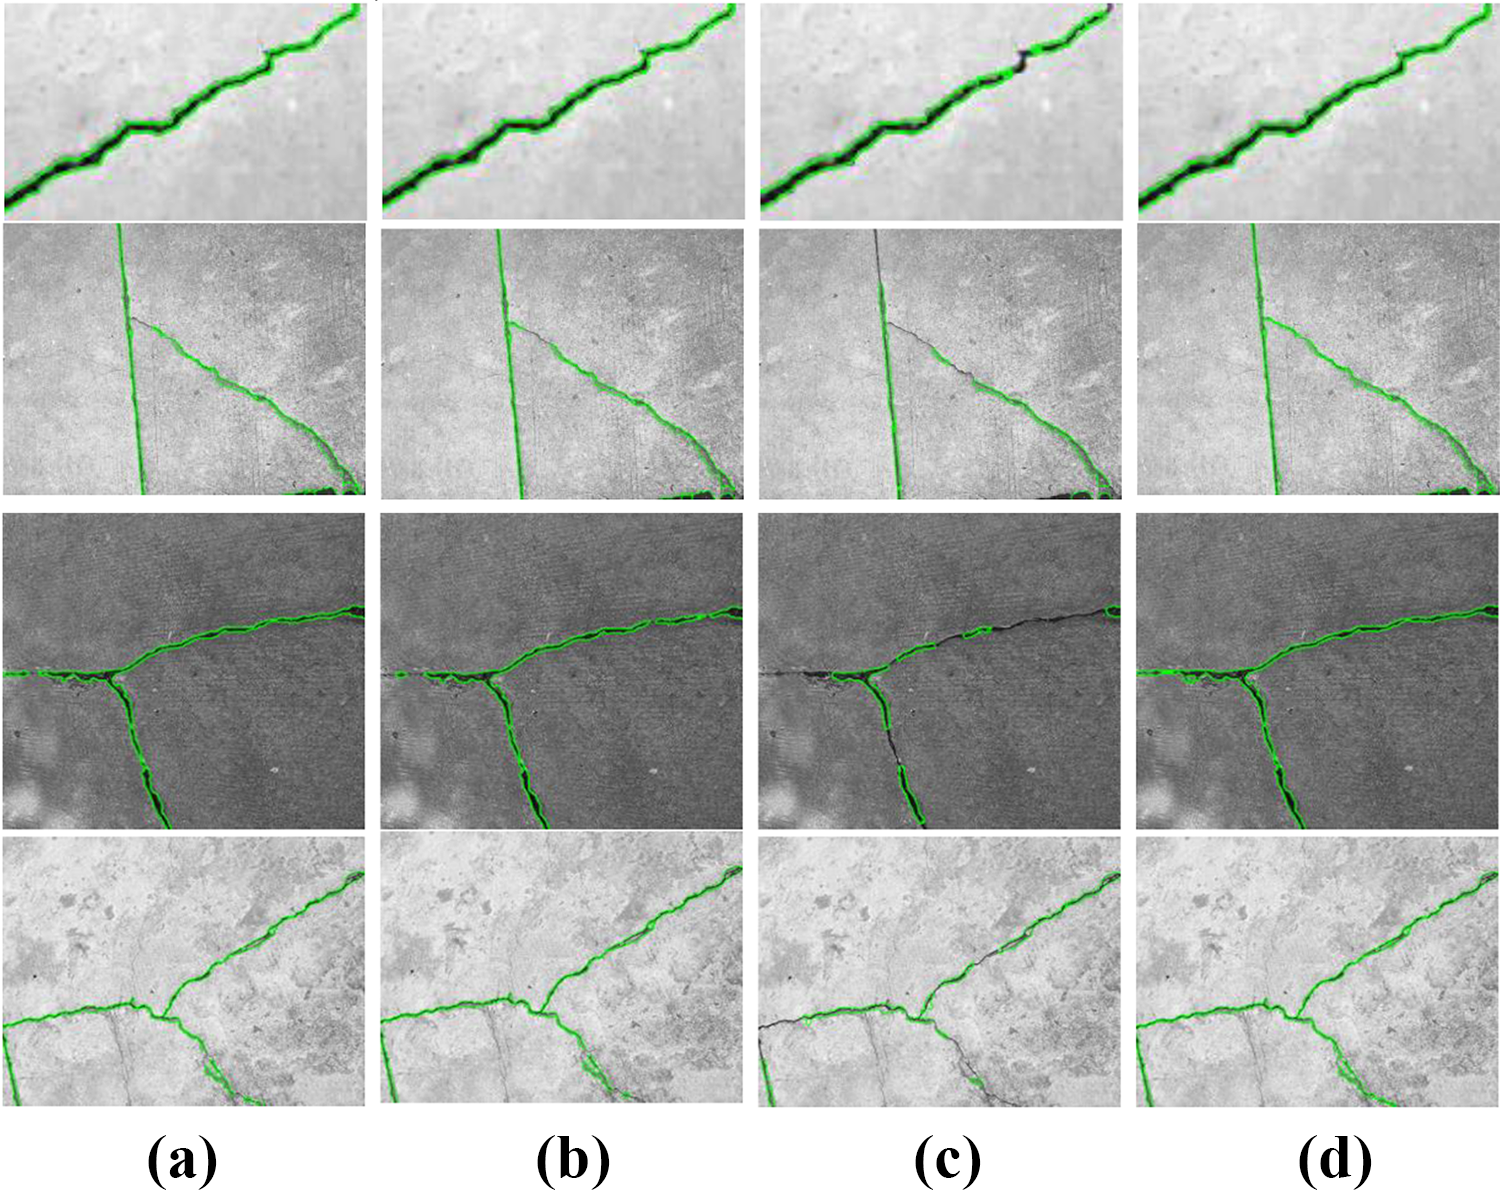
Detection results of the proposed model in terms of single channel map: (a) first channel, (b) second channel, (c) third channel, and (d) multichannel.
Further, to compare the detection results of the four models quantitatively, we conduct the experiments on 10 images with ground truth which are from the public crack data set. 9 The four metrics are calculated, the average values of which are listed in Table 1. Note that the values for the best performance are marked in bold.
Four metric averages of 10 images on the crack data set. 9

DSC: Dice Similarity Coefficient; TPR: True Positive Ratio; FPR: False Positive Ratio.
From Table 1, the TPR of the proposed model is the highest, indicating that multichannel feature is helpful to detect more real crack pixels. However, there is a risk of detecting more background pixels, which is verified by the FPR metric. The third channel model has the lowest FPR value and the highest Precision value since it only detects partial crack. The DSC metric, which is the harmonic average of TPR and Precision, is a global quality metric. Thus, the overall performance of our model is better than the separation channel models. Meanwhile, the DSC metric of the first channel model is the highest among the three single-channel models, indicating that the intensity is quite important feature for the crack, the conclusion of which is consistent with that of the experiments in Figure 5.
The experiments in Figures 6 to 8 are conducted to compare the existing ACM, that is, the LRCV model 29 and the proposed model. In Figure 6, a set of real images are tested to qualitatively compare the results of the two models. For the proposed model, the initial contour is set according to the Hessian filtered response map which could be observed in Figure 6(a). For fair comparison, we set the same initial condition for the LRCV model. The final contours and the corresponding binary results of the LRCV are exhibited in Figure 6(b) and (c). The results show that the LRCV model is effected by the complex background. However, the proposed model, the results of which are seen in Figure 6(d) and (e), presents the satisfactory results.
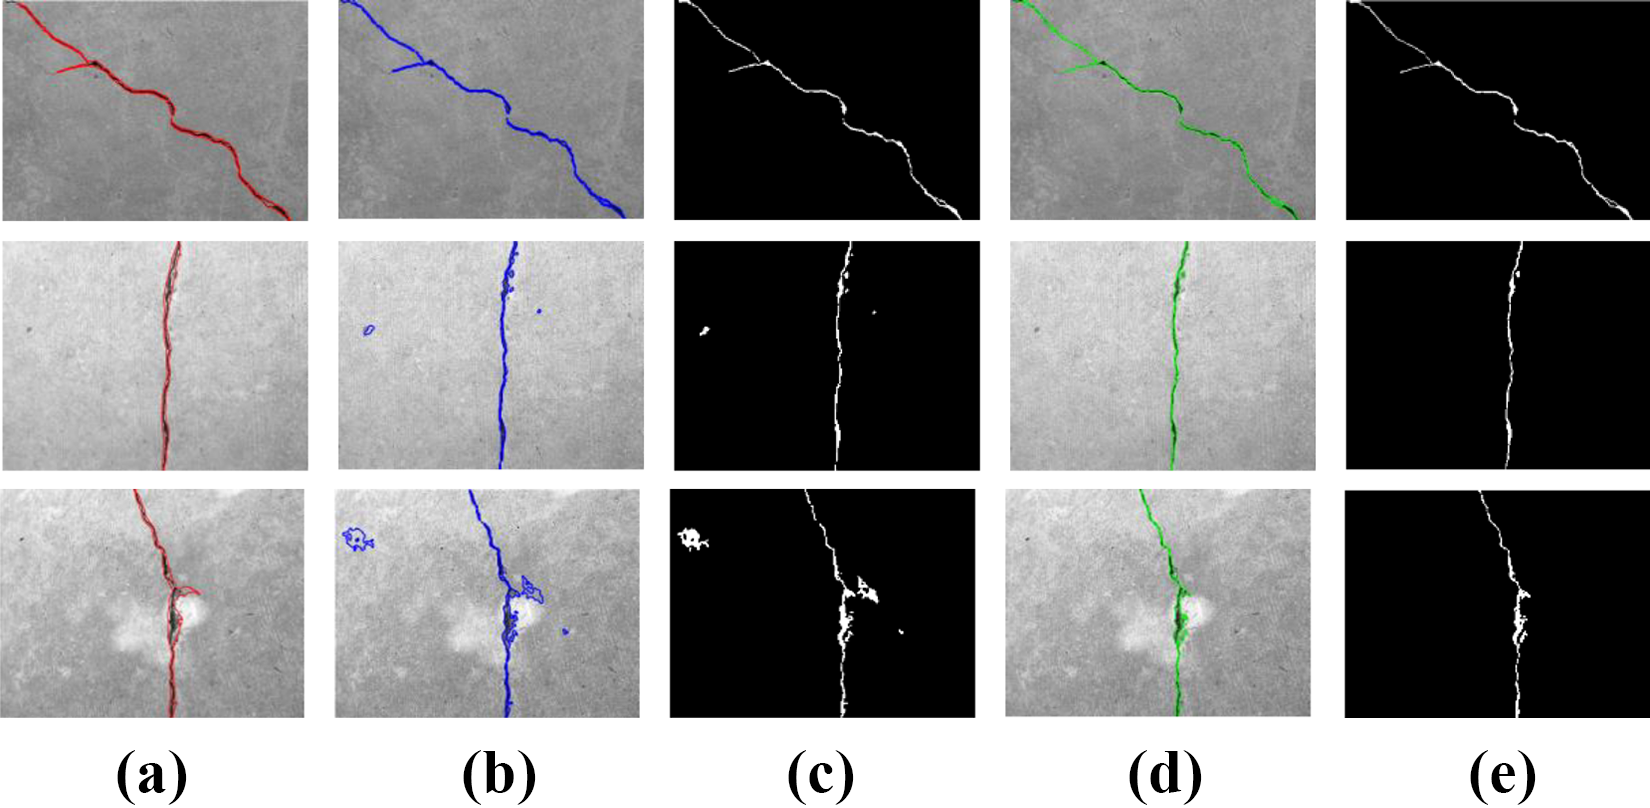
Comparison of the LRCV and the proposed model on the crack images: (a) initial contour, (b) final contour of LRCV, (c) result of LRCV, (d) final contour of ours, and (e) result of ours.

The partial results on the crack data set for the two models compared to the ground truth: (a) input image, (b) ground truth, (c) LRCV, and (d) ours.

Four metrics of the 41 real images in Figure 7: (a) TPR, (b) FPR, (c) Precision, and (d) DSC. DSC: Dice Similarity Coefficient; TPR: True Positive Ratio; FPR: False Positive Ratio.
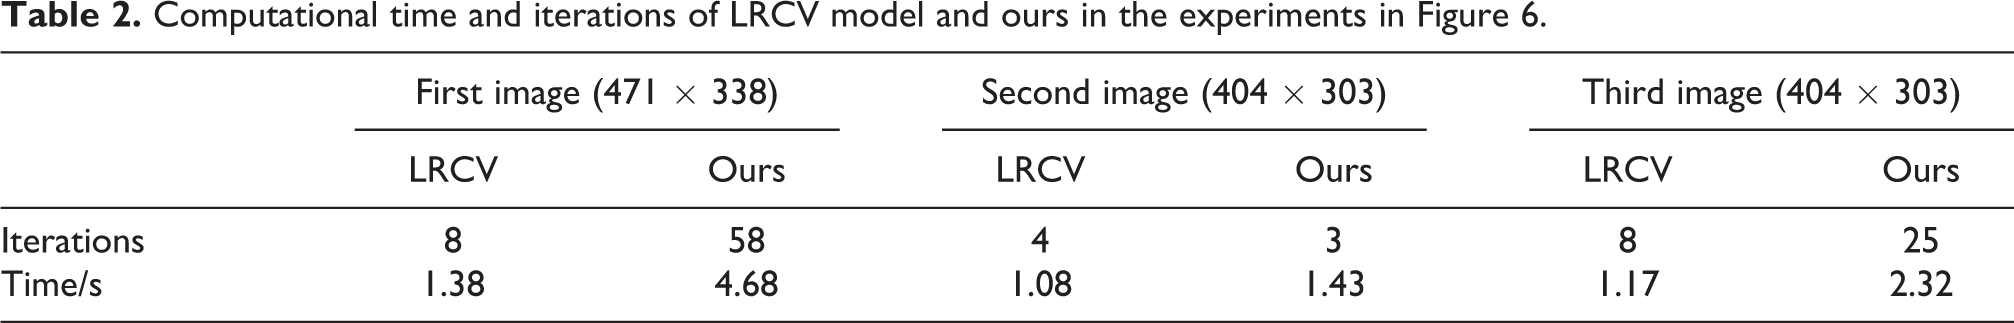
In the experiments of Figure 6, the running time and iterations of LRCV model and the proposed model are listed in Table 2. The sizes of the test images are also provided. From Table 2, it is concluded that our model takes more time and iterations than the LRCV model. It may be caused by the use of the three channel maps of our model while the LRCV is only based on the intensity map. However, the proposed model only takes less than 100 iterations to reach the optimal solution.
Computational time and iterations of LRCV model and ours in the experiments in Figure 6.
For quantitative comparison of the two models, experiments on a public crack data set 9 are conducted, the partial results of which are shown in Figure 7. In the data set, the ground truth images of the cracks are also provided. The results of the LRCV model and the proposed model are displayed in Figure 7(c) and (d), respectively. As can be seen from the figures, the results of the proposed model obtains more accurate crack targets. However, the difference in the results of the two ACMs is not obvious intuitively. Figure 8 gives the quantitative evaluation results on 41 images in terms of the four metrics.
The TPR, FPR, DSC, and Precision metrics are calculated according to the ground truth and the detection results. As can be seen from Figure 8(a), the average TPR of the LRCV is better than the proposed model. It is noted that the TPR metric measures the degree of the non-detected objects. However, higher value indicates that the LRCV detects the crack part as more as possible but also may contain more non-cracks simultaneously, which could be confirmed in Figure 8(b). The FPR measures the proportion of the background pixels which are incorrectly assigned to the targets. Figure 8(b) illustrates that the proposed model has less false detection. From Figure 8(c), the proposed model produces higher Precision value than the LRCV. The DSC metric, which is the harmonic average of TPR and Precision, is a global quality metric. Again, the overall performance of our model is better than the LRCV model, which demonstrates that the proposed approach provides more precise results. All the quantitative and qualitative comparisons show the superior performance of the proposed model.
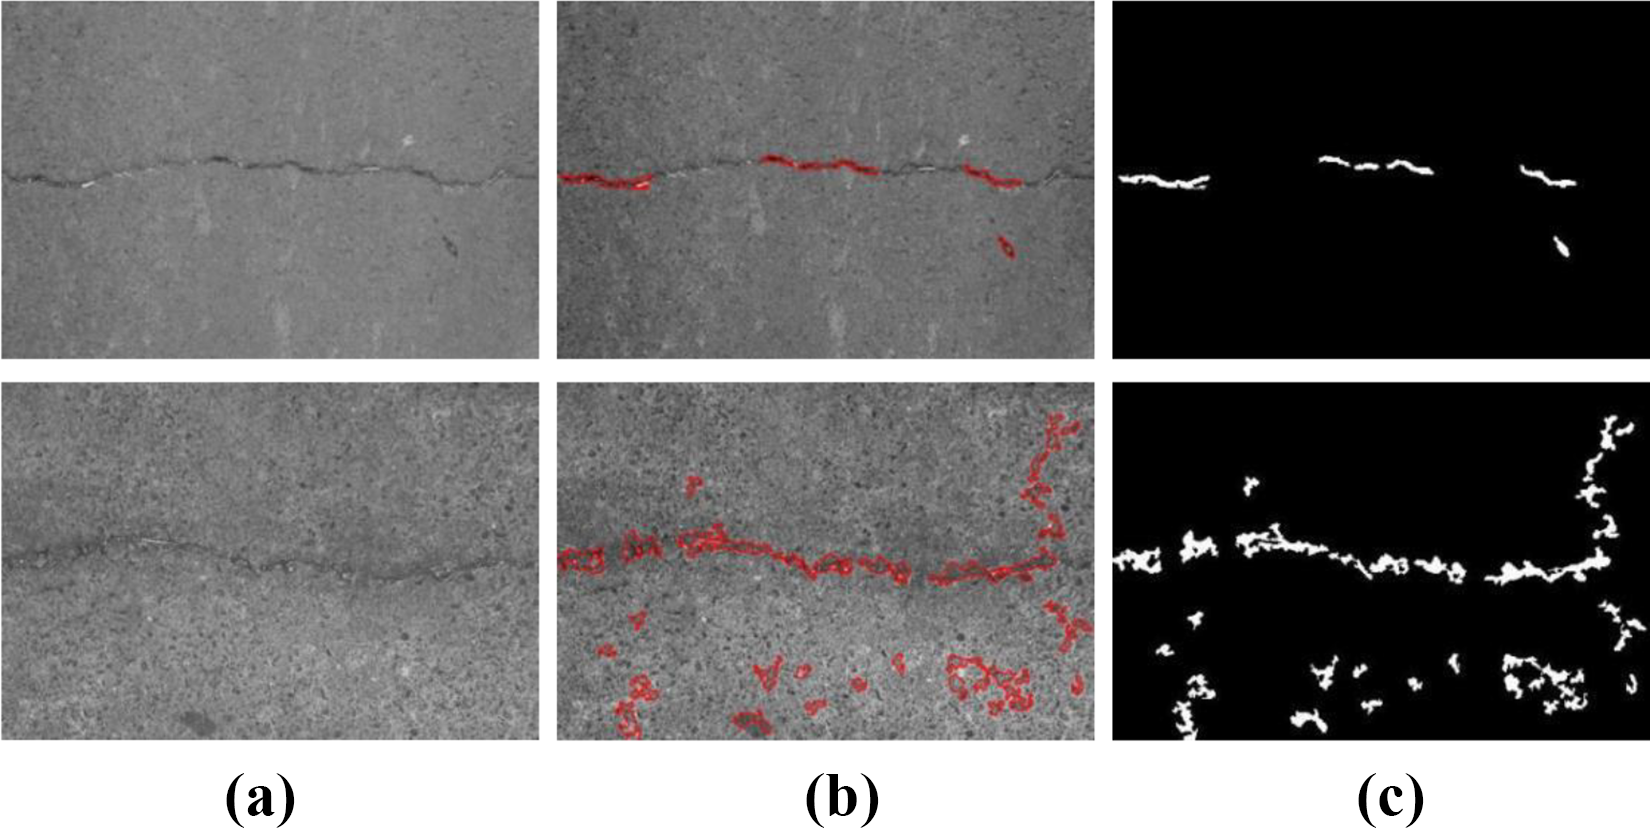
Next, the proposed model and the CrackForest 9 model are utilized to detect some real crack images. The detection results are displayed in Figure 9 for comparison. The CrackForest model uses the integral channel features and combines the representation with random structured forests. The first row of Figure 9 shows the original images which are obtained with different backgrounds. The second row of Figure 9 presents the results of the CrackForest, where darker color indicates that the pixel is more likely to be crack. As can be seen from the second row of Figure 9, the CrackForest model detects all the cracks since it works by containing as many cracks as possible. However, the final results of the CrackForest model are thicker than the real crack. As can be observed from the third row of Figure 9, the proposed model achieves more precision results. Meanwhile, Table 3 lists the elapsed time of the CrackForest model and the proposed model. The sizes of the test images are also provided in Table 3.

Comparison of the CrackForest and the proposed model on the crack images. The first row: Original images. The second row: Results of CrackForest. The third row: Results of the proposed model.
Elapsed time of CrackForest model and ours in the experiments in Figure 9 (time/s).
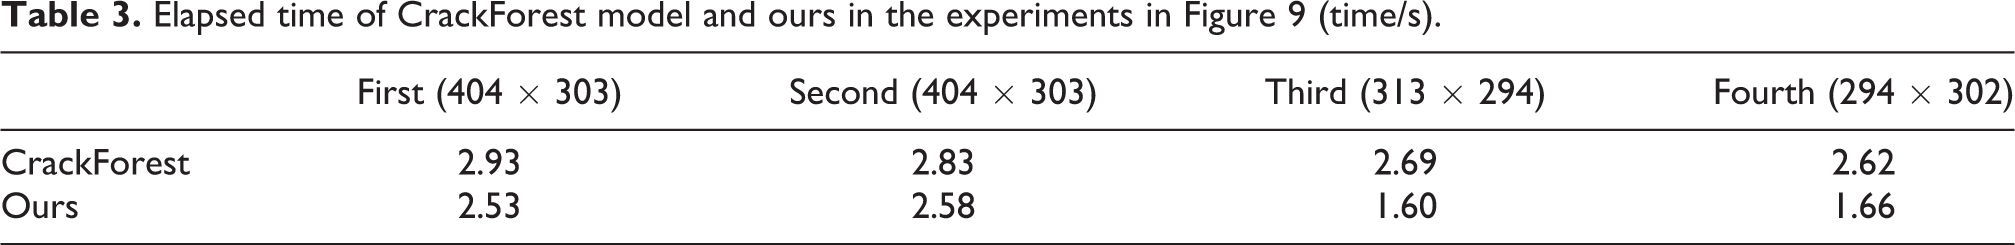
From Table 3, it is observed that the proposed model takes less time than the CrackForest model for all images. Note that the iterations of the proposed model are less than 50 for this experiment.
However, the proposed approach meets with difficulties when dealing with the challenging crack images, which is shown in Figure 10. The cracks in the images are either covered with dust or indistinguishable from the background. In this case, the proposed model fails to detect the complete and consistent objects.
The results of the proposed model on some challenging crack images: (a) input images, (b) final contour, and (c) results.
Conclusion
This article provides a hybrid framework for crack detection, which suppresses the noise by using the NLM filter firstly, and sets up the multichannel localized ACM energy function using three feature maps, that is, the intensity map, the visual saliency map, and the line-like feature map. Also, the automatic initialization of the active contour is realized according to the binary map obtained by the Hessian-based enhancement. A number of the experiments have demonstrated that the proposed approach has the potential to be an effective way for crack detection.
However, our model only considers the intensity and shape of the cracks. To obtain more reasonable results, more physical properties of the cracks such as the continuity could be taken into consideration. In the future, it would be a meaningful work to use more physical properties of the cracks to construct the energy model or provide constraints.
Footnotes
Declaration of conflicting interests
The authors declared no potential conflicts of interest with respect to the research, authorship, and/or publication of this article.
Funding
The authors disclosed receipt of the following financial support for the research, authorship, and/or publication of this article: This work was supported by the Fundamental Research Funds for the Central Universities (2016B02914), Jiangsu Provincial Key Research and Development Program (BE2016055), National Natural Science Foundation (NNSF) of China (61403122), and Science and Technology Development Funds of Jiangsu Province (2015030-03).