
Abstract
This article presents a monocular-based navigation approach for unmanned aerial vehicle safe and continuous inspection along one side of transmission lines. To this end, a navigation model based on the transmission tower and the transmission-line vanishing point was proposed, and the following three key issues were addressed. First, a deep-learning-based object detection and a fast and smooth tracking algorithm based on the kernelized correlation filter were combined to locate transmission tower timely and reliably. Second, the vanishing point of transmission lines was computed and optimized to provide unmanned aerial vehicle with a robust and precise flight direction. Third, to keep a stable safe distance from transmission lines, the transmission lines were first rectified by optimizing a homography matrix to eliminate the parallel distortion, and then their interval variation was estimated for reflecting the spatial distance variation. Finally, the real distance from transmission tower was measured by the triangulation across multiple views. The proposed navigation approach and the designed UAV platform were tested in a field environment, which achieved an encouraging result. To the best of authors’ knowledge, this article marks the first time that a safe and continuous navigation approach along one side of transmission lines is put forward and implemented.
Introduction
Transmission lines and associated infrastructures are vital to economic construction. They are often exposed to the severe weather condition and lack the regular maintenance. Over the past few decades, autonomous transmission-line inspection has been a hot issue. Many research are typically conducted based on the following two platforms: multi-rotor unmanned aerial vehicles (UAVs) and climbing robots. 1 –5 By contrast, the UAV inspection is becoming more and more popular owing to its nice maneuverability.
For UAVs, safe and continuous autonomous inspection along overhead transmission lines has been a problem. A direct but effective way is to navigate UAVs by global positioning system (GPS). For GPS-based navigation systems, reliable recognition of transmission lines and real-time and precise GPS information of transmission towers and UAV are indispensable. Lu et al. 6 addressed the line-tracking issue utilizing GPS data of transmission towers during autonomous inspection. Luque et al. 7 developed a quadrotor-based inspection system and achieved an autonomous flight along predefined GPS waypoints. However, such a system cannot work under the condition of unstable GPS and lacks the consideration of surroundings.
Despite the good performance of GPS-based navigation, the transmission-line-based navigation has also attracted a wide attention of researchers. Ceron et al. 8 navigated UAV in a virtual environment by the direction of transmission lines and the intervals between transmission lines. Chen et al. 9 made some improvements in the conventional radon transform to enable the sub-pixel extraction of transmission lines from the high-resolution satellite images. Cern et al. 10 proposed a transmission line detection method based on the geometric relationships, which takes less time than Hough transform 11 and has an advantage on long line detection. Zhou et al. 12 proposed an edge detection method to overcome the problem of threshold selection when the background changed and achieved a fully automatic power line tracking. Tian et al. 13 adopted a type of double-side filters to enhance power lines followed by recognition and tracking in Hough space by utilizing the parallel constraints. Throughout all the similar works, researchers typically focus only on the robust extraction of transmission lines and rely on the parallel hypothesis between transmission lines. Not to be affected by perspective distortion, UAVs have to fly above the transmission lines, which will threat the power supply security for the potential crash accident. In addition, navigation performance certainly will be degraded by the unreliable extraction of transmission lines.
Along the electricity transmission corridor, transmission tower is another important visual reference for the aid in the autonomous navigation. Sampedro et al. 14 employed the features of histograms of oriented gradients (HOG) 15 to train two multi-layer perceptrons (MLP) 16 separately for the classification between tower and background and between four different types of towers and sought the object position by a sliding-window approach. Ceron et al. 17 developed a descriptor for classifying regions of interest (ROIs) that are generated around key points. All ROIs, belonging to the same transmission tower, will jointly determine the final position of bounding box. Their algorithm took less than 50 ms, which was faster than the previous ones. Nevertheless, these methods above have to be faced with a complicated process of feature design, and their accuracy and robustness cannot yet meet the requirements of autonomous navigation. Since 2012, deep-learning-based methods have achieved breakthrough constantly in the field of object detection. Some typical works, such as Faster R-CNN, 18 SSD, 19 and YOLO, 20 outperform traditional methods. These deep-learning-based methods can be conveniently trained end-to-end but highly consume the computational resources of Graphics Processing Unit (GPU) and suffer from the poor real-time performance. Currently, these excellent methods have not yet been tested in a field inspection environment, and there has not been a navigation method based on transmission tower so far.
In terms of inspection safety, laser radar or stereo camera is typically used to enable UAV to percept surroundings. Hrabar et al. 21 equipped the UAV with both stereo vision system and laser scanner to detect large static objects ahead and realized automatic obstacle avoidance during inspection. Deng et al. 22 used laser scanner to follow transmission lines under the circumstance of a near distance. Zhang et al. 23 employed the stereo camera to locate the wires in the study of autonomous transmission-line landing. These methods based on measurement of distance suffer from observation distance, thus it is difficult to meet safety distance requirement of high-voltage inspection.
These vision-based navigation methods above deliberately avoid some adverse impacts caused by perspective distortion, which in return limits the development of intelligent inspection. Following the projection theory, the projection of one spatial direction is defined as the vanishing point (VP). Actually, VP has been widely applied to many fields such as robotic navigation and 24 –27 road segmentation 28 –32 . There are many methods for VP detection, which are typically categorized into the edge-based ones and the texture-based ones. Taking road segmentation as an example, edge-based algorithms rely on high-contrast edges, which are mainly from clear road boundaries and lane marks. By contrast, texture-based methods show superiority in unstructured off-road environments, but have relative high computational complexity. In unstructured road, the computational VP generated by voting typically reflects a dominant direction of road. Likewise, in transmission-line inspection, due to sag effect, the computational VP can only reflect the spatial transmission-line direction approximately. Thus, how to compute a VP that meets practical navigation requirements including precision, speed, and robustness will be an important issue. In addition, there has not been a precedent that navigating the UAV by means of the VP of transmission lines.
The main objective of this article is to develop a monocular-based autonomous navigation system to achieve a safe and continuous inspection along one side of transmission lines. To this end, we combine the deep-learning-based detection with the KCF
33
(kernelized correlation filter) tracking to achieve a real-time and reliable localization of transmission tower. To acquire a precise and reliable flight direction, we compute and optimize the VP of transmission lines by Levenberg–Marquardt (LM) and Cauchy loss. To keep the safety distance from transmission lines, we propose a two-stage method comprising distance perception and distance measurement. At the first stage, we optimize a homography matrix by a proposed objective function to restore the parallel attribute between transmission lines, which enables the measurement of their intervals. The spatial distance variation can be indirectly reflected by variation of intervals between transmission lines. At the second stage, we make a triangulation to measure the real distance from transmission tower. UAV can be adjusted to the desired safety distance before the next inspection between adjacent towers. The whole scheme was evaluated in a practical inspection environment and achieved satisfactory results. The contributions of this article are as follows: This article proposes a navigation approach based on transmission tower and transmission-line VP for inspection along one side of transmission lines. The approach depends only on a monocular pan-tile-zoom (PTZ) camera. This article proposes an approach for computing transmission-line VP, which provides the UAV with a reliable heading during autonomous flight. This article proposes a two-stage approach for maintenance of the safety distance during inspection.
The remainder of this article is organized as follows. The second section presents the experimental platform. The third section details the navigation approach and addresses three related issues. The experiments and analysis are given in the fourth section. In the fifth section, the conclusions are summarized.
Experiment platform
The flight platform adopted is a refitted DJI Matrice 100 (M100) quadrotor (SZ DJI Technology Co., Ltd.), as shown in Figure 1. The flight control system comprises global positioning system (GPS), inertial measurement unit (IMU), barometer, and downward-looking stereo camera (DJI Guidance). To achieve visual navigation along transmission lines, a PTZ camera (DJI Zenmuse X3) is mounted below the M100. In addition, an onboard computational platform is built, which consists of two advanced embedded processors DJI Manifold, NVIDIA TX2, and a router used to connect these two processors. TX2 is mainly responsible for algorithms related to visual navigation. Manifold communicates with flight controller and PTZ camera, serving as a bridge to connect M100 and TX2. Finally, a robot operating system (ROS) network is built to facilitate information exchange and to share computational resource.

Refitted DJI Matrice 100 (M100) inspection UAV. UAV: unmanned aerial vehicle.
Proposed navigation approach
To have a better understanding of proposed navigation approach, we first introduce a navigation model. Then, we discuss three related issues, such as transmission tower localization, computation of transmission-line VP, and maintenance of safety distance. Finally, we details the whole navigation process.
Navigation model
The navigation model, as shown in Figure 2, describes some important projection relations between the first perspective and the third perspective during navigation along one side of transmission lines. The first perspective is the PTZ camera perspective, corresponding to the upper left image plane. The third perspective is the god perspective, corresponding to the whole image. To keep a simultaneous observation of transmission tower and lines, the PTZ camera needs to point to transmission tower all the time. At this time, transmission tower is located in the center of image plane, and most of transmission lines are concentrated in the upper right region that is above the horizon line. To plan a spatial flight direction, we first define three coordinate frames: inertia reference frame

Navigation model.

With respect to the camera frame


where

where E is a
Ideally, when transmission lines are parallel to the ground, by adjusting φ around axis
The model above is constructed in 3-D space, in which UAV adjusts flight direction according to the computational φ. An alternative solution is to adjust UAV by horizontal pixel difference between projection

where the notation ≃ denotes the homogeneous equivalence and
Transmission tower localization strategy
As mentioned above, the transmission tower detection is crucial for the judgement of VP validity and flight direction safety. In addition, transmission towers are used to achieve continuity of inspection along power corridor, which will be detailed in section “Navigation process.” Therefore, it is necessary to seek a method of locating transmission tower, which meets the requirements of real-time and robust performance of navigation. Nowadays, in the field of object detection, deep-learning-based methods have the best precision and robustness. We trained and tested several state-of-the-art detection frameworks and finally adopted Faster R-CNN for transmission tower detection due to its lowest false detection rate, which will be further discussed in the section of “Transmission tower detection experiment.” Considering the limited computational capability of onboard embedded processor, we discarded the deep VGGNet 34 and ResNet, 35 but selected a shallow ZFNet 36 as the core of network.
To improve real-time performance of Faster R-CNN, we combine it with real-time tracking algorithm KCF. KCF generates training samples by circularly shifting the matrix of images and avoids time-consuming matrix inverse operation via frequency domain calculation. These properties make KCF have a high tracking accuracy and low computational cost.
In transmission tower localization strategy, detection is used to initialize tracking and to judge the validity of tracking. Considering the runtime difference between two algorithms, we design a queue to store tracking results temporarily, as shown in Figure 3. Then, we wait for the late detection result to judge the effectiveness of tracking. Specifically, when a new image arrives, it is assigned a unique time stamp followed by a simultaneous execution of tracking and detection. Upon completion of the tracking, its tracking result and corresponding time stamp are together pushed into the queue. After the queue is updated, a new round of image acquisition and tracking begins. When the detection completes, its corresponding tracking result can be found in the queue according to the unique time stamp. Finally, if the central distance between two bounding boxes is beyond a predefined threshold, we think the tracking has failed and reinitialize it with the latest detection result.

Fusion strategy of detection and tracking. The dash-line box denotes a queue with a capacity of thirty frames.
Transmission-line VP detection
As mentioned in section “Navigation model,” the VP of transmission lines can provide UAV navigation with the information of direction. Benefiting from the proposed navigation approach, a large number of transmission lines are located in the region where the sky is background, which greatly reduces the risk of false detection. The proposed transmission-line VP detection algorithm consists of three parts: extraction of transmission lines, VP initialization, and VP optimization.
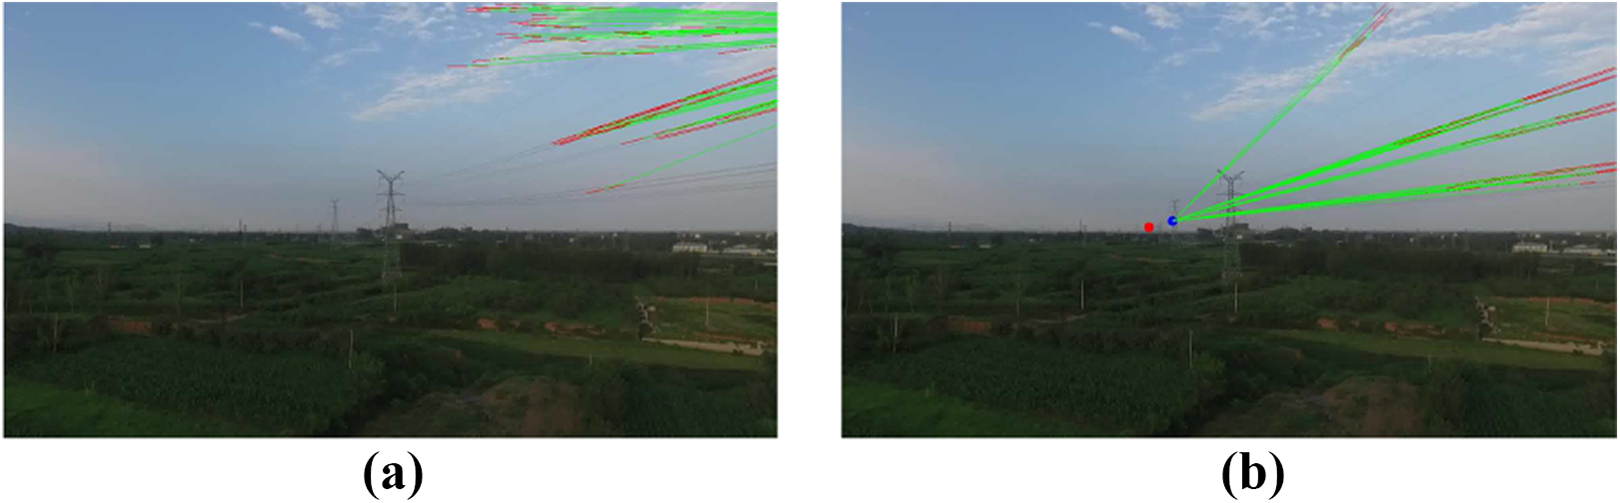
At the stage of line extraction, we perform first the Line Segment Detector (LSD) 37 to extract line segment regions and their binary contours, which helps to enhance edges of transmission lines while reducing the noise interference. Then, Progressive Probabilistic Hough Transformation (PPHT) 38 algorithm is applied to detect straight line segments in the binary edge image. Figure 4 shows the practical processing effects.

White lines in (a) are the result of LSD. Red lines in (b) are the PPHT result and the red point in (b) represents the computational VP by linear least-squares. LSD: line segment detector; PPHT: Progressive Probabilistic Hough Transformation; VP: vanishing point.
At the stage of VP initialization, we adopt linear least-squares to compute the initial VP

where
At the stage of VP fine-tuning, we adopt the optimization approach based on the geometric orientation consistency. As shown in Figure 5, Illustration of LM schematic diagram. LM: Levenberg–Marquardt.

where


Cauchy improves the robustness of optimization by limiting the abnormal amplitude of gradient. The optimization with Cauchy loss makes VP gradually move to the position that meets the overall orientation consistency, which improves the accuracy of estimate for transmission-line direction. In addition, RANSAC may fail when outliers are dominant. To solve the problem, we use the VP of previous frame to filter wrong line segments in current frame in practice and achieve quite stable detection results.
Distance perception from UAV to transmission lines
Image rectification by homography optimization
To eliminate the parallel distortion of transmission lines in image, as illustrated in Figure 6(a), we rotate the current camera viewpoint

Illustration of homography optimization (a) and point set registration scheme (b).

where
where

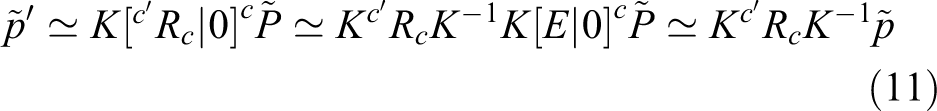
Equation (11) is abbreviated to
Based on the detected transmission line segments, we propose an objective function to optimize the H for the best recovery of parallel property.


In (13),
Distance perception algorithm
Affected by detection noise, the rectified straight line segments cannot reflect accurately the number and the positions of transmission lines. Thus, to solve the problem, we first group these line segments followed by measuring the intervals between groups instead of measuring the intervals between line segments directly, which achieves more reliable estimates. To make these line segments be grouped automatically, an adaptive K-means-based grouping algorithm is proposed, whose details are described in Algorithm 1. Benefiting from the previous homography rectification, the positions of line segments can be simplified into 1-D coordinates along y-axis of image. As illustrated in Figure 6(b), after grouping line segments, we extract the central positions of these line bundles and convert the problem of estimating spatial distance variation into a 1-D point-set-registration. Further, we define two notations s and t to separately represent the scale and translation of the similarity transformation. The s and t can be computed by minimizing the point set registration error, as shown in the following equation.
Adaptive line segment clustering algorithm.


where
Distance measurement from UAV to transmission tower
UAV not only should be able to perceive the distance variation relative to transmission lines but also measure the real distance. According to the section “Transmission tower localization strategy,” when UAV is close to a transmission tower, the PTZ will rotate fast so as to track the tower. Benefiting from the fact that the camera pose varies significantly in a short term, the triangulation based on multiple views can be adopted to measure the real distance from UAV to the transmission tower at the end of inspection. As illustrated in Figure 7, the whole process begins at position D with

Triangulation model. D and F are the beginning and ending positions of the triangulation. θ denotes the angle between the optical axis and the VP direction. VP: vanishing point.
Navigation process
A long distance inspection task can be decomposed into several short subtasks between adjacent transmission towers. As shown in Figure 8, the subtask consists of initialization stage and inspection stage. At the stage of initialization, the UAV first detects transmission tower and initializes tracking by the detected bounding box. Next, the PTZ constantly adjusts pitch and yaw angle until the tracking bounding box is located in the center of image. Then, the UAV computes the VP of transmission lines and judges its validity according to the principle introduced in “Navigation model” section. If the VP is effective, the UAV will adjust heading to align its heading projection with VP. Otherwise, the UAV heading will be aligned with the empirical direction. At the stage of inspection, the UAV flies along the established direction while performing distance perception algorithm to ensure safety distance. At the end of inspection, it performs the triangulation algorithm.

Flowchart of the proposed approach. Initialization stage and inspection stage are distinguished by green and purple dotted bounding boxes. The pictures on the left show the real processing results corresponding to the annotations on the right. The red bounding box represents the result of detection. The blue bounding box denotes the result of tracking. At the stage of heading adjustment, the red circle denotes the computational VP, the yellow circle denotes the projection of the expected flight direction, the green lines are the optimized lines passing through VP. θ represents the yaw angle between the expected flight direction and the PTZ camera optical axis. VP: vanishing point; PTZ: pan-tile-zoom.
Experiment and analysis
Transmission tower detection experiment
Experiment setup
For this experiment, 1300 sheets of transmission tower pictures with different resolutions and backgrounds were collected from aerial videos and annotated manually. The comparison were made among three state-of-the-art deep-learning-based detection frameworks: Faster R-CNN, SSD, and YOLOv2. We adopted 10-fold cross-validation 40 to find the best models. Following this scheme, the data set is randomly partitioned into 10 subsets with equal size, then the training and validation are conducted for 10 times. Each time, a different subset is taken out for validation while the remaining union of ninefolds are used for training. We used the Caffe framework 41 to implement the training process on a GTX TitanX GPU and the validation process on TX2.
Quantitative evaluation methodology
For quantitative evaluation of the detection task, we followed the evaluation standard of the PASCAL Visual Object Classes challenge.
42
A detection result is considered correct when the bounding box overlap ratio r between the ground truth

where Illustration of the correct and wrong detections. In the three images, the green bounding box represent the ground truth. (a) TP (the blue bounding box), (b) FP (the red bounding box), (c) FN (no detection bounding box).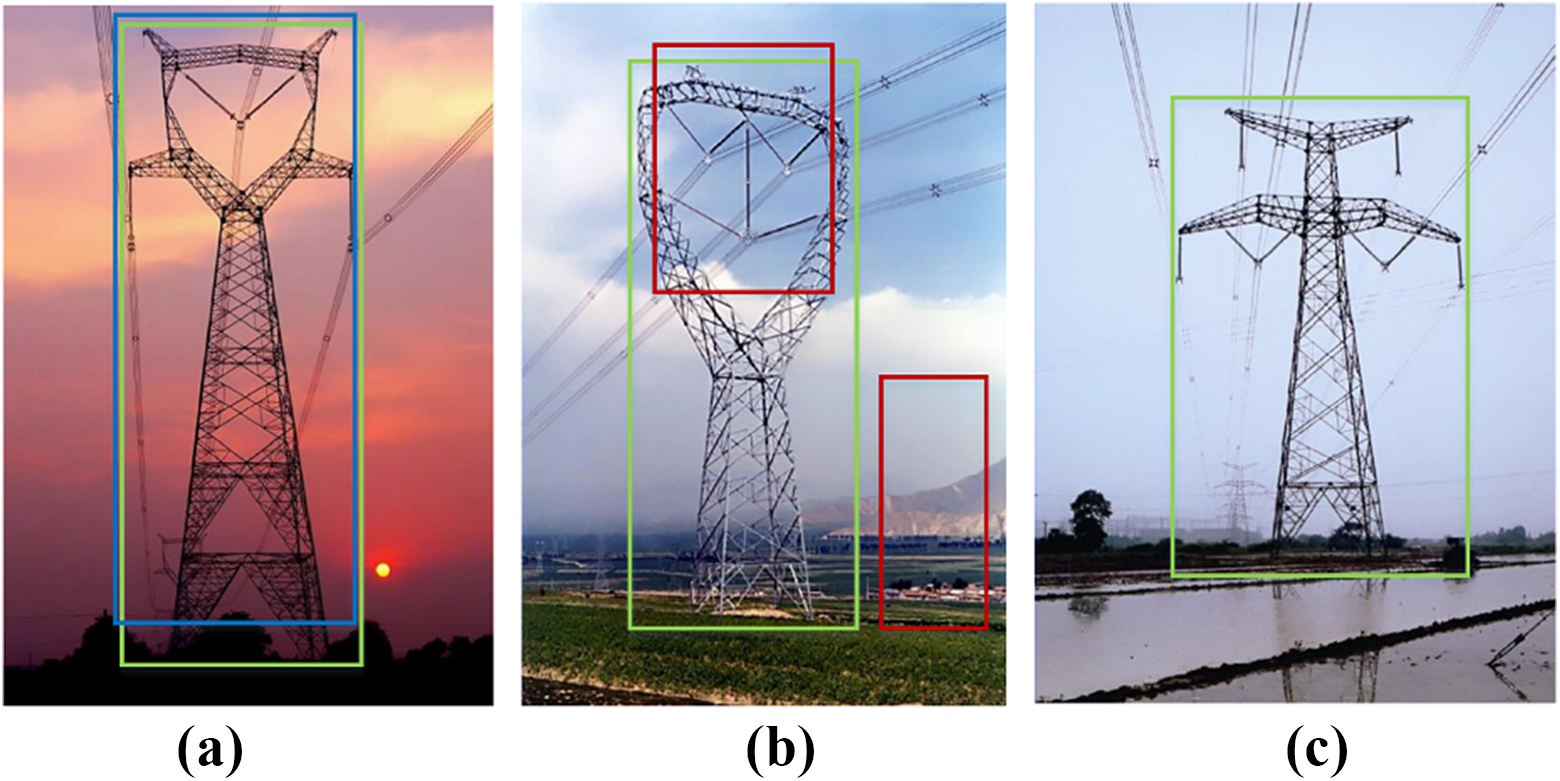

The average precision (AP) is also adopted to evaluate the comprehensive performance of detection, whose value is approximately equal to the area under the precision–recall curve.
Experimental results
The comparison was made from the following three aspects: runtime, AP, and the false detection rate (precision–recall curve). As shown in Table 1, SSD300 has the fastest runtime and a relatively high AP, but its low input resolution (300 × 300) may cause frequent FPs and FNs. YOLOv2 has a satisfactory speed of 5.6 frames per second (FPS), but its AP is relatively low. As illustrated in Figure 10, Faster R-CNN (VGG16) and (ZF), denoted by the black and red solid lines, respectively, maintain a 100% precision over a fairly wide range of recall, which clearly outperform SSD and YOLOv2. At this point, both SSD and YOLOv2 encounter different degrees of false detection, even at a low level of recall. Since the false detection (FP) can bring a significant threat to the navigation safety, we finally choose Faster R-CNN (ZF) that achieves a lower false detection rate in the tower data set and is faster than VGG16 to enable the reliable and fast localization of transmission tower for inspection task.
Speed and average precision.a

AP: average precision.
aFor Faster R-CNN, ZF and VGG16 represent two different networks of feature extraction. SSD300 and SSD512 separately correspond to 300 × 300 and 512 × 512 input resolutions. YOLOv2 corresponds to the 544 × 544 input resolution. The different 10 APs correspond to the results of 10-fold cross-validation, in which the bold font indicates the best of each framework. FPS, namely frames per second, is measured on NVIDIA TX2.

Precision-recall curve of tower detection. TP: true positive; FP: false positive; FN: false negative.
Figure 11, extracted from a recorded inspection video, shows the fusion process of Faster R-CNN (ZF) and KCF. As shown in Figure 11(a), when the FN happened, the tracking result that corresponded to the blue bounding box was not affected, which achieved a continuous and smooth localization of transmission tower. With the yaw angle of PTZ changing, as shown in Figure 11(b) to (f), the sun moved gradually to the left side of the tower, affected by which the blue tracking bounding box also slowly drifted away from the target. When the pixel disparity between the two bounding box centers was beyond the prespecified threshold, UAV began to slow down, and finally re-initialized the tracker after the stable hover, whose process is illustrated in Figure 11(g) and (h). By virtue of complementary advantages of detection and tracking, locating the transmission tower becomes robust and fast.

Fusion of deep-learning-based detection and smooth tracking. The red bounding box denotes the result of Faster R-CNN (ZF). The blue bounding box represents the KCF result. The red character string beginning with character # and displayed in upper right region indicates the frame number. The cyan straight line segment shown in the upper left region denotes the horizontal pixel error between the centers of detection result and tracking result. KCF: kernelized correlation filter.
VP detection experiment
Experiment objectives
In this experiment, we will verify the feasibility of navigating UAV by VP of transmission lines followed by demonstrating that Cauchy loss and motion-continuity constraint play an important role in improving the precision and robustness of VP detection.
Experimental effect analysis
To verify the feasibility of navigation approach based on VP of transmission lines, we conducted four flight experiments between adjacent transmission towers, which considered the influence of light, clouds, and variation of both view angle and distance on the detection of VP. We separately extract eight detection results of different view angles from each experiment and list them in one subplot in the Figure 12. It can be seen that in the image plane, the transmission lines close to the camera appear approximately straight in spite of their sag problem. During the process of navigation between adjacent towers, the PTZ camera continuously rotates right, accordingly, the estimated VP gradually moves left. The estimated VPs can well reflect the direction of transmission lines.

VP detection results. The red line segment denotes the detected transmission lines. The red circle denotes the initial VP computed by the linear least-squares. The blue circle represents the optimized VP by LM and Cauchy loss. The green line segment, connecting the optimized VP and the midpoint of red line segment, denotes the optimized straight line
Further, we select three typical detection results to make an effect display about the optimization, which are as shown in Figure 13. It can be seen that line segment detection results usually contain a small number of false edges that do not match the VP consistency, which may be caused by the propeller, the sun, and the clouds. However, due to the addition of Cauchy loss function, the optimization is not affected by these false edges and gives the estimate approximate to the truth value.
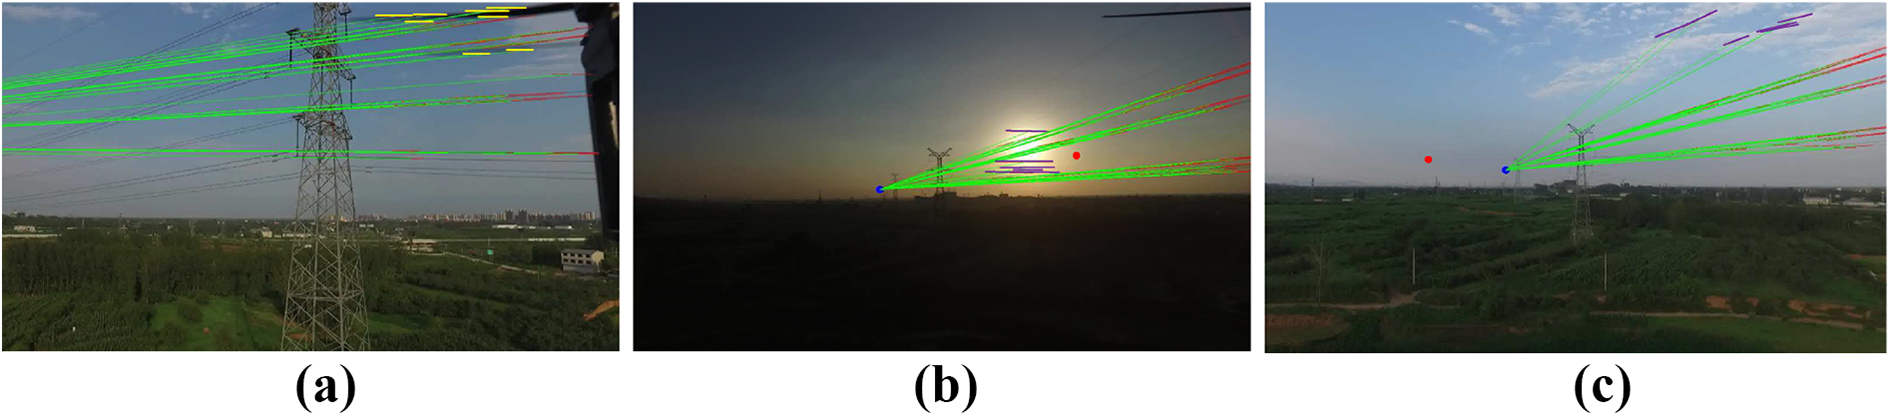
Effect display of VP optimization. The yellow and purple line segments represent a small number of false edges that do not match the VP consistency. The other color marks are the same as the ones in Figure 12. VP: vanishing point.
When line segment detection results contain a large number of false edges, the initialization based on RANSAC will fail. Since the PTZ rotates slowly, the VP position will not change a lot across adjacent frames. Thus, we first leverage this prior knowledge to filter the detected straight line segments to ensure a right initialization. At this point, we make a comparison between detection results with and without motion-continuity constraint, as shown in Figure 14. In the Figure 14(a), a large number of cloud edges make the initial position of VP appear a serious offset, which results in the optimization eventually failing, while applying motion continuity constraint can help remove these edges, thus ensuring the correctness of the optimization. The correct optimization corresponds to the Figure 14(b).
Comparison between VP detections with and without the motion continuity constraint. (a) VP detection without the motion continuity constraint. (b) VP detection with the motion continuity constraint. The color marks are the same as the ones in Figure 12. VP: vanishing point.
Quantitative evaluation
For the quantitative evaluation, we extracted 60 images with 1920 ×1080 resolution at equal intervals from each video and annotated them. The ground truth is the mean of five manual annotations. We performed statistics on pixel error between the ground truth and the estimate and then used accumulative-pixel-error to assess the detection accuracy.
Figure 15(a) shows the four accumulative-pixel-error curves between the optimized VP and the ground truth, which correspond to the four experiments shown in Figure 12, respectively. In experiment (a), since the background is relatively clean, the algorithm achieves the best detection performance, whose final cumulative error is less than 200 pixels. In experiment (b), the first three-quarters of the curve is in a fast upward trend, which is in agreement with the time of illumination interference caused by the sunrise. Thereafter, as the camera rotates to the right, the sun finally disappears from the field of view, accordingly the curve slope also tends to be mild. The entire process of experiment (d) is affected by clouds, leading to a 300 pixel error in total. Because of the harsh environment in experiment (c), VP detection has the largest uncertainty with a cumulative error close to 600 pixels and about 10 pixel error each image in average. In terms of the 1920 × 1080 resolution, the 10-pixel swing around the ground truth is acceptable in practical inspection. Figure 15(b) displays the accumulative-pixel-error curves of initial VP, which retains the same color configuration as the ones in Figure 15(a). By contrast, the errors between the initial VP and the ground truth increase significantly.

(a) Accumulative pixel error between the optimized VP and the ground truth. (b) Accumulative pixel error between the initial VP from linear least-squares and the ground truth. VP: vanishing point.
Distance perception and measurement experiments
Experiment for safety distance from transmission lines
This experiment shows the performance of distance perception algorithm, in which the UAV is deliberately operated to fly along transmission lines and slowly close to them. The results of homography optimization, line clustering and scale estimation were recorded throughout the flight. As shown in Figure 16(a), four representative frames were extracted in order from the video. The different colors assigned to the detected transmission lines represent the different clusters that are generated by the adaptive line segment clustering algorithm. As the UAV slowly approaches the transmission lines, by virtue of applying homography optimization and line clustering to the raw images, it can be intuitively observed that the intervals of parallel bundles in rectified images are gradually increasing and their variation has been well reflected by the gradually increasing scale factor. To further demonstrate the accuracy of the solved scale s and translation t, we used the s and t to recover original positions of current bundles with respect to the reference frame (the first frame). The result is shown in Figure 16(b), where the estimations during the whole flight, denoted by plus signs, are in good agreement with their corresponding original positions.
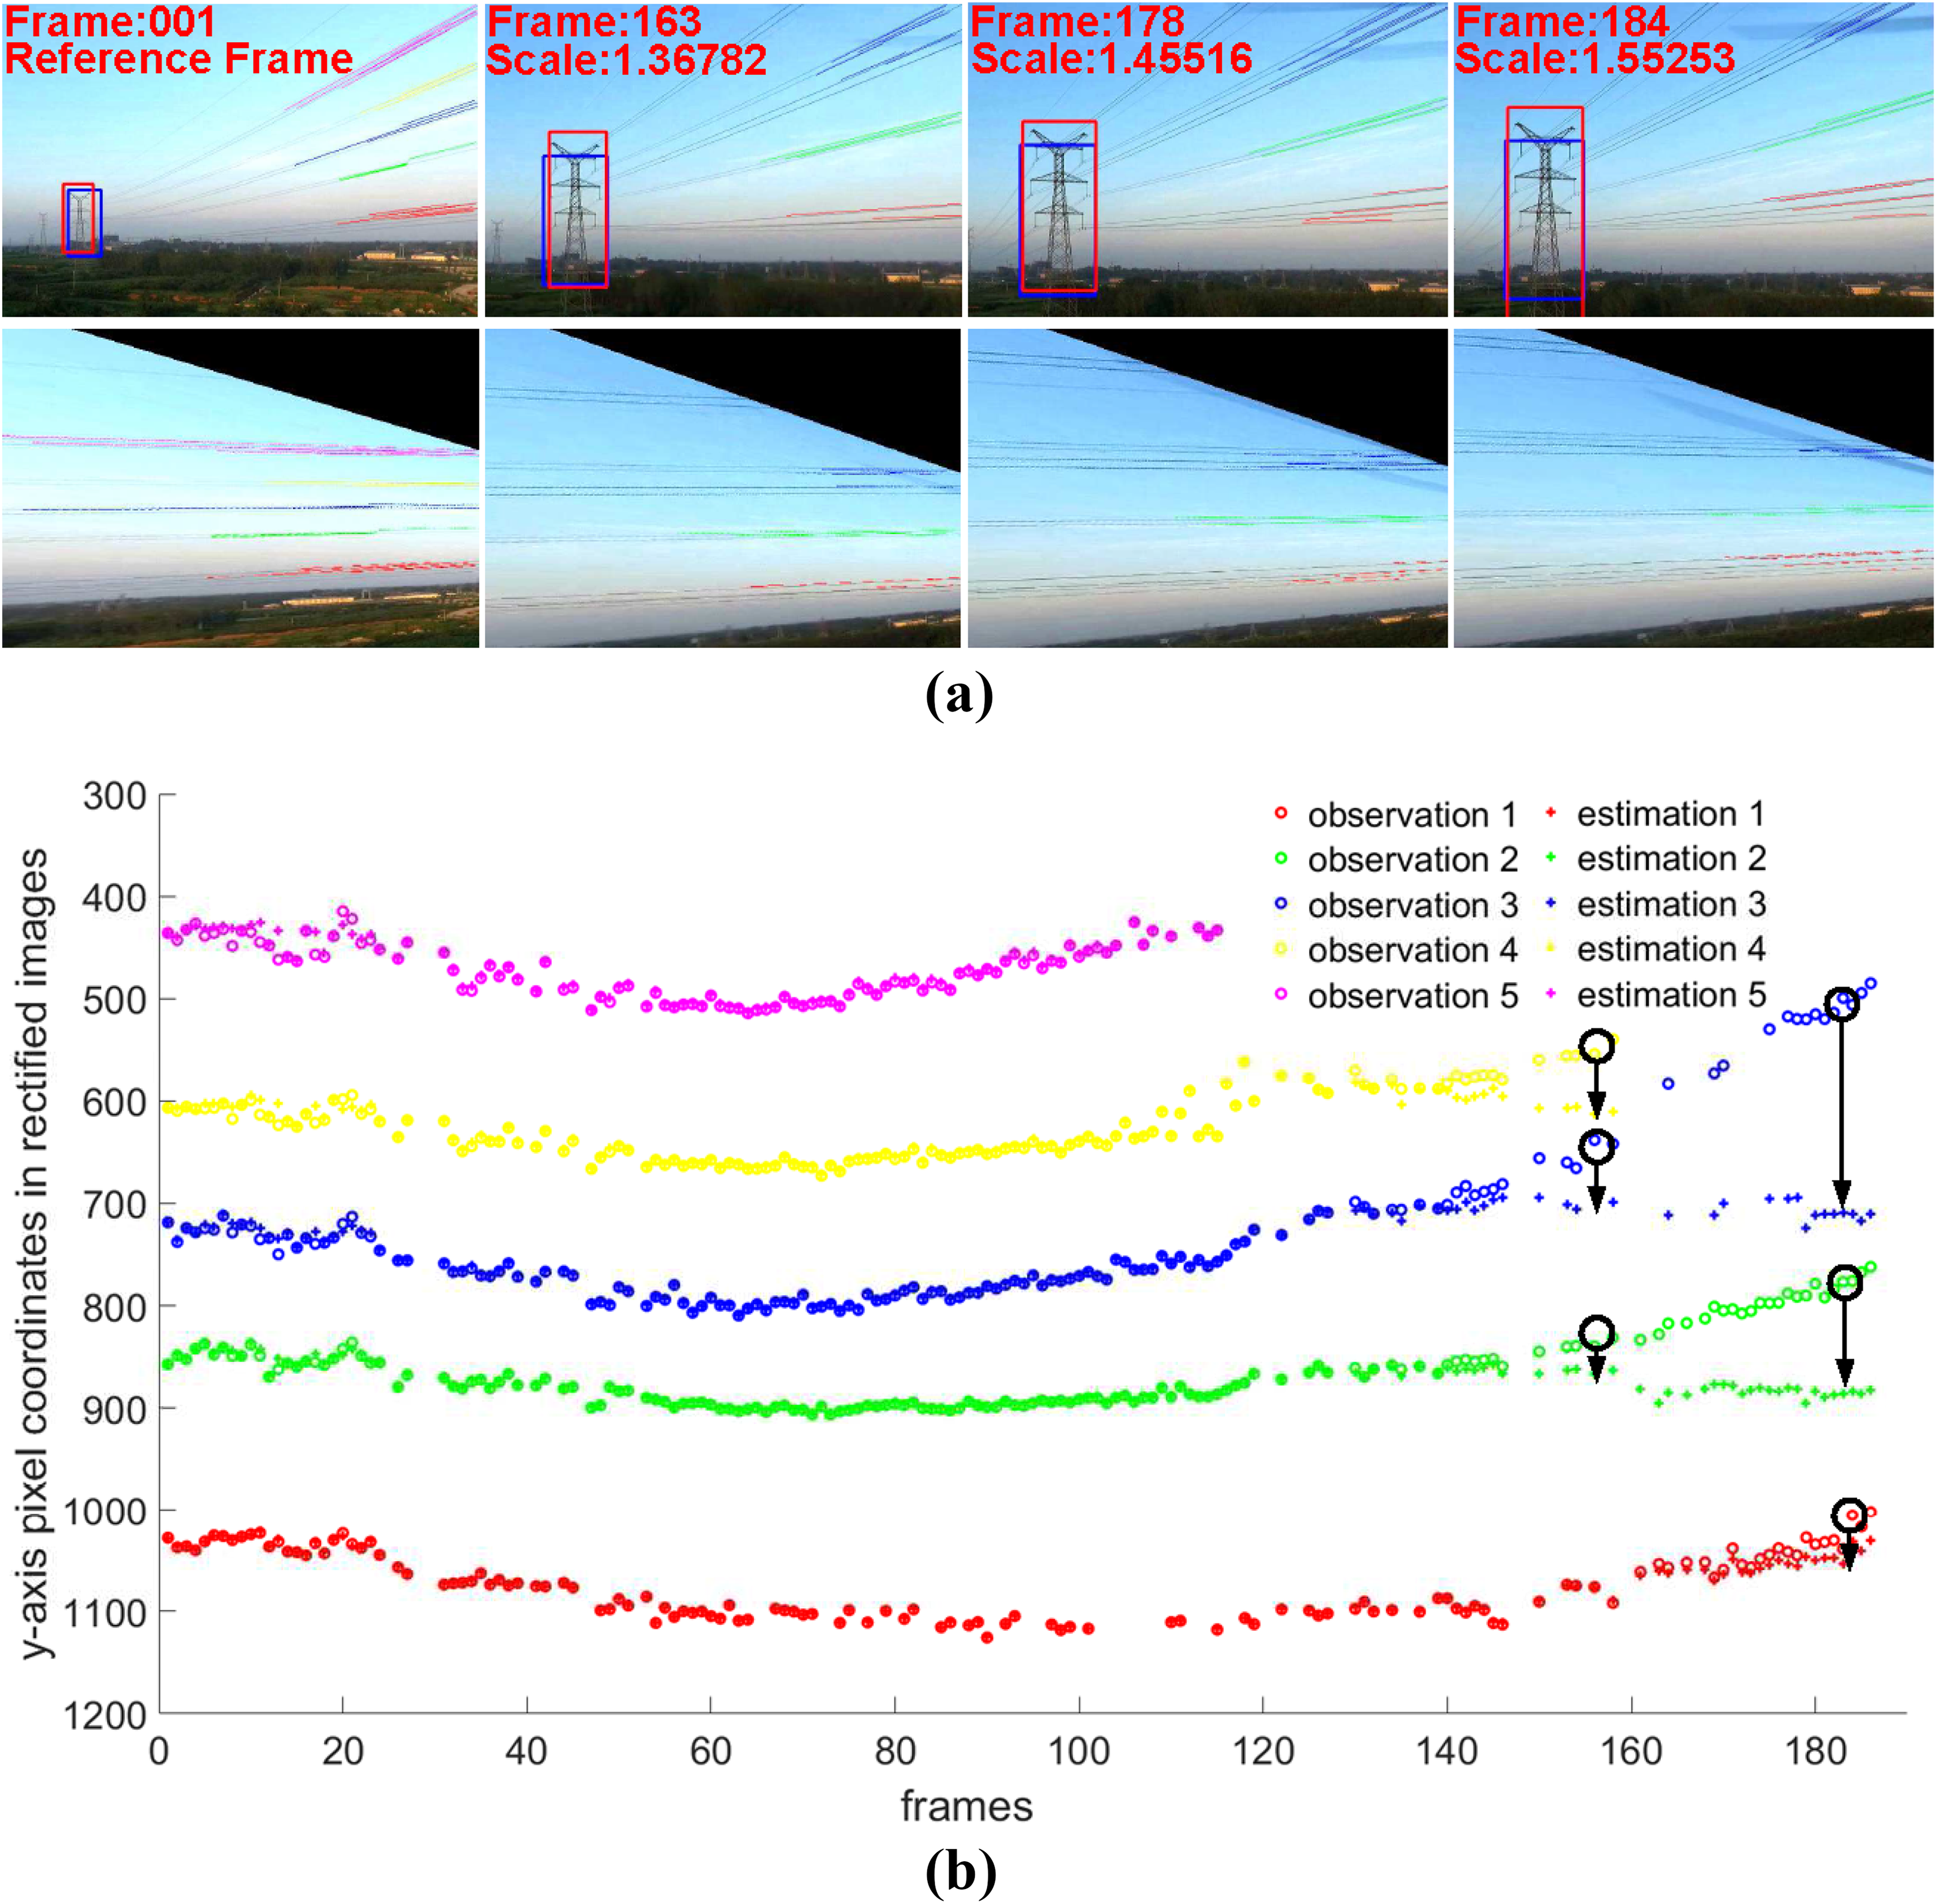
Performance of distance perception from transmission lines. The first row of (a) shows the snapshots of PTZ camera and the second row displays the corresponding rectification results. The red character string displayed in left upper region indicates the frame number and scale estimation. The circles in (b) represent the observed bundle center positions. By applying scales and translations to current observations, the plus signs in (b) mean the estimated bundle center positions with respect to the reference frame. The black circles and arrows indicate this estimation process. PTZ: pan-tile-zoom.
After the individual performance analysis of each algorithm component, a comprehensive experiment was designed to demonstrate the effectiveness of the entire navigation approach in maintaining the safety distance from transmission lines. In this experiment, a segmented controller with dead-band, taking scale s as input, was used to control the safety distance. The test distance covered two adjacent intervals, approximate 450 m. The transmission towers have the typical 220-kV double-circuit lattice steel structure, which has a height of 40 m and a base-width of 6 m. The tower can be approximately enveloped by a 8 × 8 × 40 m3 (length, width, and height) cuboid. The GPS data of transmission tower were provided by power companies and they were based on WGS84 World Geodetic Coordinate System 1984 (WGS84). The locations of transmission lines were determined by the adjacent towers they connect. To ensure the UAV safety, we limited the wind force within three and set the flight speed to 1 m/s. As shown in Figure 17, nine experimental trajectories with different takeoff positions (a range of 5 to 15 m for the safety distance and a range of 22 to 31 m for the flight altitude) were plotted. They were recorded based on the fusion result of visual localization system (DJI Guidance) and GPS system of the UAV. The centers of the two pentagrams denote the tower centers relative to North East Down (NED) coordinate system. Figure 17(a) is a planar view of trajectories. It can be seen that all trajectories achieved a relatively stable safe distance as expected. The UAV could adjust themselves when the safety distance from the transmission lines were getting closer or farther. Furthermore, Figure 17(b) displays the altitude component of the corresponding flight trajectory. It can be seen that the proposed navigation approach can adapt to a certain degree of variation of height, which endows the transmission-line inspection with much flexibility.
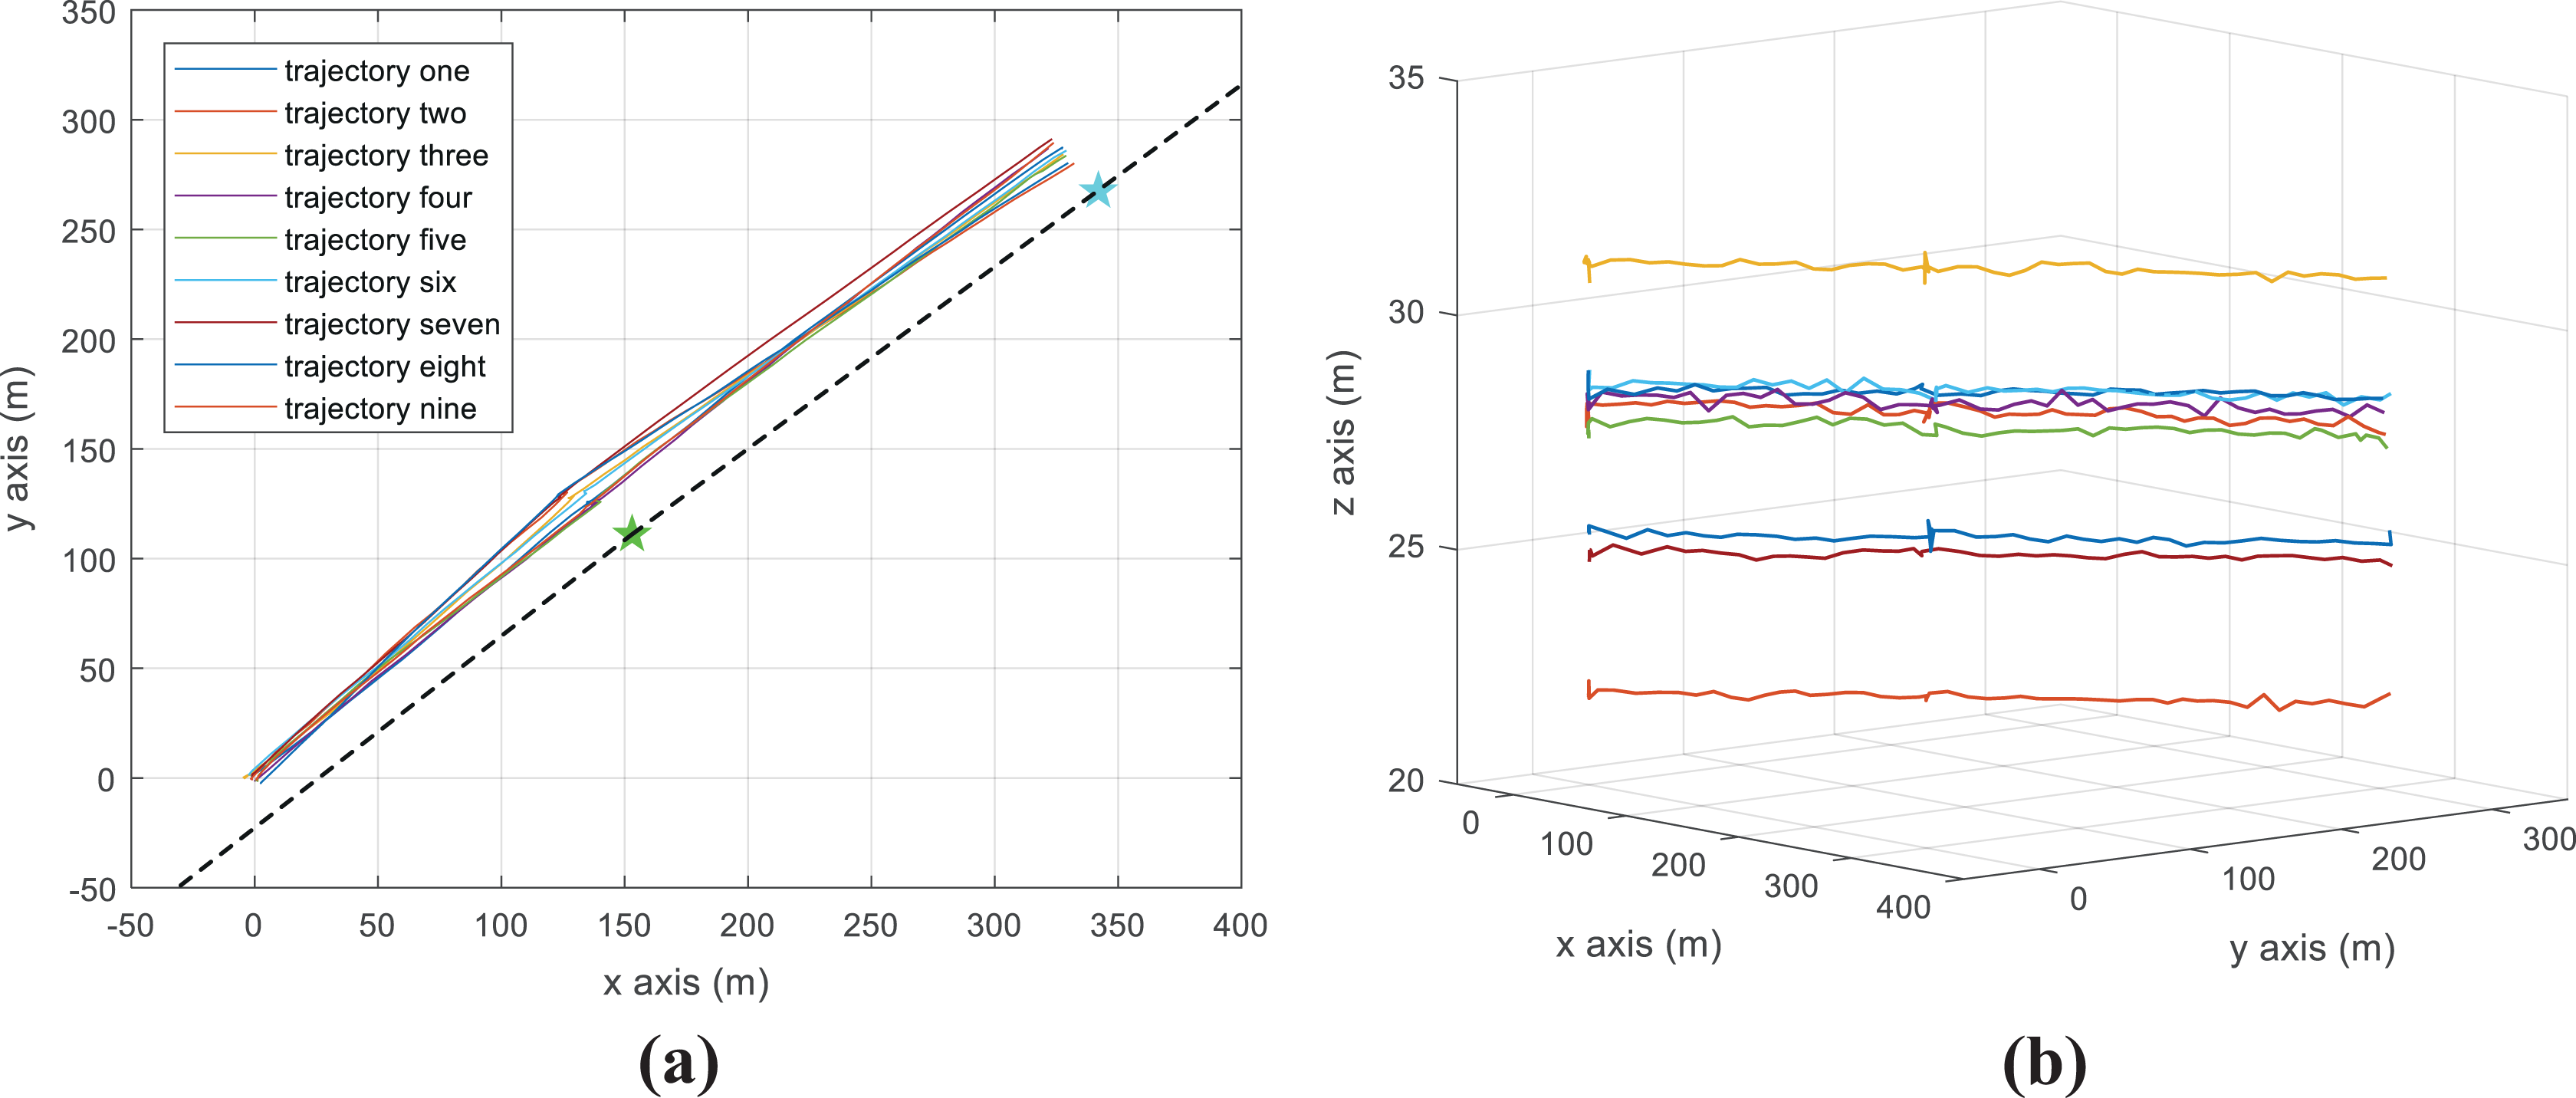
Trajectories for verifying the safety distance perception. (a) Planar view of multiple trajectories. (b) Altitude view of multiple trajectories.
Experiment for safety distance from transmission tower
To verify the effectiveness of distance measurement, we hope that the UAV can adjust itself to an expected safety distance by applying the triangulation algorithm at the end of inspection between adjacent towers. The experiment environment is the same as the one mentioned in section “Experiment for safety distance from transmission lines.” As shown in Figure 18, to have a clear view, we selected two typical trajectories to demonstrate the effectiveness of triangulation. The two different tests started with different initial positions, whose corresponding trajectories were separately denoted by the red and blue color. At the position G, UAV began to collect the data, which comprised the current position of the UAV and the corresponding yaw angle of the PTZ camera. At the position H, UAV hovered on the side of the transmission tower followed by estimating the distance from the transmission tower leveraging the collected data. Since the blue trajectory was farther than the expected safety distance (12 m), UAV made an adjustment before the next flight as expected. The red trajectory corresponded to the opposite circumstance. It can be seen that the triangulation is effect to improve the quality and safety of the autonomous flight.
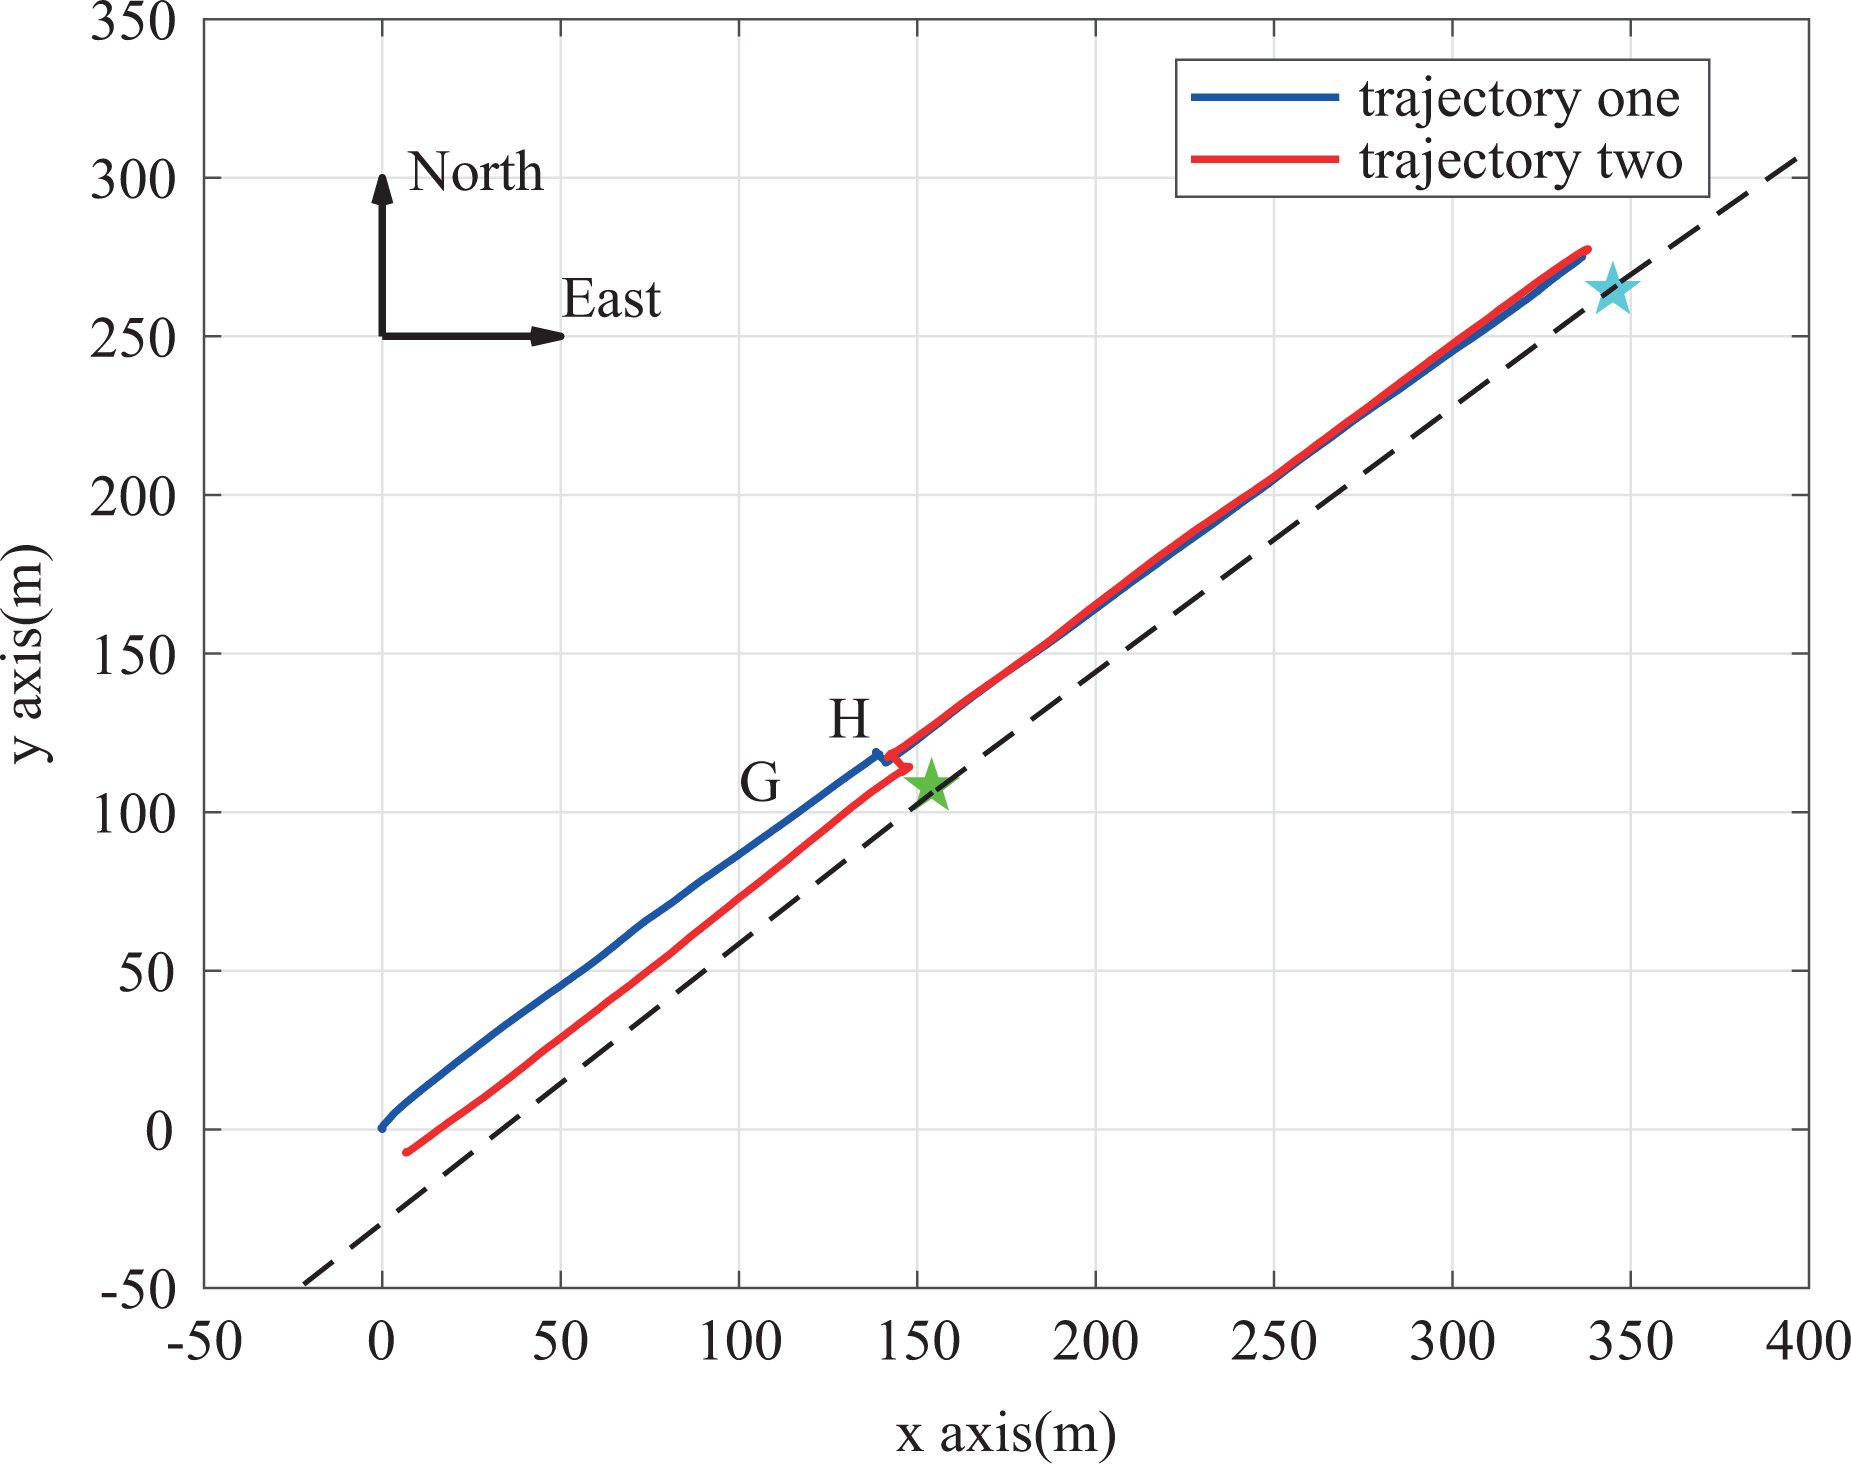
Planar view of flight trajectories for verifying the triangulation algorithm.
Conclusion
In this article, we proposed an autonomous navigation approach based on transmission lines and transmission towers to enable the UAV continuous navigation along one side of transmission lines. To achieve the navigation approach, three following issues were addressed. First, to locate the UAV, the transmission tower was viewed as the landmark, which was positioned robustly and timely by combining Faster R-CNN detector with KCF tracker. Second, to obtain a robust and precise flight direction, VP of transmission lines was calculated followed by an optimization. The motion-continuity constraint and Cauchy loss function were added to improve the robustness of initialization and optimization to adapt to the harsh inspection environments. Third, to ensure the safety of inspection, the perception and measurement of safety distance from UAV to transmission lines were proposed. The perception algorithm was designed to sense the variation of spatial distance according to the variation of intervals between transmission lines, which was used at the early stage of navigation between adjacent towers. The measurement algorithm was designed to estimate the real spatial distance from transmission lines by the proposed triangulation across multiple views, which was used at the later stage of navigation between adjacent towers. To verify these methods, a UAV flight platform carrying advanced embedded processors was developed. Finally, the designed flight platform and the whole navigation approach were tested in a real-world field environment, which achieved an encouraging result.
In the future, we will integrate an online fault detection into the navigation system and improve the cruise duration for a long distance inspection.
Footnotes
Declaration of conflicting interests
The author(s) declared no potential conflicts of interest with respect to the research, authorship, and/or publication of this article.
Funding
The author(s) disclosed receipt of the following financial support for the research, authorship, and/or publication of this article: This work was Supported by the National Natural Science Foundation of China (61673378,61421004).