
Abstract
Employing unmanned aerial vehicles to conduct close proximity inspection of transmission tower is becoming increasingly common. This article aims to solve the two key problems of close proximity navigation—localizing tower and simultaneously estimating the unmanned aerial vehicle positions. To this end, we propose a novel monocular vision–based environmental perception approach and implement it in a hierarchical embedded unmanned aerial vehicle system. The proposed framework comprises tower localization and an improved point–line-based simultaneous localization and mapping framework consisting of feature matching, frame tracking, local mapping, loop closure, and nonlinear optimization. To enhance frame association, the prominent line feature of tower is heuristically extracted and matched followed by the intersections of lines are processed as the point feature. Then, the bundle adjustment optimization leverages the intersections of lines and the point-to-line distance to improve the accuracy of unmanned aerial vehicle localization. For tower localization, a transmission tower data set is created and a concise deep learning-based neural network is designed to perform real-time and accurate tower detection. Then, it is in combination with a keyframe-based semi-dense mapping to locate the tower with a clear line-shaped structure in 3-D space. Additionally, two reasonable paths are planned for the refined inspection. In experiments, the whole unmanned aerial vehicle system developed on Robot Operating System framework is evaluated along the paths both in a synthetic scene and in a real-world inspection environment. The final results show that the accuracy of unmanned aerial vehicle localization is improved, and the tower reconstruction is fast and clear. Based on our approach, the safe and autonomous unmanned aerial vehicle close proximity inspection of transmission tower can be realized.
Keywords
Introduction
The power transmission tower (PTT) provides a crucial foundation for economic development. The electrical devices for power delivery are mainly concentrated on the PTT. Both the equipments and PTT are exposed to the complex and diverse natural environment and lack the regular maintenance, which may encounter multiple types of damages and makes power delivery a hidden danger. Autonomous transmission tower inspection has always been a hot issue in the field of robotics. In the last decades, related researches are mainly conducted based on the following two popular platforms 1,2 : unmanned aerial vehicles (UAVs) 3 –5 and rolling on wires robots (RWR). 6 –8
In RWR inspection, the inspection is conducted by a robot climbing along transmission lines suspended by a pole tower. The main advantage is the inspection accuracy, because the equipped sensors are close to the PTT and its related components. However, passing across various obstacles on the lines has always been a major weakness for RWR. 1,2 LineScout, 9 a successful wire-climbing robot in recent years, was specifically designed with a LineArm to grasp on both sides of the obstacle and flipped its wheel frame to overcome obstacles. But it loses efficiency when encountering complicated conductor connection on pylon.
In UAV inspection, the inspection platforms mainly contain fixed-wing UAVs 10 and vertical takeoff and landing (VTOL) UAVs which comprise large helicopter 11 and multi-rotor aircraft. However, the first two are either too fast or too far to acquire detail information 12 of the PTT and always with a high inspection cost. 1,2 They are more suitable for a relatively long distance monitoring of power transmission lines (PTLs) along PTLs corridor. Only the multi-rotor UAVs are maneuverable enough to fly and hover quite close to the PTT and keep a high inspection accuracy. 13 Besides, it always has a low operation cost and is capable of accessing different locations for multi-type refined PTT inspection tasks.
Nowadays, based on the requirements of UAV refined PTT inspection, the faults that need to be inspected mainly include the tower deformation and inclination, 14,15 the insulator string broken and contamination, 16,17 and all other kinds of small component faults like damage or missing of shock hammers and wire clips. It requires the UAV to fly in close proximity to the tower and realize fixed-location hovering while maintaining a safe stand-off distance from the pole to take high-quality pictures. So, the UAV should be able to fly safely to avoid the pole and be capable of accurate self-positioning relative to the tower.
At present, the navigation for close proximity tower monitoring can be conducted in three ways consisting of manual operation, GPS-fixed-location navigation, and assisted-control semi-autonomous navigation. The professional manual operation requires that a highly skilled pilot controls the UAV to approach the tower and a co-pilot operates the equipped camera to take pictures. Pilots are required to be highly focused to control the UAV. It loses efficiency because of high operator workload and it has a risk of collision due to improper manipulation. As for the GPS-fixed-location navigation, the UAV is required to carry a camera that hovers at fixed-locations and follows a flight path, which are all preprogrammed by GPS-based geo-locator. Luque et al. 18 achieved navigation around PTTs by ground control station (GCS). The GCS transmits control inputs to UAV and obtains information from the payload. However, the ability of self-positioning and tower-localizing cannot work under the condition of unstable GPS and this method lacks the consideration of surroundings. With regard to the semiautonomous navigation, its aim is to reduce the operator’s cognitive load and level of skill. The methods mainly include using external force feedback through a haptic control device, 19,20 altering the magnitude and direction of the operator’s input, 21 and reducing the degree of freedom (DoF) that the operator controls. 22 In essence, these assistances above are based on the UAV perception of the relationship between its own positions and surroundings. Mcfadyen et al. 21 presented a theoretical analysis of sensor performance to constrain the platform behavior by maintaining a safety buffer zone to the electrical pole. Moore et al. 23 developed a UAV system uitilizing a lidar to percept polyhedron obstacle and conduct inspection of electrical transmission infrastructure. Sa et al. 22 developed an onboard flight controller using visual features for visual servoing to inspect pole-like structures. In conclusion, autonomous navigation of UAV-refined inspection around the tower is really challenging and it has not been fully implemented. The key problem of safety and autonomy is to give UAV the ability to determine the position of the tower and simultaneously be well aware of its own locations.
In the robotic navigation and infrastructure inspection literature of last decade, the Simultaneous Localization and Mapping (SLAM) is studied extensively and shows great prospect, since it can successfully perform simultaneous estimation of the state of a robot and the construction of a model (map) of the environment. Recently, visual SLAM systems have demonstrated that drift errors of trajectory estimation can be below 1% in real-world outdoor scenes. 24 –26 Thus, lately, vision-based navigation is popular for robots like UAV. In addition, images collected by cameras are also ideal data for UAV navigation, because they provide rich information quickly and are easy to be obtained and analyzed. Voigt et al. 27 implemented an embedded egomotion estimation system based on stereo cameras for the inspection of boilers and common indoor scenarios. Burri et al. 28 and Nikolic et al. 29 used a stereo-visual-based quad-rotor platform to realize Visual Odometry (VO) to inspect a thermal power plant boiler system. Teng et al. 30 proposed a power line inspection system solution based on mini-UAV-borne LIDAR system which can extract pole point cloud and detect pole deformation. Cerón et al. 31 implemented a Visual SLAM process in an AR-DRone 2.0 platform and used SLAM for drone navigation in power line surrounding. The detailed studies of visual SLAM system are promising to realize UAV self-positioning and tower-localization for close proximity inspection of high-voltage electric tower.
Before 2010, filter-based visual SLAM was common. Subsequently, the keyframe-based visual solutions in combination with sparse nonlinear optimization were demonstrated more efficient and more accurate than the filtering approaches. 32 Recent successful keyframe-based real-time SLAM algorithms can be divided into Dense–Direct-based SLAM and Sparse–Feature-based SLAM. The former is capable of reconstructing the environment with a dense or semi-dense map. Meanwhile, the camera motion is estimated by employing photometric errors derived from image pixel intensities. Literatures include LSD-SLAM, 33 DTAM, 34 and REMODE. 35 By comparison, the latter takes advantage of salient image features like keypoints to localize camera and performs a sparse point–based reconstruction of the environment. Examples contain monoSLAM, 36 PTAM, 37 and Oriented FAST and Rotated BRIEF (ORB)-SLAM. 38,39 Among them, the ORB-SLAM seems to be the state-of-the-art in public datasets, yielding better accuracy than direct methods. Currently, the existing wide variety of SLAM frameworks has not been analyzed and tested for refined high-voltage tower inspection.
Line features are very prominent in the PTT inspection environment. It provides abundant and useful visual structural information for UAV odometry especially in the poorly textured and illumination-changing scenes where feature points lose efficacy. In the recent literatures, the combination of point and line features has been employed for SLAM system. Lu et al. 40 presented a Red-Green-Blue-Depth (RGBD) visual odometry utilizing point and line features extracted from RGB-D data. Ruben 41 proposed a probabilistic approach to fuse points and line segments to form a stereo visual odometry. Zhang et al. 42 designed a graph-based visual SLAM system using straight lines with orthonormal representation and achieved better reconstruction performance. However, these studies cannot be directly applied to the transmission tower environments outdoors. The modifications of the SLAM details and the improvements based on the appearance characteristics of the tower are still necessary.
With regard to transmission tower localization, tower is expected to be extracted from the constructed environment map. Whereas, there are many noises in the sparse map and the key points reflect little information of a PTT. Besides, the dense or semi-dense map is too slow to be directly processed on the compact UAV platform with limited computing resources. To locate the PTT fast and accurately, suitable PTT detection algorithm in 2-D image can be fused into the SLAM framework. Martinez et al. 43 developed a machine learning–based approach combined with a tracking-by-registration strategy. But, traditional methods have to be faced with the complicated design of features and the choice of classifier. In recent years, deep learning (DL) technology has achieved great breakthroughs and reached the state-of-the-art in the field of 2-D object detection. 44 However, they quite consume the resources of graphic processing units (GPUs) and cannot yet achieve the real-time performance in the embedded system.
In this article, we propose an effective monocular vision–based environmental perception approach to realize PTT localization and estimate the UAV self-positions for close proximity PTT inspection. We tackle these issues utilizing a point–line-based SLAM and tower detection method (PL-TD). It is implemented in a hierarchically developed embedded UAV system. PTT has the prominent line feature. Thus, an improved extraction and matching method of the line features is presented to enhance frame association. Building upon the ORB-SLAM, a suitable SLAM system leveraging both point and line features is designed followed by a semi-dense mapping which can reflect the contour and line-shaped structure of the PTT. In particular, the bundle adjustment (BA) optimization component is incorporated with the point-to-line distance and the intersections of lines to improve the accuracy of UAV localization. For PTT localization, we create a transmission tower data set (https://drive.google.com/open?id=1UyP0fBNUqFeoW5nmPVGzyFG5IQZcqlc5) and customize a fast neural network (Tower Region Convolutional Neural Network (R-CNN)) for PTT detection to address the real-time problem and improve the detection accuracy. The detection can be well fused into the SLAM framework to provide an accurate position of PTT in 3-D space. In addition, we designed two paths that allow the UAV’s field of vision to cover most part of the PTT to realize safe close proximity inspection. Then, along the two paths, the whole UAV system built on the Robotic Operating System (ROS) framework is evaluated both in a synthetic scene and a real-world PTT inspection environment and achieves satisfactory results (https://youtu.be/tF3hrZsBw7w).
The remainder of this article is organized as follows. The second section gives an overview of the UAV hardware, system architecture, and the two paths planned for refined inspection. The third section explains the DL-based TD and the reason to choose semi-dense mapping. Details of our improved PL-based visual SLAM system, comprising of the heuristic extraction and matching of the lines, the improvement of BA optimization, are described in the fourth section. The experimental results and analyses are shown in the fifth section. Finally, the conclusions are summarized in the sixth section.
System description and inspection paths
Hardware platform
We employ a refitted DJI Matrice 100 quad-rotor platform, as shown in Figure 1(a). For the sake of portability and endurance, we leave most of the UAV space for two intelligent flight batteries and concisely equip the UAV with a Pan/Tilt camera (PTC), two advanced low power consumption-embedded processors NVIDIA TK1 and NVIDIA TX2 and a light wireless router. The rewards of adopting a single PTC are great, since it is of low weight, is cheap, consumes low power, and occupies a small mounting space. Besides, the PTC can rotate to provide flexible tower observation perspectives. The main specifications and related performances of the inspection UAV are listed in Table 1.

(a) The prototype of the refitted DJI Matrice 100 inspection UAV. (b) The hierarchical system architecture of the inspection UAV. UAV: unmanned aerial vehicle.
Specifications and performance of the inspection UAV.

UAV: unmanned aerial vehicle; CE: Conformité Européenne; FCC: Federal Communications Commission.
System architecture
Taking the system stability and ease of operation into account, the inspection UAV adopts a three hierarchical system architecture based on ROS network, as shown in Figure 1(b). TK1, as an underlying controller, communicates with the PTC and a flight controller. Meanwhile, TX2, with more computing power, is used as an onboard central processor and is primarily responsible for running algorithms. The laptop, for supervising and remote control, works in the upper level. These three scattered subsystems are connected by the wireless router and an image transmission module.
Paths for inspection
We created a synthetic scene which contains a PTT model. As illustrated in Figure 2, it has the same size as the actual tower and the units are in meters. Then, according to the characteristics of close proximity PTT inspection, two paths are proposed, named “circumvolant path” (CIRP) and “takeoff and land vertically path” (TOLP). As shown in Figure 2, they are denoted by the red and green lines in four different viewpoints, respectively. It can be seen that the two routes can effectively avoid the collision with thin PTLs and make it easy for a UAV’s field of vision to cover most of the electric devices.
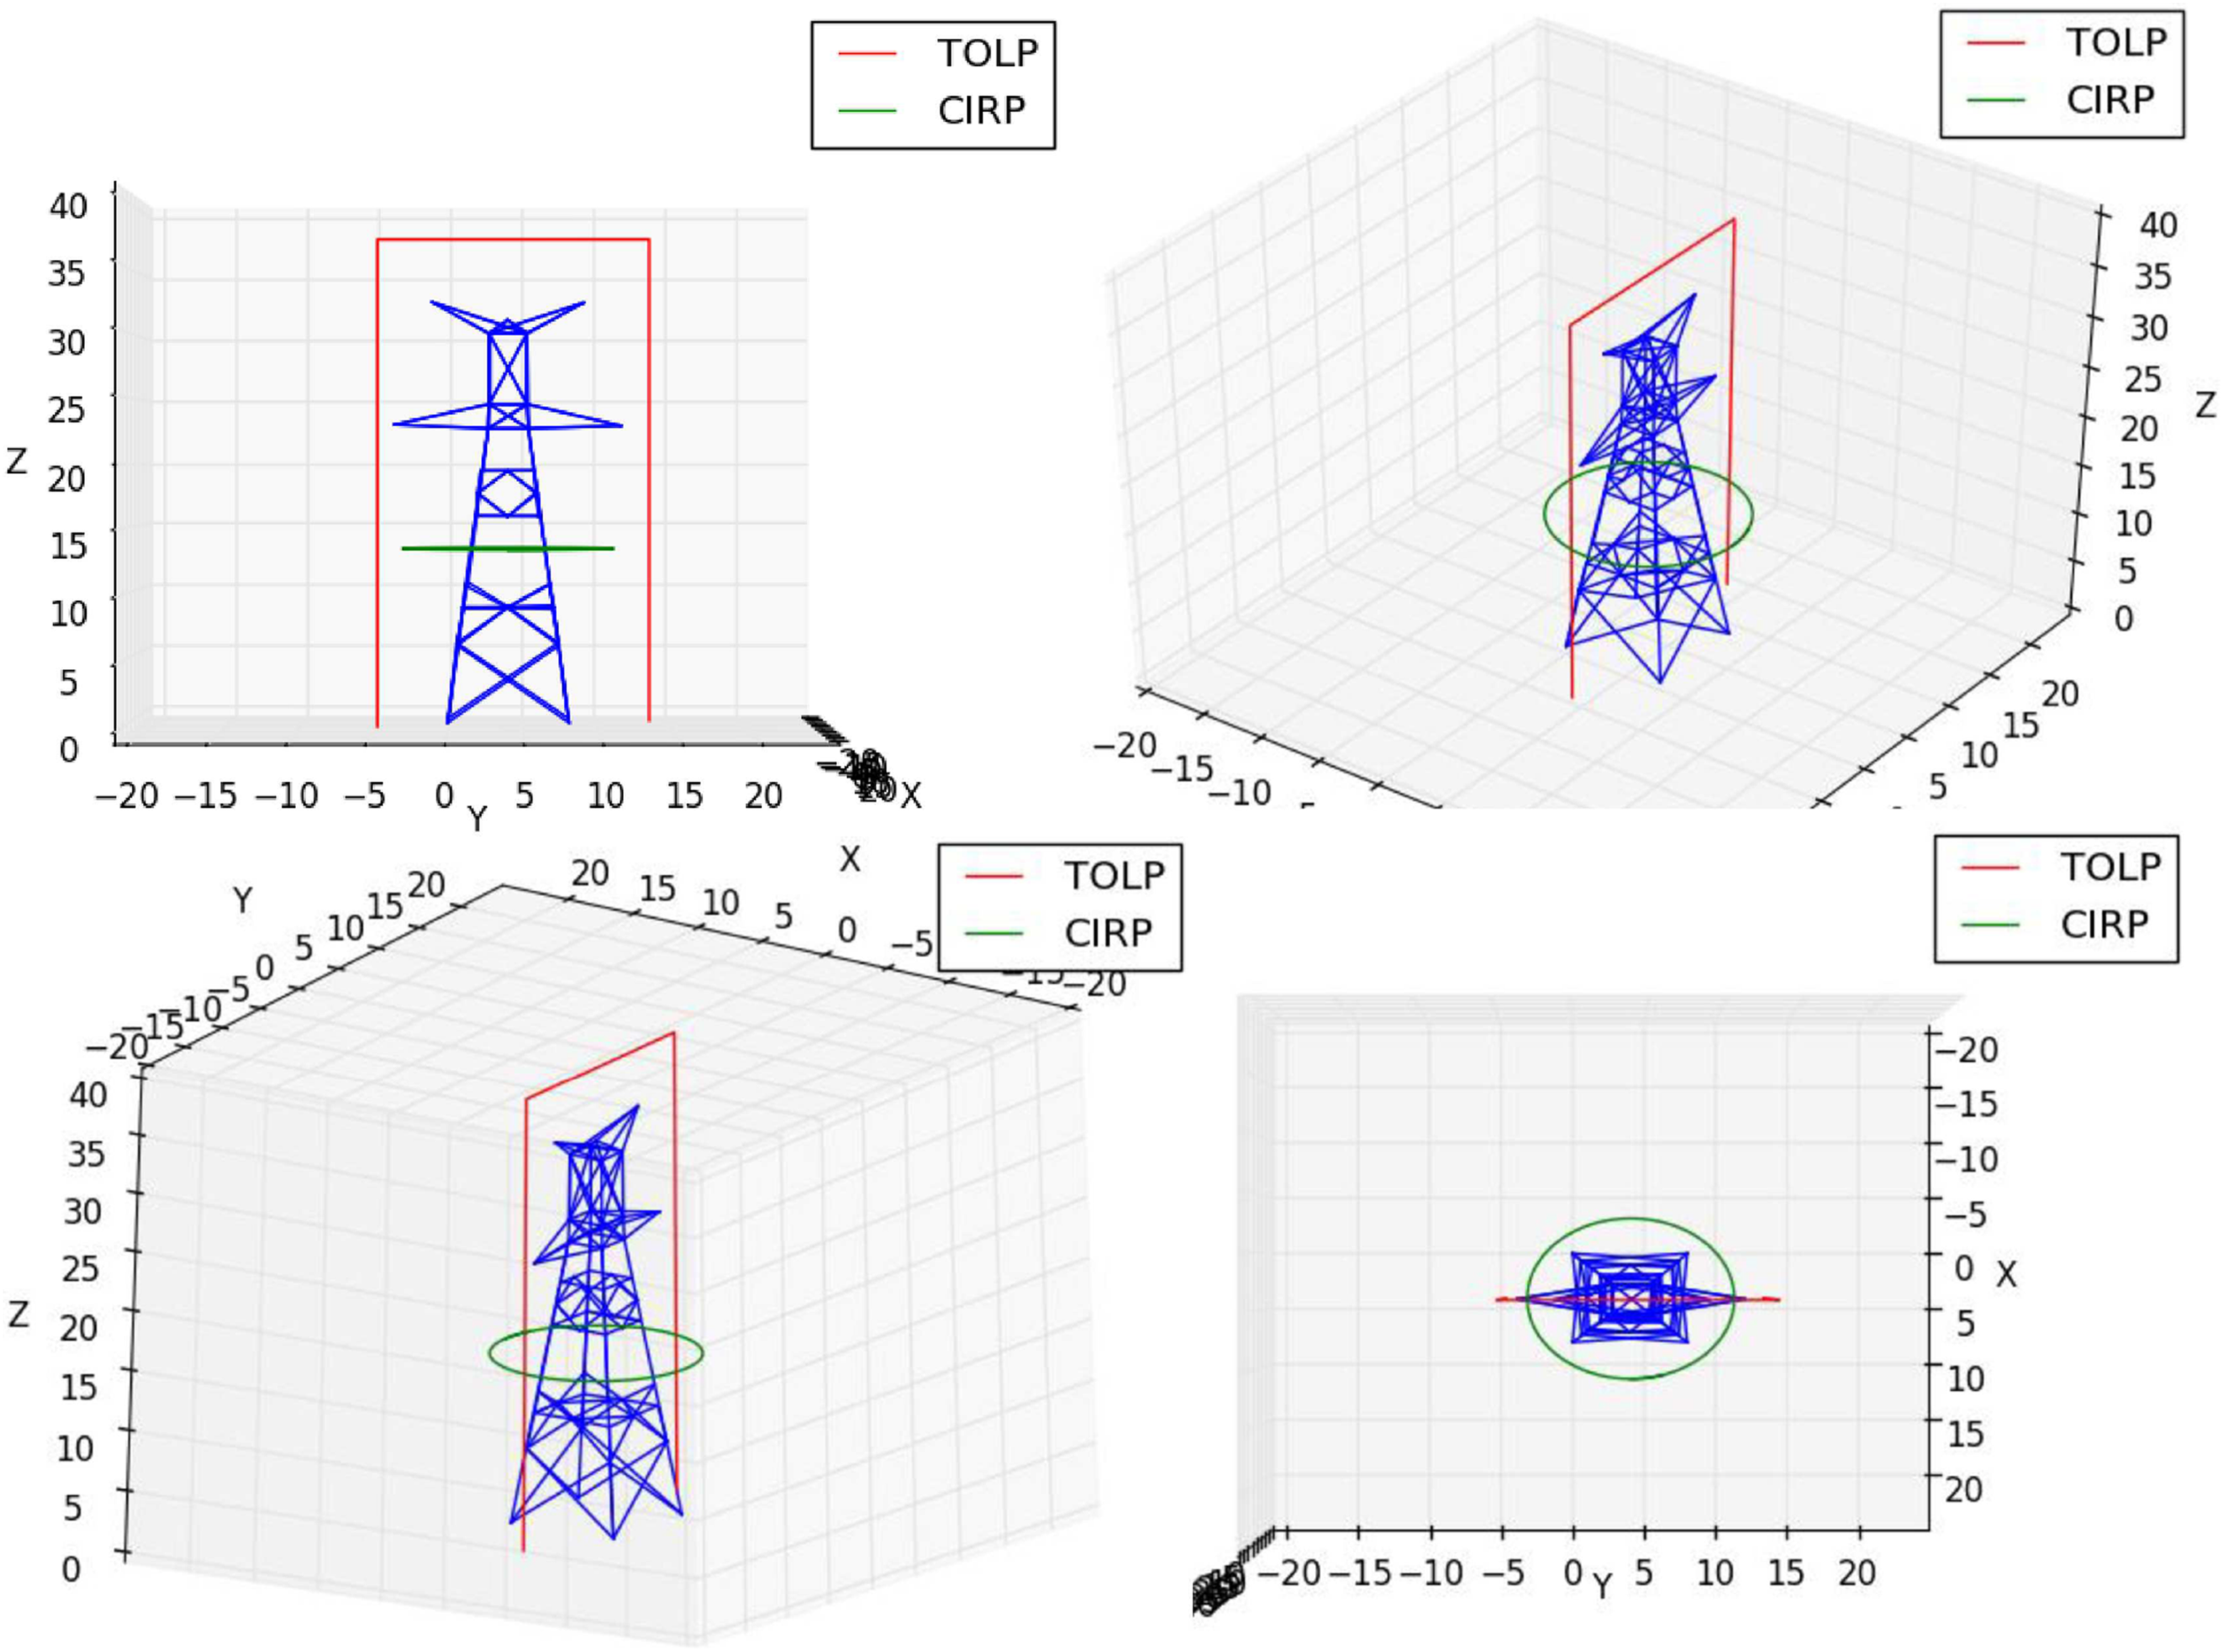
Synthetic PTT environment and two safe close proximity navigation paths in four views. PTT: power transmission tower.
Transmission tower localization
The current DL-based object detection algorithms, which have an outstanding precision rate, can be trained in advance by a large number of tower samples. Faster R-CNN 45 framework is an algorithm that achieves rare false detections in our transmission tower data set among all tested algorithms and can be faster if we limit the number of region proposals. So, we customize the Tower R-CNN based on the tower characteristics and the Faster R-CNN structure to meet the detection requirements of speed and accuracy. As illustrated in Figure 3, the special designs of Tower R-CNN are set as follows: (1) Transmission tower is an structural object that is abundant in low-level edge features and doesn’t need to be described by deeper abstract features. Therefore, Tower R-CNN has fewer convolutional layers, which are capable of shallow feature extraction, to realize detection. Simultaneously, the detection speed is significantly increased. (2) According to the prior information of tower appearance, the anchor boxes 45 only with aspect ratio 2:1 are selected as proposals. It improves region proposal quality and obtains higher detection accuracy. (3) The number of region proposals is usually large and their feature maps all need to be classified by the fully connected layers, which accounts for the amount of time. Due to the more distinguishable tower edge features, it is possible to reduce the parameters and simplify the structure of fully connected layers to improve detection efficiency. Additionally, to avoid overfitting problem and weight contamination, the layer-by-layer training is adopted.

Schematic diagram of the Tower R-CNN.
Semi-dense method recovers object contours and textured surfaces. It exploits the information from every pixel at which the gradient of image intensity is significant. This exactly accords with the line structure of tower appearance. Moreover, it is more useful than sparse point map in navigation due to much more point cloud information. Dense reconstructions 34,35 need GPU acceleration because of the high computational cost involved. While semi-dense only needs multi-threading optimization. The mapping algorithm is implemented according to Raul’s work 46 and is built upon our PL-based visual SLAM.
PL-based visual SLAM
Heuristic extraction and matching of lines
PTT inspection environment is full of line structures. We compared commonly used line detection methods in the real-world environment and finally chose line segment detector (LSD)
47
due to its good performance in SLAM system. This is demonstrated in the experiment section. LSD, an The segments which should belong to one straight line are merged based on their differences in direction and distance. Let d1 indicates the distance between the two midpoints and d2 represents the minimum distance between the end points. If d1 and d2 are smaller than the given threshold that is experientially determined by the minimum length value between the shortest line and a tenth of the bounding box longitudinal edge of TD, and the direction difference is smaller than 5°, then the two segments are fused since they are probably the two candidates of one line. For further fusing, the Euclidean distance between Line Band descriptors (LBDs) of two segments can be used. For each segment For stable end points, the intersection points of two line segments are determined. The intersection can be on the extension line. It must be inside the tower area and the distances from the intersection point to the nearest end points of the two line segments must be less than the minimum length of the two segments. So that the extension line doesn’t exceed the original lines. Besides, to reduce noise, the lengths of the two segments need to be empirically greater than one-fifth of the transverse edge of the TD bounding box.
LBD is an effective and robust local appearance-based method to find correspondences between lines. However, the appearance of the PTT has some similarity that leads to wrong matching. Therefore, we introduce a geometric matching criterion (GMC) of adjacent frames to effectively improve accuracy of LBD-based line matching. The GMC retains line matches which satisfy the following conditions: The segments should have similar length. The angle between two lines is less than a threshold. The distance between the end points shouldn’t exceed a certain threshold. In distance measurement, the two end points should be distinguished into different points according to the line direction that is determined by which side of the line segment is thicker.
PL-based BA optimization
The keyframe-based SLAM architecture relies heavily on sparse nonlinear optimization (BA), since it is of vital importance to precision of motion and structure. After heuristic extraction and matching of PTT lines, we obtain accurate line matches and stable line end points. To integrate line features within the BA to further improve optimization accuracy in the PTT environment, we next describe the line parameterization, utilization of intersections, and the proposed error function.
Unlike the reprojection errors used in ORB point features, the distance between the projected end point and detected end point cannot be directly used since the 3-D lines may not be fully detected in the image or they are partially occluded. These situations possibly occur in a harsh wild inspection environment. So we use the point-to-line distance which can be divided into projected-point-to-detected-line distance and detected-point-to-projected-line distance. In the first case, the line measurement error

where

where
There are a good deal of corner points in the PTT structure. Most of them are picked out by the heuristic line extraction method so as to stabilize the end points. The corner points are PTT salient features and can be quickly extracted based on the line detection results. These advantages make the corner an excellent feature for our framework. Therefore, we try to add them within our SLAM system as if they were ORB features. So that the corners can adapt to most of the SLAM architectures and the number of feature points can increase a lot to improve algorithm robustness without losing runtime efficiency. ORB feature is designed by adding orientation and multi-scale information on the basis of FAST
50
corners and it has a 256-bit rotated BRIEF
51
descriptor according to its direction. However, the BRIEF descriptor of corner point can’t be directly computed since the extraction process of the corner is different from that of the ORB. Therefore, we design a simple and efficient method leveraging local image patch of the corner point to provide the necessary orientation and pyramid scale information for corner BRIEF construction. In our approach, the acute angular bisector of the corner point is adopted to represent the direction information. Different sizes of rectangular blocks, which take the corner as the center, are used to describe the multi-scale information. This is able to simplify the complex scale operations. After that, there is no distinction between the ORB features and the corner features. The point measurement error

where

where


In the image, the uncertainties
Overview of PL-TD
In this part, we briefly summarize our proposed PL-TD framework. As shown in Figure 4, PL-TD is composed of transmission tower localization and PL-based visual SLAM which is an extension of the ORB-SLAM. The framework contains five main threads: tracking thread, local mapping thread, loop closing thread, semi-dense mapping thread, and TD thread.

Schematic diagram of proposed PL-TD framework. PL: point–line; TD: tower detection.
The tracking thread
The tracking thread is the visual odometry which estimates the poses of PTC. Besides, it determines when to add new keyframes. Firstly, a constant motion model and a window search strategy are used to guess the current PTC pose and initialize a coarse matching, respectively. Based on the matching, a reference keyframe which shares most features with the current frame is selected followed by a covisibility map of the keyframe is retrieved. Then, lines and points in the local map are projected to current frame to build more feature associations. Finally, the PTC poses are optimized by the proposed PL-based motion-only BA. For close proximity inspection, the policy of keyframe insertion is designed very generously so that the tracking is more robust. Redundant keyframes can be discarded subsequently in the local mapping thread. In addition, the relocalization module of ORB-SLAM is abandoned and once the tracking is lost, the UAV will hover for safety.
The local mapping thread
The local mapping thread performs PL-based local BA to optimize the local map that is related to the newly added keyframe. If a keyframe is determined, the local mapping thread triangulates map points and lines according to the matching information collected in the tracking thread. Then, the points and lines, seen from less than three keyframes or in less than 25% of the frames from which they are expected to be seen, are discarded. Additionally, based on the number of co-visible points and lines, the local mapping is also responsible for removing redundant keyframes.
The loop closing thread
The loop closing thread checks whether the loops are detected and is in charge of correcting the drift errors. Based on the ORB and LBD features extracted from a large set of inspection pictures, the visual vocabulary of points and lines is trained off-line by Distributed Bag-of-Words (DBOW), 52 respectively. An online database-reserving bag of words vector of keyframes is established for loop candidates detection. For each detected loop candidate, based on the corresponding points, a RANSAC 53 scheme is performed to find a relative Sim(3) transformation 54 S using the method of Horn. 55 If S is found, the S will be optimized by minimizing the reprojection errors in both keyframes to find more correspondences. If there are enough correspondences, the loop can be accepted. Then, both sides of the loop are aligned and duplicated points and lines are fused. Finally, a PL-based pose graph optimization is performed globally.
The semi-dense mapping thread
The semi-dense mapping thread searches correspondences of pixels in high-gradient areas of keyframes. Due to a wide baseline between keyframes, the search of pixel correspondences is improved by an intra-keyframe inverse depth fusion and an inter-keyframe outlier removing method, which finally bring an accurate reconstruction with few outliers. For more details, readers can refer to Raul
The TD thread
The TD thread detects the PTT or part of the PTT fast and accurately by the proposed Tower R-CNN. In combination with the correspondences between the 2-D pixels and the 3-D semi-dense points, the PTT can be localized well and represented by enough point clouds in 3-D space for refined inspection.
Experiments and analyses
Transmission TD experiment
Experiment setup
For this experiment, 1300 sheets of transmission tower pictures were collected from refined inspection videos and annotated manually. The data set considers different backgrounds, illumination, image resolutions, observation viewpoints, and occlusion conditions. To verify the validity of our algorithm, we conducted comparisons of TD between the proposed Tower R-CNN and the three state-of-the-art DL-based detection frameworks: Faster R-CNN, 45 single multibox detector (SSD), 56 and YOLOv2. 57 We adopted 10-fold cross-validation 58 to find the best models. Following this scheme, the data set is randomly partitioned into 10 subsets with equal size, then the training and validation are conducted for 10 times. Each time, a different subset is taken out for validation while the remaining union of nine folds is used for training. We used the Caffe framework 59 to implement the training process on a GTX TitanX GPU and the validation process on TX2.
Quantitative evaluation methodology
For quantitative evaluation of the detection task, we adopted the intersection over union, which is the evaluation standard of the PASCAL Visual Object Classes challenge.
60
A detection is to be considered correct when the bounding box overlap ratio r between the ground truth

where
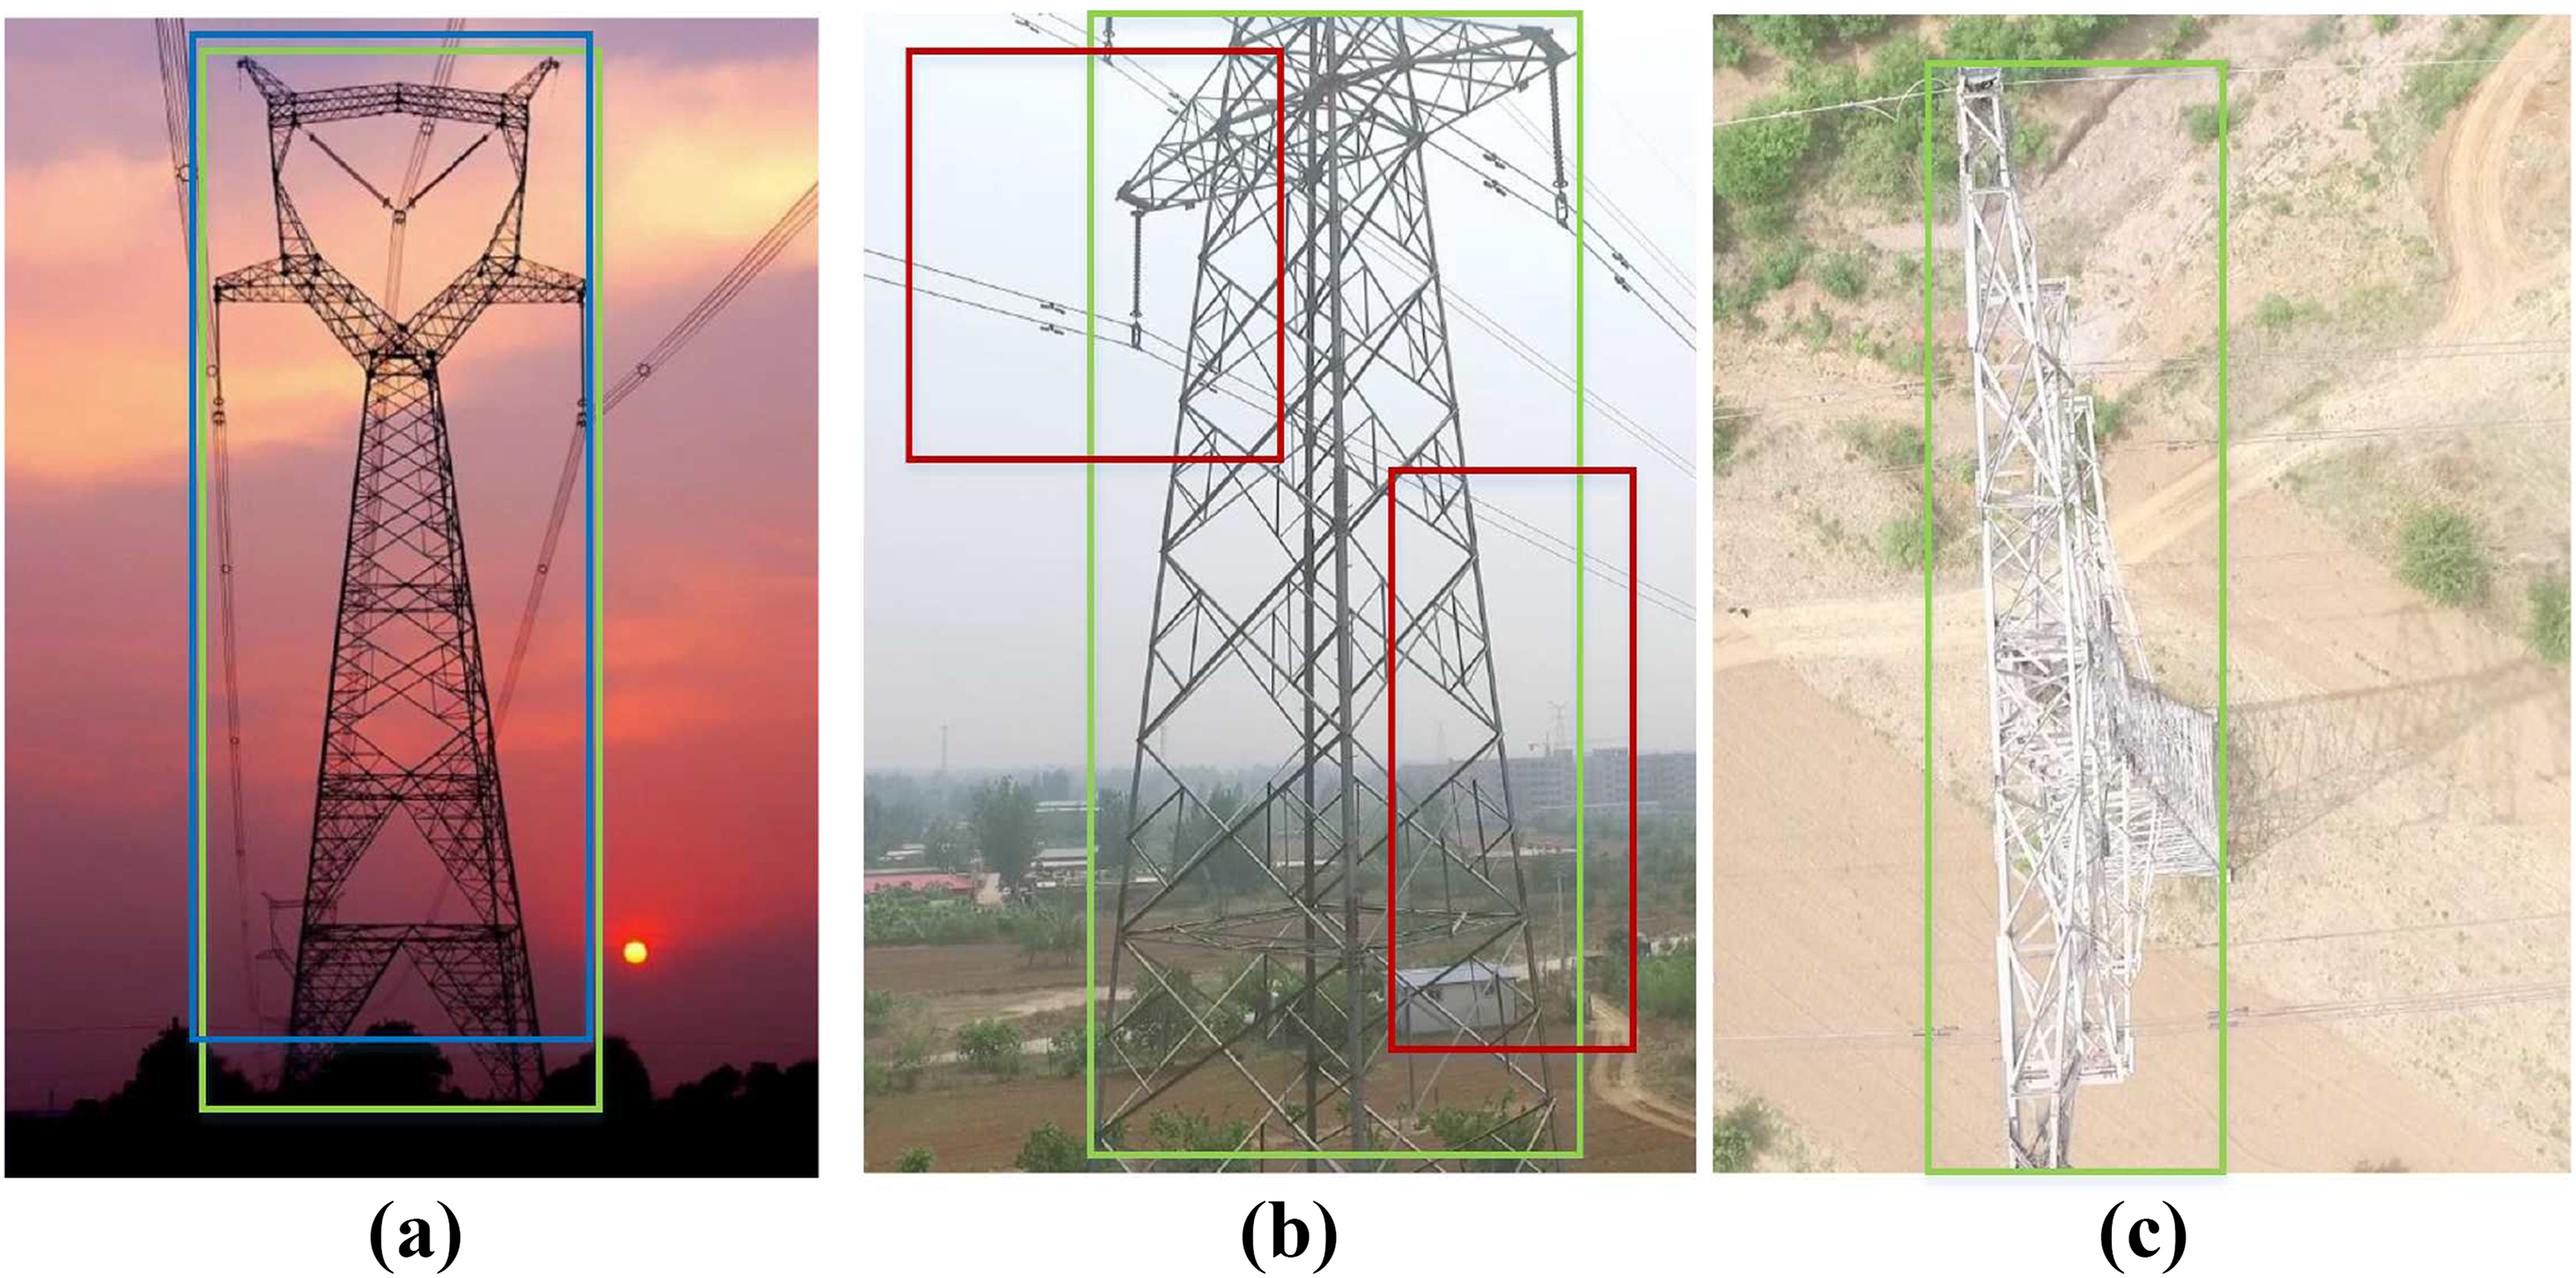
Success and error judgement for detection. The green bounding boxes represent ground truth. (a) The blue bounding box represents TP, (b) the red bounding boxes represent FP, and (c) no detection bounding box (missed detection) represents FN. TP: true positive; FP: false positive.
Further, the precision and recall are employed as follows


Each predicted bounding box has a confidence value between 0 and 1 to describe the degree of certainty. If the detection confidence is higher than a given threshold, it can be classified as TP. Otherwise, it is FP. So based on the different confidence thresholds, we can obtain many value pairs of the precision and recall. Subsequently, the precision–recall curve can be plotted. The average precision (AP), summarizing the shape of the precision–recall curve, is defined as the mean of 11 equally spaced recall levels [0, 0.1,…, 1]
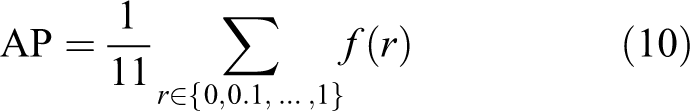
where
Experimental results
The comparison was made from the following three aspects: runtime, AP, and the false detection rate (precision–recall curve). All results are from the best models after 10-fold cross-validation. As shown at Table 2, SSD300 has the fastest runtime and YOLOv2 has a speed of 5.6 frames per second (FPS), but their AP is relatively low. Thus, they may have a low overlap ratio r and unstable bounding boxes due to environmental interference.
Performance of the inspection UAV.

FPS: frames per second; AP: average precision.
With respect to the precision–recall curve, as illustrated in Figure 6, Tower R-CNN denoted by the green line maintains a 100% precision over a fairly wide range of recall, which clearly surpasses Faster R-CNN, SSD, and YOLOv2. At this point, Faster R-CNN, SSD, and YOLOv2 encounter different degrees of false detection, even at a low level of recall. The high precision, namely no false detection, brings significant safety to close proximity navigation around PTT. Therefore, the proposed Tower R-CNN can provide reliable and real-time TD results for inspection task.

Precision–recall curve for TD. TD: tower detection.
Line extraction and matching experiment
For line extraction, we evaluated four effective line detection methods which are commonly used in the literatures: Progressive Probabilistic Hough Transformation (PPHT), 61 LSD, 47 EDLine, 62 and fast line detector (FLD). 63 To evaluate the detection performance, we tested 100 images with 640 × 480 resolutions in real-world close proximity PTT inspection environments and statistically analyzed the results in detail.
The evaluation of line detection is usually based on the extraction speed and line quality which consists of quantity, length, and repetition. All four line detection algorithms are written in the C++ language and run on the Nvidia TX2. As can be seen from Figure 7, it is difficult to detect the complete linear structure of a tower by applying PPHT. The straight lines are often contaminated by line-like noise. Besides, to some extent, FLD and EDLine are more susceptible to the environmental influences than LSD, and LSD has more obvious line detection results. As illustrated in Table 3, EDLine detects the largest number of lines. However, the lines detected have many repeated results that influence the line matching. LSD has few repeated results and detects more line segments than FLD but is slower than FLD and EDLine. Whereas, the accurate straight line detection of LSD can provide great safety, which is most important for close proximity navigation. Furthermore, the UAV will not fly too fast during close proximity PTT inspection, the frame rate of the camera doesn’t have to be very high. Summing up the above, we choose LSD as the line detection method.

Results of different line detection in typical close proximity inspection situations.
The results of line detection algorithms.

LSD: line segment detector; PPHT: Progressive Probabilistic Hough Transformation.
Based on the proposed heuristic line extraction method, the accuracy of tower line detection is further improved after LSD. Figure 8(b) and (d) are the heuristic line detection results of Figure 8(a) and (c), respectively. Compared with Figure 8(a) and (c), the red circles in Figure 8(b) and (d) show more stable end points, reflecting the intersections of the tower. Moreover, the lines circled in green are more discriminative and parallel. It is consistent with the actual appearance of the tower. In further, the lines circled in blue are elongated, overcoming the disadvantages that LSD often divides a line into several segments. The heuristic method reduces the risk of failure for line feature matching and tracking and provides stable observations for optimization.

Results of heuristic line extraction of PTT. PTT: power transmission tower.
Figure 9 shows several line matching examples in local maps. The same numbers marked on lines in different keyframes indicate that they are matched. The matching results are completed by the GMC of adjacent frames and the LBD descriptors. In further, the matching criterion can be accelerated by a guided search (GS) which is based on a predicted velocity motion model. A quantitative evaluation of adding the GMC and GS for matching was carried out in a video sequence. The image resolution is 640 × 480. As illustrated in Table 4, the proposed matching approach makes data association significantly robust with few wrong matches and a little time increase.
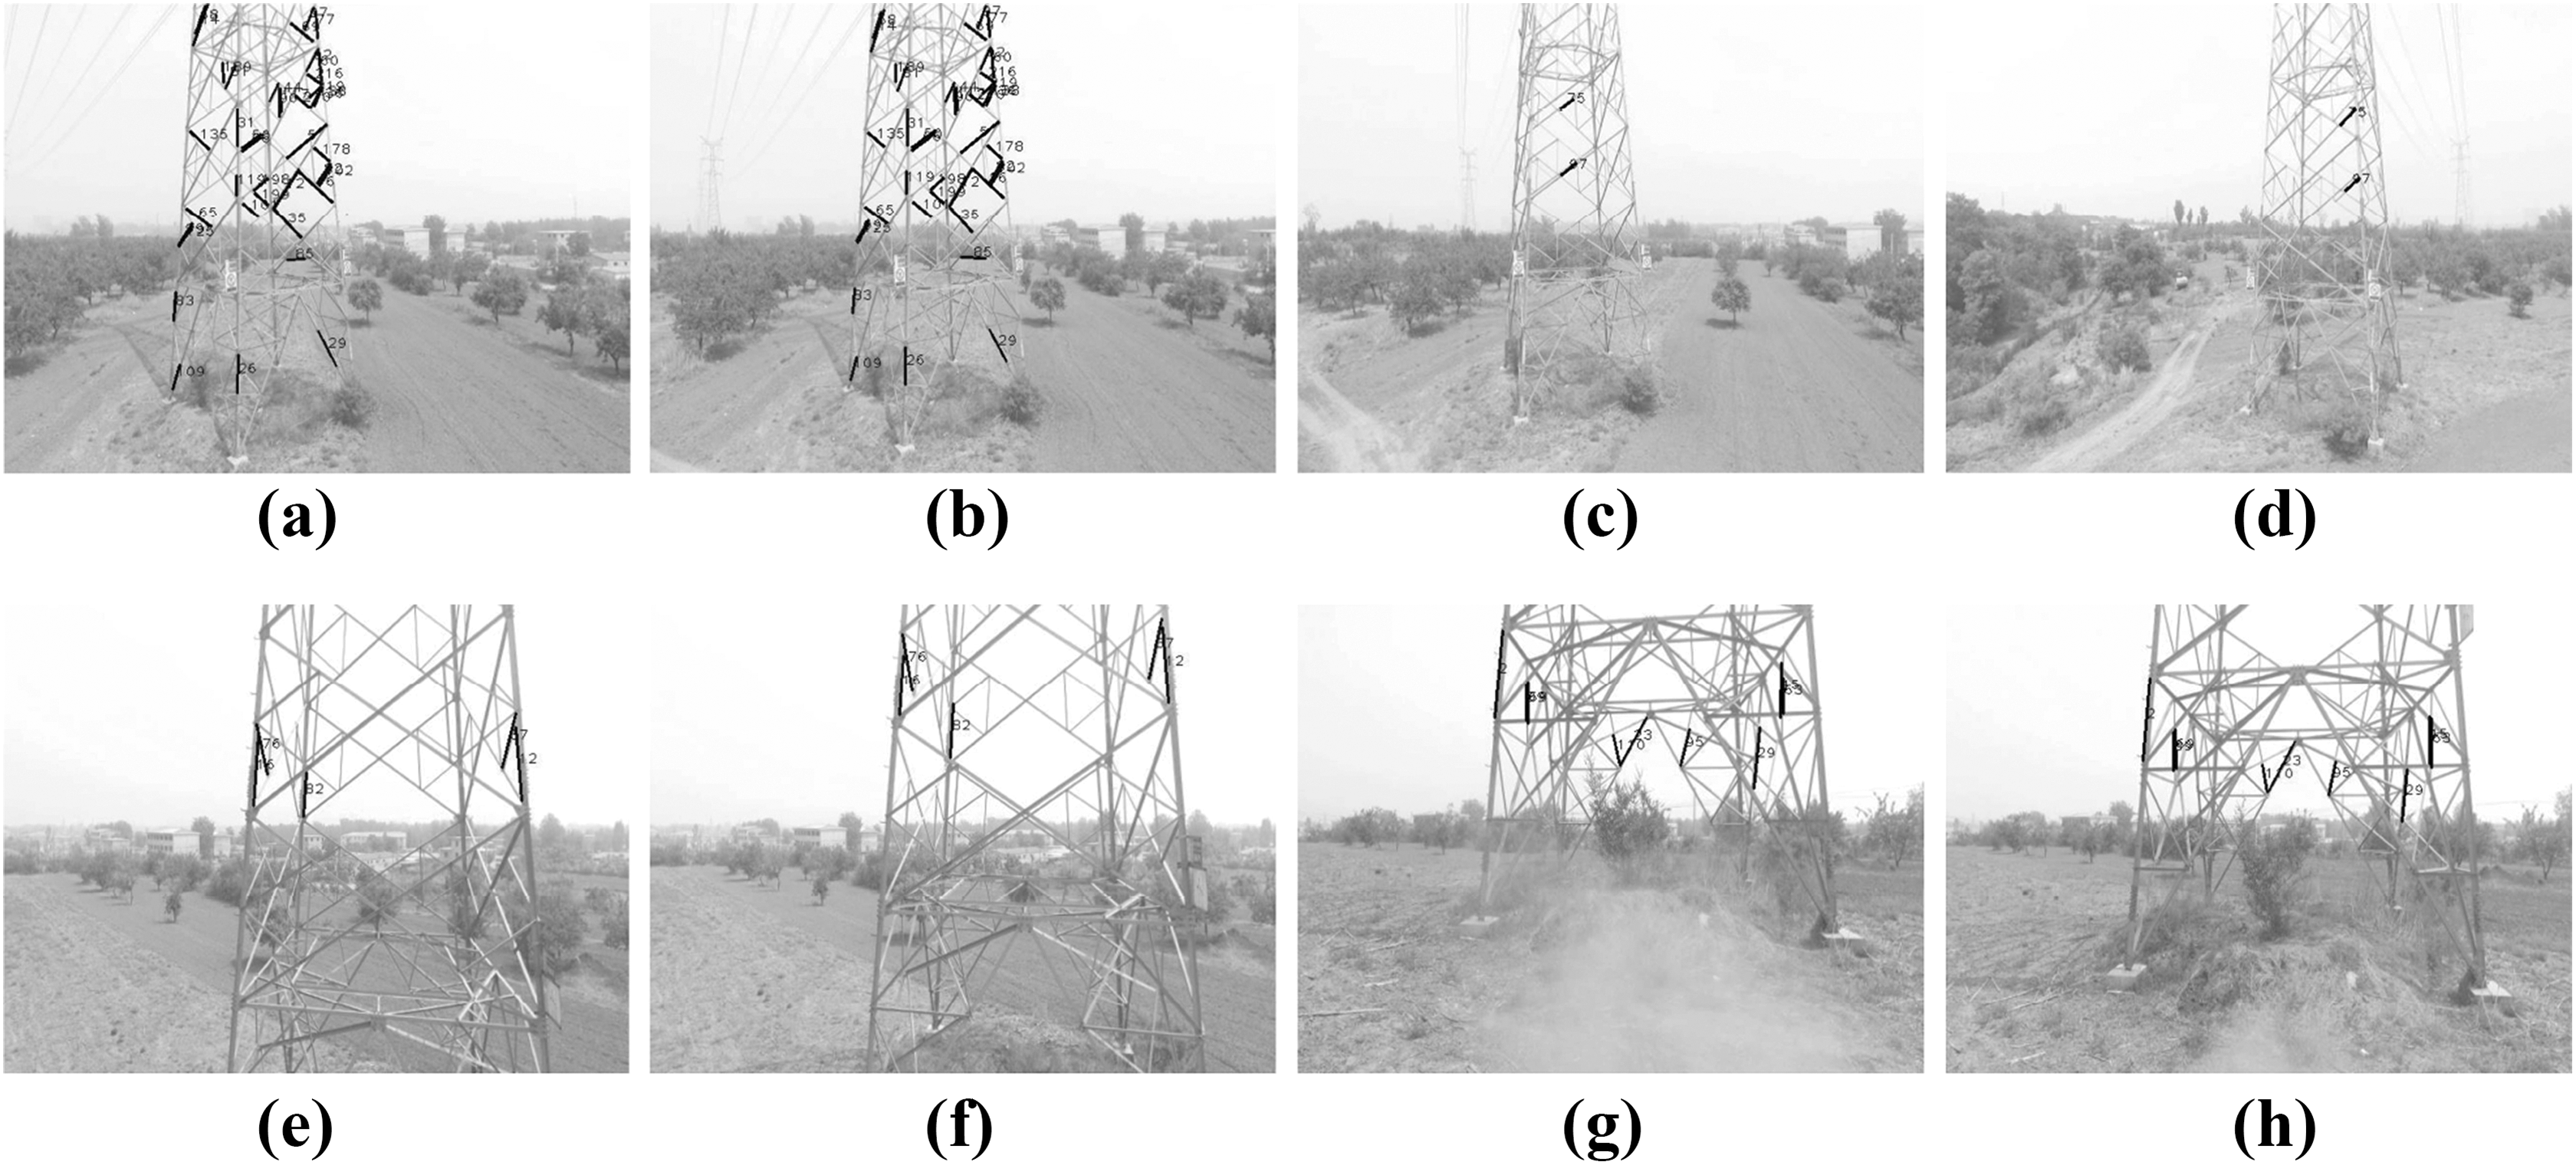
Results of line matching in local maps. (b), (d), (f), (h) are the pictures with different viewpoints in the covisibility graph 38 of (a), (c), (e), (g), respectively. The matched lines are denoted with same numbers.
The results of line matching approaches.

LBD: line band descriptor; GMC: geometric matching criterion; GS: guided search.
Experiments in synthetic scene for UAV and PTT localization
This experiment was conducted to verify the accuracy of UAV self-localization which takes advantage of the proposed point-to-line distance and the intersections of lines. Two-hundred camera positions were sampled at a fixed time interval from the proposed two paths. At each position, the camera can see part of the PTT according to the camera projection model. The observation of the line segment on the image plane can be obtained by projecting the PTT line structure to the camera plane. Besides more 3-D points are added around the tower corners and projected as the ORB point features. Then, we added Gaussian white noise with a variance of 10 pixels to the point and end points of lines in the image. In addition, two other Gaussian white noise models with a variance of 3 m and 5° are separately imposed on the translation and rotation of camera poses. The collection process of simulation data is shown in Figure 10. Actually, we conduct the pose graph optimization, and the 3-D corner points of PTT are fixed in this experiment.
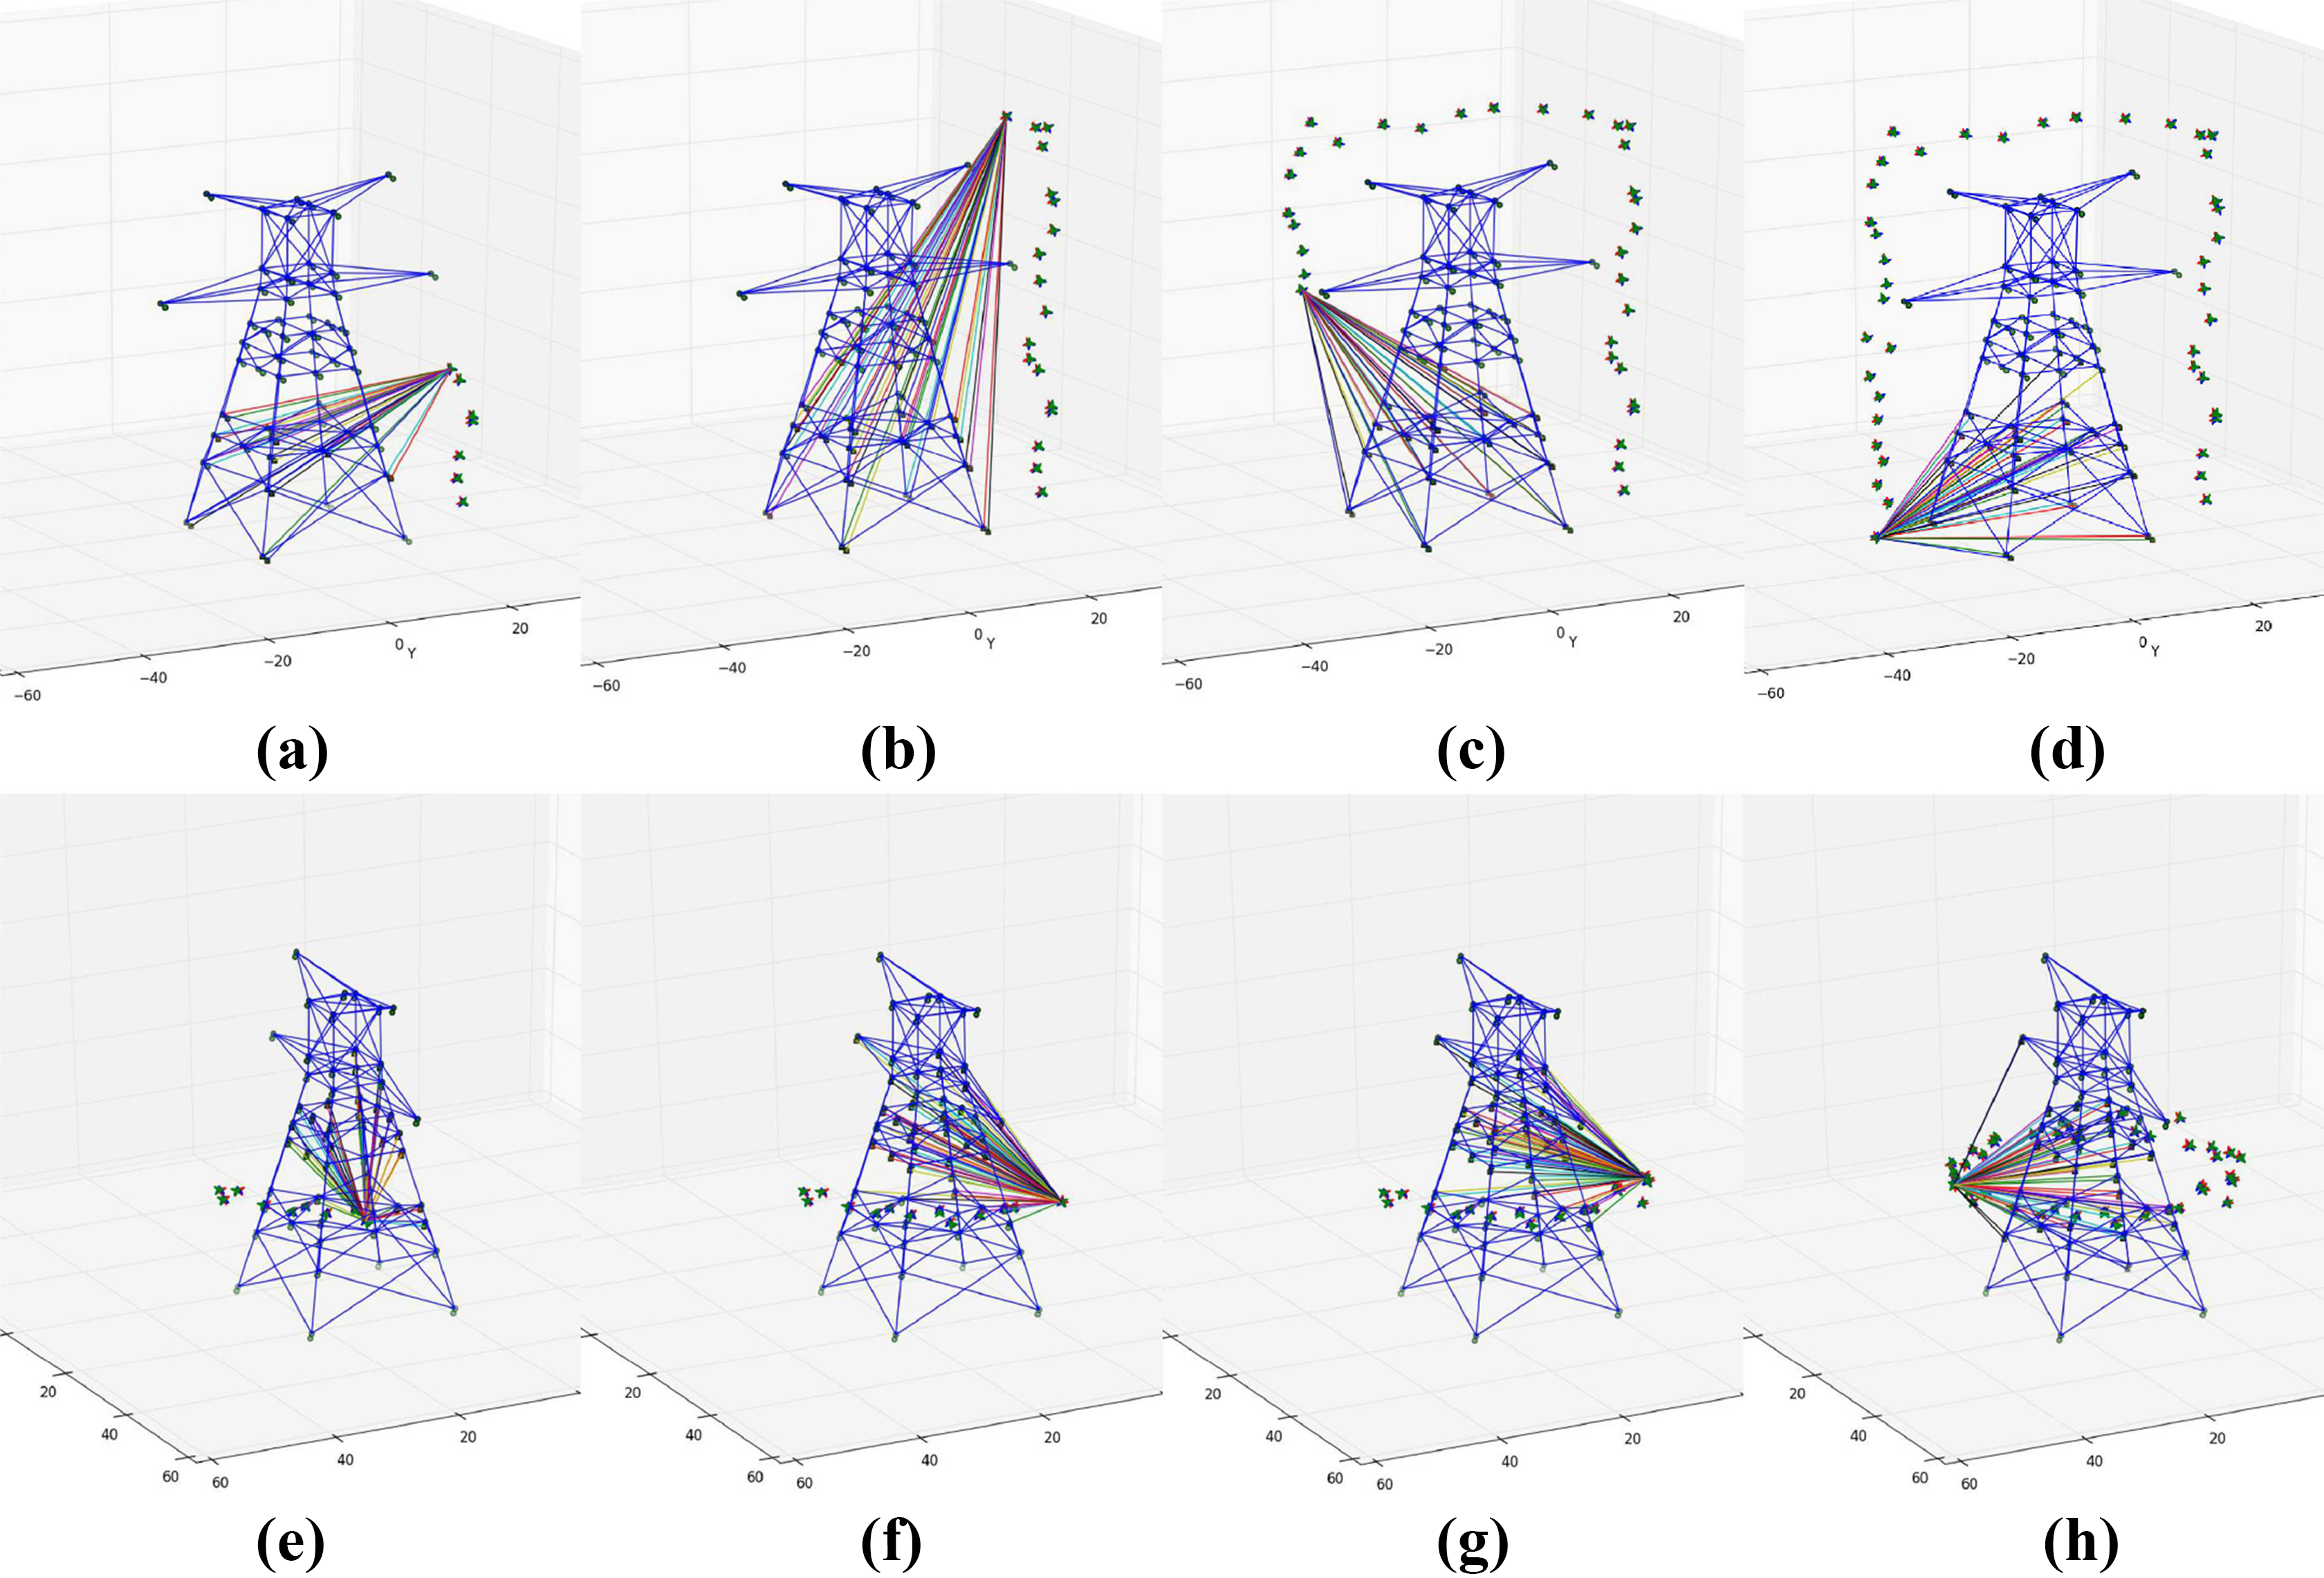
(a), (b), (c), (d) and (e), (f), (g), (h) show the generation of simulation data with Gaussian white noises along the CIRP and the TOLP, respectively. A PTT corner point is in the camera’s field of view if there is a color line connecting it and the camera. PTT: power transmission tower; CIRP: circumvolant path; and TOLP: takeoff and land vertically path.
In the experiment, we adopted Levenberg–Marquardt algorithm in the Ceres optimization library, 64 which is developed by Google, as an optimization solution tool. For a fair comparison, the optimizer iterates the same number of steps. The optimized positions of 200 cameras are shown in Figure 11. In the synthetic scene, our approach based on fusion of points and lines makes the UAV self-positioning more robust to noises. It outperforms than the method based on ORB point feature only and the method based on line and intersection features only. The point-to-line distance and the intersections of lines provide extra useful constrains for UAV odometry.

The results of motion-only BA. (a) and (d) The optimization results of using ORB point feature only. (b) and (e) The results of using point-to-line distance and the intersections of lines. (c) and (f) The results of using ORB points, lines, and intersections of lines. The green points denote the camera positions. The white points represent the PTT corner points. The white points make up the basic shape of the tower. BA: bundle adjustment; PTT: power transmission tower.
With respect to the quantitative evaluation metric, we employ the Root Mean Square Error (RMSE) of Relative Pose Error (RPE) to evaluate the performance of our approach. The RPE measures the trajectory accuracy over a constant time interval Δ and reflects the drift of the trajectory. It is defined as equation (11) at time step i

where


where
The first two rows are the RMSE of RPE after minimizing different losses and the last row records the maximum variances of Gaussian white noise that the optimization can tolerate.

RMSE: root mean square error; RPE: relative pose error.
In the close proximity navigation around PTT, the precision of each reconstructed 3-D feature point of the tower is not needed. The accuracy is mainly determined by the 2-D TD in the first experiment. Based on the experimental setup above, we added different levels of noises to the 3-D tower corners and tested the robustness of tower reconstruction. The tower corner points are restored by global BA. We define that the optimization converges if the average distance between optimized PTT corners and the ground truth corners is less than 0.1 m and the gradient variation is smaller than a threshold. The last row of Table 5 records the maximum variance of Gaussian white noise that the three methods can tolerate for successful convergence. It can be seen that our proposed method performs best in terms of reconstruction robustness.
Experiments in real-world scenes
We conducted several experiments in the field to validate our proposed monocular vision–based environmental perception approach. A transmission tower which has a typical 220-kV double circuit lattice steel structure is selected as an inspection target. It has a height of 35 m and a base width of 6 m and can be approximately enveloped by a 8 × 8 × 35 m3 (length, width, and height) cuboid. We operated the UAV to fly along our proposed CIRP and TOLP. Besides, we deliberately operated the camera to make the tower appear in the field of camera view and have a random position in image. In further, the trajectory of UAV can be recorded based on an accurate differential GPS system of the UAV. The GPS data of transmission tower is provided by a power company and based on WGS84 (World Geodetic Coordinate System 1984). It is in principle possible to evaluate the accuracy of the experimental trajectory. However, the accurate time alignment between the ground truth and the estimation is difficult to obtain in the field environment. The time deviation mainly comes from the out-of-sync transmission of GPS data and image data in the system. Considering the fact that the speed of UAV is slow during refined inspection, the deviation of time caused by system is still within the acceptable range in this large inspection scenario.
Figure 12 shows the results of image processing of the SLAM framework during navigation. As illustrated in Figure 12 (d), when the number of detected ORB keypoints is small, the number of detected PTT lines is prominent. To further demonstrate the effects of PTT lines for UAV self-localization, the UAV was operated to fly around the PTT and we recorded this planned trajectory by the differential GPS system. The ORB keypoint-based trajectory and our PL-based trajectory are calculated from the collected video. The three trajectories are aligned by correcting the scales and they are compared in Figure 13. It can be seen that our approach combining line features are closer to the ground truth. After 10 experiments, Table 6 shows the average RMSE errors of the two vision-based trajectories with respect to the planned trajectory, respectively.
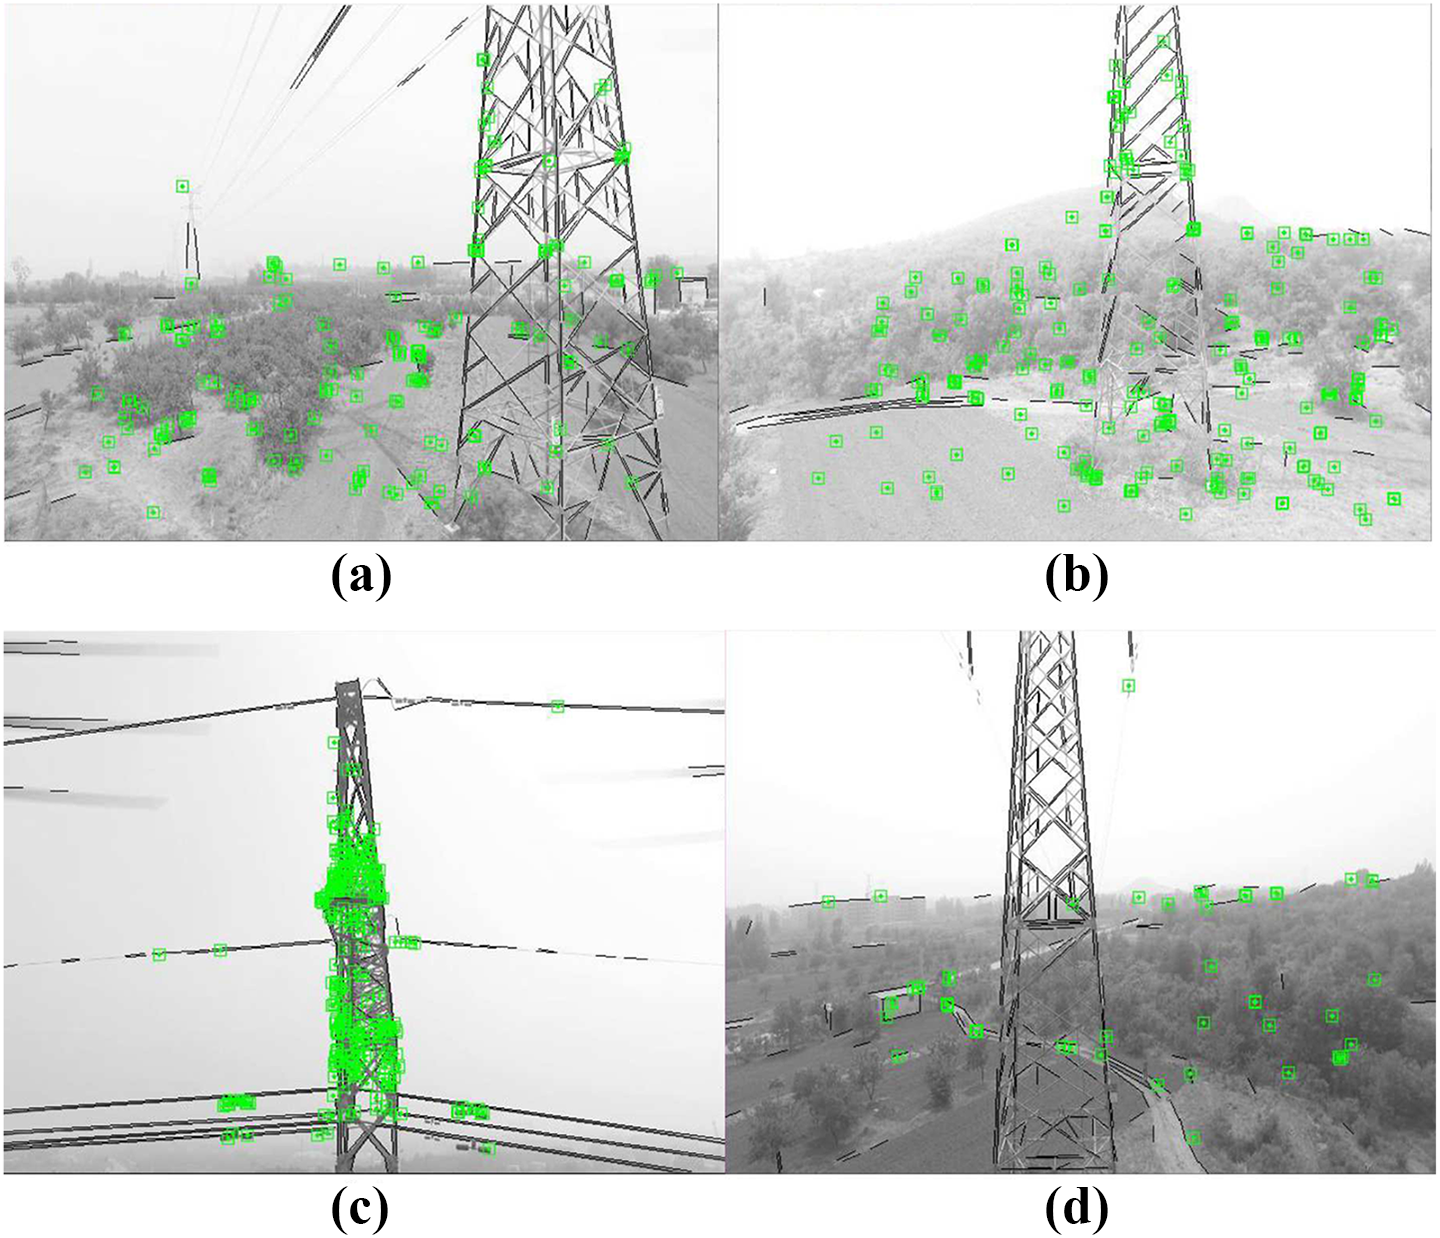
Sample images in real-world refined PTT inspection. (a) and (b) are pictures captured along the CIRP path; (c) and (d) are pictures captured along the TOLP path. The green points denote the detected keypoint and the black lines denote the detected line feature. PTT: power transmission tower; CIRP: circumvolant path; and TOLP: takeoff and land vertically path.

Comparison of the planned trajectory (recorded by the differential GPS system), the ORB keypoint-based trajectory and our PL-based trajectory. The three trajectories are around the tower and contain the viewpoint of Figure 12(d) which has fewer ORB keypoints. GPS: global positioning system. PL: point–line.
Comparison of RMSE errors of the RPE.

RMSE: root mean square error; RPE: relative pose error; PL: point–line.
In terms of the reconstruction results of the PTT and environment, we compare the typical semi-dense reconstruction algorithms of LSD-SLAM and the keyframe-based semi-dense mapping. 46 LSD-SLAM is open source but the other is not. We implemented the semi-dense algorithm in C++ language and integrated it into our framework. As shown in Figure 14 (a), the map built by LSD-SLAM contains a lot of noises and there are large deviation and jitter in UAV position estimation. LSD-SLAM is based on the photometric consistency hypothesis and localize the camera by optimizing directly over image pixel intensities. Therefore, LSD-SLAM is sensitive to illumination changes and the reconstruction accuracy is greatly degraded in the real-world inspection scene. In contrast, feature-based methods are able to match features with a wide baseline due to their good invariance to viewpoint and illumination changes. Camera poses are well optimized by BA over features. This allows to further obtain high quality and accurate reconstructions. As shown in Figure 14 (b), the keyframe-based semi-dense method recovers the PTT contours and reconstructs high-gradient areas which can reflect the line structures of PTT. This rich PTT representation is useful for UAV fixed-location inspection. The map requires no GPU and we implemented it only by adding a new thread.

The comparison of reconstruction algorithm. (a) The result of LSD-SLAM; (b) the result of keyframe-based semi-dense mapping. The blue rectangles represent the camera poses. The green line represents the camera’s trajectory. LSD: line segment detector.
Figure 15 shows the several complete UAV trajectories and PTT reconstructions in the real-world experiments. It can be seen that the triangulated 3-D lines and the semi-dense point cloud can accord with the PTT structures. To a certain extent, the accuracy of reconstructions of the environment is determined by the accuracy of estimation of camera poses. So, our approach can successfully estimate the UAV camera poses. Furthermore, we compared the ORB-SLAM scheme and our PL-based approach on a recorded video. The video completely covers the two paths of CIRP and TOLP. For a fair comparison, the parameters for point feature extraction were kept same. At each 640 × 480 image, 2000 point features at 8 scale levels with a scale factor of 1.2 were extracted. Figure 15(i) shows the ground truth of PTT location and camera poses. Figure 15(j) shows the environment reconstruction and estimation of camera poses of our methods along the same path in Figure 15(i). We enlarged or reduced the camera positions by multiplying a suitable scale to minimize the mean square error between the sampled camera positions and the ground truth values. Figure 16 shows the comparison between the ORB-SLAM scheme and our PL-based approach along the CIRP and TOLP. It can be seen that our approach has a smaller error in more positions with respect to the GPS ground truth. Table 7 shows the average errors of 10 experiments. The translational RMSE of RPE of our approach is 0.393 m and meets the requirements of actual inspection. The PTT center is estimated by 3-D point clustering. The distance between the ground truth of PTT center and the detected center is 0.72 m. In terms of runtime, since the line features are extracted in parallel threads, the execution time on TX2 will not increase much. The UAV requires 105.1 ms per image, which satisfies the inspection requirements.

(a) and (b) The 3-D line feature and semi-dense mapping result; (c) the semi-dense mapping result when the UAV hovers near the top of the pole tower; (d) the 3-D line feature and the inspection paths around the tower; (e) a map in combination with the 3-D sparse keypoints, 3-D lines, and 3-D semi-dense points; (f) an octomap 65 which is built from the 3-D semi-dense point clouds; (g) the pose estimation of the UAV cameras along CIRP, the blue rectangles denote the camera positions and orientations; (h) the pose estimation of the UAV cameras along TOLP; (i) the camera trajectory and tower location recorded by GPS system; (j) the experimental results generated from our method on the images recorded from (i). UAV: unmanned aerial vehicle; CIRP: circumvolant path; and TOLP: takeoff and land vertically path.

The three trajectories cover the two paths of CIRP and TOLP. The trajectory denoted by the dashed line is recorded by the differential GPS system. The blue trajectory is calculated from the ORB keypoint-based scheme. The red trajectory is computed from our PL-based approach. CIRP: circumvolant path; and TOLP: takeoff and land vertically path; GPS: global positioning system; PL: point–line.
Comparison of drift errors and runtime along the CIRP and TOLP.

CIRP: circumvolant path; TOLP: takeoff and land vertically path; SLAM: simultaneaous localization and mapping; PTT: power transmission tower.
Conclusion and future work
In this article, a perception approach combining PL-based visual SLAM and TD is proposed for safe and autonomous close proximity PTT inspection. The UAV takes advantage of enough perspective information provided by a monocular PTC to realize the reliable self-positioning and tower localization. All schemes are well implemented in an hierarchical embedded system. To make full use of the abundant line information in the PTT inspection environment, line extraction and matching are improved by a heuristic method, making them more suitable for tower linear structures. Besides, the intersections of lines are processed as ORB feature to increase algorithm robustness. To further improve accuracy of SLAM system, the cost function of BA optimization is proposed to combine ORB point feature with point-to-line distance and the intersections of lines. The loss function has more stable point-to-line distance constraints and more point feature reprojection errors, making the framework more robust. To construct a useful map for navigation and simultaneously consider the real-time performance, the keyframe-based semi-dense mapping algorithm is implemented. To localize tower fast and accurately in 3-D space, a DL-based neural network is customized (Tower R-CNN) to detect part of or complete transmission tower in different viewpoints. Then, the contour and line-shaped structure of PTT can be reflected in map forming a rich representation. In addition, two safe paths, which can avoid collision with transmission lines and allow the UAV’s PTC to observe the PTT, and electrical equipments, comprehensively, are proposed for refined inspection. Along the two paths, the whole perception strategy is validated in a synthetic scene. Finally, the designed inspection platform is tested in a real-world field environment, which achieves a satisfactory result.
In the future, we will investigate how to integrate a high precision inertial sensor with point and line features into the UAV system. In addition, our algorithm can be easily migrated into stereo vision inspection system to get the absolute distance information. Based on the above works, an online fault diagnose system will come true.
Footnotes
Declaration of conflicting interests
The author(s) declared no potential conflicts of interest with respect to the research, authorship, and/or publication of this article.
Funding
The author(s) disclosed receipt of the following financial support for the research, authorship, and/or publication of this article: This work was supported by the National Natural Science Foundation of China under grants 61271432, 61673378, and 61421004.
Supplemental material
Supplemental video for this article is available online.
References
Supplementary Material
Please find the following supplemental material available below.
For Open Access articles published under a Creative Commons License, all supplemental material carries the same license as the article it is associated with.
For non-Open Access articles published, all supplemental material carries a non-exclusive license, and permission requests for re-use of supplemental material or any part of supplemental material shall be sent directly to the copyright owner as specified in the copyright notice associated with the article.