
Abstract
In this article, we propose a monocular vision-based approach that can simultaneously recognize an object and estimate the distance to the target in package classification. Calibration is necessary due to lack of depth information in a single RGB image, and template matching makes it possible to estimate the distance of an irregular object without measurable parameters. First of all, capture images of the particular object as templates at set distances. Then, simplify the feature extraction to abandon the scale invariance. By exploiting a nonparametric estimation, the relationship between local feature correspondence and the similarity of two images is theoretically explored. Finally, the object will be recognized and the scale grade of it will be determined at the same time based on two-stage template matching. Experimental results have proved the high accuracy of our approach that has then been successfully applied to a real-time automatic package sorting line.
Keywords
Introduction
With the development of e-commerce and logistics industry, huge quantities of goods are packed and transported every day. Sampling inspection is a necessary and effective means to ensure the quality of products. Qualified packages must be separated from those that fail in the inspection. In addition, qualified packages need to be classified and distributed to different places according to their heights. Conventional manual sorting is too labor-consuming to deal with massive packages, and it can hardly meet the speed requirement of the sorting system. What’s more, workers are easy to get tired and make mistakes during their long-term work. Therefore, an automatic package sorting line is needed to improve work efficiency, and the design of machine vision system is the key to the success of the automatic sorting line.
In recent years, machine vision has attracted a lot of attention from numerous researchers and has achieved remarkable development. It has been widely applied in various fields, especially those with special working environments, such as underwater engineering, nuclear industry, and chemical industry where manual inspection can be too difficult or dangerous. 1 Even under normal circumstances, machine vision can be more precise and repetitive than humans in doing tedious inspection tasks. There are many successful applications of machine vision in industry and agriculture, such as surface defect detection, 2 –4 barcode detection, 5,6 and automatic fruits harvesting 7 –9 . As a noncontact measurement technology, machine vision has the advantages of low cost and high precision when compared with traditional methods of measurement. Moreover, it is also very suitable for measuring various dimensional parameters such as length, roundness, and angle. 10 –12
Unlike conventional detection and measurement tasks, what we need to accomplish this time is a comprehensive classification task. During the inspection process, a qualified package will be attached with a particular label on the surface, while an unqualified one won’t. The label is user-customized and consists of a set of Chinese characters, including the name of the quality inspection agency. We are not allowed to attach any other artificial markers or bar codes to packages, so the label is the only information that can be utilized. According to the tasks, unqualified packages must be accurately separated out from qualified ones. In addition, the classification of qualified packages is based on the package height that is related to the object-to-camera distance, so a ranging function is also required. The machine vision system is designed to achieve object recognition and distance measurement.
On the one hand, object recognition is one of the research hotspots in the field of computer vision. In recent years, various local features that form the basis of computer vision have been proposed. The Hessian detector 13 and the Harris detector 14 were proposed to detect a set of distinctive key points that can be reliably localized under viewpoint changes. Lindeberg 15 proposed a detector for searching the three-dimensional (3D) scale space extrema of the Laplacian-of-Gaussian (LoG) function to detect blob-like structures. Lowe implemented the scale space pyramid in a more efficient way using the Difference-of-Gaussian (DoG) as an approximation of the LoG and proposed the very classic SIFT. 16 Scale Invariant Feature Transform (SIFT) has proved to be a good technique in many practical applications such as object recognition, image stitching, and motion tracking. However, high-dimensional feature descriptors make it difficult to be implemented in real-time applications. The Speeded-Up Robust Features (SURF) 17 algorithm adopts box filters as an approximation of the Hessian detector and employs a precomputed integral image to compute the filtered results, which is much faster than the convolution operation. The SURF shows comparable performance and is generally three times faster in speed than SIFT. 18 Recently, the Features from Accelerated Segment Test (FAST) detector, 19 the Binary Robust Independent Elementary Features (BRIEF) descriptor, 20 and the Oriented FAST and Rotated BRIEF (ORB) feature 21 have been proposed successively, all of which show significant fast performance. But they have the shortcoming of being sensitive to noise. The development of local invariant features has profound impact on the field of computer vision, and these features make it feasible to develop effective recognition approaches, as demonstrated in a comprehensive summarization of visual object recognition. 22
On the other hand, image depth estimation has been widely studied in computer vision. Various vision-based depth sensors have been invented, and they can be classified into two categories: active depth sensors and passive ranging sensing method represented by binocular stereo vision. Active depth sensors mainly include time-of-flight (TOF), structured light, laser scanner, and so forth. However, the current depth cameras are either expensive or of poor robustness. Moreover, the results are typically much sparser than images and thus lose many detail depth variations visible in images. Binocular vision is based on the matching of feature points and is suitable for environments with ideal lighting conditions and rich features. The biggest problem with binocular cameras is that the algorithm is too complex, which often leads to unstable results. Researchers hope to recover depth information through single images, but it is a very challenging task. As far as we know, estimating depth from a single image is an ill-posed problem that cannot be solved directly due to scale uncertainty. Therefore, prior knowledge about the object has to be employed, such as typical appearance, layout, and size. It is generally believed that humans rely on the parallax of both eyes to estimate the distance, but this is only one of the reasons. Humans perform well at monocular depth estimation by exploiting cues such as perspective, scaling relative to the known size of familiar objects, appearance in the form of lighting and shading, and occlusion. 23 Several monocular vision-based ranging methods have been proposed, although they can only be used under finite conditions. Wahab et al. 24 proposed target distance estimation that used monocular vision system for mobile robot, and the target was an orange golf ball with a fixed diameter. Rahman et al. 25 introduced a single image-based person-to-camera distance measuring method. They used the variation in eye distance (in pixels) with changes in person-to-camera distance (in inches) to formulate the measuring system. Similarly, Peng et al. 26 measured the viewing distance by determining the pixel distance between binocular pupils in the image and fitting a function between the actual distance and the pixel distance of binocular pupil. Kumar et al. 27 proposed a methodology for estimating the face distance from a front camera with a back propagation neural network (BPNN), and facial features of a standard model at different depths were extracted to train the BPNN. All the above ranging methods employed measurable parameters, such as the diameter of a ball, the distance between two eyes, and facial features like face height or left eye to nose distance. In addition, they used the relationship between target distances and measured parameters, because the larger the person-to-camera distance is, the smaller the eye-distance in pixel will be, and vice versa. In recent years, many researchers have resorted to training a network, for instance, convolutional neural network (CNN) to predict the depth of each pixel in an image. 28 However, training the network requires vast quantities of ground truth depth data from an RGB-D camera or a 3D laser scanner, which makes it infeasible to general applications. The existing ranging methods are inapplicable to our task, in which the image object is a complex pattern and not easy to be measured directly in dimension. Therefore, we proposed a template matching approach to measure the object scale and determine the distance.
In this work, we built a machine vision system for package classification in an automatic sorting line and proposed a classification algorithm based on monocular camera for object recognition and distance measurement. This article is organized as follows. The first section is the introduction part, while the second section describes the detailed analysis of our tasks and composition of the machine vision system. Third section presents the principle and process of the proposed algorithm. In the fourth section, the classification approach is evaluated experimentally and its practical application is also described. Finally, conclusions of this work are given in the fifth section.
Tasks analysis and system composition
The successful design of a machine vision system benefits from detailed specification of the task to be accomplished. In the quality inspection line, a package that is checked as qualified will be attached with a particular label on the upper side, while an unqualified one won’t. The two categories of packages must be separated. In addition, those qualified ones need to be sent to different places according to their heights.
The first task is to detect whether a particular object is in the captured image, but the orientation and scale of the image object are uncertain in practical environment. Secondly, there is a dimensional difference among packages, as shown in Figure 1. We need to classify them according to their heights and distribute them to different places. The only information we can utilize is the user-customized label. As we all know, the size of an object in the image is related to the object-to-camera distance which depends on the package height, so we can judge the height of a package by measuring the size of the target in the image.

Package samples of different heights.
In conventional visual object recognition, the target is usually regular and is detected as a whole. However, packages may not be well preserved during transportation or storage. The labels on the surface might be incomplete, damaged, interfered by complex background, polluted by handwriting, or so on. Several kinds of nonideal samples are presented in Figure 2.

Nonideal package samples.
In contrast, it is much more difficult to measure the scale of the object with a single image. On the one hand, there are no obvious markers or patterns that are easy to measure, such as parallel lines, circles, and grids. On the other hand, due to possible breakage, occlusion or incompleteness of the object, it is infeasible to establish a correspondence between the test image and a template, for example, a projective transformation matrix, and then calculate the scale factor.
We adopt a monocular vision-based method to accomplish the classification tasks, and the composition of the system is illustrated in Figure 3. The proposed system based on the machine vision technology consists of an HD camera, a diffuse light source, an industrial personal computer (IPC), a programmable logic controller (PLC), and other hardware or software modules. In this system, the camera is installed right above the conveyor belt, so that it can capture a clear image that includes the whole package. Real-time video is transmitted via local area network (LAN) to the IPC where the image processing algorithm runs. Once the arrival of a package is detected, the algorithm will further analyze the image to recognize the object and measure its scale. The measuring result will be sent to the PLC that controls actuating elements. Thus, the system completes a processing cycle and then it waits for the next package.
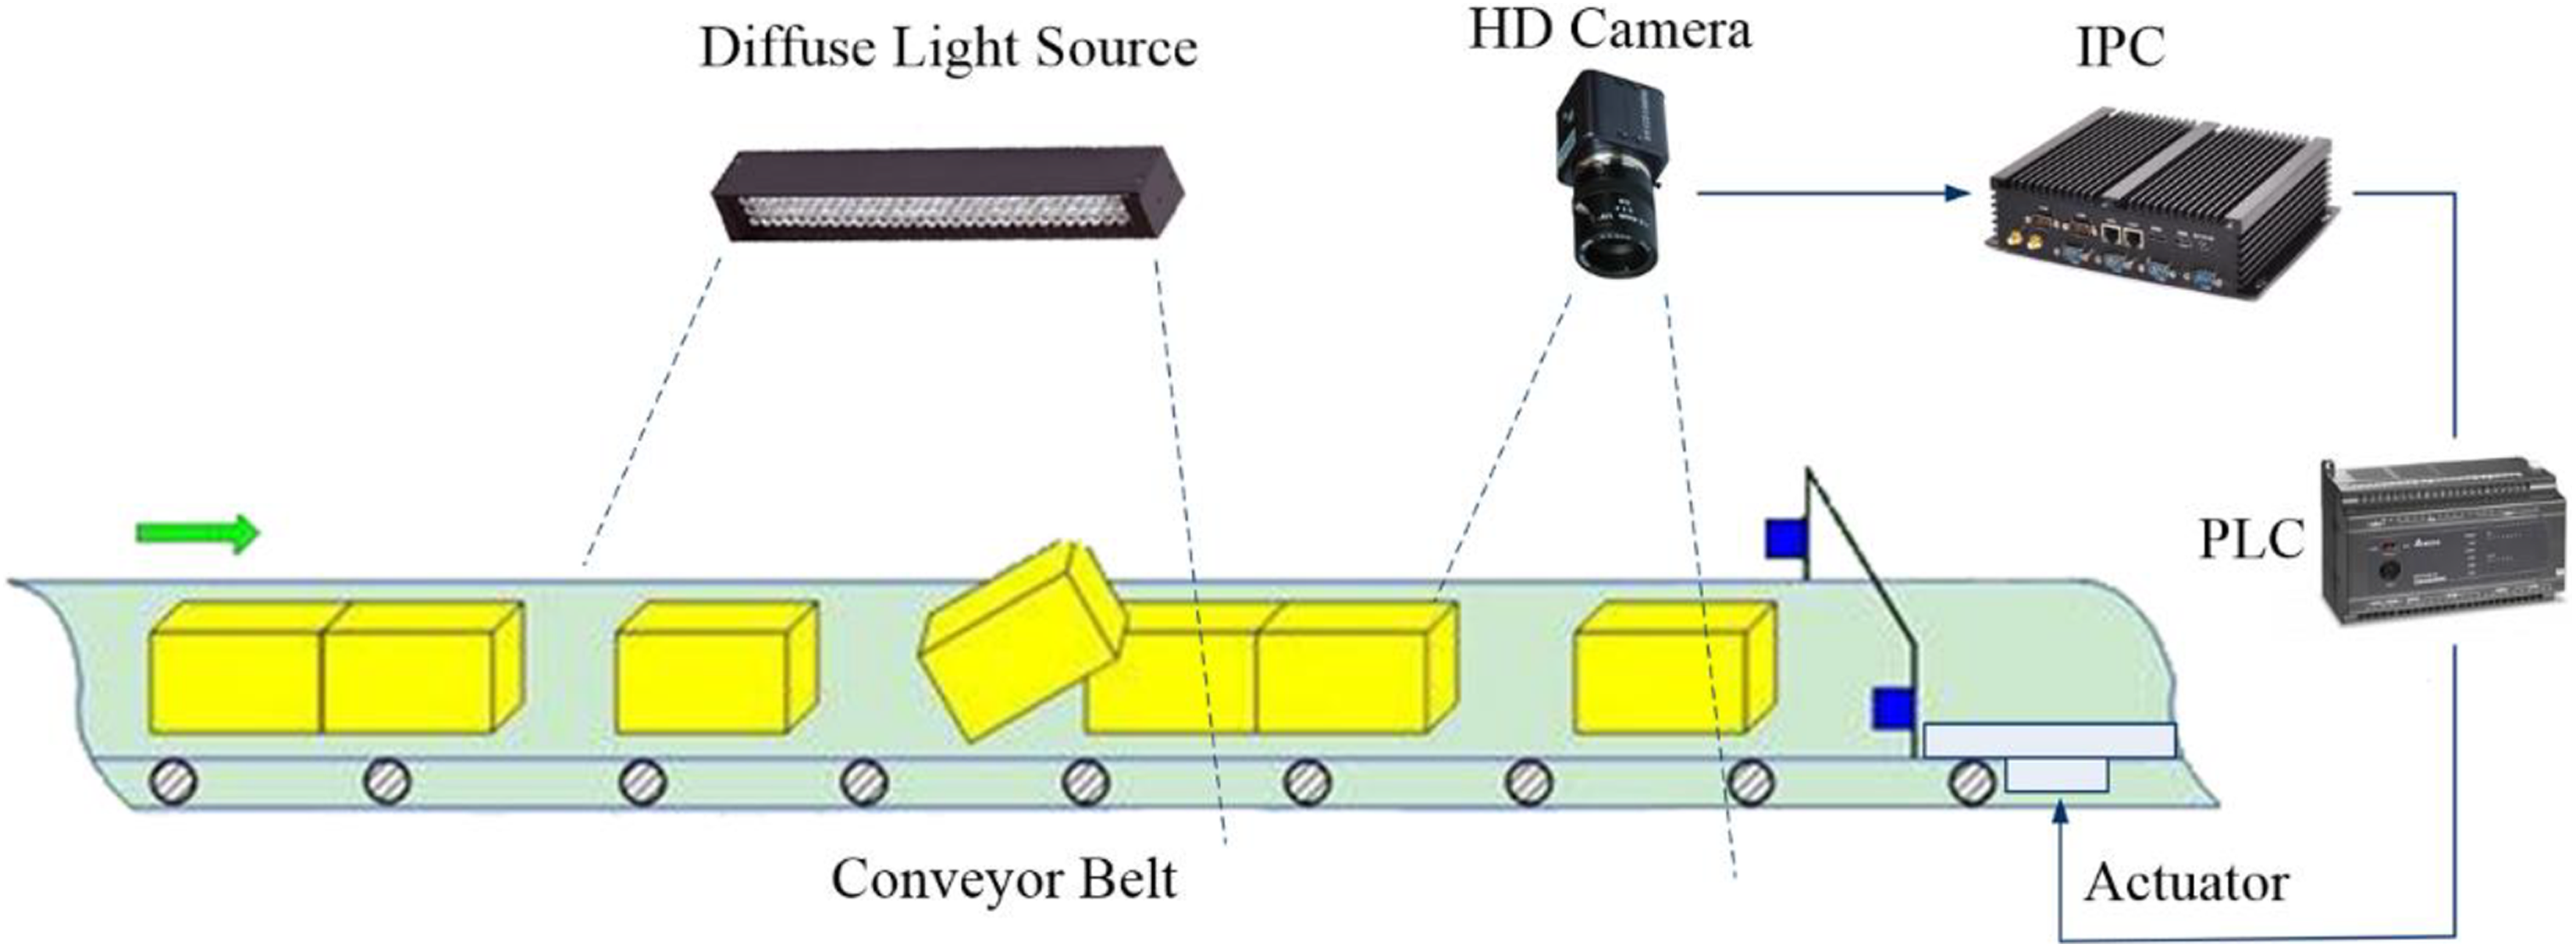
Composition of the machine vision system.
The proposed approach for object recognition and scale measurement
As analyzed in previous sections, packages are classified in the monocular machine vision system based on the two terms: the existence of the label and the scale of it in the image. As we are not allowed to use any other artificial marker, the only information we can utilize is the label. It is challenging to fulfill the tasks by relying on only one camera due to the lack of measurable parameters, especially when the object can no longer be considered as a whole.
In our approach, we construct a series of template images including four basic templates and multiple finer templates. The test image is compared with these templates to estimate its scale, and object recognition is also accomplished during the process. Construction and feature extraction of all template images are finished off-line. In the real-time measuring process, we first extract local features from a new image and compare it with those basic templates to obtain a rough scale estimation. Then, we select a set of finer templates according to the rough result and compare them with the image to obtain a precise measuring result. If the image doesn’t match any basic template in the first step, we can conclude that there is no object in the image. The process of the two-stage template matching for object recognition and scale measurement is illustrated in Figure 4.
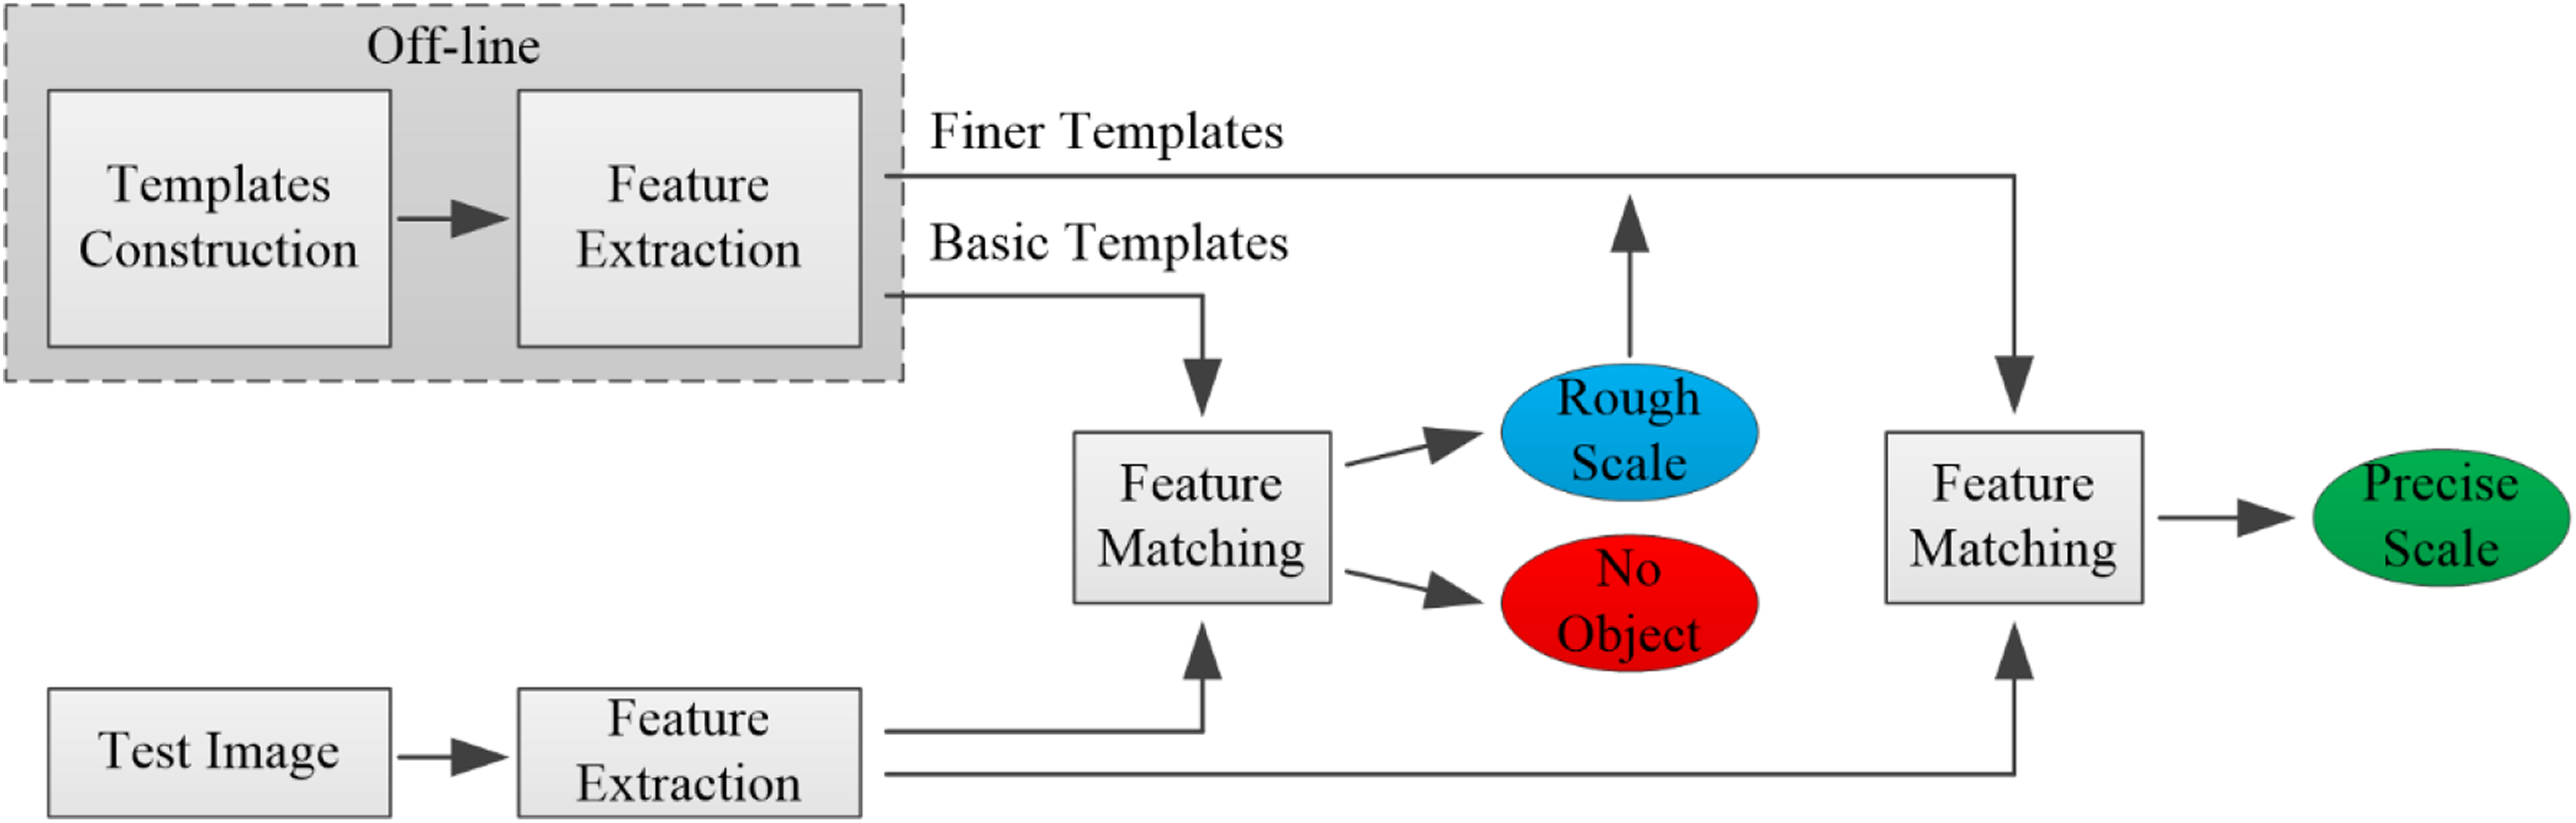
Illustration of the two-stage template matching process.
Template construction
With the camera facing the conveyor belt, once a package arrives below the camera, an image of the package will be captured. According to the optical imaging principle, the size of a particular object in the image is related to the object-to-camera distance which depends on the height (or thickness) of the package in fixed imaging conditions as shown in Figure 5. One of the system tasks is to classify qualified packages into four categories according to their heights, and it is equivalent to determine the scale grade of the object in the captured image.

Comparison of two packages of different heights and their images.
We estimate the object scale by matching the captured image with multiple templates and taking the closest template as an approximation. Calibration of templates is necessary because they are crucial to our method. We calibrated the median height of package samples for each category, and adjusted the target label to a set height to generate a template. As the template images were captured in real conditions, there might be many irrelevant contents affecting the judgment of the object. We converted the captured image into a grayscale image and manually segmented a region of interest (ROI) from it, and then put the ROI on a blank image of fixed size. Next, we filled the margin with similar gray values and blurred the region around the text to avoid introducing new edges or corners. The construction process of a template image is shown in Figure 6, and all templates were made in the same way except for the object-to-camera distance.

The construction process of a template image.
Simplified local feature extraction
It is essential to extract local features from an image during the object recognition process. The SURF algorithm is based on the Hessian matrix, and it detects interest points at locations where the determinant is maximum. The determinant of Hessian matrix is defined as follows:

where
The SURF employs a precomputed integral image and adopts box filters to obtain the filtered result, which can be much faster than the convolution operation of the Hessian detector. The box filters are shown in the second row of Figure 7, where the gray regions are equal to zero.

Left to right: the approximation of the second-order Gaussian partial derivative in (a) x-, (b) y-, and (c) xy directions, respectively.
The original SURF algorithm achieves scale invariance through scale space analysis by convolving image with a series of up-scaling box filters. However, the scale invariance will prevent us from determining the actual scale of the object. The scale space of the SURF has many octaves, with a scaling factor of 2 between adjacent ones, and each octave was subdivided into several scales. Figure 8 shows a series of box filters of different sizes and a comparison of the SURF scale space and our simplified scale space. In our method, local extreme points are searched in a fixed scale, namely the median of the three scales in the first octave.

The scale space analysis. (a) Box filters with a side length of 9, 15, and 21. (b) The SURF scale space. (c) Our simplified scale space.
As the variation of the package height is very small compared with the object-to-camera distance, the scale difference to be distinguished is minor. We abandon the scale invariance by simplifying the scale space, so that the closest template will be more distinctive than the others during the matching process. At the same time, the simplification of feature extraction can reduce the amount of calculation.
Scale estimation based on template matching
In the preceding steps, we have constructed multiple templates at calibrated distances and extracted simplified local features from images. There are no existing criteria for selecting the optimal template from several candidates, each of which includes the same object. According to the most intuitive inference, the number of matching pairs or the summation of feature distance can be regarded as an indication, but it has not been proved. Next, we will demonstrate how the local feature matching works step by step.
The Maximum-A-Posteriori (MAP) estimation is employed as it can minimize the Bayesian risk in decision. 29 As the prior distribution is uniform in each category, the MAP estimation reduces to the maximum-likelihood estimation (MLE).

where

By taking the log probability of the decision rule, we obtain

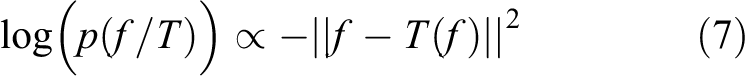
The aforementioned MAP Naive-Bayes decision requires computing probability density of each feature on a template. Here we adopt the Parzen window method, 29 a nonparametric way to estimate the probability density of a feature f on a template image T:

where K is a kernel function, which is non-negative and integrates to one, w is the width of window,

As we know, as a result of the high dimension of feature descriptor, the distance from a feature to a common one is very large compared with that of its nearest matching point. Most of the terms in the summation of equation (5) are negligible because they exponentially decrease with feature distance. The k-nearest neighbors of the feature can be employed as an approximation of the estimator. Boiman et al. 30 have proved that the difference is very small when changing the number of nearest neighbors, and one-nearest neighbor approximation preserves well the discriminative power. Then we can obtain the log function of it in a simple form as follows
The term

Finally, we can determine the scale of an image

where
Another important issue we need to consider is mismatching which is inevitable when matching two images. The ratio of the distance to the closest neighbor to that of the second-closest one is used as a decision criterion to strengthen confidence of the matching results; 0.8 is set as the threshold, as suggested in the study by Lowe. 16 If the ratio is larger than the threshold, this match will be considered unreliable and rejected.
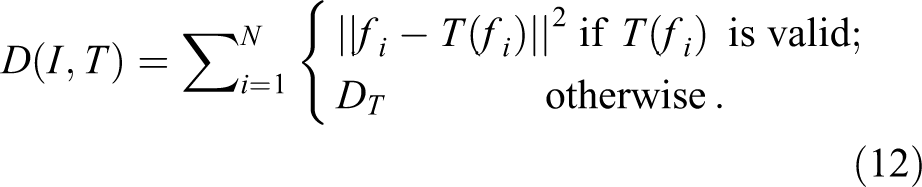
In equation (9), the result is not dominated by correct matching, because the distance between a wrong matching pair is always larger than a right one. However, it is unreasonable to eliminate those mismatched terms, in that case, the more mismatches there are, the smaller the sum of distance will be. So we made a revision of it by replacing the distance of invalid matching feature pairs with a fixed value DT which is twice the average of the distances of all valid matching feature pairs


The algorithm can be summarized as follows: Given a test image, we firstly extract all of its local features, then establish a correspondence between it with all template images, and finally determine the optimal scale based on the minimum of feature distance summation: In addition, if there are not enough valid matched points from any template, we can conclude that the package in the image is unlabeled.
Despite the fact that scale invariance is removed from the original feature, the improved feature is still able to allow a certain degree of variation across nearby scale in the matching stage. In addition, the templates are more or less similar to each other, and the scale difference is not significant. Therefore, some feature points in the test image may be matched to multiple candidates in different templates. We put the four basic templates together, and matched the test image with each of them without being interfered by other templates for comparison, as shown in Figure 9.

Valid feature pairs between the test image and the four basic templates.
Two-stage template matching
Scale estimation can be realized theoretically through the above steps, but the classification results are not accurate enough, especially when the test image is not clearly close to any template. Unlike conventional classification tasks, the object scale is a continuous value, and the boundaries between categories are not obvious. Because of the quantization error, it is easy to produce misclassification by merely comparing the test image with the four basic templates. Therefore, we constructed more templates and proposed a two-stage template matching to improve the accuracy of scale measurement.
We divided the difference between the heights of two adjacent basic templates into five equal parts to interpolate four new heights and then constructed a set of finer templates through the method described above. Similar to the centimeter and millimeter tick marks on a ruler, the four basic templates and three sets of finer templates are distributed on a scale axis, as shown in Figure 10, where Ti
represents a basic template, and

The basic templates and a set of finer templates in the scale axis.
Through the first matching process, we have determined two closest basic templates. Next, we compared the test image with four finer templates that were between the two basic templates. Normally, the selected finer templates were very close to the test image in scale, so more valid feature pairs could be found during the second matching process, as shown in Figure 11.

Valid feature pairs between the test image and a set of finer templates.
To enhance the robustness of the method, we determined the final scale of the object by combining the results of the two matching processes instead of taking that of the closest finer template. For instance, assuring that we have already determined that T
3 andT
4 are the two closest templates in the first matching step, and then we should compare
where N is the number of features of image I, and all variables are consistent with section “Scale estimation based on template matching.”
The two-stage template matching process is proposed as an improvement of the original one-stage method. We can estimate the scale of the target more accurately, and the calculation amount is only twice that of the rough matching process. The algorithm can be extended to more sophisticated models to improve accuracy, for example, three-stage matching or inserting more templates.
Experiments and results
System configurations
As a supplement of the system description in the section “Tasks analysis and system composition,” the specific configurations of the machine vision system are described here. In the sorting line, packages are conveyed by a conveyor belt with a width of 900 mm and a maximum moving speed of 550 mm/s. The image acquisition system is installed right above the conveyor, as shown in Figure 12(a), and the distance from the camera to the conveyor belt is 1600 mm. The camera outputs high-definition real-time video with a pixel resolution of 1280 × 720 and 25 frames per second.

Part of the system configurations. (a) Image acquisition device and the conveyor belt. (b) The control unit. (c) The GUI of the detection program. (d) The pneumatic actuator. GUI: graphical user interface.
The control unit of the system where the PLC modules and the IPC are installed inside is shown in Figure 12(b). The proposed algorithm is implemented in C++ and runs on the IPC which has an Intel Core i3 CPU with 4 GB RAM. The graphical user interface (GUI) presents the parameter settings and the inspection results of the detection program, as shown in Figure 12(c). The actuator of the system is a pneumatic pusher as shown in Figure 12(d). Once the detection is finished, the package will be sent to a proper slideway by adjusting the stroke of cylinder push rod.
Evaluation of the classification performance
In this section, a set of experiments was conducted to evaluate the performance of the proposed algorithm. The tasks of object recognition and scale measurement were regarded as a five-category classification problem and were accomplished directly by the proposed method.
During the experiment, 500 samples were captured as test images, and each category had 100 samples. The height of packages ranges from <10 mm to >600 mm. Samples of each category are shown in Figure 13. To evaluate the recognition, we employ two widely used criteria, precision, and recall rate. Here, the precision rate and the recall rate are defined as follows


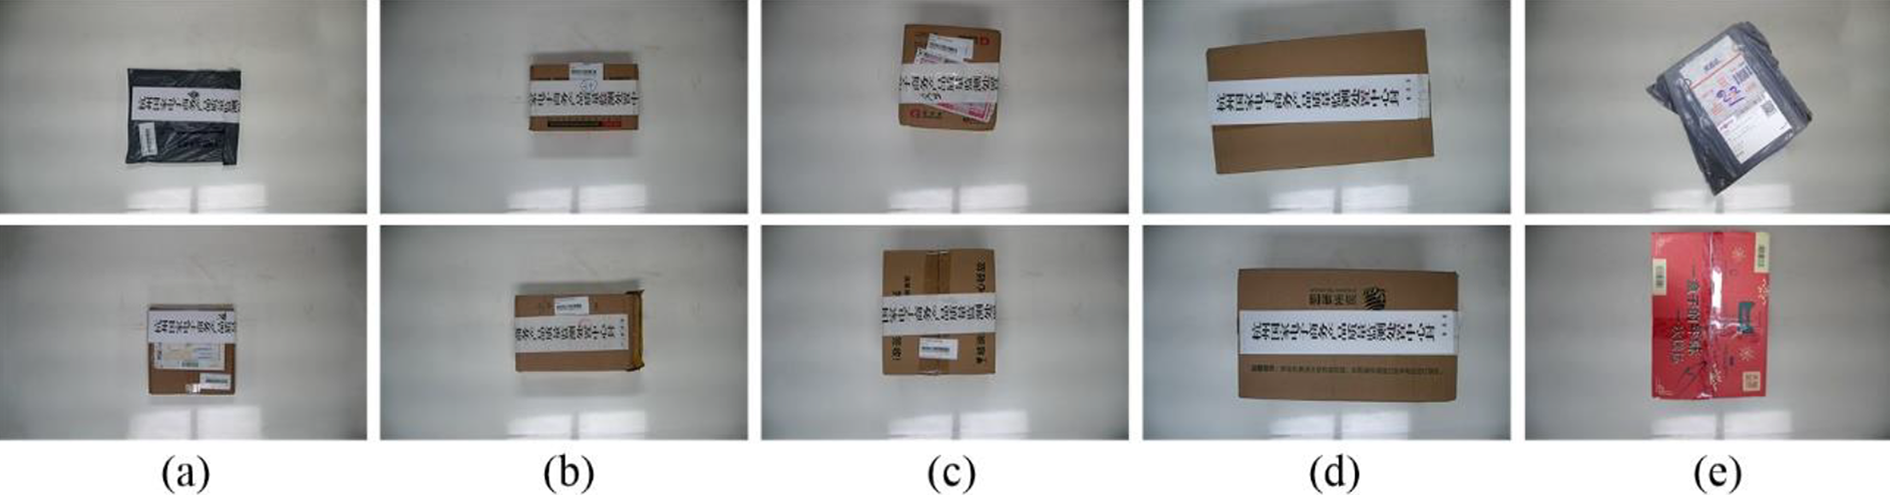
(a) to (d) The target scale in the images is 1–4, respectively. (e) Unlabeled samples.
The classification results for all 500 samples are shown in Table 1, where the numbers of correctly classified samples in all categories are listed on the diagonal of confusion matrix.
Classification results of the 500 samples.

Boldface values are the numbers of correctly classified samples.
For the object recognition task, the recall rate is 98.25, and the precision rate is 100%, no unlabeled samples are mistaken for labeled ones. The sorting system allows a certain degree of missing detection rate, because qualified packages will be checked again if they are detected without the target, while the misjudgment of unqualified packages will result in product quality problems. Therefore, cost of the two cases is different, and the experimental results show that our approach meets the requirements of object recognition.
In addition, for the scale estimation task, the average classification accuracy is about 95.4%. Note that only the first four classes are considered, and samples that are detected without the label have been excluded. From the confusion matrix, we can observe that misclassification occurs between adjacent scales. Due to the quantization error, it is difficult to judge the true scale of an object in the case that it falls right on the boundary between two scale classes.
Application in the real-time sorting line
The experimental results demonstrated the high accuracy of the approach, and we have implemented it to the real-time system. It was not necessary to classify every frame of the video sequence. Only one image of the target would be processed by our algorithm for each package.
We made a simple analysis of each frame to judge the arrival of a package based on the brightness of a column of pixels, as shown in Figure 14(a). Note that we have drawn two lines here for comparison, but in practice only one column of pixels would be used. As the surface of the conveyor belt is white and bright, almost all pixels in the green column have gray values higher than 100, as shown in Figure 14(b). When a package arrives at the set position, some of the pixels become darker, as shown in Figure 14(c), which represents the grayscale histogram of pixels on the red column. Therefore, the existence of a package can be judged by setting a threshold and computing the proportion of pixels those have lower gray values than the threshold. This simple judgment works in most cases expect when the package is completely bright and unlabeled but that won’t bring additional risks.

(a) Pixels are sampled from the set positions. (b) Grayscale histogram of pixels in the green column. (c) Grayscale histogram of pixels in the red column.
Once a newly arrived package is detected, the frame will be further processed for object recognition and scale estimation. Part of the calculation can be finished off-line to shorten the processing period, including construction and feature extraction of template images. In each online cycle, feature extraction from the test image and the matching process are the two operations that consume most of the time. The classification of a sample is finished within an average processing time of 100 ms, and the next package is far from arriving. Therefore, our algorithm completely satisfies the real-time requirement of the system.
The system was designed to work 24/7, and we have run it for 3 days without interruption. Tens of thousands of packages have been tested, and the average classification error rate was lower than 5%. The long-running test demonstrated that the proposed method was practicable. Compared with traditional manual sorting, the automatic classifying system was several times faster, and it significantly improved the operating efficiency of the system.
Analysis of traditional methods
As a comparison, we also tried a traditional approach to accomplish distance estimation from a single image. As far as we know, recovering depth information directly from a single image is an ill-posed problem, and prior knowledge about the particular object must be used, such as the special shape or the size of it.
In the package classification task, we observed that the width of the label, namely the distance between the two parallel longer edges of the label, was a measurable dimensional parameter. Then we established a relationship between the object-to-camera distance and the width of the label. Thus, we could calculate the depth of the object in the image, as long as the width of the label was measured. However, we found it difficult to extract the two expected edges due to background interferences, as shown in Figure 15. Although edges could be selected according to color or texture feature or a combination of multiple types of features, it would greatly reduce the robustness of the algorithm.

The first row: the green lines are the expected parallel edges. The second row: the red lines are the detected edges.
To eliminate interferences caused by the background, the region of the object must be segmented before measuring the width of the label. Nevertheless, the method will fail if it meets a nonideal sample like those in Figure 2. Therefore, traditional methods require some artificial markers that are easy to identify and measure. In contrast, our method treats the object as a group of local feature points, which can effectively deal with nonideal samples.
Conclusions
This article introduces an approach of irregular object recognition and distance measurement based on monocular machine vision. The method simplified the SURF scale space to abandon the scale invariance and adopted multiple templates to detect the image object and determining its scale. The principle of scale measurement is based on the MAP estimation and Naive-Bayes assumption, and the closest template is selected by matching all local features of the test image with each template and computing the distances between the image and the templates. In addition, the two-stage matching was proposed to reduce the scale quantization error.
The proposed approach has several advantages. The simplified feature is efficient for extraction and comparison and part of the calculation can be done off-line. Besides, multiple basic and finer templates make are helpful to distinguish the precise scale of the object. More importantly, the usage of local features makes it possible to measure the scale of irregular objects that do not have measurable parameters, especially those nonideal samples.
Experimental results showed high accuracy of the method, which proved the feasibility of measuring the distance with a monocular camera. Our approach has been successfully applied to the real-time classification system and has greatly improved the working efficiency of the automatic sorting line.
As a result of the classification tasks, only discrete estimates are given in this work. In the future, we will interpolate the template matching results to obtain continuous distance measurement results and extend this method to more general applications.
Footnotes
Declaration of conflicting interests
The author(s) declared no potential conflicts of interest with respect to the research, authorship, and/or publication of this article.
Funding
The author(s) disclosed receipt of the following financial support for the research, authorship, and/or publication of this article: This work is supported by the Science Fund for Creative Research Groups of National Natural Science Foundation of China (no. 51521064).