
Abstract
Boundary separation of operational regions would be helpful for unmanned surface vehicles deployed in dynamic outdoor environments. However, the feasibility and accuracy of current obstacle avoidance methods based on conventional optical images are comparatively poor for unmanned surface vehicle applications, with complicated natural illumination as one of the main sources of error. In this article, a new optical waterline detection method is proposed by combining shadow verification and global optimization (energy minimization). The method is then validated using an actual unmanned surface vehicle operating in outdoor environments. First, the basic principles of intrinsic image are introduced and then employed to evaluate the threshold for background segmentation so that the influence of complicated intensity distribution on the original image is reduced. The properties of different types of shadows are compared, and the basic principles of shadow verification are used to classify the different object regions. Subsequently, the intensity contrast between the shadow and non-shadow regions is used to measure the waterline position based on the relationship between the illumination and the shadow formation. Furthermore, the waterline detection problem is transformed into a problem involving the optimization of energy (minimization) described using differential equations. Finally, experiments are conducted with a series of practical images captured by the unmanned surface vehicle. The experimental results demonstrate the feasibility and robustness of the proposed method.
Keywords
Introduction
Boundary detection of the sailing region for unmanned surface vehicles (USVs) would facilitate automatic navigation and obstacle avoidance. However, it is difficult for current optical image–based automation methods to provide autonomous and accurate feedback on the position of the waterline to USVs when they traverse complicated outdoor areas. 1 –3 This is largely because of the inability of the methods to rapidly and precisely detect the waterline of the sailing area in various complex environments. 4
To detect the waterline, laser range finders are one of the most widely used instruments those emit a laser beam to the bank, receive the reflected laser beam, and calculate the position of the waterline based on the determination time from transmitting to receiving. Laser range finders have lightweight and small volume; their operation is fast and accurate. However, their measurement data are sparse and the measurement distance is limit. Besides, they are expensive. Compared to laser ranger finders, optical sensors have some marvelous advantages, such as direct and real-time imaging capability, easy to understand, and cheap. First, the basic principles of coastline detection based on images captured using a synthetic aperture radar (SAR), which is typically mounted on an aircraft or spacecraft, 5 –9 are explained for the waterline detection of USVs, because the waterline and the coastline exhibit similar characteristics in terms of the shape, position, and intensity. These methods are widely used in marine geology because the field of view of the SAR system is considerable, and images can be captured day or night, even in stormy weather and through clouds. However, the resolution of SAR is relatively low. Thus, the SAR equipped on a USV system is unsuitable for precise modeling at short ranges. Second, horizon extraction methods based on imaging sensors, such as cameras, are used for range-based vision for navigation and pose estimation, 10 –12 such as separation, and the sky regions and non-sky regions for micro air vehicles and unmanned aerial vehicles. However, it is not enough to use vision-based techniques applied to horizon extraction for the navigation and obstacle avoidance of USVs. This is because the horizon is considered as a line with the high likelihood of separating the ground from the sky, rather than separating the ground from the water, which acts as a reflector, and thus depends on the proximity of the vehicles to the shorelines and the illumination conditions to create different scenarios for segmentation in terms of textures or object sizes, 13 –19 especially when the illumination is bad and large regions of shadows of the shore scenes distribute on the optical image, it is difficult to precisely segment the waterline because shadows can influence both the pixel intensity and the textures.
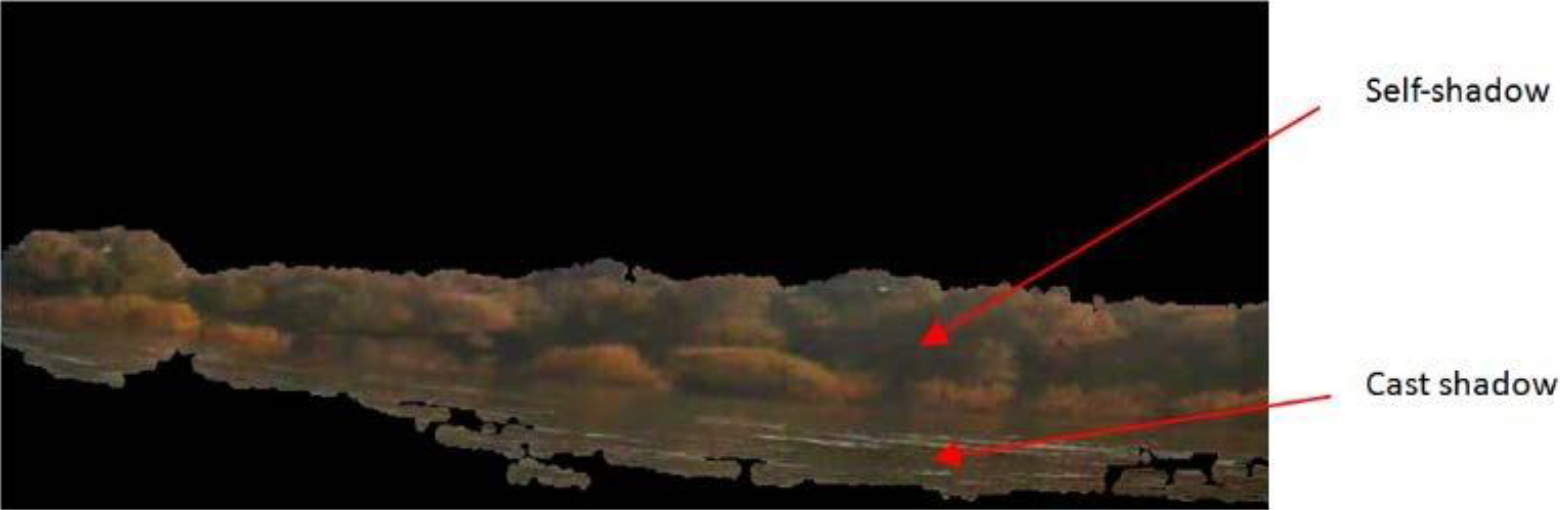
In an outdoor setting, light sources can be divided into two types: direct sunlight and diffuse skylight. Shadows are formed when direct light is partially or completely blocked. Shadows can be classified into self-shadow, which is the part of a subject that is not illuminated by direct light, and cast shadow, formed by the projection of a subject onto other surfaces. When direct light is completely blocked, the cast shadow is termed as the umbra shadow, whereas the cast shadow is termed as the penumbra shadow when direct light is only partially blocked. The illumination on non-shadow region is daylight (direct sunlight and diffused skylight), on penumbra is skylight and part of sunlight, and on umbra is only skylight. Since skylight is a component of daylight, pixel intensity in shadow must be lower than that in non-shadow background. Due to this property, shadows bring some undesired problems to threshold-based segmentation and detection.
In this article, an optical waterline detection method is proposed combining shadow verification and energy minimization to realize automatic navigation and obstacle avoidance for USVs. Unlike the existing waterline detection methods used in USVs, the proposed method is novel in that the analysis is conducted considering the illumination properties of near-range images captured by the USV, and the intensity distribution resulting from different types of shadows is used to measure the waterlines, rather than removing the shadow as observed in conventional edge detection methods. First, the proposed method uses an intrinsic grayscale image to evaluate the segmental threshold of background segmentation, including the sky and water surface. Subsequently, the proposed method is used to evaluate the waterline information of the dynamic image sequence with mathematical energy minimization using differential equations when the USV is operating in an outdoor environment. In the proposed detection method, different types of shadows are employed, and the intensity contrast between the shadow and non-shadow regions and the energy required to separate the different regions are considered. The proposed method is more robust and practical compared to the conventional boundary line methods based on image intensity or structures. Furthermore, the proposed method considers all types of shadows resulting from different capture times and positions in the outdoor environment. The proposed method can be potentially used for practical applications in USVs.
The remainder of this article is organized as follows. The second section introduces the basic principles of intrinsic image transformation from a single image containing shadows. The third section presents the proposed position measurement and waterline detection algorithm, which are based on shadow verification and energy minimization with respect to optical images. The fourth section presents the experimental results of the proposed method. The fifth section presents the conclusions.
Intrinsic image principle
For an outdoor image captured by USVs, except for the object regions where the waterline may exist, the background areas including the sky area and some water areas will increase the computing burden of the proposed waterline detection method. To segment the background areas precisely, in this article, an intrinsic image is introduced to transform an red-green-blue (RGB) image into a gray image. The principle of the intrinsic image transformation is introduced in the following.
First, according to the linear model inside and outside the shadows in the study by Tian et al., 20 the pixel intensity in a non-shadow area is

where tH represents the pixel intensity in the shadow area; H represents the channel of an RGB image, in the shadow area, H can be replaced by r, g, or b, and in the non-shadow area, it can be replaced by R, G, or B; αH and βH represent the parameters of the linear relationship and the value of them is related to the spectral power distribution.
We can write equation (1) as

By taking logarithms of both sides of equation (2) and separating the RGB channels, we can arrive to

Then, we can conclude

where

From equation (4), we could find that the pixel intensities in the shadow and non-shadow regions are equal if we subtract the pixel intensities in R, G, and B channel with β 1 /(1 − α 1), β 2 /(1 − α 2), and β 3 /(1 − α 3), respectively, and take logarithms. That means the intensity difference between a shadow region and a non-shadow region could be eliminated in an intrinsic image; therefore, with the help of this intrinsic transformation, the influence of shadows in the background segmentation could be reduced. Furthermore, the logarithmic computation could compress the dynamic intensity range and overcome the problem of over-segmentation of the background area.
Waterline detection based on shadow verification
The algorithm employed in the proposed method can be divided into two steps: image preprocessing and waterline detection. We explain these procedures and their relationships in detail in the following sections.
Image preprocessing
Intrinsic transformation
To improve the precision and reduce the running time of the proposed waterline detection method, it is reasonable to remove the background area, such as the sky. Due to intensity variation resulted from different shadows, we conduct the intrinsic transformation before background segmentation.
Here, we use equation (4) to transform the original image into an intrinsic image. Figure 2 shows the intrinsic image of the original image shown in Figure 1. Here, we choose β 1 ≈ 25, β 2 ≈ 15, and β 3 ≈ 8; α 1 ≈ 2.2, α 2 ≈ 2.0, and α 3 ≈ 1.7 according to the parameter calculation process in the study by Tian et al. 20 Therefore, β 1 /(1 − α 1) ≈ −20, β 2 /(1 − α 2) ≈ −15, β 3 /(1−α 3) ≈ −11, and η ≈ 2. Equation (4) could be rewritten as


Original RGB image full of different types of dark shadows.

The image after the intrinsic transformation of Figure 1.
From equation (5), we could find that both in the shadow regions and the non-shadow regions, the pixel intensities of the intrinsic image are mainly determined by the intensity ratios of the R channel to the B channel and the G channel to the B channel. The regions whose color is close to red or green will become bright, while the regions with color close to blue will become dark in the intrinsic image; therefore, the intrinsic transformation is appropriate for separation of the sky area and the bright water area. Besides, due to the logarithm calculation, the little color difference among the trees has been eliminated; therefore, the problems resulted from uneven intensity distribution will be alleviated, and the accuracy of the background segmentation in the following step will be improved.
Background segmentation
To evaluate the segmentation threshold, we first generated a histogram for the intrinsic image, shown in Figure 2, and analyzed its intensity property considering that the intensity distribution of the intrinsic image is uniform. Figure 3 shows the histogram of the intrinsic image. The horizontal axis represents the intensity varying from 0 to 255; and the vertical axis represents the intensity in terms of pixels. In Figure 3, there are two peaks in the range 0–255 and an evident gap between the peaks. The gap represents the threshold range from which a threshold can be chosen to divide the original image into two subareas, as shown in Figure 4. In practice, the segmentation threshold can be automatically chosen through the trough detection method from the histogram curve, as shown in Figure 3, in which there is a triangle on the curve.

Histogram of the intrinsic image in Figure 2.
Waterline detection with shadow verification and mathematical optimization
In Figure 4, we could find that self-shadows and cast shadows are distributed in the result image after preprocessing. The self-shadows are largely part of the trees those are not illuminated by direct light, and the cast shadows on the water surface are projection of the trees on the water bank; the upper half of the boundary line of the cast shadow represents the waterline position. However, it is difficult to detect the waterline using intensity or texture analysis, because its sides have similar characteristics as follows.
The self-shadow is distributed nonuniformly in the region above the waterline, which is denoted as Ru in this article. Apart from a few small areas with self-shadows, most of the area denoted by Ru does not contain shadows and correspond to images of the scenes on the water bank.
The cast shadow, including penumbra and umbra, is formed entirely from the projection of the scenes on the water surface, and the region below the waterline, termed Rd , contains only cast shadows.
As shown in the study by Xu et al. for an RGB image, 15 the pixel intensity of the non-shadow region is higher than that of the shadow region. In the following, a waterline detection method is proposed to separate Rd and Ru on the basis of the difference in the theoretical pixel intensity between the shadow and the non-shadow regions.
First, according to the shadow verification principles in the study by Tian et al., 20 a real shadow region can be judged by
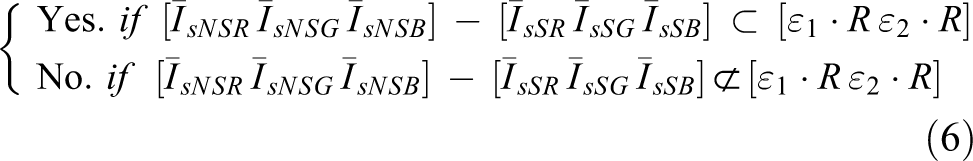
where [IsR IsG IsB ] represents the vector of a pixel intensity in Is , [IsNSR IsNSG IsNSB ] represents the pixel intensity vector in the non-shadow region, [IsSR IsSG IsSB ] represents the pixel intensity vector in the shadow region, R = [(β 1 − 1)·r + α 1, (β 2 − 1)·g + α 2, (β 3 − 1)·b + α 3], and ε 1 and ε 2 represent the empirical coefficients.
From equation (6), we could find that there is an intensity difference between a shadow region and a corresponding non-shadow region. Based on equation (6) and the intensity property of shadow regions, it is clear that the average intensity of Ru is greater than that of Rd , and when the average intensity difference between them is maximal, the separation line between Ru and Rd is the desired waterline. The measurement process of the optimal position where the intensity difference of both sides is maximal can be theoretically expressed with the cost energy.
In practice, it is reasonable to assume that the waterline could be approximated by a straight line. Then, based on the previous theoretical analysis, the waterline detection in this article can be realized by the mathematical model of the cost energy

where Is (x, y) represents the intensity value of the pixel (x, y) in the segmented image, a and b represent the parameters of the straight waterline y = ax + b, and c 1 and c 2 represent the average intensity of the regions on two sides of the waterline.
For simplification, introducing function H to replace the judging condition in equation (7)

Then equation (7) becomes

When E is equal to the minimum, the following requirements should be fulfilled

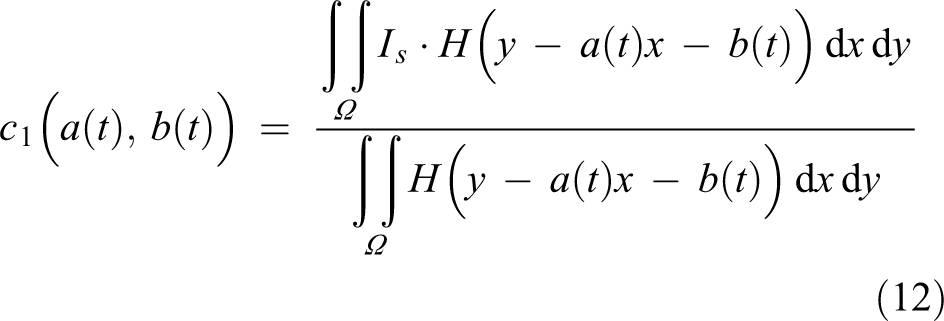
Introducing a mute variable t, a(t) and b(t) are both varying with t. Then, combining equations (9) and (10), the following equations can be obtained
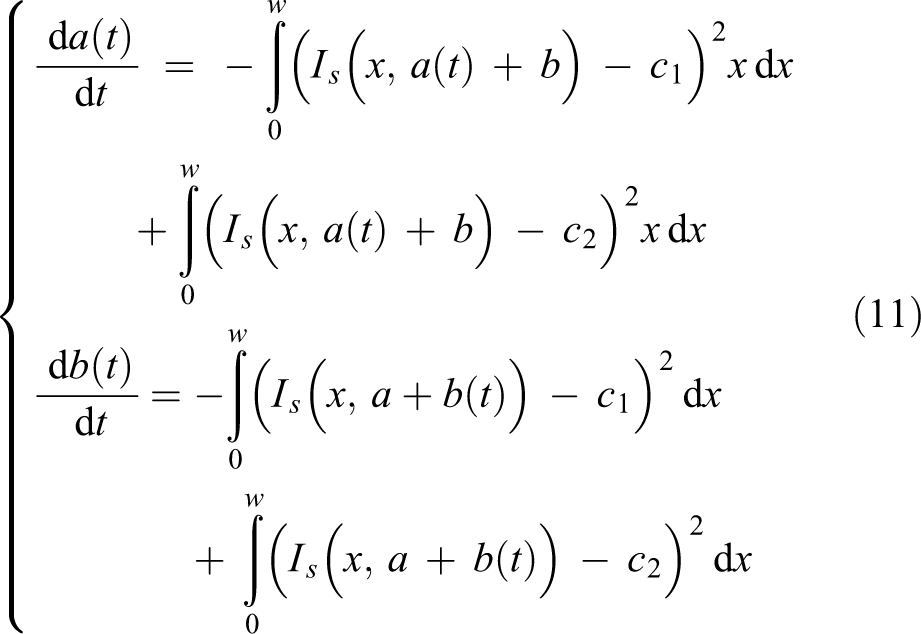
where w represents the width of I, c 1 and c 2 can be denoted as
If T > 0,
Therefore, the straight line at time T is the detected waterline

In order to solve the waterline detection problem, it is necessary to introduce an iteration algorithm, which can start from the initial separation line y = a 0 x + b 0 until the cost energy in equation (9) is less than the threshold value.
Following are the steps involved in the waterline detection algorithm, obtained by combining the supplements outlined earlier: initializing the optimization parameters, including the optimization threshold ε and the iteration steps of a and b, denoted by at
and bt
, respectively; transforming input colorful image I into a gray intrinsic image using equation (4); segmenting the background region using an adaptive segmentation threshold from the histogram analysis; initializing the waterline with a straight line L
0 = a
0
x + b
0; computing equation (9). If

The flow diagram of our algorithm is shown in Figure 5.

The flow diagram of our method.
Experimental results
In our operation test experiments, the video images captured from a forward facing camera onboard an actual USV system operating on an outdoor water surface, shown in Figure 6, and the VS250DH camera is from the MicroVision Company (Redmond, Washington, USA). A series of optical images have been taken from the onboarded camera at different time of days under different conditions, and the proposed method is then used to measure and detect the waterlines in these optical images. The parameters of our USV system and the vision sensor used on this USV system are listed in Tables 1 and 2, respectively.

The USV system in our experiments. USV: unmanned surface vehicle.
Parameters of the USV in our experiment.
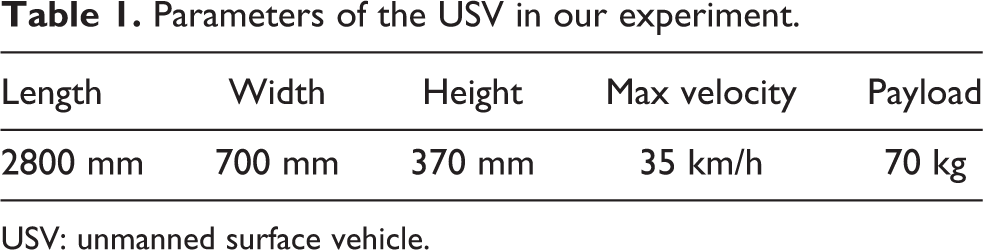
USV: unmanned surface vehicle.
Specification of vision sensor (VS250DH).

Experiment under different conditions
In this section, the waterlines of three groups of optical images captured under different conditions were detected with our method to verify the precision and robustness of our method.
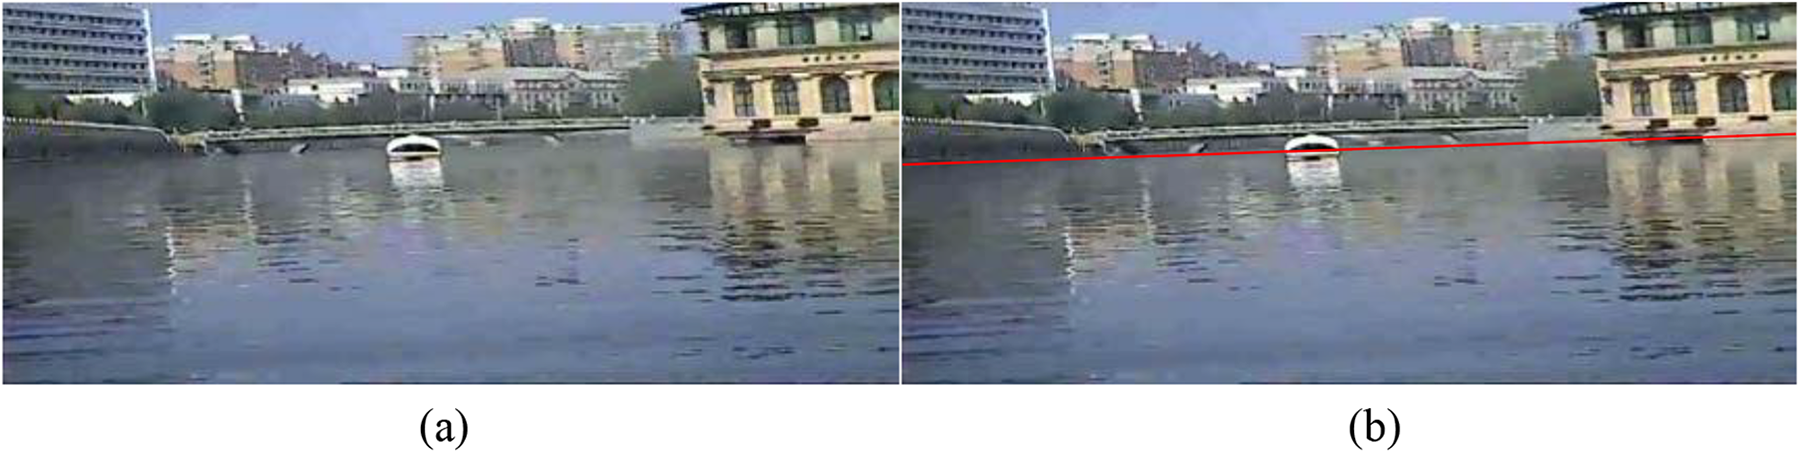
In experiment I, we used the optical images those were captured at different time of a day when the USV was operating in a natural lake outside the city. Figures 7(a), 8(a), and 9(a) are the original images captured by our USV, and Figures 7(b), 8(b), and 9(b) are the detection results obtained with our waterline detection method. Figure 7(a) shows an image captured near sunset; therefore, almost all the sunlight is blocked by the scenes on the water bank, and the illumination is so bad that the entire image is very dark. In Figure 8(a), the diffused sunlight is uniformly distributed on the image, and the color of the image is influenced by the faint halos, especially in the area near the sun. Furthermore, there is a large area of dark shadow on the water surface, and the self-shadow of the tree leaves is also very heavy. In addition, the color of the trees and cast shadow projected onto the water surface is too dark to separate them with the naked eyes. In Figure 9(a), there is a boat on the surface. From Figures 7(b), 8(b), and 9(b), we can conclude that the detection result is not influenced by the dark shadows or the faint halos in the original images; even the color of the water area is highly influenced by the light reflection.
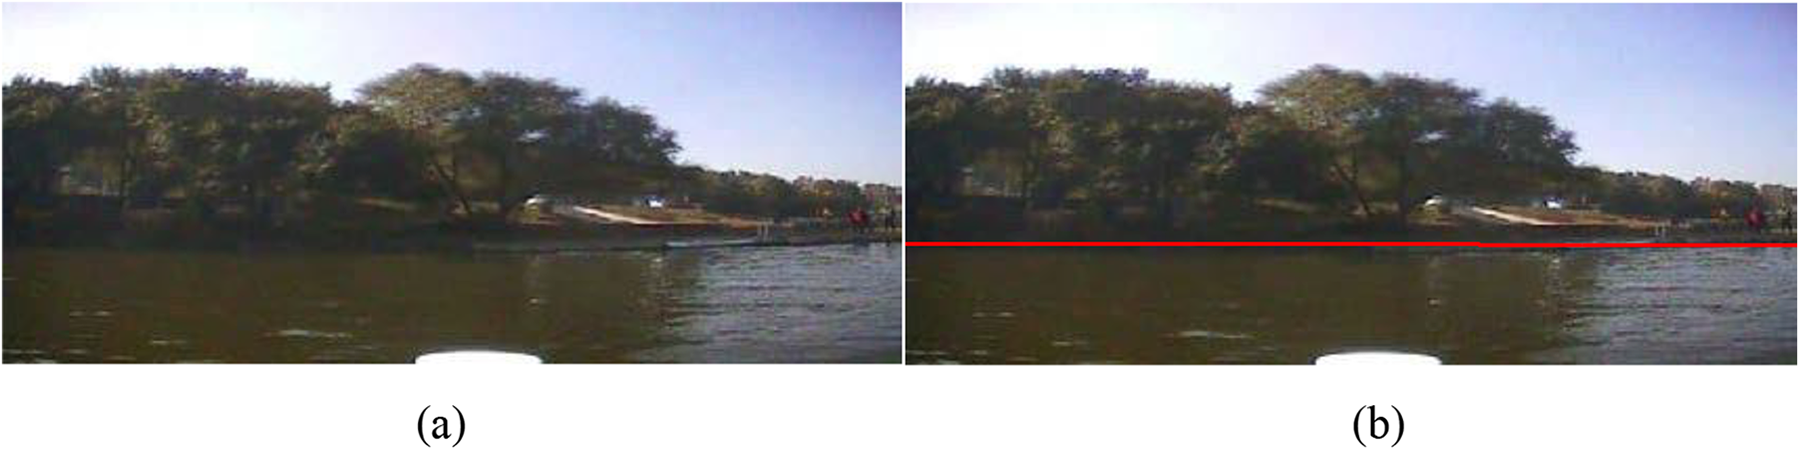
Waterline detection for image captured near sunset. (a) The original image captured near sunset and (b) The image after waterline detection.
Waterline detection for image captured at earlier time of a day than that of Figure 7(a). (a) The original image before waterline detection and (b) The image after waterline detection.

Waterline detection result for cast shadow colors close to colors of the cast objects on the bank. (a) The original image before waterline detection and (b) The image after waterline detection.
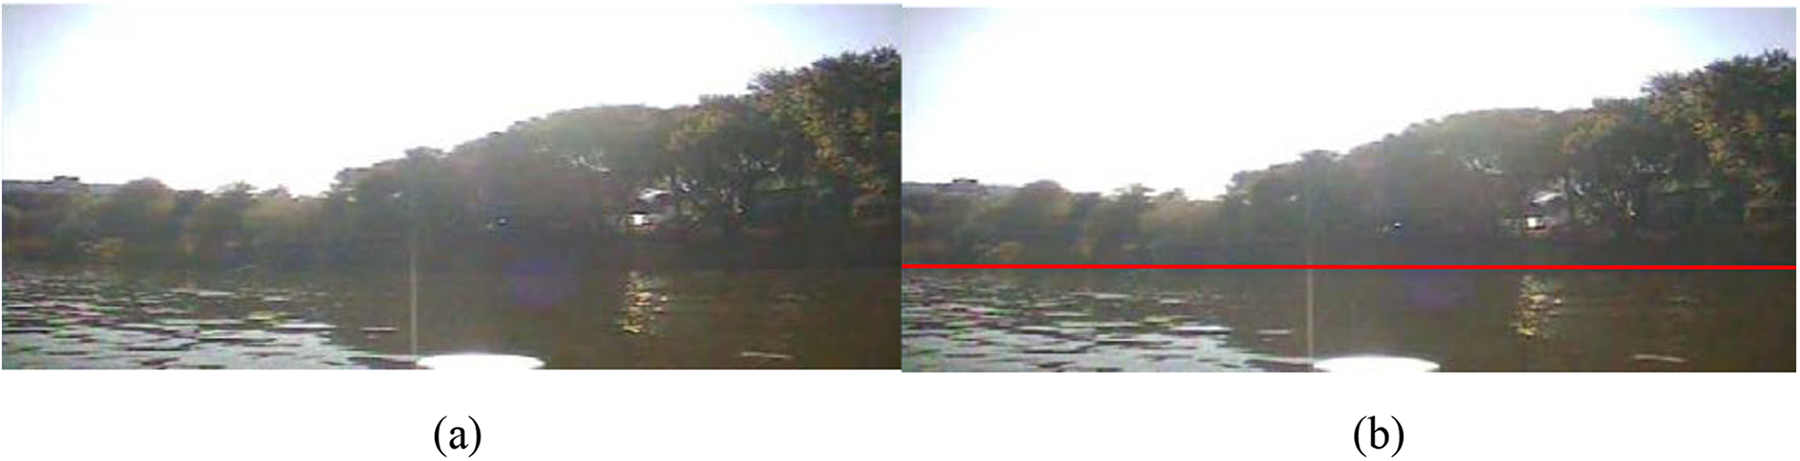
In experiment II, we used the optical images those were captured at different time of a day when the USV was operating in a man-made lake in a park where the background is more complex than that of experiment I. Figures 10(a), 11(a), and 12(a) are the original images captured by our USV, and Figures 10(b), 11(b), and 12(b) are the detection results obtained with our waterline detection method. The tourists, some small boats, and a telegraph pole are all in Figure 10(a), therefore the color of the image is complex; there is a very bright area near the camera in Figure 11(a) because of the light reflection, while the other regions are very dark and there is an arch bridge far away from the USV system; and in Figure 12(a), the USV was operating near the river guardrails. Furthermore, the image was captured in the backlighting of the camera. From Figures 10(b), 11(b), and 12(b), we could find that the detection result is not influenced by the light reflections and the complex background properties in the original images.

Waterline detection for image with complex background. (a)The original image before waterline detection and (b)The image after waterline detection.

Waterline detection for image with strong light reflection. (a) The original image before waterline detection and (b) The image after waterline detection.

Waterline detection for image captured in the backlighting. (a)The original image before waterline detection and (b)The image after waterline detection.
In experiment III, we used the optical images captured when the USV was operating in a river inside a city. Figures 13(a) and 14(a) are the original images captured by our USV, and Figures 13(b) and 14(b) are the detection results obtained with our waterline detection method. In these captured images, the objects include some high-rise buildings, bridges, and their shadows, as well as light reflections. Especially in Figure 13(b), the shadows and the reflections both exist on the water surface, and the intensity of the water surface flickers. From Figures 13(b) and 14(b), it can be seen that our detection method can detect the waterlines precisely, no matter what shapes of these buildings are and how far these buildings to our USV system are.

Waterline detection for image with complex reflections. (a) The original image before waterline detection and (b) The image after waterline detection.
Waterline detection for image with different background buildings. (a) The original image before waterline detection and (b) The image after waterline detection.
To evaluate the precision of our method quantitatively, we manually detected the waterlines in Figures 7(a) and 9(a) point-to-point and defined the manually detected result as the ground truth, because it is difficult to obtain the true waterlines in real-time images. The manual detection result is shown in Figure 15. The green lines in Figure 15(a) and (b) are the true waterlines of Figures 7(a) and 9(a), respectively. Subsequently, the average error between the detection result of our method and the ground truth was calculated with the following equation

Manual waterline detection result for Figures 7(a) and 9(a). (a) Manual waterline detection for Figure 7(a) and (b) Manual waterline detection for Figure 9(a).
where Le ,i represents the detected vertical coordinate of the ith point on the waterline, Lt ,i denotes the true vertical coordinate of the ith point on the waterline, and n represents the point number on the waterline.
Through calculation with equation (16), it can be concluded that the average error of our detection method with Figures 7(a) and 9(a) is 1.27 pixels and 1.44 pixels, respectively. Therefore, the result of the proposed waterline detection method is very close to the ground truth, and the average error of the proposed method using different images is about 1.35 pixels.
Comparison with other methods
In this section, some steps of our method were replaced by the conventional methods, and the waterline detection results were compared with those obtained using our proposed methods for the same sample image. First, we applied the traditional grayscale image to replace the intrinsic image evaluating the threshold of background segmentation, and the other steps of our method were remained. The experimental image is shown in Figure 7(a), and the detection result is shown in Figure 16(a), where it can be seen that when a dark cast shadow is projected onto the water surface, the detection result is far from the ground truth because the precision of the background segmentation is influenced by the cast shadow due to the fact that the traditional grayscale image is sensitive to shadows. Next, we applied the shadow detection method based on hue-saturation-value (HSV) color space transformation to detect the shadow regions first, and then used our iteration method to detect the waterline in the obtained shadow regions. The image we used is shown in Figure 11(a); the result is shown in Figure 16(b), where the detected result also deviates from the ground truth. The reason is the segmented shadow regions do not include the areas with self-shadows. Furthermore, due to the light reflections and waves, the segmented shadow regions scatter into a few clusters, which also reduce the precision of our iteration method.

Waterline detection result with the traditional gray image and the shadow detection method using the image in Figures 7(a) and 11(a). (a) Waterline detection with the traditional grey image for Figure 7(a) and (b) Waterline detection with shadow detection for Figure 11(a).
Besides, we compared the vertical coordinates of eight sample points on the detected waterlines in Figures 7(b) and 11(b) to the vertical coordinates corresponding to the same horizontal coordinates in Figure 16(a) and (b), respectively. The comparison result is given in Tables 3 and 4. In Table 3, we could find that when the traditional grayscale image was used to replace the intrinsic image evaluating the threshold of background segmentation, the average coordinate distance between two waterlines, detected by the changed method and our method, is 54.28 pixels. In Table 4, when the HSV color space transformation instead of our shadow verification is used to detect the shadow regions, the average distance of the vertical coordinates between two methods is 193.46 pixels.
Comparison on vertical coordinates when grayscale image is used.

Comparison on vertical coordinates when HSV color space transformation is used.

Discussion and outlook
The time required to process a complete RGB optical image (279 × 695 pixels) is 18 s on a 3.40-GHz machine with 8-GB random access memory using MATLAB [version R2015b] implementation. The most intensive process is the searching for the waterline using the global optimization method, since it needs to run many times of iterations for the cost energy function to get a stable result. Furthermore, the initial definition of the waterline, the iteration steps, and the optimization threshold all influence the running time. A future work is to accelerate the optimization method from these aspects.
All types of shadow areas are the basement of our optimization; therefore, we choose these shadow areas as the object area. If there are no shadows in original images, our method will stop working after the preprocessing step. Figure 12(a) shows an image with low contrast and no sky area; therefore, the background segmentation with the histogram can’t automatically choose the segmentation threshold and we start the waterline searching step with the entire image. Although the precision of our method has not been influenced, the running time has been improved. Therefore, methods for fully automated and robust waterline detection need to be studied in the future. Furthermore, in this article, the initial definition of our waterline is a straight line; however, it is not reasonable to describe all the water boundaries by a linear mathematical equation in real environments, especially when the waterline is close to the camera on the USV. Thus, introducing an adaptive mathematical function to describe the waterlines in all possible environments is also a key research issue in our future work.
Conclusion
In this article, we proposed an optical waterline detection method by combining shadow verification and energy minimization. The method was validated using practical optical images captured by a USV system. The first contribution of the proposed method is the introduction of an intrinsic image such that the intensity region is compressed compared to the conventional gray image transformation and the background is easily segmented. The second contribution is the classification of the regions with different shadows and utilization of the intensity contrast between the shadow and non-shadow regions to locate the waterline. The third contribution is the transformation of the position measurement and waterline detection problem into an optimization problem involving mathematical energy minimization described by differential equations. Finally, experiments were conducted with a series of practical images captured by the USV operating in an outdoor environment. The experimental results demonstrate the feasibility and robustness of the proposed method.
Footnotes
Declaration of conflicting interests
The author(s) declared no potential conflicts of interest with respect to the research, authorship, and/or publication of this article.
Funding
The author(s) disclosed receipt of the following financial support for the research, authorship, and/or publication of this article: This work was supported by the National Key Research and Development Plan (2016YFC0101500), the Natural Science Foundation of China (No. 61473282), the Fundamental Research Funds for the Central Universities (N161602002), and State Key Laboratory of Synthetical Automation for Process Industries.