
Abstract
Machine learning algorithms have been designed to address the challenge of multi-target recognition in dynamic and complex environments. However, sufficient high-quality samples are not always available for training an accurate multi-target recognition classifier. In this article, we propose a generic human-in-the-loop multi-target recognition framework that has four collaborative autonomy levels, and it allows adaptive autonomy level adjustment based on the recognition task complexity as well as the human operator’s performance. The human operator can intervene to relabel the collected data and guarantee the recognition accuracy when the trained classifier is not good enough. Meanwhile, the relabeled data are used for online learning which further improves the performance of the classifier. Experiments have been carried out to validate the proposed approach.
Keywords
Introduction
Multi-target recognition is an essential problem in intelligent systems. 1,2 It is useful for a variety of relevant tasks including surveillance, event analysis, and decision-making. 3 –5 In the field of computer vision, machine learning algorithms such as SVM 6 and deep concurrent neural networks 7,8 have been developed to train multi-target recognition classifiers. However, these state-of-the-art algorithms require a large amount of high-quality labeled data, which make the training process very expensive and time-consuming in real-world tasks, for example, in the search and rescue scenario using unmanned aerial vehicles (UAVs) with vision sensors. 9 In addition, the trained classifiers can hardly recognize all the targets in dynamic and complex environments, 10 especially when the targets are high speed, 11 partly occluded, 12 or varying in scales 13,14 (see Figure 1).

Challenging multi-target recognition cases where the targets are: (a) high speed, (b) occluded, and (c) varying in scales.
Human–automation collaboration is a promising way to solve tasks that are too difficult to be done by human or automation alone. By evaluating the capabilities and limitations of both the human operator and the automation, tasks have been reallocated to the human and the automation. 15,16 For example, a tele-operated UAV with a low-quality camera can navigate in cluttered indoor environments, where the obstacle recognition task is assigned to the human operator and the path planning task to the UAV. 16 In a multi-target surveillance task, the targets are classified as threats and sent to the human operator for confirmation using an object-oriented task model. 15 Considering shared situation awareness, six autonomy levels have been proposed for human–automation teamwork. 17 However, it remains a challenge to adaptively switch between the autonomy levels based on the dynamic evaluation of both the human operator and the automation. 14
In the literature, human-in-the-loop recognition systems have been designed to address the problems of fine-grained visual recognition, 18 semi-supervised clustering, 19 and attribute-based image classification. 20 Human annotation is a popular way to provide the machine learning algorithms with high-quality training data. 21 Human annotators are required to draw bounding boxes on a subset of images to generate training data for active learning. 22,23 In order to reduce the workload of human annotators, bounding boxes are produced automatically by the learning algorithm for human verification. Human efforts have been further amplified to leverage the deep learning algorithm through a partially automated labeling scheme. 24 These methods have taken into account the human as an additional source of training data provider. However, the human operators behave differently in different task settings, and the provided data can be unreliable and harmful for the learning algorithm. 25 Therefore, the human performance has to be considered from the perspective of human factors, 26 separately from the evaluation of machine learning algorithms.
Human factor researchers have used task models to capture the descriptive and normative features of the human–automation systems. 15,27 The performance of the human–automation systems can be guaranteed by integrating automation, human–device interfaces, human task behavior, human cognition, and environmental conditions. 28,29 An enhanced operator function model (EOFM) 30 has been proposed to design and analyze human–automation interaction using formal methods. 31 But constructing the state representation and exploring the state space remain a challenge. Based on a human–robot collaboration model to evaluate the task, 32,33 different human–robot collaboration levels are designed for complex unstructured environment. However, this work has mainly stay on the simulation and has not considered promoting the automatic algorithms by the interaction.
In this article, we propose an adaptive human-in-the-loop multi-target recognition framework that has four collaboration levels considering both the automation and the human factors, as shown in Figure 2. We aim to enable the fast recognition of specific targets such as cars and pedestrians. 4,34 Different from the previous research, we treat the recognition algorithms and human operators as two kinds of independent detectors, which has taken inspiration from the signal detection theory. 35 We have integrated the human operators into the task loop to improve the multi-target recognition classifiers through online learning with high-quality training data. The proposed human–automation collaboration model has four autonomy levels that can be adaptively switched in dynamic task environments based on both the workload of the operators and the performance of the classifiers. Our model is generic enough for any multi-target recognition problem by choosing a target type and a multi-target recognition algorithm.

The overview of the improved human-in-the-loop multi-target recognition framework.
The remainder of this article is organized as follows. “Methods” section introduces the human-in-the-loop multi-target recognition framework and its components in detail, followed by experiments and discussion in “Experiments” section. Finally, conclusion is discussed in the last section.
Methods
Overview
We design four collaboration levels 36 to collaborate with the HOG-SVM classifier. 37 The collaboration levels are mainly different in the confidence to the operator and the classifier. In the real-time surveillance task, we dynamically switch the collaboration levels depending on the evaluation of the condition of the human operator, the classifier adaption, and the environment, which are quantified by a human–classifier collaboration model. 32,33 The experts score the pretrained classifier offline by testing it with the true or the possible task environment images and label them before our task, based on which we evaluate the adaption of the pretrained classifier in the real task online. We use an eye tracker to monitor the human operator’s abnormal behaviors. The saliency method calculates the number of interesting targets. During the interaction that consists of four collaboration levels, the classifier is trained. The difference between this process and active learning is that we aim to get correct labels for a specific set of scene images rather than learning a generalizable classifier. In other words, we overfit a recognition model to guarantee the precision in a given task without considering generalizability outside the task. It is acceptable at least in a short period of time during the surveillance task, and when the scene changes, we can switch the collaboration level and retrain the classifier.
Four collaboration level
Under the condition of current technology, the UAV systems are not able to be completely autonomous. However, human operators are subject to fatigue, low precision, and obviously different opinions on even the same object. 38 By human–classifier collaboration in deep detail, we can make the whole system more efficient. Based on different dependencies on the operator and the classifier, we design an interface with four collaboration levels and choose the SVM classifiers. The collaboration levels are based on four degree of autonomy, which are defined according to Sheridan et al.’s 39 scale of “action selection and automation of decision.” Simply, they can be described as the operator recognizes the objects independently, the operator recognizes the objects with the assistance of the classifier, the classifier recognizes the objects with the supervision of the operator, and the classifier recognizes the objects independently.
H: The operator selects the targets using the bounding box compatible with level 1 on Sheridan’s scale. As shown in Figure 3, the orange bounding boxes are drawn by the operator to select the targets. HR: The operator acknowledges the classifier’s correct detections by clicking, ignores the false detections, and selects the targets missed by the classifier using bounding boxes compatible with levels 3 and 4 on Sheridan’s scale. As shown in Figure 4(a), the green bounding boxes with a question mark are the recommendation given by the classifier. There are missed targets, false detection, and correct detection. The operator identifies them by clicking and draws bounding boxes on the missed ones, as shown in Figure 4(b). The recommended bounding boxes without the operator’s verification are the false ones. RH: The operator vetoes the classifier’s false detections by clicking (otherwise means acceptance) and selects the targets missed by the classifier using bounding boxes compatible with levels 5–7 on Sheridan’s scale. As shown in Figure 5(a), the blue bounding boxes are the targets selected by the classifier. There are missed targets, false detection, and correct detection, and the operator cancels false detections by clicking and draws bounding boxes on the missed, as shown in Figure 5(b). The selected bounding boxes without the operator’s cancel mean acceptance. R: The targets are automatically selected by the classifier completely compatible with level 10 on Sheridan’s scale. As shown in Figure 6, the red bounding boxes are drawn by the classifier.
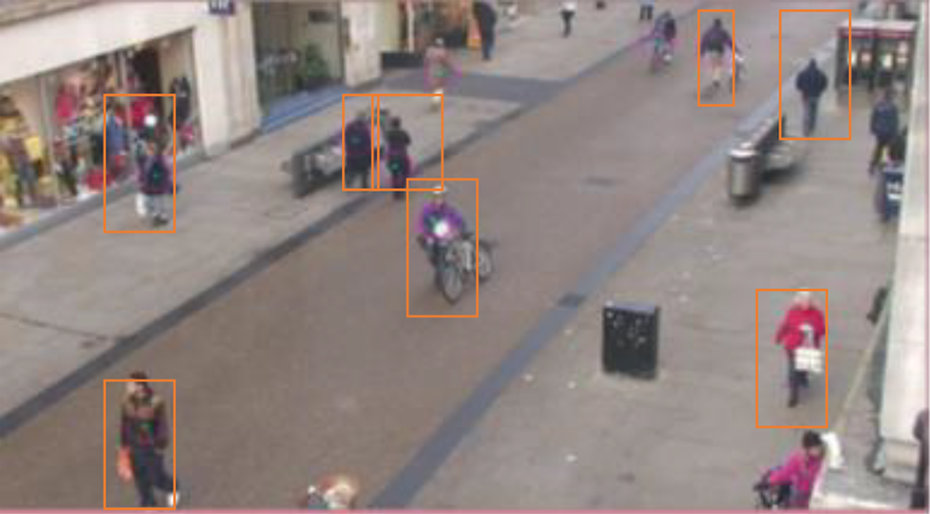
H collaboration level.
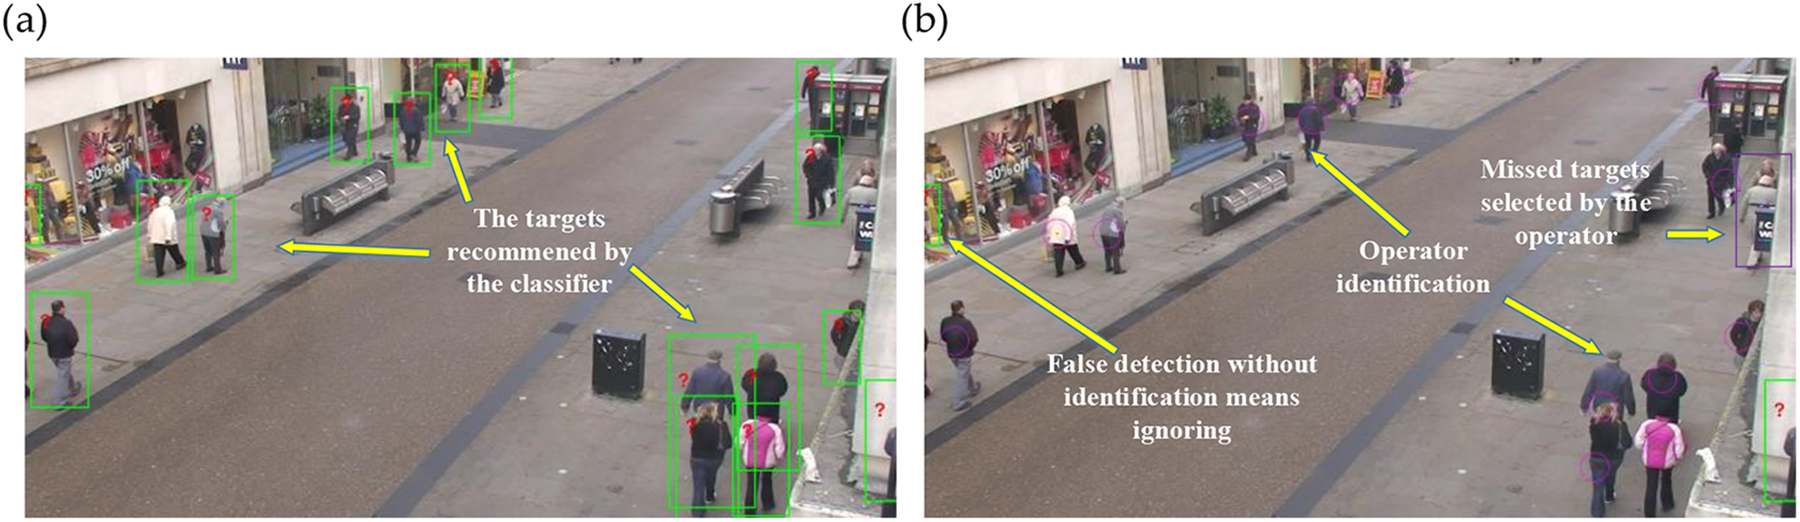
HR collaboration level. (a) The initial result produced by the classifier and (b) the result after the operator’s participation.

RH collaboration level. (a) The initial result produced by the classifier and (b) the result after the operator’s participation.

R collaboration level.
Human–classifier collaboration model
The objective function in the model 32 is defined as

VHs is the gain of hit, VFAs is the penalty of the false alarm, VMs is the penalty of the miss, VCRs is the gain of the correct rejection, and VTs is the cost, including the cost of time and operation. The values above have the same dimension.
Based on the signal detection theory, the object function for each collaboration level VIS
(H), VIS
(HR), VIS
(RH), and VIS
(R) can be transferred into function with variables: human sensitivity
Online evaluation
The model is well adapted to a fuzzy evaluation of the condition, the chosen collaboration level is a tendency to promote the system’s efficiency, and each collaboration level is able to accomplish the task alone in the whole process, which lowers the requirements for the evaluation methods. We try to evaluate the three variables online and dynamically switch our collaboration level to adapt to complicated changing task environment.
Evaluating the classifier sensitivity: The adaption of the pretrained classifier
In a multi-object recognition task, collected small samples are usually insufficient to train an accurate classifier at the early stage of the task. We have to use a pretrained classifier based on another big data set (with the same type of targets). The results are usually not satisfactory for the complicated environment and huge scale changing.
Figure 7(a) is the result tested in PETS09-S2L1 by an HOG-SVM classifier trained by 1200 negative samples and 2400 positive samples in the INRIA Person data set. Figure 7(b) is the result tested in ADL-Rundle-6 data set by the HOG-SVM classifier trained by enough samples in INRIA Person data set.

The results of a pretrained classifier.
Small samples in the task environment can provide us with the information of the adaption of our pretrained classifier. So, we can choose the most possible or actual task scene images to pretest our classifier and we can label them. In the real task environment, we make use of this information.
As shown in Figure 8, an experienced operator scores the classifier by watching the marking results and uses proper Canny detectors
40
to label them, building a connection between the score and the scene. The score is transferred into a specific value of

The process of evaluating the classifier sensitivity.
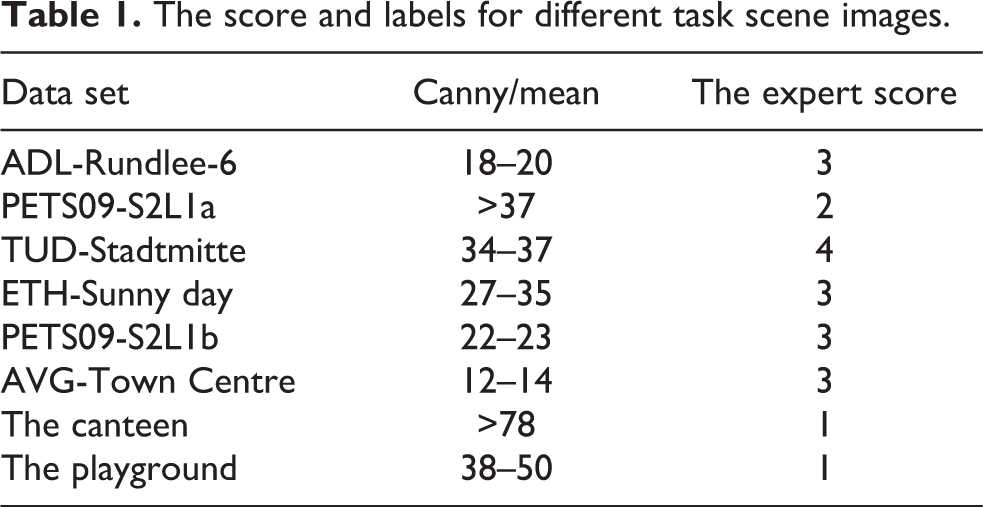
Table 1 shows the results of the expert’s score on the HOG-SVM pretrained in the INRIA Person data set. The testing eight data sets consist of six data sets from MOT Challenge 42 data set and two data sets collected by ourselves. The second column is the canny labels. It indicates that our method is able to distinguish different scene images with specific score.
The score and labels for different task scene images.
Evaluating the operator’s sensitivity: Monitor human operator’s abnormal event by an eye tracker
It is difficult to accurately evaluate the state of the operator. However, we can find the abnormal events by monitoring the operator’s eye fixation, for example, the operator is fatigue or absent. We can score the human operator’s state online.
Figure 9(a) is the Tobii eye tracker we used, and Figure 9(b) is the eye closing time test and the four abnormal points illustrate a closing eye event. It will make

The Tobii eye tracker and eye closing time detection (four abnormal points).
Estimating the number of targets: Calculate the number of interesting areas based on saliency
The number of the possible targets is also a great factor that affects the choosing collaboration level. The saliency detection method 43,44 is able to generally find the targets of interest which provides us with important information. Compared with the fast Fourier transform method, image signature method 45 uses discrete cosine transform to transform the image into frequency domain to detect salient regions and speedup. The results of the prediction tested on AVG-Town Centre data set are shown in Figure 10, meeting our demand.
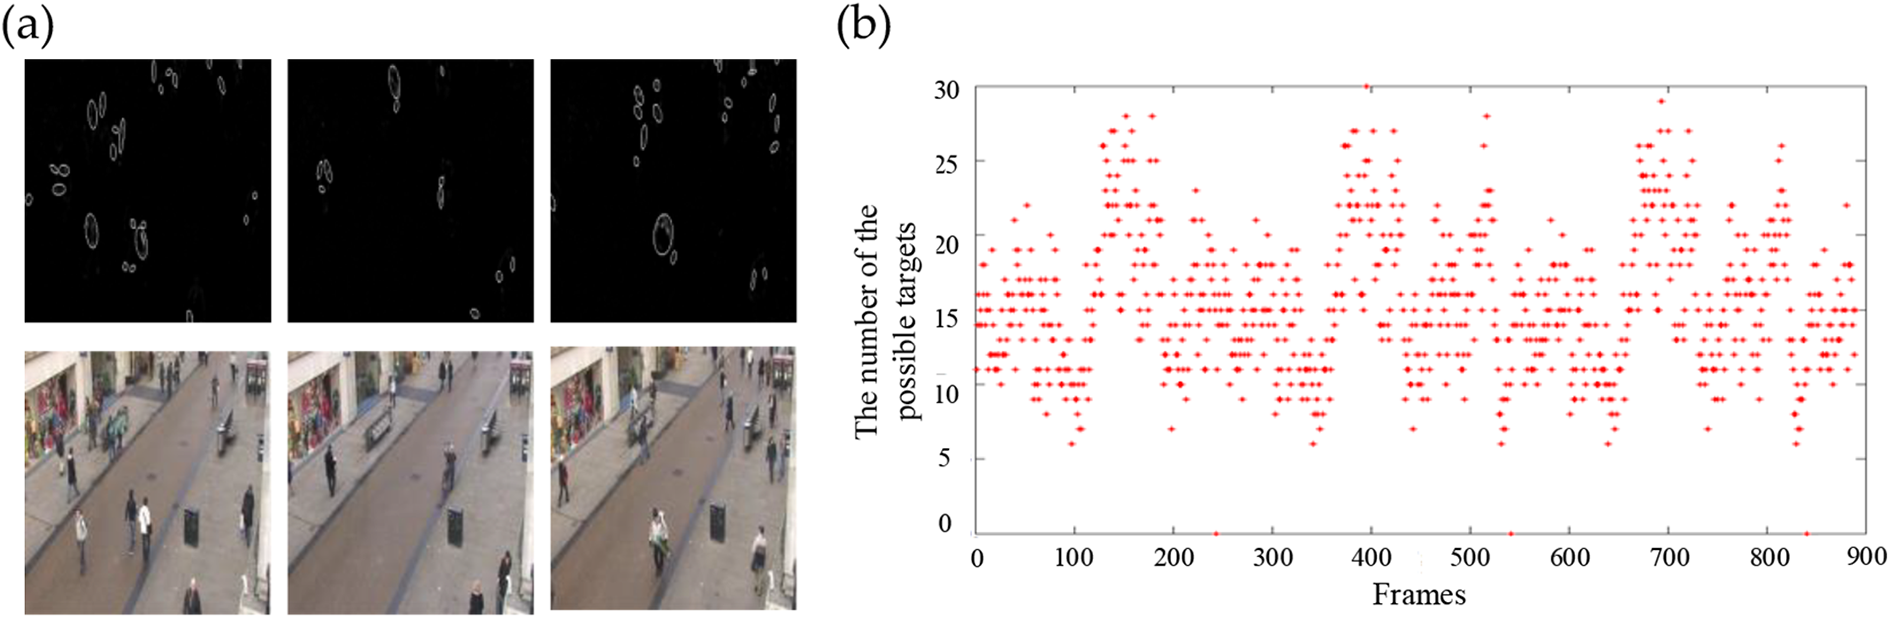
The results of saliency detection. The circles in (a) represent the possible targets, and the red point in (b) is the number of interesting areas detected by the SIG method at real time, which can be used to predict the number of targets. SIG: image signature.
Online learning using the data collected from human–classifier interaction
During the period of interaction, we collect positive samples, negative samples, and hard examples (the wrong classifier results corrected by the operator) to retrain our classifier online, which improves the classifier, especially when the scenes are generally stable. The scale of the targets is an important factor that affects the process of feature extraction. And the information of the bounding box made by the human operator or the classifier’s correct bounding box provides useful scale criterion information.
We try to collect precise positive samples and especially negative samples as many as possible. Our experiments have proved that the lack of negative samples will bring lots of unpalatable false guides. Our strategies are shown in Figure 11 as follows: Positive samples: The green (classifier recognition correctly) and yellow bounding box (the missed targets selected by the operator using bounding boxes) in the image. The bounding box restrains the scale of the positive samples. Hard examples: The green bounding box with red circle (the classifier’s false detection canceled by the operator. Negative samples: The red bounding boxes (the similar size bounding box between all the positive samples and the hard examples). We automatically collect negative samples by traversing the area between the positive samples and the hard examples with the same scale of the positive samples in the image.

The collecting of samples in HR and RH levels.
We chose 10 images from PETS09-S2L1 data set and 10 images from our own playground data set. The pedestrians in the two data set are in different scale. We interact with 20 images from the two data sets to train the SVM classifier and tested it with 20 images, respectively. The result meets the requirement in stable period in the task. The results are shown in Tables 2 and 3.
The test results in the PETS09-S2L1 data set.

The test results in the playground data set.

Note. The bold values show our method are better in precise and recall than HOG-SVM method.
In the PETS09-S2L1 data set, our method performs a little better than the pretrained SVM. As the target scale changes, for example, in the playground data set, our method keeps the good performance which is much better than the pretrained SVM with the same parameter setting. In other words, our method shows a good adaption to different scenes.
Experiments
We have conducted two experiments with 16 participants in total. The first experiment with five participants aims to validate the effectiveness of switching method. Using the eye tracker, the second experiment with 11 participants aims to validate that the learning during the interaction obviously promotes the ability of the classifier and meanwhile the whole system.
Experiment 1
Data set and process
We choose pedestrians’ recognition as our task to validate the proposed method because the samples of the pedestrian with a wide variety are easily available. The images are from six classic pedestrian detection data sets, such as ADL-Rundle-6, ETH-Sunnyday, PETS09-S2L1, PETS09-S2L2, TUD-Sadtmitte, and AVG-TownCentre, included in the MOTChallenge data set. In addition, we collect samples in the playground and canteen to make another two data sets, which increases the diversity in obscuration and shelter, as shown in Figure 12.

Images from used data sets. Six data sets are from the MOTChallenge data set and two data sets are prepared by ourselves.
Before starting the experiment, each operator experiences the four collaboration levels for total 1 min and the images are non-experimental images but from the same data set. Our 40 experimental images are various with complicated background and many are shot from a height to meet the simulation demand of the UAV’s surveillance task situation. The interval time between each image is 7 s and the operator tries to recognize all the targets in the H, HR, RH, R, and our switching method. The total time is about 5 min for each operator and the interval for each operator between different levels is 20 min to remove their memory on the images.
Results and discussion
The HOG-SVM classifier is trained on the INRIA Person data set and we test the classifier with 40 our experimental images. The results are shown in Table 4.
The results of the HOG-SVM classifier tested in our data set.

There are totally 371 targets and we count the number of the correct recognition, the false recognition, and the missing targets of each operator by an expert with the same standard. And the results are shown in Table 5. Table 5(a) shows the number of correct recognition, Table 5(b) shows the number of the false recognition, Table 5(c) shows the number of the missed targets, and Table 5(d) is the comparison in the metric of precision and recall; 1–5 are five operators and H, HR, RH, and R are different collaboration levels. Switching is our proposed method.
The results of the targets recognition.

Note. The bold values show our switching method and RH collaboration level are much better in correct recognition and missed targets. In all, both of them perform much better in recall with a little lower precise.
We count the average number over five operators, and the results are shown in Figure 13. Compared with the H and R levels, we can see that human operator is much better than the classifier not only in the Precision but the Recall. Particularly, we set the limit that the interval between each image is 7 s, which increases the missed targets of the operator and decreases his recall. However, with the assistance of the classifier (collaboration of HR and RH), we can see obvious increase in the hit number and the decrease in the missed number in a limited time, with a little more false recognition.
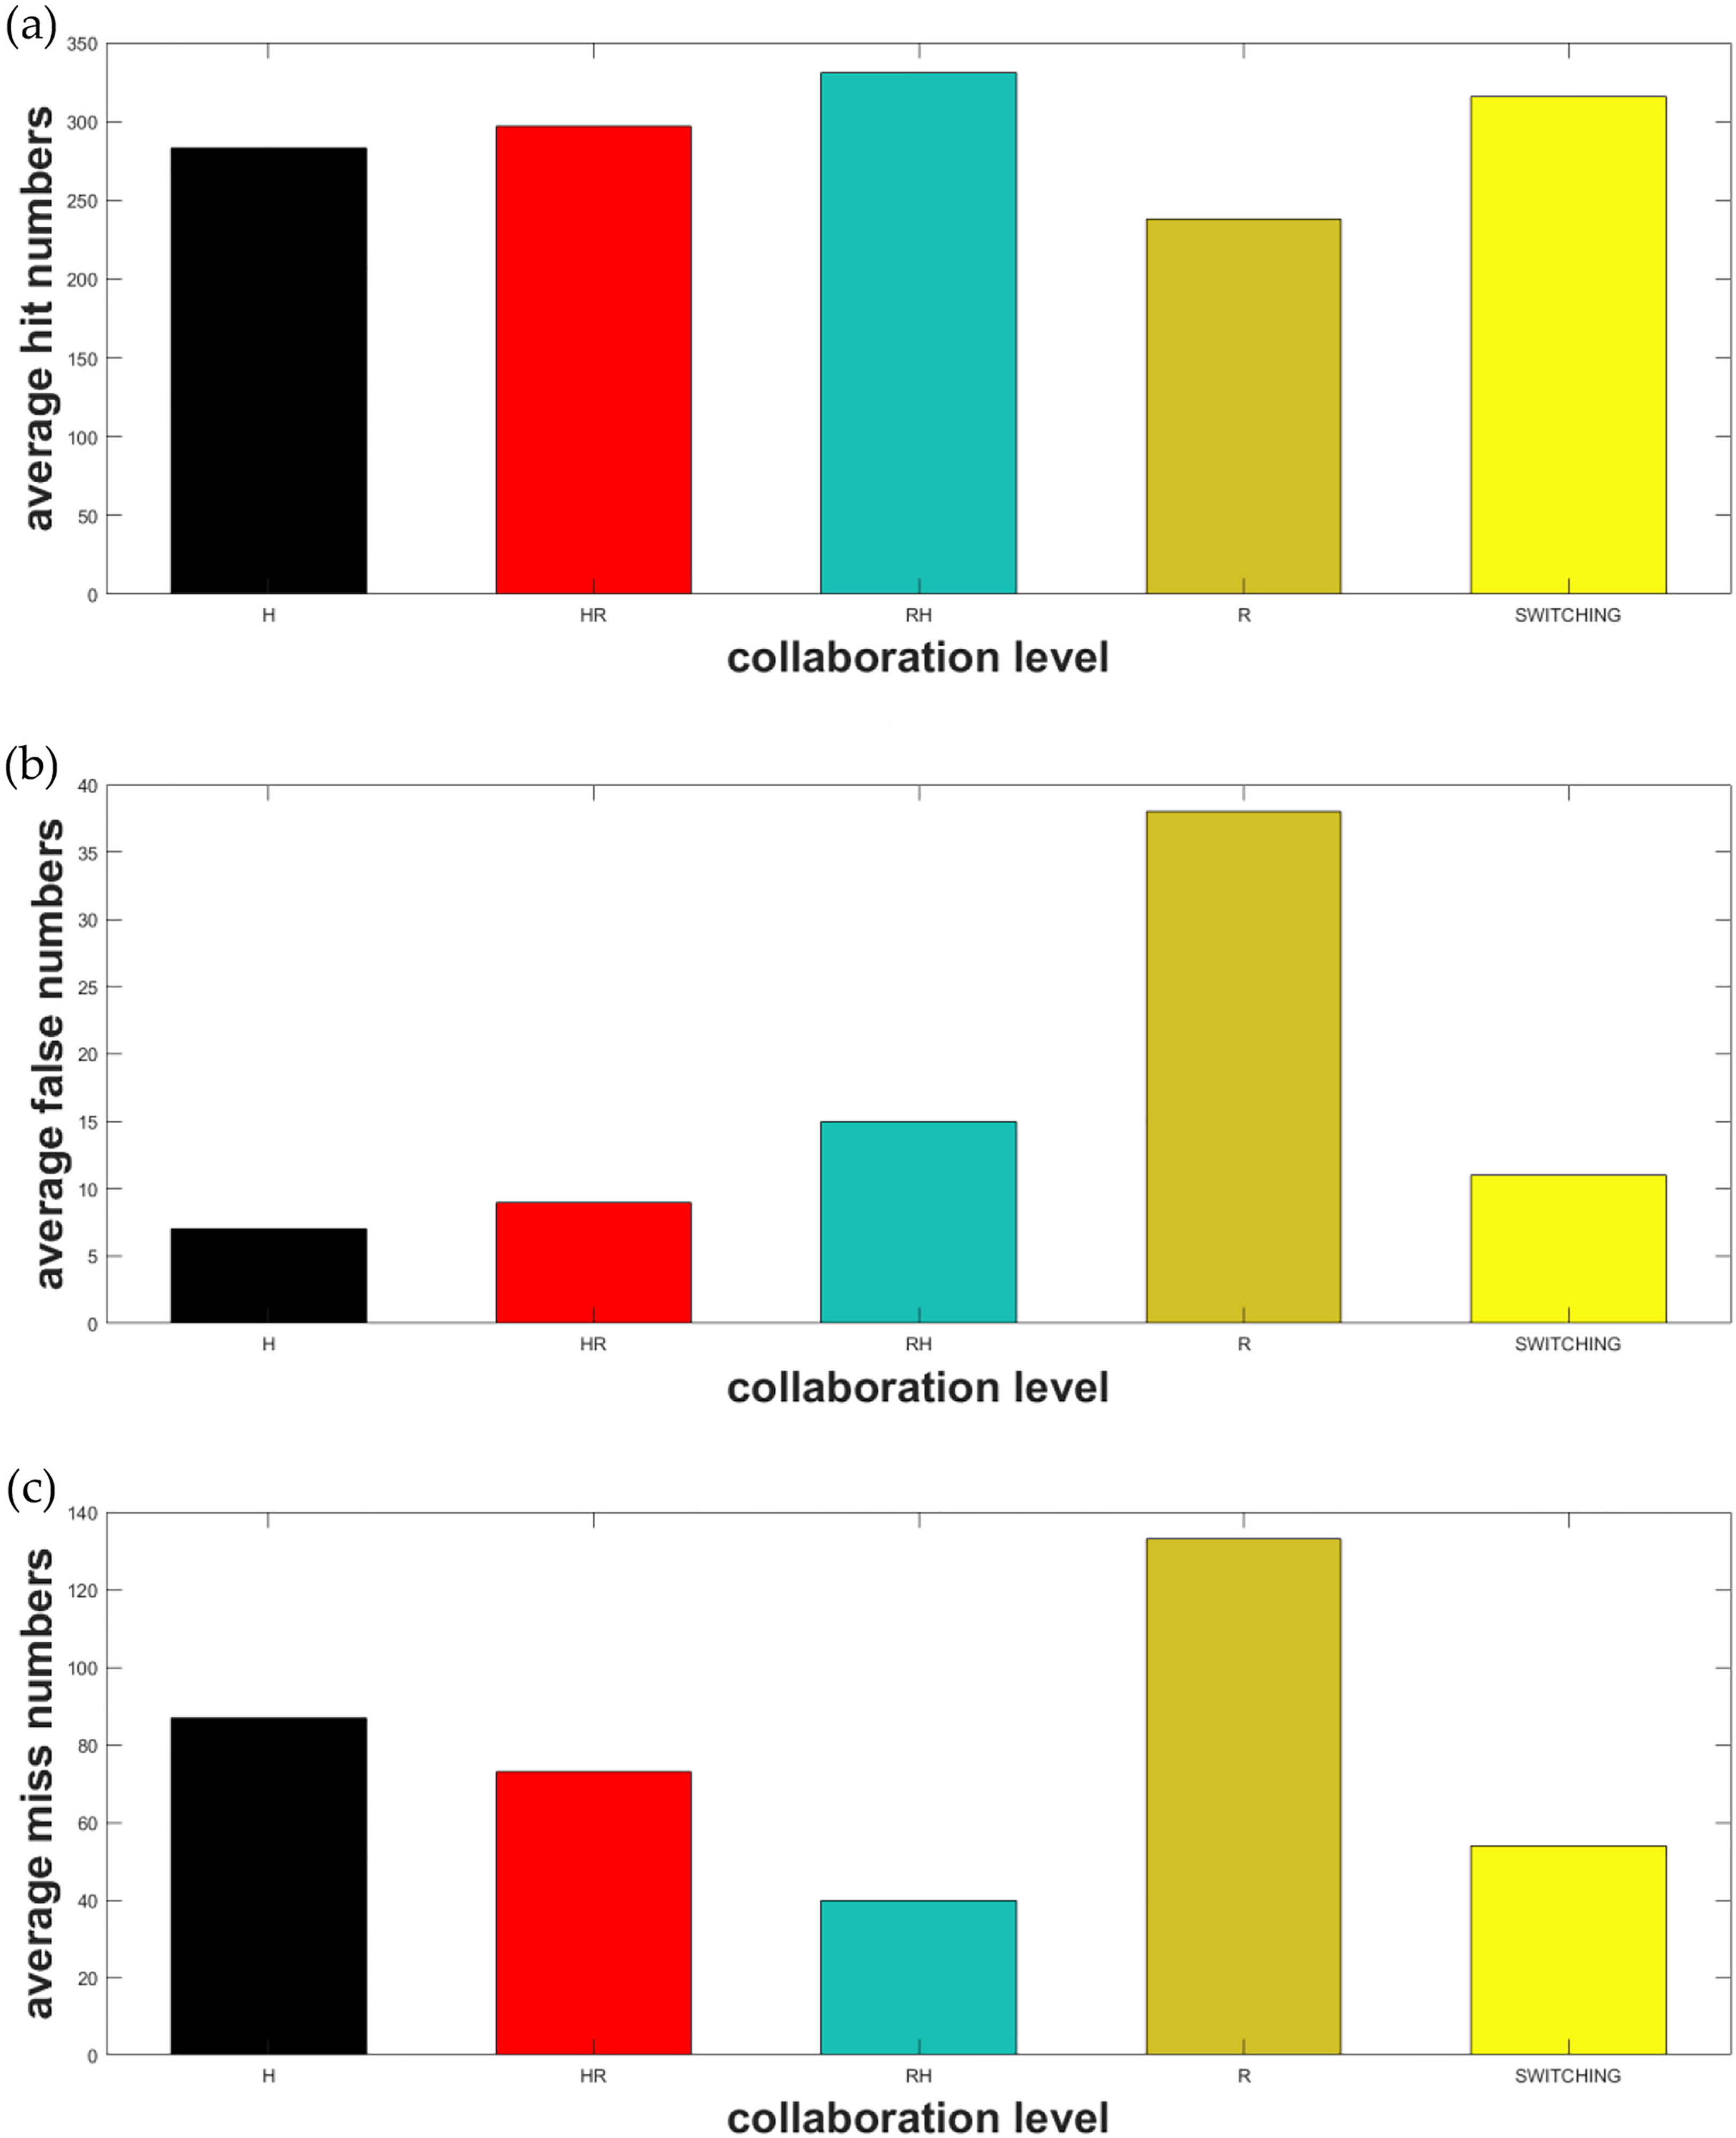
The average results. (a) to (c) The average hit numbers, false recognition numbers, and miss numbers among the five operators, respectively. The x-coordinate is the five different collaboration levels and switching is our new method. The y-coordinate is the numbers counted.
In addition to R, RH performs the best in the hit number and the missed number but the worst in false recognition. H performs the best in the false recognition but the worst in the hit number and the missed number. HR is a great compromise and R is able to obviously decrease the operator’s workload, and in some specific scene that the classifier is confident, it does perform well. We see the necessity of switching.
In the hit number and miss number, RH and switching method are highly better and switching method performs better than HOR in false rate. In terms of the recall, HOR and switching method are highly better. Our switching method increases the hit rate by 30% and decreases the miss rate by 7%, with the miss rate by 21% compared with the single SVM classifier recognition. It increases the hit rate by 9% and decreases the miss rate by 10% with a cost of 1% increase in false rate compared with a single operator. Among all the metrics, our switching method is a good compromise and reflects great adaption.
Experiment 2
Data set and process
We choose 10 images from PETS09-S2L1 data set and 10 images from our own playground data set. There are 11 participants (i.e. 4 females and 7 males) recruited for this experiment. The participants’ age ranges from 24 to 30. There are three teams of experiments, E1, E2, and E3, with an eye tracker recording the points of fixation. The participants are asked to “recognize all the pedestrian targets with or without the aiding of the classifier” and they use the spacebar to control if one image is finished. E1: The participant acts in the H collaboration level by clicking the targets without the aiding of the classifier to recognize all the targets in 20 images. E2: The participant acts in the RH collaboration level with a pretrained HOG-SVM classifier to recognize all the targets in 20 images. E3: The participant acts in the RH collaboration level with HOG-SVM classifier trained by data from human–classifier interaction to recognize all the targets in 20 images.
There are six participants conducting the experiments in the order of E1, E2, and E3 and five conducting in the order of E3, E2, and E1. The interval between each experiment for the operator is 20 min. The images showed in the experiment are random.
Results and discussion
The average operation time of E1, E2, and E3 is 138.18, 122.55, and 99.73 s, respectively, as shown in Figure 14. The operation with classifier’s aiding performed better than single operation. And our online learning method performs the best for its classifier provided more effective aiding than E2, for example, the less false recognition and more correct hit.

The average operation time. The x-coordinate reflects the three different operations and the y-coordinate reflects the average time among the 11 operators.
For more detailed analysis, we set interesting areas around all the pedestrians’ targets, as shown in Figure 15, to analyze two metrics: first fixation time and fixation time.
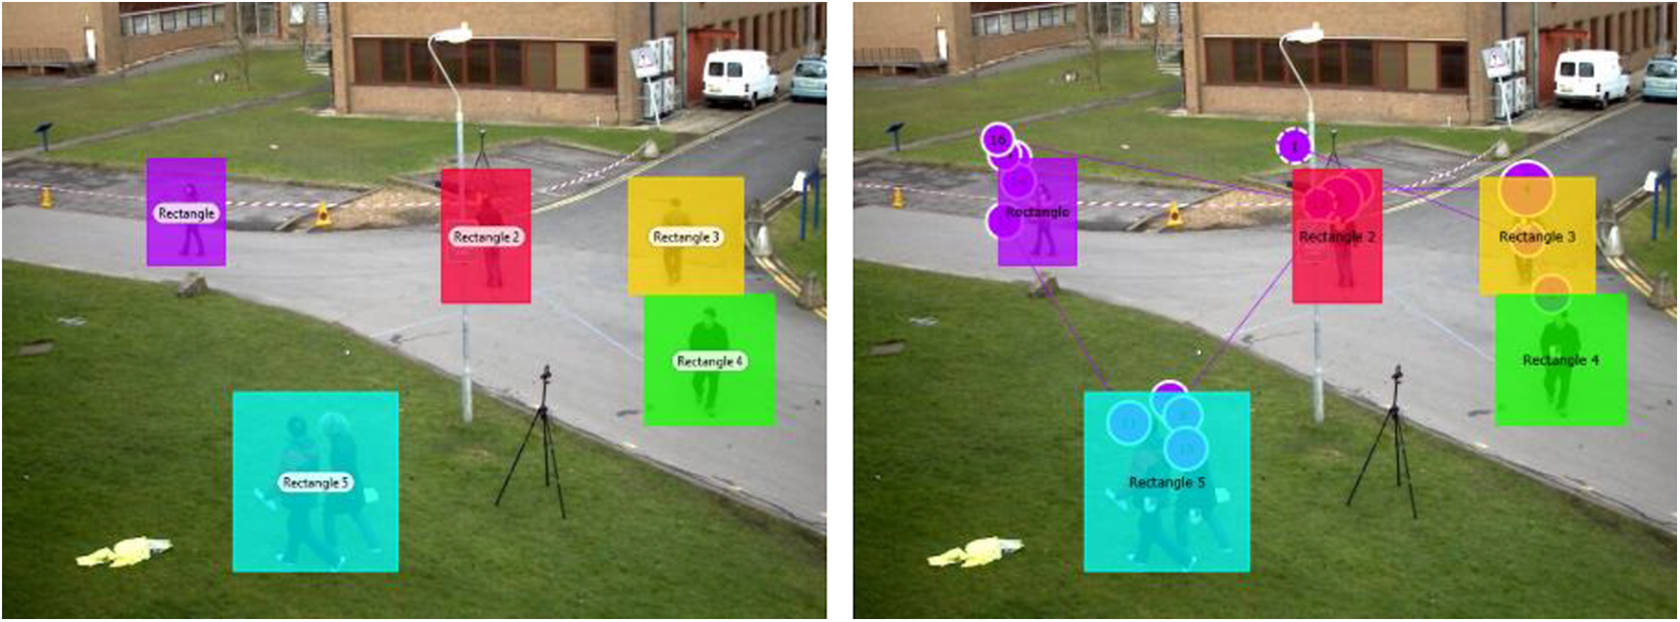
The interesting areas setting and the recording of the fixation. The colorful rectangles are interesting area set and the purple circles with numbers are the fixation points recorded by the Tobii X120 eye tracker in chronological sequence. The size of the circles reflects the fixation time.
First fixation time is the time when the fixation first enters into the interesting areas. The mean of first fixation time reflects the average time when the operator first fixes on every interesting area in one test image. The minimum of the first fixation time reflects the time when the operator first fixes on any interesting area in one test image. Fixation time is the operator’s fixation duration in each interesting area.
We count the number of times that one collaboration level defeating the others in the 20 test images. For two participants’ eye tracker data are not complete, we analyze nine participants’ data. What’s more, we increase both operations’ defeating times if they had the same metric value, so the total times may not be exactly 20 for some operators. The results are shown in Figures 16 and 17, and the average number of times among the nine operators is shown in Tables 6 and 7.

The number of times that one collaboration level defeating the others in the minimum of the fist fixation in interesting areas. The x-coordinate is the operator 1–9 and the y-coordinate is the times defeating the others among 20 experimental images.
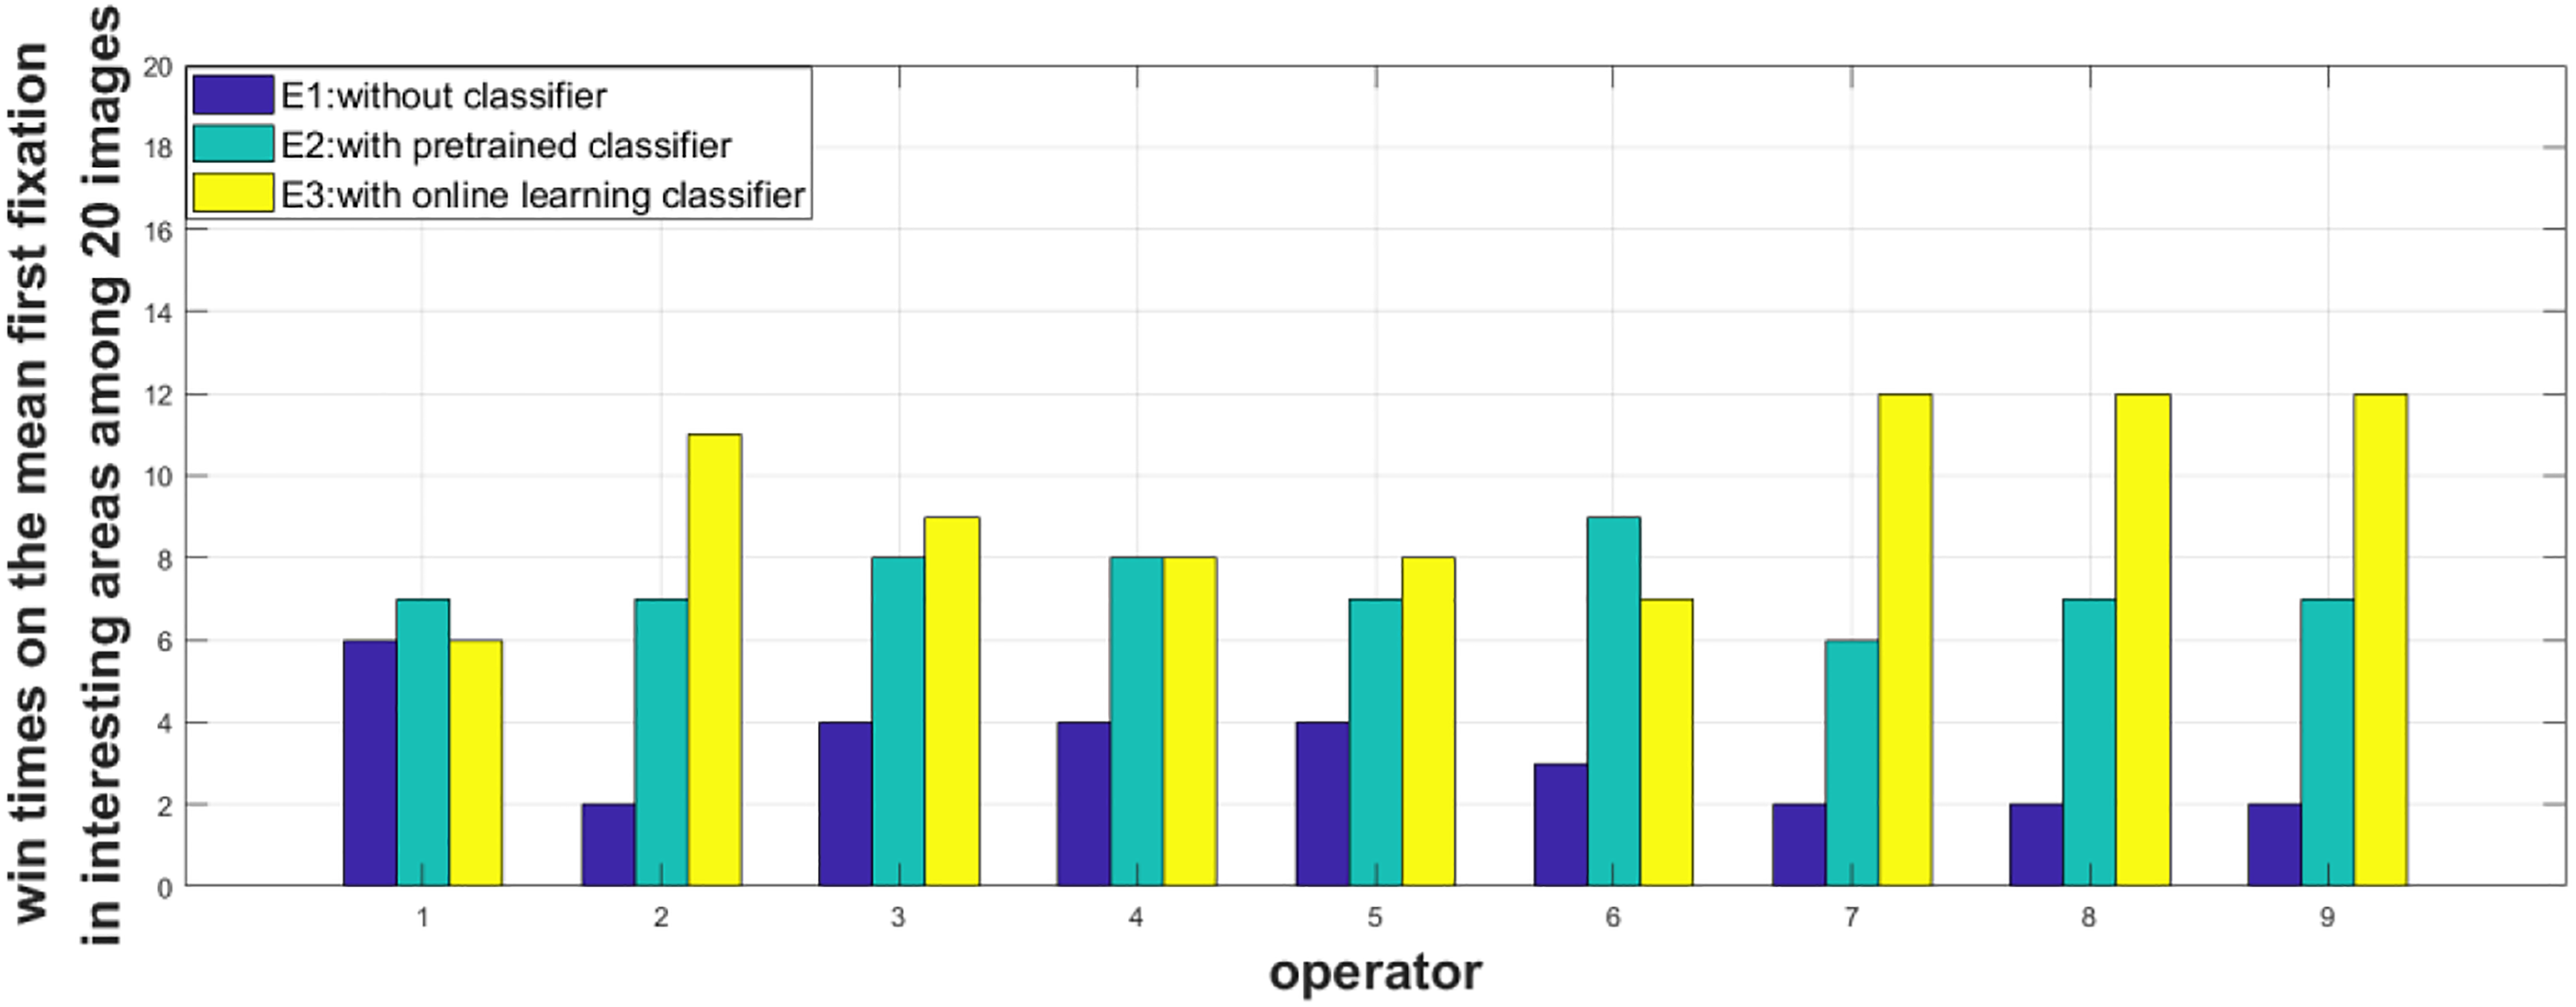
The number of times that one collaboration level defeating the others in the mean of the fist fixation in interesting areas. The x-coordinate is the operator 1–9 and the y-coordinate is the times defeating the others among 20 experimental images.
The average number of times that one collaboration level defeating the others in the minimum of the fist fixation in interesting areas.

The number of times that one collaboration level defeating the others in the mean of the fist fixation in interesting areas.

In terms of the first fixation time, on average times, E3 performs the best. As for the minimum of the first fixation in interesting areas, which reflects the time that the operator uses to find the first target. E1 performs better than E2 (7.1 times > 6.4 times), and the advantage of E3 is not obvious (E3 = 8.3 times > E1 = 7.1 times) because both E2 and E3 have false alarms, but E2 provides more, which gives a false guide. What’s more, the images with a lot of bounding boxes are more confusing. But the goal of E1 is more simple and straight: finding the pedestrian targets at the very beginning. However, calculated in the mean of the first fixation in all the interesting areas, E2 and E3 have made great progress compared with E1 (E3 = 9.4 > E2 = 7.3 > E1 = 3.2).
The average fixation duration time for each operator is shown in Table 8. The average fixation time for E1, E2, and E3 is 0.38, 0.31, and 0.27 s, respectively. Our online learning method performs faster.
The fixation time in each interesting area (seconds) among 20 images.

After the experiments, we calculate the fatigue degree based on a questionnaire. The questionnaire consists of four options: very easy, easy, tired, and very tired, to evaluate the three operation manners: E1, E2, and E3. When the participants finish all the experiments, they are asked to choose an evaluation option for each experiment immediately. We count the total choice of the participants, as shown in Table 9. As a whole, we can see the obvious decrease in the workload with the aiding of our online learning method.
The number of choices on each option among 11 participants.

Note. The bold value shows the obvious decrease in the workload with the aiding of our online learning method.
Conclusion
We have proposed a human–classifier collaboration framework to recognize multi-target in real time. The framework is easy to build, having improved the performance of the whole system and reduced the workload of the operator. Particularly, our framework improves the current state-of-the-art object detectors by learning with necessary human supervision, providing a good solution to the problem of insufficient high-quality samples in dynamic and complex tasks. In other words, We have designed an adaptive human-in-the-loop multi-target recognition framework which is generic for any given tasks. The proposed framework performs better than previous methods in the condition of small samples. Online learning can further improve the classifier with samples collected from human–classifier interaction. Whenever the classifier makes a mistake, this “hard example” can be used to improve the classifier through learning.
Two experiments with total 16 participants show the practical effectiveness. The experimental results demonstrate that our switching method increases the hit rate by 30% and decreases the false miss rate by 7%, the miss rate by 21% compared with single SVM classifier recognition. Compared with a single operator, the hit rate is increased by 9% and the miss rate is decreased by 10% with a cost of 1% increase in false rate. In addition, with the help of an eye tracker, we find that online learning based on the interactive collaboration is able to obviously promote the ability of the classifier and the system meanwhile.
There are still several interesting research directions worth investigating. For switching the collaboration levels, the existence of R is rational because it can remarkably reduce the operator’s work load. However, we cannot trust the automation completely without the precise evaluation of the task. So if we don’t have a perfect classifier of evaluation, we may directly replace the R with RH, which is a mode that gives much trust to the classifier under the supervision of an operator and to transfer the number of our collaboration levels from four to three. In addition, how to promote the real-time performance of the learning method and reduce the operator’s workload in the process is still a problem. Finally, other state-of-the-art recognition, collaboration, evaluation, and learning methods can be tested in the proposed framework.
Footnotes
Declaration of conflicting interests
The author(s) declared no potential conflicts of interest with respect to the research, authorship, and/or publication of this article.
Funding
The author(s) disclosed receipt of the following financial support for the research, authorship, and/or publication of this article: This work is supported by National Natural Science Foundation (NNSF) of China (grant no. 61403410, no.61773393, no. 61573371 and no. 61503403).