
Abstract
Maintenance of catenary system is a crucial task for the safe operation of high-speed railway systems. Catenary system malfunction could interrupt railway service and threaten public safety. This article presents a computer vision algorithm that is developed to automatically detect the defective rod-insulators in a catenary system to ensure reliable power transmission. Two key challenges in building such a robust inspection system are addressed in this work, the detection of the insulators in the catenary image and the detection of possible defects. A two-step insulator detection method is implemented to detect insulators with different inclination angles in the image. The sub-images containing cantilevers and rods are first extracted from the catenary image. Then, the insulators are detected in the sub-image using deformable part models. A local intensity period estimation algorithm is designed specifically for insulator defect detection. Experimental results show that the proposed method is able to automatically and reliably detect insulator defects including the breakage of the ceramic discs and the foreign objects clamped between two ceramic discs. The performance of this visual inspection method meets the strict requirements for catenary system maintenance.
Introduction
Catenary is an important component of the traction power supply system of high-speed railways. Stable contact between the contact wire and the pantograph ensures good power distribution to the locomotive. Rod-insulator is a critical part of the catenary system, which supports other mechanical and electrical parts and provides high-voltage electrical insulation. Insulator defects may cause insulation deterioration and increase the risk of insulation breakdown resulting in the disruption of railway service. Inspection and maintenance need to be performed regularly to ensure reliable service and the safety of railway systems.
In recent years, noncontact detection methods based on computer vision techniques have received more and more attention from railway companies. Using these methods, the interference with railway operation can be minimal and the investment costs can be reduced, while high detection accuracy can be achieved. Currently, applications of computer vision–based noncontact detection methods include rail maintenance, 1 –4 dynamic stagger measurement, 5,6 and active pantograph control. 7 However, few detection methods based on computer vision techniques have been designed to detect the defects of catenary fittings.
To detect the defects of insulators, two key problems need to be solved. The first one is detecting the insulator from the captured images. The other one is determining whether the detected insulator is defective. In the past decades, substantial achievements have been made in object detection and recognition by adopting local features such as scale invariant feature transform (SIFT) descriptors (orthogonal design for SIFT optimization), 8,9 speedup robust feature descriptors, 10 Haar-like features, 11,12 histogram of orientated gradients (HOG) features, 13,14 and local binary pattern (LBP) features. 15,16 Comparing with these object detection methodologies, the deformable part model (DPM) algorithm, proposed by Felzenszwalb et al., 17 is capable of handling large intra-class variability by combining several sub-models to allow a wide range of variations in object appearance. This is especially important for accurate insulator detection because occlusion and lighting variation may exist in catenary images. 18 In this article, the DPM algorithm is used as the detector of the insulators in the catenary system.
As for the problem of recognizing the defects of insulators, some methodologies have been proposed for the insulators used in the power distribution system. For example, Wu and An designed a new active contour model to segment insulators. 19 A missing insulator cap could be detected by the distorted shape of the contour of the segmented insulator. Oberweger et al. divided the insulator into individual insulator caps and recognized the defective cap based on the singularity of gradient location and orientation histogram descriptors, which are defined in elliptical spatial regions that cover different insulator caps. 20 Huang et al. detected the missing of insulator caps using LBP features and template matching. 21 Zhai et al. presented an insulator cap missing detection algorithm based on saliency and adaptive morphology. 22
As shown in Figure 1, the insulators used in the catenary system and the insulators used in the power distribution system usually have different appearances. Insulators used in the power distribution system are usually connected by many insulator caps. The intervals between different caps are relatively large. Insulators used in the catenary system are usually produced as single objects in the production process. The intervals between different ceramic discs are small. Apart from that, the ceramic discs of the insulators used in the catenary system are usually much narrower than the caps of the insulators used in the power distribution system.

Comparison between insulators used in the catenary system and the power distribution system: (a) an insulator used in the catenary system and (b) an insulator used in the power distribution system.
Because of these differences, defect detection methods developed for insulators used in the power distribution system may not achieve equally good results when dealing with insulators used in the catenary system. The partition of the insulator units (ceramic discs) could be less accurate and the features extracted for a single ceramic disc could be less representative. Besides, apart from common defects such as the breakage or missing of the insulator units, foreign objects clamped between ceramic discs are also considered as defects that may degrade the performance of insulation, as shown in Figure 2. This is never considered when detecting the defects of insulators used in the power distribution system. Thus, specific treatments are required when detecting the defects of insulators used in the catenary system. In this article, a defect detection method based on local period estimation is proposed.
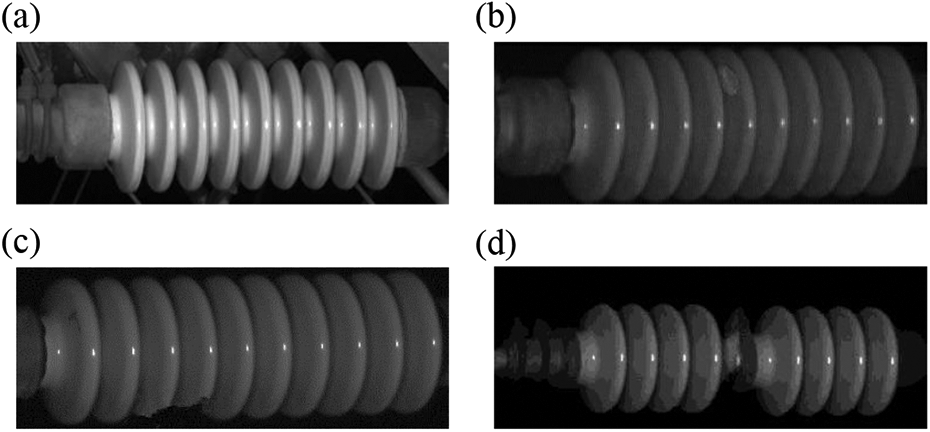
A good insulator and insulator defects. (a) Good insulator, (b) foreign object clamped between two ceramic discs, and (c) and (d) broken ceramic discs.
Our article has two main contributions. First, a two-step detection method is proposed to detect the insulators in the image. Original DPM algorithm uses the sliding window technique to “scan” through the entire image, which is quite computationally expensive. Besides, the width to height ratio of the insulator bounding box is not fixed because the inclination angle of the insulator varies from 0° to about 70°, as shown in Figure 3. The varying insulator sub-image window size further increases computational complexity. In order to decrease computational complexity, sub-images that contain different insulators are extracted first and the insulators are only detected on the extracted sub-images. As shown in Figure 3, pillars and poles form the main structure of the catenary system and the insulators are attached to the end of these rods. In the insulator detection process, a rod sub-image containing an insulator is first extracted by detecting the rod and extending its bounding box to include the insulator. DPM can then be used to detect the insulator in the rod sub-image instead of scanning through the entire catenary image.

Insulators mounted to the end of rods with different inclination angles in a catenary system of a high-speed railway.
The second contribution of the article is the proposing of our defect detection method. Considering the features of insulators used in the catenary system, instead of dividing the image into ceramic discs, our defect detection method is based on local period estimation. So the defect detection result is not affected by the partitioning result of the insulator and the local features extracted on the ceramic discs. Our method can reliably detect both the common defects of insulators used in the catenary system, namely the breakage of the ceramic discs and the foreign objects clamped between two ceramic discs. Examples of these defects are shown in Figure 2. Inspired by a pitch detection method called YIN, 23 our local period estimation algorithm is designed. The effectiveness of our local period estimation algorithm is compared with that of other commonly used local period estimation methods in this article.
This article is organized as follows. An overview of the proposed visual inspection system for insulator defect detection is introduced in the second section. Rod sub-image extraction is described in the third section. The detection and localization of the insulator based on DPMs is presented in the fourth section. The defect detection method based on local intensity period estimation is introduced in the fifth section. Experimental results are presented and discussed in the sixth section. Finally, we summarize this article in the last section.
Catenary visual inspection system
Our insulator visual inspection system for insulator defect detection includes image acquisition and image processing. An inspection vehicle is used to capture images of catenary systems. As the inspection vehicle moves along the railway, the HD cameras mounted on top of it will be triggered if a pillar is detected. A sketch of the inspection vehicle is shown in Figure 4.
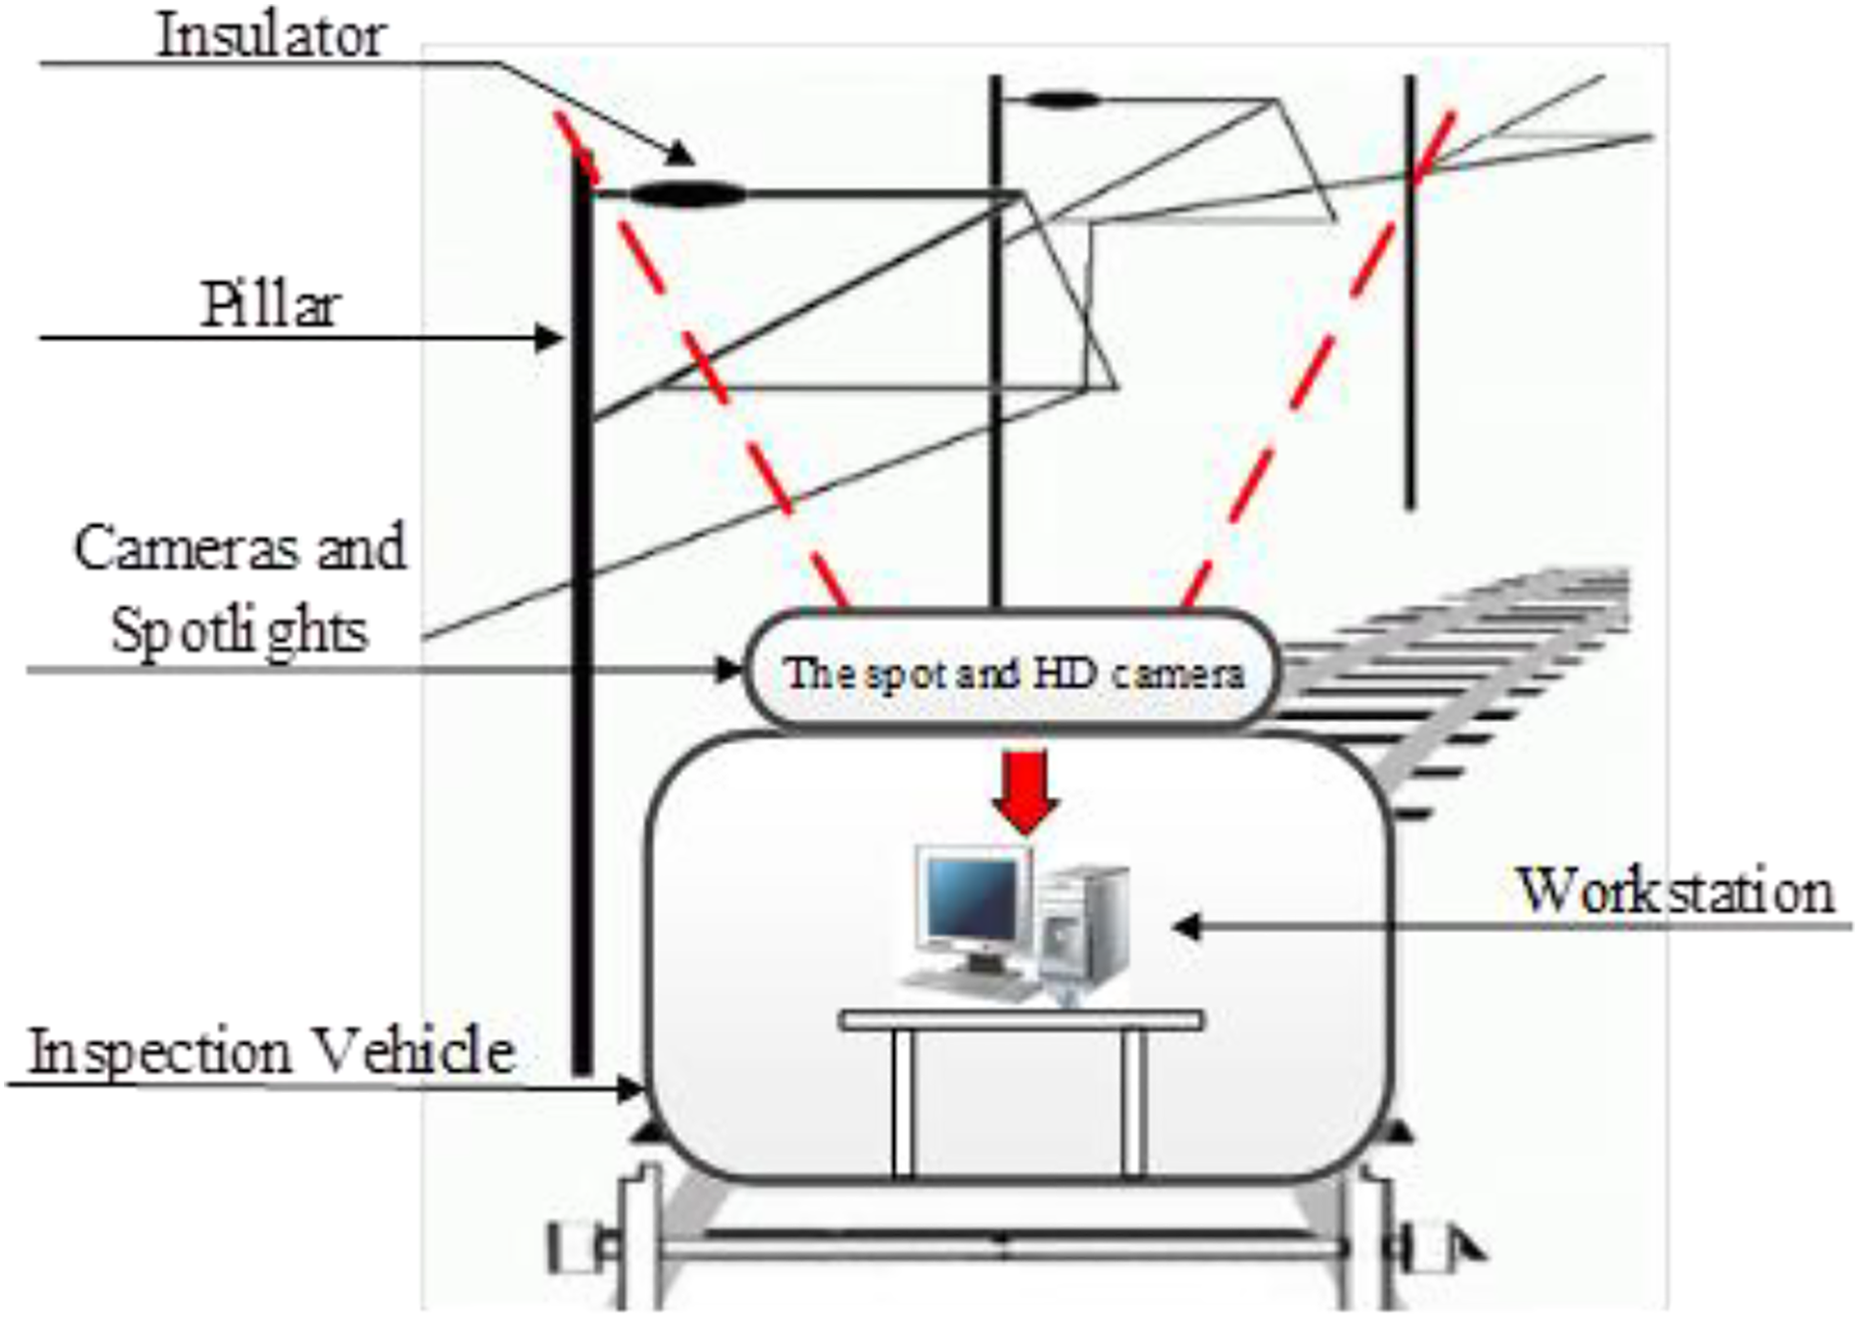
The sketch of the imaging system.
In order to eliminate the interference of the background, the catenary images are captured in the dark. light-emitting diode spotlights are used to provide adequate illumination. The resolution of the image is set to 2448 × 2048, which is adequate for our application. The captured catenary images with the identification number of their corresponding pillar are stored in a workstation. When a defective insulator is detected, the maintenance crew will be able to use the ID to identify the corresponding pillar and replace the defective insulators in a timely manner. The catenary maintenance efficiency can be greatly increased. The extraction of rod sub-images that contain an insulator. Rotation of the extracted rod sub-images to the horizontal direction for insulator detection using DPMs. Insulator defect detection using local intensity period estimation.
Rod sub-image extraction
Figure 5 shows a typical catenary image with an insulator (indicated by a red rectangle) attached at the end of each rod (indicated by a green rectangle). Extracting the rod sub-image for each insulator is the first step of our algorithm. The insulators can be detected by searching along their corresponding rod sub-images using DPMs. This searching strategy significantly reduces the amount of computation.

The locations of the rods (marked with green rectangles) and insulators (marked with red rectangles).
The extraction of rod sub-images includes the following steps. Binarize the catenary image and detect the contours of the connected components (Figure 6(a)). Catenary image is captured in the dark and generally has very good contrast and consistent brightness, which makes the selection of a binarization threshold relatively easy. Detect the segments in the image by grouping the neighboring pixels on the contours that have similar slopes (Figure 6(b)). The detected segments are highlighted in blue. Cluster the segments by grouping the segments with similar slopes and intercepts (Figure 6(c)). Segments in different clusters are highlighted in different colors. Determine the minimal bounding rectangle of each segment cluster (Figure 6(d)). Extend the minimal bounding rectangle of each segment cluster to the edge of the image to generate a rod sub-image and rotate the sub-image horizontally (Figure 6(e)).

The main steps of rod sub-image extraction.
Insulator detection
Depending on the length and the location of the rod in the image, the insulator could locate anywhere along the rod sub-image. Because the insulator does not always locate at the end of the rod sub-image, an insulator detection method must be used to find the insulator and extract an insulator image for analysis.
Deformable part models
DPMs are seen as an extension of the HOG features. Unlike Dalal and Triggs’s method 13 that uses a single filter to model the object’s appearance, DPMs consist of a root filter and a small number of part filters. While the root filter covers the main body of the object, each part filter covers a local area of the object.
Each hypothesis of the object is given with a score by computing the inner product of the filter parameter vector
When detecting an object in the image, a score of the DPMs is computed for each sliding window location. If the score at a location is greater than a set threshold, then the sliding window at this location is considered to include the object.
Training samples
In the DPM training process, both positive and negative training samples are generated by cropping from the images captured using the inspection vehicle. In each positive sample, an instance of the insulator is contained. The insulator takes up most part of the sample image. Insulators captured under different lighting conditions are included in the training data set. Each negative sample is cropped from a random region of the image that does not include an insulator. The training samples are normalized to 252 × 72 pixels. In Figure 7, four positive and negative samples are displayed. In the training process, 187 positive and 2000 negative samples were used.

Positive (top row) and negative (bottom row) samples of insulators for training.
Insulator detection results
The rod sub-images in Figure 8 are examples extracted from the catenary image. In Figure 8(a), the lighting conditions of the two rod sub-images are different. The brighter image on the top is captured in a tunnel as a result of more reflective light. In Figure 8(b), the texture of the insulators is different due to glares. All the insulators in Figure 8 are accurately detected using DPMs, as highlighted by the red rectangles. The performance of DPMs on a testing set with 1755 images and 485 insulators is presented in the “Experimental results” section.

Detection results of the deformable part models.
Insulator defect detection
As mentioned in the “Introduction” section, the breakage of the ceramic discs and the foreign object clamped between two ceramic discs are two common insulator defects. A good insulator has texture that exhibits strong periodicity in the horizontal direction in the extracted insulator image. The surface of the ceramic disc is highly reflective and its gray scale values are relatively high. The intervals between two ceramic discs are the dark areas of the insulator surface. If a foreign object is clamped between two ceramic discs, the periodicity of the texture will be disrupted and the foreign object can be detected by evaluating the local intensity period of the insulator image.
A broken disc could be either at the end or in the middle of the insulator, as shown in Figure 9(a) and (b), respectively. Defects in the middle of the insulator as well as the foreign object between discs can be detected using the same local period estimation method described above. Defects located at either end of the insulator have to be detected differently. Like the gray scale distribution of a broken disc, the gray scale distribution of the ends of the insulator is not periodic either. A broken disc at either end of the insulator (circled in red in Figure 9(b)) may be mistakenly recognized as part of the end of the insulator by the local intensity period estimation method.

Two different situations need to be considered for broken disc detection: (a) the broken disc is in the middle of the insulator and (b) the broken disc at the end of the insulator.
In order to detect all possible insulator defects regardless of their locations, an insulator is divided into three sections for defect detection, that is, the midsection and two end sections. The midsection is periodic (indicated by green rectangles in Figure 9), while the end sections are nonperiodic (indicated by blue rectangles in Figure 9). The division of these sections is based on the local intensity period of the insulator image. First, the original insulator image is divided into the left end section and the midsection. The right end section is then located by flipping the insulator image horizontally. Locating two end sections separately reduces the interference of the width of the local window used in estimating the local intensity period.
Insulator defects are detected respectively in the three sections. In the two end sections, the edge information of the image is analyzed to determine whether the first or the last disc of the insulator is broken. In the midsection, the abnormity of the local intensity period indicates the presence of a foreign object or broken discs. The work flow of our defect detection procedure is shown in Figure 10.

The workflow of insulator defect detection.
Local signal period estimation
Intensity of each row of the insulator image is treated as a one-dimensional gray scale signal for local signal period estimation. Our local period estimation algorithm used is inspired by a pitch detection method called YIN, which has offered a nice performance in speech signal analysis. 23
Figure 11(a) shows an example of a gray scale signal from the image row indicated by a red dashed line in Figure 9(a). A small window of the width ω that is 2.5 times of the largest expected period is selected to calculate the local signal period for each pixel. Figure 11(a) shows a small window Wt
for pixel t. The similarity between Wt
and the gray scale signal is calculated by sliding Wt
along the gray scale signal from t + 1 to t + ω. We use the sum of squared differences to measure the similarity as

where τ is the shift amount of Wt and t is the pixel location. For each pixel t, the similarity function dt(τ) is minimum when Wt is most similar to the section of the signal it overlays.
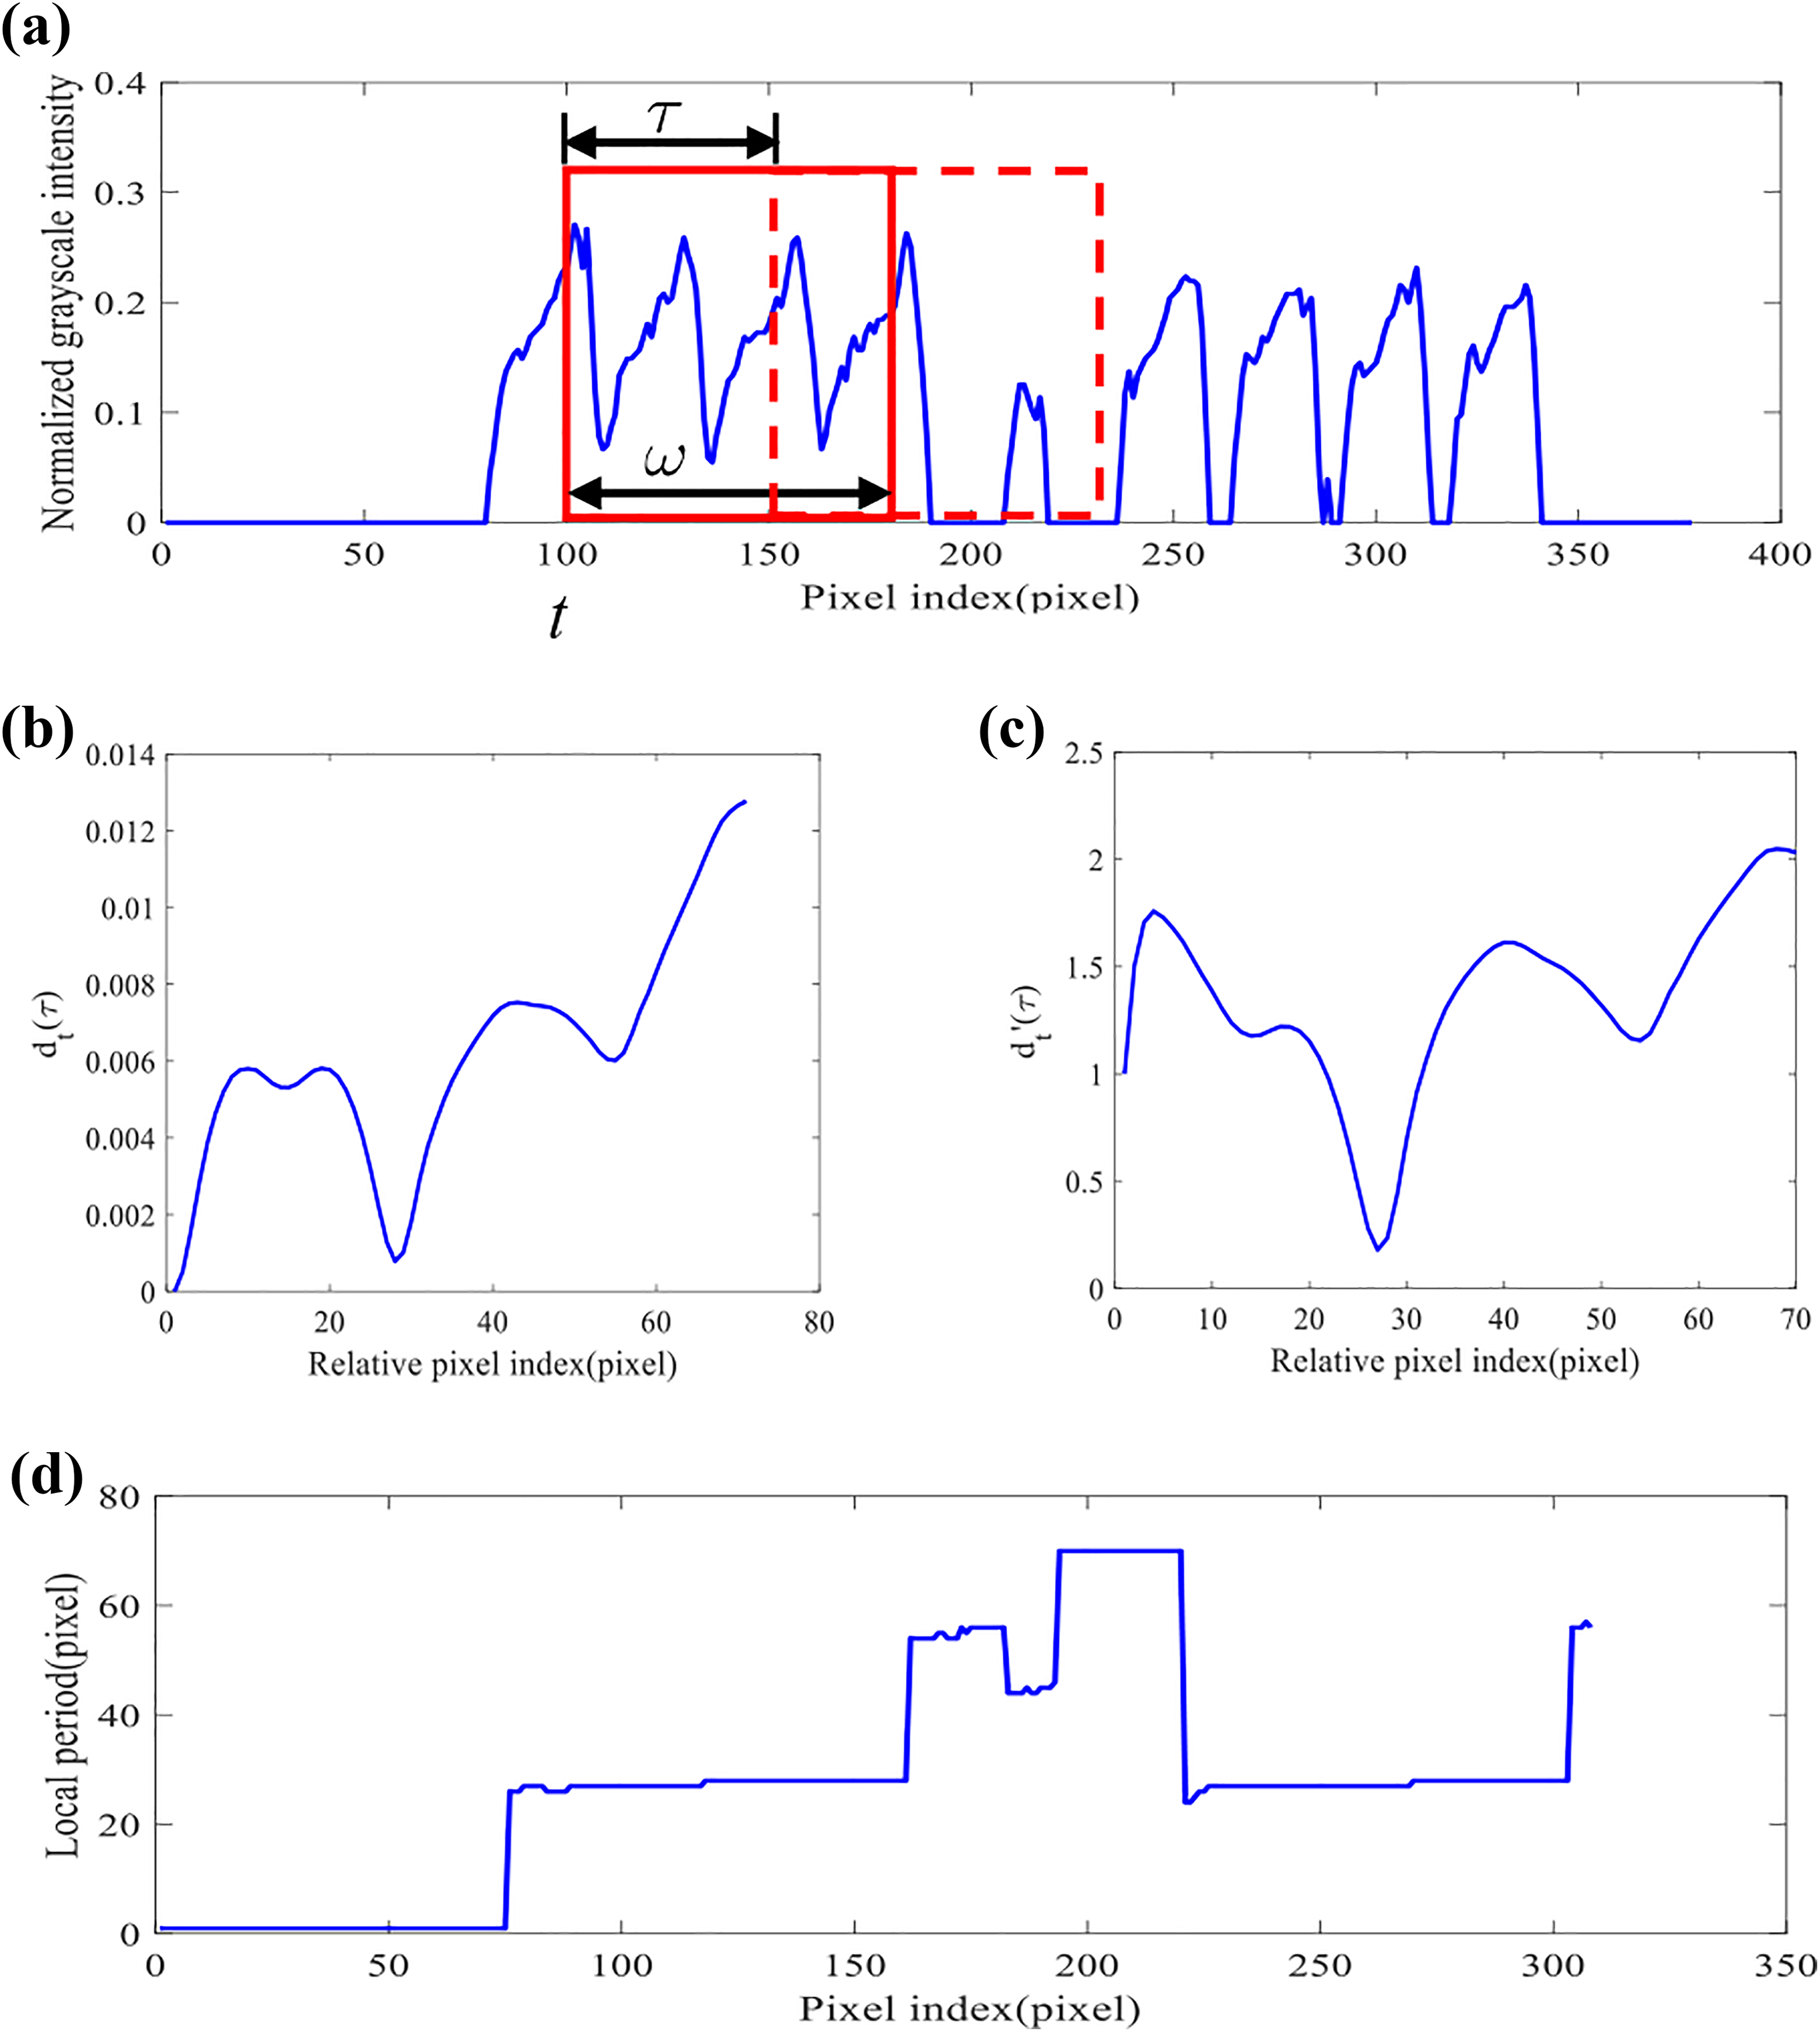
Local period estimation: (a) an example of the horizontal gray scale signal, (b) an example waveform of the similarity measure dt
at t, (c) an example waveform of the normalized similarity measure
Wt reaches the minimum when the shifting distance τ is rather small or when τ is equal to the signal period, that is, Wt is shifted to be aligned with the next cycle of the gray scale signal. Our purpose is to detect the minimum that corresponds to the signal period. To avoid the interference of “zero-lag” minimums, the similarity function dt(τ) in equation (1) is normalized by the cumulative-mean of the signal as defined in the following equation

As an example, the original similarity function
The local intensity period for each pixel along the one-dimensional gray scale signal (Figure 11(a)) can be calculated by repeating the same process. Figure 11(d) shows a plot of all local periods along the red dashed line shown in Figure 9(a). Every row of the insulator image goes through the same process to obtain a local intensity period for each pixel in the image. A local period image can then be formed using the local periods of all pixels.
Division of the insulator sub-image
Three examples of insulators with defects are shown in Figure 12(a) to (c). Figure 12(a) has a few broken discs on the bottom. Figure 12(b) has a foreign object stuck between the fifth and sixth discs from the left. Figure 12(c) has a broken disc at the left end. The local intensity periods for all pixels in each image are calculated using the local signal period estimation method discussed previously to form a local intensity period image. Figure 12(d) to (f) shows the local intensity period images of the three examples. The local intensity period images are rescaled for display.

Division of the insulator sub-image: (a) to (c) insulators with defects, (d) to (f) the normalized local period images of (a) to (c), and (g) to (i) the binary images generated by processing the local period images in (d) to (f).
The mode M of the local period image is calculated as the local period that occurs most often in the image. Pixels with a local period that is larger than M + 5 or smaller than M − 5 are set to zero. Pixels with a local period between M + 5 and M − 5 are set to one. The threshold 5 is selected based on our experimental results. The obtained binary images are shown in Figure 12(g) to (i). Only the largest connected component in the binary image is retained. Small connected components are treated as noise and are removed.
The vertical projections or the number of nonzero pixels in each column of the binary images shown in Figure 12(g) to (i) are calculated and shown in Figure 13(a) to (c). The section of the curve that has higher and more consistent counts of nonzero pixels corresponds to the periodic midsection of the insulator. The left and right sections that have a steep drop in nonzero count are detected as the end sections of the insulator. The division points separating the constant and nonconstant sections are determined as the first and the last points on the curve that satisfy

Division of the insulator sub-image: (a) to (c) the vertical projections of nonzero pixels in each column of the binary images in Figure 12(g) to (i).
Defect detection in the midsection
Defects in the midsection or ceramic region could be one or more broken disc or foreign object. These defects can be detected by examining the vertical projection curve shown in Figure 13(a) to (c). For a good insulator, most pixels in the midsection will have very similar local periods and their vertical projection of nonzero pixels will be fairly close to constant. Broken discs (Figure 12(a)) or foreign object (Figure 12(b)) will cause the vertical projection curve to dip below the constant value. Defects can be detected by measuring these valleys on the curve. A 5-pixel drop (selected through our experiments) between two neighboring columns is considered a defect. Figure 13(a) and (b) shows the detected valleys. The valleys considered defects are highlighted in a red circle.
Defect detection in the end sections
Defect detection for the discs in the end section is different from the midsection. The end sections from Figure 13(a) to (c) are detected using our local period estimation method and are shown in Figure 14(a). The end sections are zoomed in for clarity. If the first or the last disc of the insulator is broken, they will be included in the end section, otherwise the end section will only have the terminal of the insulator.

Defect detection in the end sections: (a) images of end sections from Figure 13(a) to (c), (b) Canny edge detection of (a), (c) horizontal edges detected in the end sections, and (d) vertical edges detected in the possible broken disc region.
To detect the broken disc in the end section, the terminal of the insulator is first removed from the end section. In order to do this, the edge points in the image of the end section are detected using Canny edge detector (Figure 14(b)). These edge maps are eroded and dilated in the horizontal direction to detect horizontal edges that are longer than 15 pixels (determined through our experiments). These edges correspond to the horizontal edges of the terminal (Figure 14(c)). The rightmost point of all the horizontal edges is indicated with a green circle. The region that is to the left of this point is considered as the terminal. The region that is to the right of this point is considered as the possible region of the broken disc, which is indicated using blue rectangles. If no horizontal edges are detected in the end section image, the whole end section image will be considered as the possible broken disc region.
The broken disc is detected in the possible broken disc region. The edge maps are eroded and dilated in the vertical direction in the possible broken disc region to detect vertical edges that are longer than 30 pixels (determined through our experiments). Figure 14(d) shows the vertical edges detected in the possible broken disc region. In this article, the horizontal span of the vertical lines in the possible broken disc region (denoted as W in Figure 14(d)) is used as a criterion to determine whether a broken disc exists. The horizontal span of the vertical lines in the possible broken disc region will be larger because the broken disc also corresponds to vertical lines. Through our experiments, 20 pixels were a good threshold to detect broken discs in the end sections.
Experimental results
The performance of the proposed method was verified through our experiments. The insulator detection using DPMs 17 was compared with the HOG features and SVM classifier. 13 The defect detection using our local period estimation method was compared with other local period estimation methods such as autocorrelation function (ACF), 24 average magnitude difference function (AMDF), 25 and cepstrum analysis. 26 These methods are commonly used in one-dimensional signal analysis. 27 –30 The evaluation of the experimental results of insulator detection and defect detection is discussed in this section.
Insulator detection
The accuracy of insulator detection is important for defect detection. Recall and the false positive per image (FPPI) that are commonly used for evaluating object detection performance were used to evaluate the performance of DPMs. The definitions of these two parameters are listed as follows


where N is the number of testing images. true positive (TP) represents the number of positive insulator samples that are classified as positive. False negative (FN) represents the number of positive insulator samples that are misclassified as negative. False positive (FP) represents the number of negative clevis samples that are misclassified as positive. Recall indicates the percentage of insulators that are correctly detected. FPPI indicates the percentage of non-insulator samples that are mistakenly classified as an insulator.
One thousand seven hundred fifty-five testing images (different from the images used to generate training samples) including 485 insulators were used for evaluation. Table 1 shows the performance of the DPMs and the performance of the SVM classifier trained with HOG features. The DPMs had slightly higher FPPI than HOG + SVM but obtained much better Recall. More insulators can be successfully detected with the DPMs, although the number of false alarms was slightly higher. For this catenary maintenance system, detecting all true defects is much more important than detecting a few extra false positive. False alarms will only increase the workload of the algorithm. So increasing Recall is much more important than decreasing FPPI.
Test results of the insulator detection methods.

FPPI: false positive per image; DPM: deformable part model; HOG: histogram of orientated gradient; SVM: support vector machine.
Defect diagnosis
The performance of insulator defect detection using our local period estimator was evaluated and compared with several different local period estimation methods (including ACF, AMDF, and the cepstrum). Also, detecting true defects is much more important than recognizing good insulators in defect detection. Therefore, when testing each of the period estimation methods, the parameters of the defect detection method were adjusted to ensure that all the defective insulators were detected. Given this condition, the performance of defect detection methods using different period estimation methods was evaluated by their false alarm rates. With a fixed defect detection rate, a lower false alarm rate means better defect detection performance.
The false alarm rates of using different period estimation methods are shown in Table 2. Of the 480 insulator samples detected, 23 of them were with different types of defects (17 were with broken ceramic discs, 6 were with foreign objects clamped between two ceramic discs) and 457 of them were good insulators.
Test results of different period detection methods.

AMDF: average magnitude difference function; ACF: autocorrelation function.
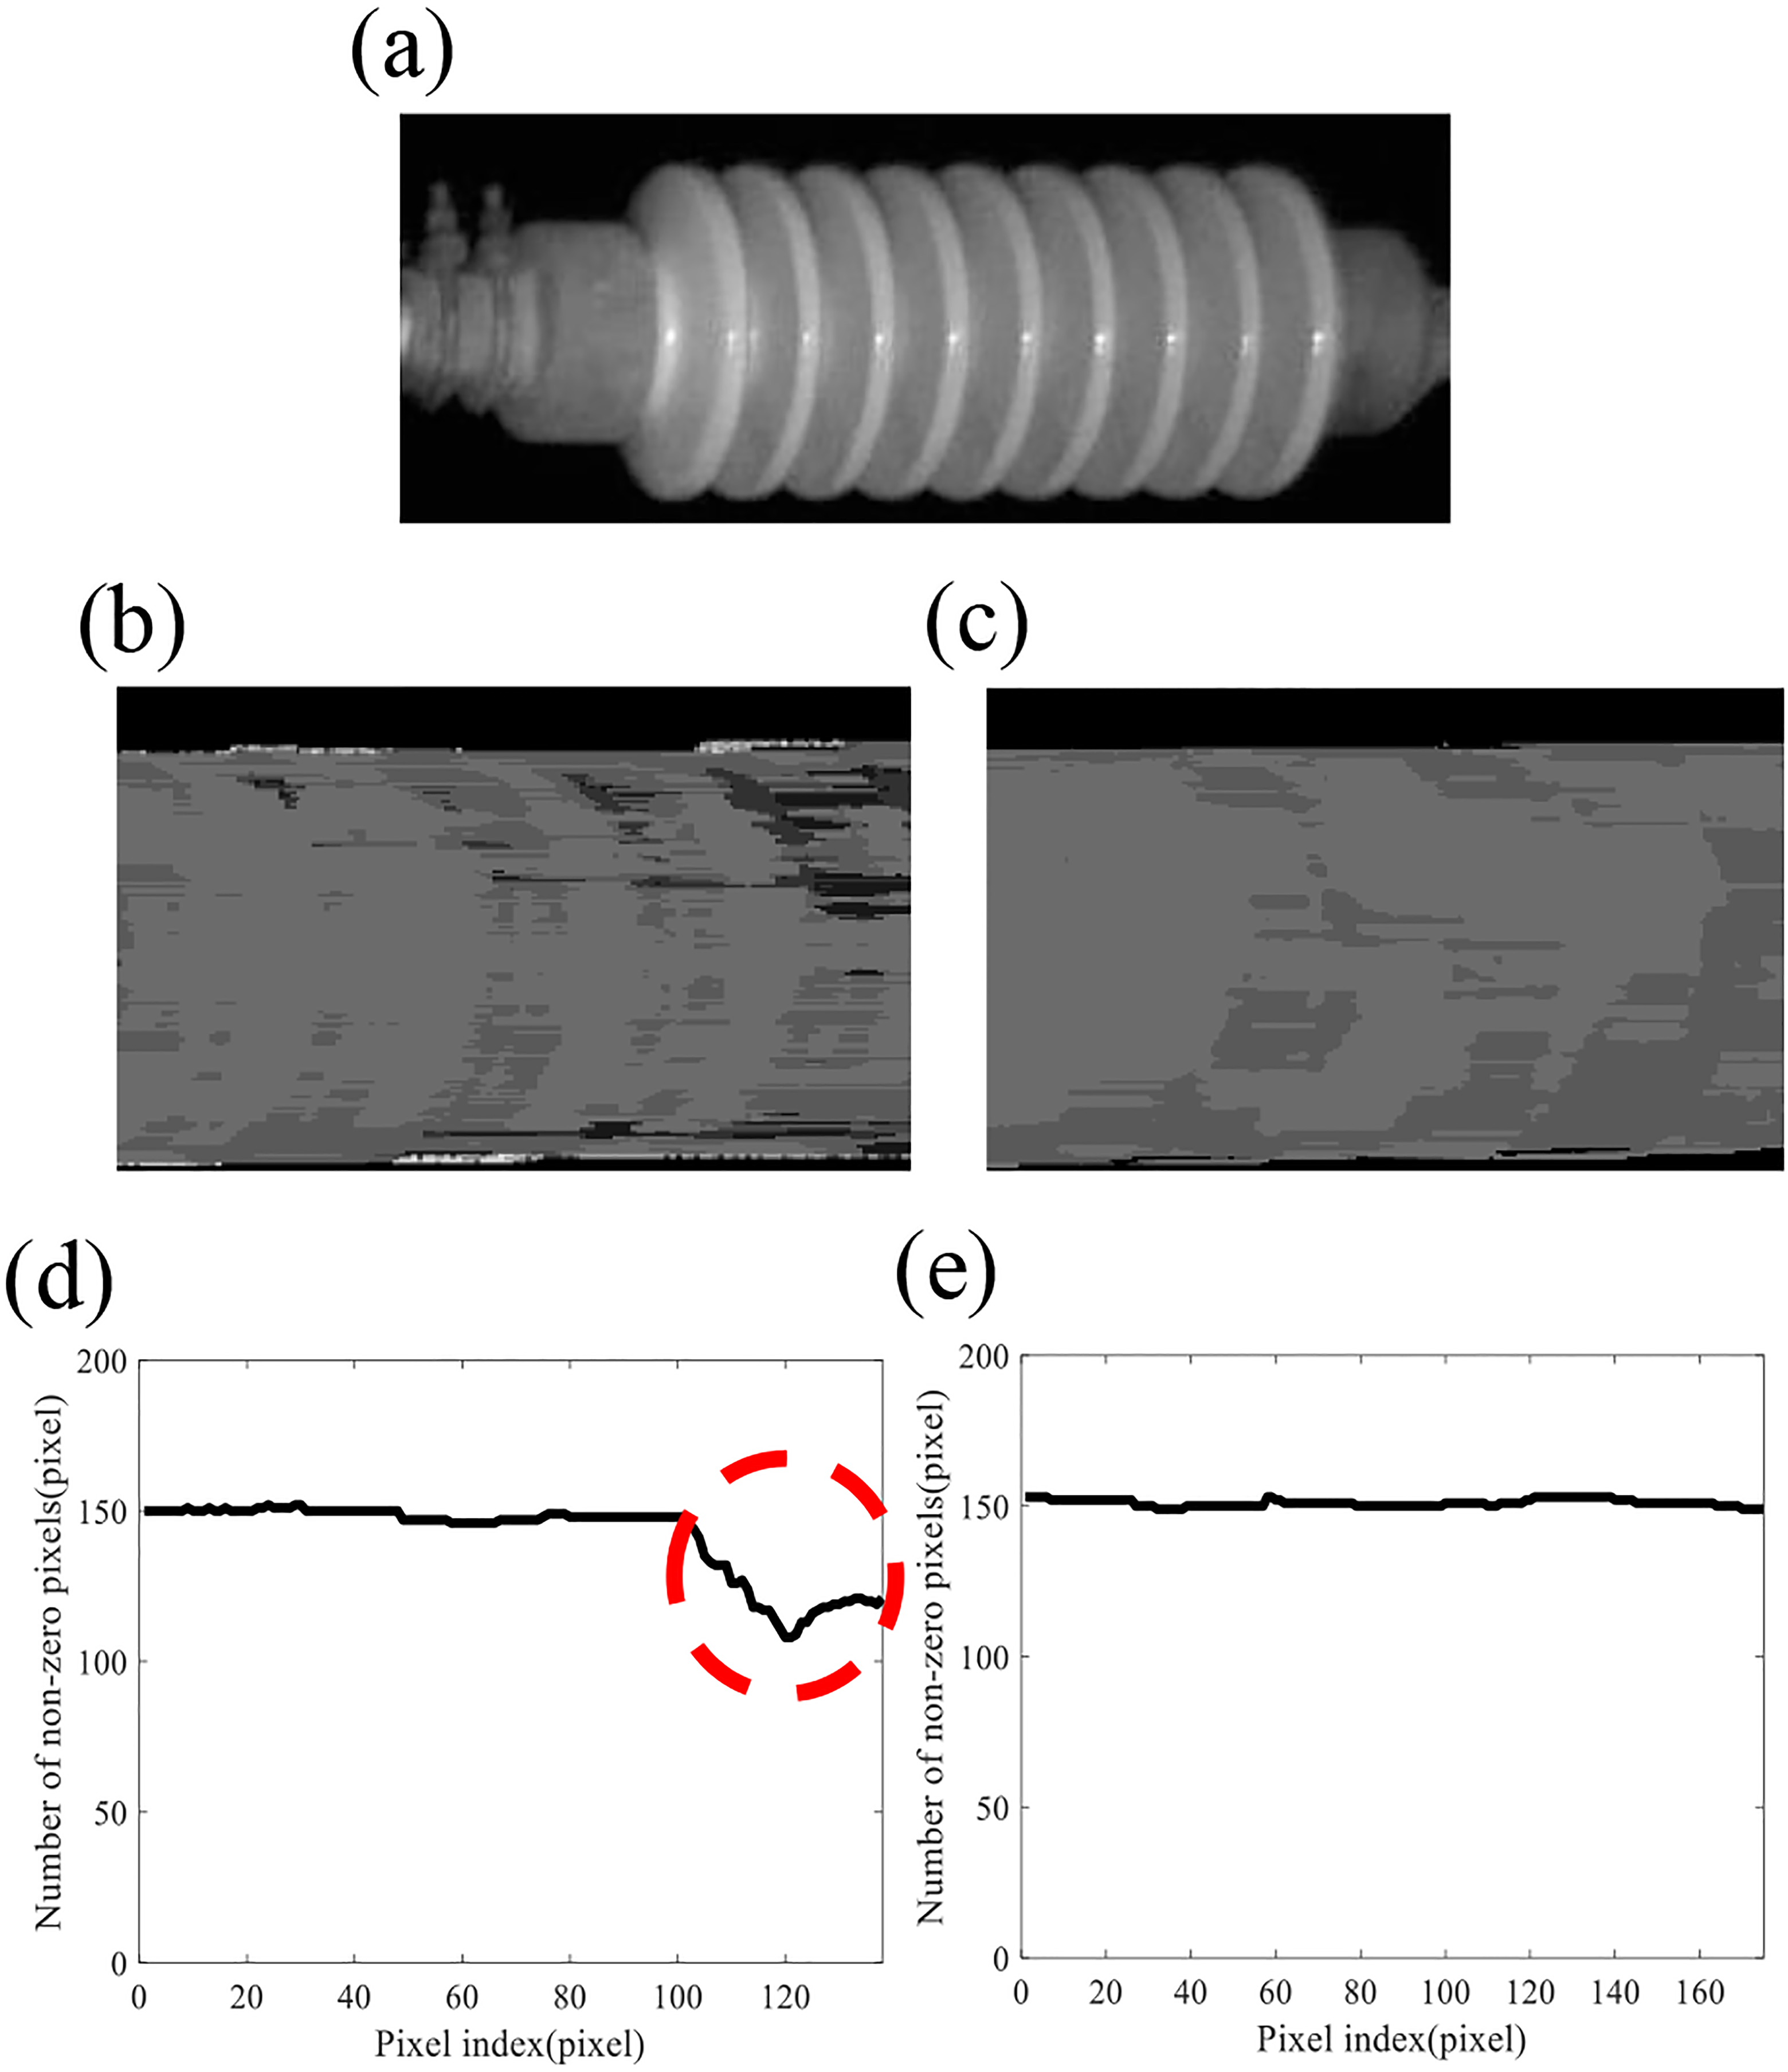
Our local period estimation method had the best performance with the lowest false alarm rate at 9.63% (44 of the 457 good insulators were misclassified as detective). A few example cases are shown in Figures 15 to 17. In these figures, an insulator sub-image is shown in (a). In Figure 15, the defect detection results of our method and the AMDF method are compared. Figure 15(b) and (c) shows the local intensity period images of the midsection generated using the AMDF method and our local period estimation method, respectively. AMDF generated some false periods because it is more sensitive to the nonstationary factor (gradually changing luminance) of the image. Figure 15(d) and (e) shows the vertical projection curves of the binary images generated from Figure 15(b) and (c). Because of the false period values, AMDF classified this insulator as defective and a false alarm was generated.

Comparison of the defect detection result of using AMDF and our method: (a) original insulator sub-image, (b) local intensity period image generated by AMDF, (c) local intensity period image generated using our local period estimation method, (d) the vertical projection curve corresponding to (b), and (e) the vertical projection curve corresponding to (c). AMDF: average magnitude difference function.
Comparison of the defect detection result of using ACF and our method: (a) original insulator sub-image, (b) local period intensity image generated by using ACF, (c) local period intensity image generated using our local period estimation method, (d) the vertical projection curve corresponding to (b), and (e) the vertical projection curve corresponding to (c). ACF: autocorrelation function.

Comparison of the defect detection result of using the cepstrum method and our method: (a) original insulator sub-image, (b) local period intensity image generated using the cepstrum method, (c) local period intensity image generated by using our local period estimation method, (d) the vertical projection curve corresponding to (b), and (e) the vertical projection curve corresponding to (c).
ACF has a similar problem as AMDF. Figure 16 shows the comparison of the defect detection results of our method and the ACF method. Figures 16(b) and (c) are the local intensity period images of the midsection generated using ACF and our local period estimation method, respectively. As shown in Figure 16(b), due to the presence of nonstationary factors, the local period value in the periodic area has a large variance. Figure 16(d) and (e) shows the vertical projection curves of the binary image generated from Figure 16(b) and (c). ACF misclassified a good insulator as defective.
The cepstrum method is more likely to be interfered by the noise in the image than others. Figure 17 compares the defect detection results of our method and the cepstrum method. Figures 17(b) and (c) are the local intensity period images of the midsection generated using the cepstrum method and our local period estimation method, respectively. In Figure 17(b), the periodic area contains many noisy points. These nonperiodic regions in the periodic area will easily be detected as broken discs or foreign objects clamped between discs. Figure 17(d) and (e) shows the vertical projection curves of the binary image generated from Figure 17(b) and (c). A sag (circled in dashed line) can be detected on the vertical projection curve in Figure 17(d). Cepstrum misclassified a good insulator as defective.
In our experiments, the false alarms generated by using our local period detection method were mostly caused by occlusion as shown in Figure 18. Figure 18(a) is the insulator sub-image. Figure 18(b) is the local intensity period image of the midsection generated using our local period estimation method. Figure 18(c) is the vertical projection curve corresponding to Figure 18(b). As shown in Figure 18(b), the periodic area of the insulator was broken in the middle of the image, which leads to a clear sag on the vertical projection curve that generated a false alarm. Apart from the occlusion situation, the defect detection result of our method was very good. The false alarms caused by the occlusion problem can be confirmed manually before sending out the maintenance crew.

The false alarm generated using our method: (a) original insulator sub-image, (b) local intensity period image of the midsection generated using our local period detection method, and (c) the vertical projection curve corresponding to (b).
Conclusion
A computer vision–based method for insulator detection and defect detection for a catenary visual inspection system is proposed in this article. For insulator detection, rod segments detected in the image are clustered according to their slope and intercept to extract rod sub-images for analysis. DPMs are used to detect and localize the insulators in the rod sub-image. For defect detection, the periodicity of the texture of the insulator is analyzed by using a local period estimation method designed specifically for this application. The experimental results show that the proposed insulator detection method can accurately localize the insulators in the image and is not affected by the variance of lighting condition and texture variations. The defect detection method based on our local period estimation method also shows high reliability. Although a small number of false alarms exist, the proposed method can recognize most of the good insulators, while detecting all the defective insulators in the data set.
Footnotes
Declaration of conflicting interests
The author(s) declared no potential conflicts of interest with respect to the research, authorship, and/or publication of this article.
Funding
The author(s) disclosed receipt of the following financial support for the research, authorship, and/or publication of this article: This work was supported in part by the National Natural Science Foundation of China under grants U1434203, 51377136, and 51405401 and Sichuan Province Youth Science and Technology Innovation Team under grant 2016TD0012.