
Abstract
This article proposes a novel wavelet-based algorithm for the fusion of multi-exposed images. The luminance inversion is suppressed and the contrast of the fused image is enhanced, by introducing the brightness of input images into the well-exposedness weight. The weight is used to fuse the approximate sub-bands of input images in the wavelet domain. At the same time, the detail sub-bands of input images are fused by the adjusted contrast weight to avoid losing details around the strong edges. Besides, a novel enhancement function was proposed to enhance the details of the fused image. The proposed multi-exposure fusion scheme consists of three steps: (1) transforming the input images into YUV space and fusing the color-difference components U and V according to the saturation weight; (2) transforming the luminance component Y into the wavelet domain and fusing the corresponding approximate sub-bands and detail sub-bands by the well-exposedness weight and adjusted contrast weight, respectively; and (3) transforming the fused image back into RGB space to obtain the final result. The experiments illustrate that the proposed method is able to effectively preserve details, enhance contrast, and maintain consistency with the luminance distribution of input images.
Keywords
Introduction
As the dynamic range of the common digital camera is limited, it is not possible to simultaneously capture the clear details of dark and bright regions in scenes with a high dynamic range (HDR). This problem can be solved by fusing multi-exposed images. Fusion methods designed to produce the desired image of an HDR scene by multi-exposed images can be divided into two categories: radiance-domain-based and image-domain-based. Methods in the former category need to first generate an HDR image, 1,2 after which the image has to be mapped to a low dynamic range image to display on the monitor using the method of tone mapping 3 –5 ; hence, it is also known as the tone mapping–based method. However, the response function of the camera and the imaging exposure parameters of input images are required when generating an HDR image and the process of tone mapping is time-consuming, all of which narrow down the field of application of this method. Nevertheless, methods in the latter category fuse images with different exposure times without any imaging information and the fused image can be displayed directly. Thus, an increasing number of researchers have been studying multi-exposure fusion.
In the image domain, fusion can be carried out in two main ways: single-scale-based and multi-scale-based. The former approach entails fusing multi-exposed images directly. Goshtasby 6 proposed a fusion method based on the entropy of an image block and a Gaussian function is used to eliminate the seam between different blocks. But the blocks may overlap for different objects, which may lead to the luminance around the strong edges being inverted in the fused image. Li and Kang 7 used contrast and well-exposedness to calculate the fusion weight and used a recursive filter to smooth the weight map. Although the method is able to preserve most of the details, the resulting luminance distribution differs greatly from that of the input images, which is because the relative value of two pixels may be inversed. Such a phenomenon is called scene luminance inversion (SLI). Raman and Chaudhuri 8 used bilateral filtering to calculate the fusion weight of which the value is larger in detail regions. But the fused image has a low contrast and the color is excessively pale because the weights in the smooth region are similar for different input images. Zhang et al. 9 found that if a pixel gradually changes from underexposure to overexposure, it will inevitably pass the best exposure point. Consequently, the best exposure for every pixel can be determined by estimating the change curve of pixel intensity with different exposures. Unfortunately, the fused image regularly appears unnatural when composed of pixels with the best exposure. The gradient amplitude was applied to measure the visibility of details in the study by Zhang and Cham, 10 after which a cross-bilateral filter was used to purify the weight map constructed by gradient amplitude. Optimization-based methods, which are able to guarantee improved fusion performance, were proposed by Kotwal and Chaudhuri, 11 and Shen et al. 12 ; however, these methods are computationally intensive.
Single-scale fusion methods only take the local information of a pixel into account, which may result in the luminance distribution of the fused image not being consistent with that of the input images. The multi-scale-based methods can enhance the details while avoiding the appearance of seams in the fused image. Mertens et al. 13 calculated the fusion weight by multiplying the well-exposedness, contrast, and saturation, subsequent to which input images were decomposed as a Laplacian pyramid to fuse with corresponding weight map. Inspired by the approach followed by Mertens et al., 13 Li et al. 14 enhanced the details in the gradient domain to improve the contrast of the weak detail regions. Malik et al. 15 used wavelet to fuse multi-exposed images based on the weight used by Mertens et al. 13 Because the detail sub-bands of the fused image are obtained by summing up the detail sub-bands of input images and then dividing by a threshold value, the fused image may have dark edges and low contrast at the same time. Li et al. 16 decomposed the input image into a base layer and a detail layer by average filtering, and then used guided filtering with two different sized kernel functions to refine the weight maps for fusion. Li et al. 17 segmented the input image into different luminance levels through k-means clustering and estimated the global layer by choosing the input image with the best apparent exposure. Then, the details are recovered in the gradient domain by a Poisson solver. A nonsubsampled contourlet transform was used by Yang et al. 18 to decompose the input image into different scales, where the detail and approximate sub-bands are fused by the same weight map. The brightness of the dark region is greatly improved by the gain control map, but this would lead to excessive SLI. For multi-scale multi-exposure fusion, the smoothing layer represents the overall luminance distribution of the input image and the detail layer represents the edges and texture. Thus, they should be blended using different weights.
In this article, we introduce the brightness of input images into the fusion weight to solve the problem of SLI. The multi-exposed images are fused in the wavelet domain, which not only enhances the contrast but is also effective in avoiding the loss of details around the strong edges. The YUV color space is used to fuse the luminance component and color-difference component separately for a color image, which results in an improved color quality of the fused image. The experimental results illustrate that the proposed method performs well in terms of detail preservation, contrast enhancement, and luminance distribution consistency with input images.
The remainder of this article is organized as follows. The second section explains the proposed fusion method in detail. The experimental results and discussion are given in the third section. Finally, the fourth section concludes the article.
Proposed algorithm
Overview
Figure 1 shows the flowchart of the proposed multi-exposure fusion algorithm. First, the input images are transformed into YUV space. Then, the luminance component Y is fused in the wavelet domain, whereas the color-difference components U and V are fused according to the saturation weight. The approximate sub-bands of luminance component Y are fused by an improved well-exposedness weight to guarantee that the fused image has good exposure and that it is consistent with the luminance distribution of input images. Simultaneous detail preservation and contrast enhancement are achieved by fusing the detail sub-bands of the input image by the adjusted contrast weight and then enhanced using an enhancement function in the fusion process. Finally, after the inverse wavelet transform of luminance component Y, the fused result is obtained through the transformation from YUV to RGB space.

Flowchart of the proposed algorithm.
Fusion of color-difference component
Most existing multi-exposure fusion methods treat the respective RGB channels with the same rule rather than fuse the color component specially. However, RGB channels not only contain the luminance but also color information. Fusing RGB channels with the same rule leads to color drift, thereby distorting the color of the fused image. To avoid the color distortion in the fused image, the luminance and color information should be separated to fuse with corresponding weight. Hence, we transform the input images into YUV space at first and then fuse both the color-difference and luminance components, respectively.
Taking into consideration the fact that saturation is the measure of the brightness of color, the same as Mertens et al., 13 we also use saturation as the weight to fuse color-difference components U and V. The saturation can be calculated as the standard deviation within the R, G, and B channels (see the following equation)

where u is the mean of the R, G, and B channels

Next, the fusion weight of the color-difference component can be computed by equation (3). A small constant ε (e.g. 0.0001) is used to ensure the denominator is nonzero

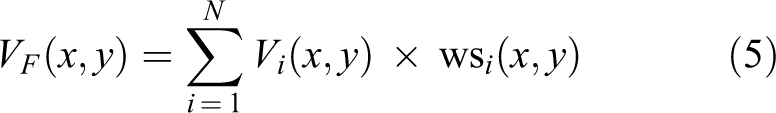
where N is the number of input images and ws i is the saturation weight for a color-difference component of the ith image.
Then the color-difference components U and V of the fused image are computed as the weighted averages shown in the following equations

where UF and VF are the color-difference components of the fused image.
Brightness-preserving fusion weight
The well-exposedness measures how well a pixel is exposed. The desired image should be exposed well (neither over- nor underexposed) and contain clear details. During fusion of the luminance channel Y, it is expected that the fusion weight would be suppressed if a pixel is either under- or overexposed, whereas it would remain large when the pixel is exposed well. The intensity of the over- and underexposed regions is close to 1 and 0, respectively. Thus, pixels with an intensity near the middle of the range should be assigned a large weight, whereas those close to either end of the range should be assigned a small weight. 13,19 The Gaussian function is commonly used to calculate the well-exposedness 13 (see the following equation)

where Yi(x, y) is the luminance component of the ith input image and σ is the standard deviation of the Gaussian function. A small σ value will cause the weight the middle value to exceed that of other intensities by far, which would lead to severe luminance inversion and false contour in the fused image, whereas a large σ will lead to a low contrast in detail region and under- and overexposed region in the fused image. A set of fused images by different values of σ is shown in Figure 2, and the fused images of which are obtained by simply weighted summation of the well-exposedness (see equation (6)). We can find that Figure 2(a) suffers from severe luminance inversion, meanwhile the details in Figure 2(c) are not clear. So, σ is set to 0.2 in this work as in the study by Mertens et al. 13 There is a certain extent luminance inversion in Figure 2(b), which can be solved by the improved well-exposedness proposed in this section.

The fused images by different values of σ. (a) σ = 0.1, (b) σ = 0.2, and (c) σ = 0.3.
We obtain the fusion weight by normalizing the well-exposedness as follows

Although the weight can prevent the fused image from under- and overexposure, it often encounters problems relating to SLI and contrast degradation. Here, we illustrate this phenomenon by considering two pixels with three different exposures, for example, where the value of pixel A from dark to light is 0.2, 0.55, and 0.75 and that of pixel B is 0.35, 0.7, and 0.95. The corresponding well-exposedness values of the two pixels are derived from the plot in Figure 3.
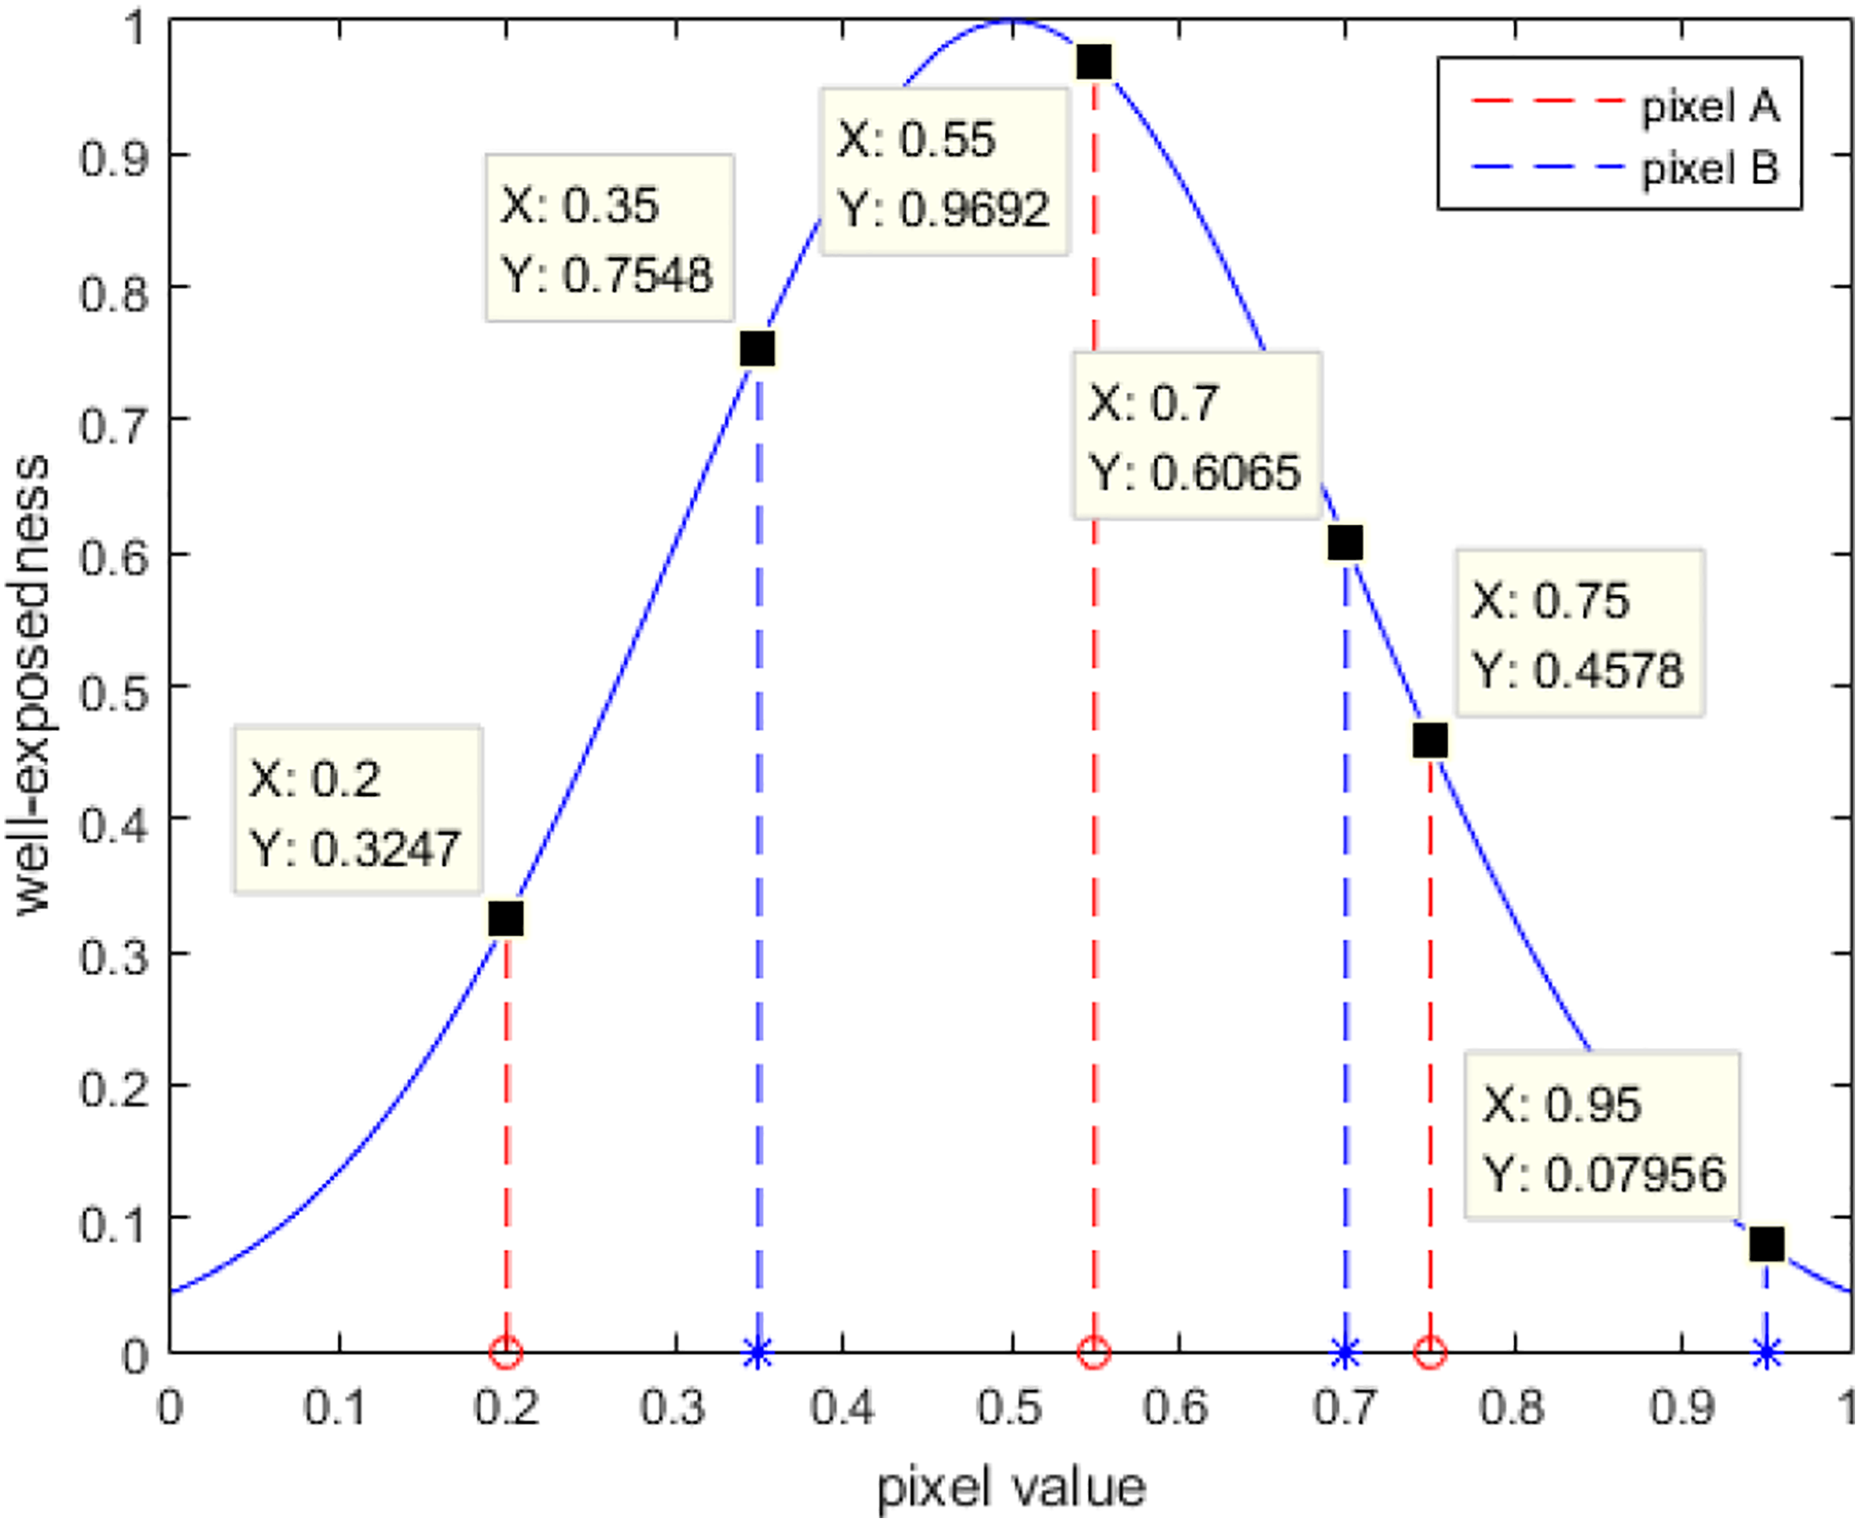
Original well-exposedness of pixels A and B.
According to Figure 3, the values of A and B in the fused image are as follows


The value of A in the fused image is greater than that of B, which is the reverse of that of the input images. The reason for this problem is that the expected values for all pixels in the input images are set to 0.5 regardless of what would be considered a realistic value. 13,19 Maintaining consistency with the input images in terms of luminance distribution requires the relative luminance of the expected values for different pixels to be consistent with those in the input images. That is, the expected value for a brighter pixel should be larger, whereas for a darker pixel it should be smaller. In theory, the relative luminance of the pixels can be represented by any input image, but as there are over- or underexposed regions in a single input image, we choose the average of the brightest and darkest image to represent the relative luminance of all pixels. The calculation formula of the new well-exposedness is given by the following equation

where p(x, y) is the expected value of pixel (x, y), which is the weighted average of the relative brightness of different pixels in the input images and the middle value 0.5 (see equation (9)) is aimed at avoiding over- and underexposure

where β is the weight of the middle value. If β is too large, the fused image will have the problem of SLI, while the fused image is still over- and underexposed if β is too small. To ensure that the fused image is well exposed while retaining the luminance distribution within the input images at the same time, the value of β was set to 0.5 in this work. YD and YB represent the darkest and brightest image among the input images.
The consequent well-exposedness of the two pixels in Figure 3 as calculated by equation (8) is shown in Figure 4.

New well-exposedness of pixels A and B.
According to the new well-exposedness, the values of the two pixels in the fused image are


Now the brightness of pixel B in the fused image is more pronounced than that of pixel A, which is consistent with the brightness of input images; therefore, this illustrates that the new well-exposedness weight can effectively prevent the SLI. Furthermore, we use the original and new well-exposedness weights above to fuse four image sequences. The fused images are shown in Figure 5. It can be seen that the brightness distribution of fused images by the original well-exposedness is not natural and there exists obvious SLI in the areas marked by red rectangles, such as desk in Figure 5(a), the shadow on left of the bookcase in Figure 5(c), the luminance distribution of the roof in Figure 5(e), and the eaves of architecture in Figure 5(g). In comparison, the luminance distribution of fused images by the improved well-exposedness is consistent with that of the input images. Moreover, the contrast of Figure 5(b) and (d) is noticeably improved compared to Figure 5(a) and (c).

Comparison of two different well-exposedness weights. (a), (c), (e), and (g) Fused image with original well-exposedness, and (b), (d), (f), and (h) fused image with improved well-exposedness.
The original well-exposedness avoids over- and underexposed in the fused image, but the luminance distribution of the fused image may be inversed with input images. The improved well-exposedness could obtain an exposed well fused image, in which the luminance distribution is consistent with that of the input images.
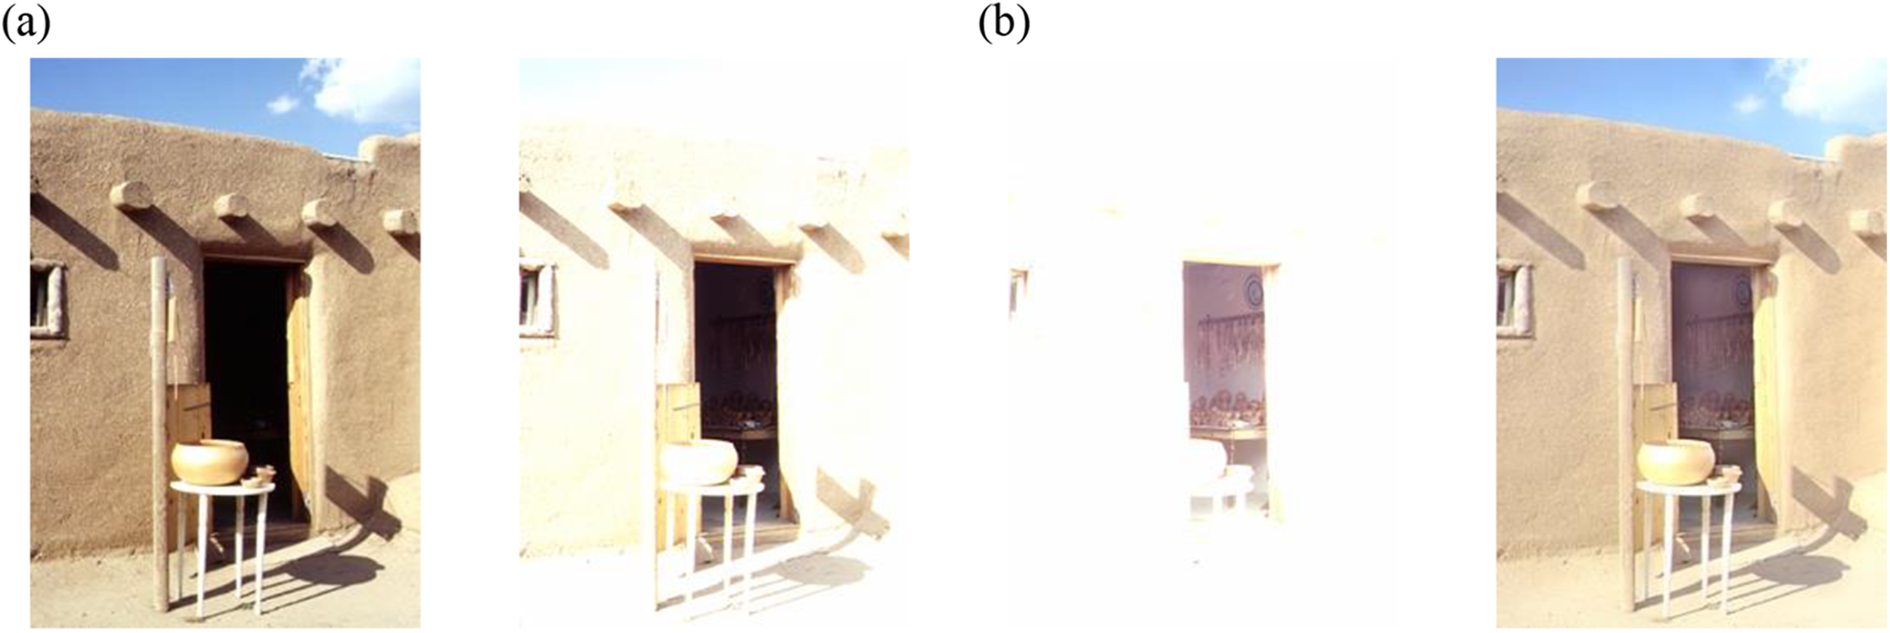
We fused the color image sequence in the RGB and YUV color spaces, respectively. The image in Figure 6(a) is fused into channel R, G, and B, respectively, where the fusion weight is the product of the well-exposedness and the saturation weight. The image in Figure 6(b) is fused into channel Y and U and V with the well-exposedness and saturation weight, respectively. Apparently, the color of the image in Figure 6(b) is much brighter than that in Figure 6(a) in the areas marked by red rectangles. Therefore, the fusion weight of the image in Figure 6(a) is the product of two weights and varies intensely in the spatial domain. This is expected to result in considerable noise in the fused image, whereas this problem does not exist in Figure 6(b). As a result of simply weighted fusion, there are no under- and overexposed regions in the fused image, but the details are not clear, as shown in Figure 6(b). In the next section, we propose a wavelet-based fusion method to improve the contrast and enhance the details of the fused image.

Comparison of fused images through RGB and YUV. Fused image through (a) RGB space and (b) YUV space.
Wavelet-based image fusion
We propose a new fusion rule based on wavelets for multi-exposed images. Our approach differs from the simple summation of the detail sub-bands of input images in the method of Malik et al., 15 in that we fuse the detail sub-bands with an adjusted contrast weight, and the details of fused images are enhanced to a different extent with an enhancement function.
Wavelet transform is a new technology of multi-scale analysis for image, which is called image microscope, because it can decompose the image into different scales and different resolutions through the high-pass and low-pass filter. We can obtain different detail sub-bands and approximate sub-band through the wavelet transform. The detail sub-bands contain the information of details and edges, while the approximate sub-band contains the contour of the original image. In order to avoid over-enhancement of the strong edges and under-enhancement for the weak details, it is necessary to do different degrees of enhancement in the fusion process for different scales of details. The wavelet transform is used to obtain the different scales of detail sub-bands and approximate sub-band in this article.
We apply a discrete wavelet transform (DWT) to the luminance component Y of N input images up to M levels, and obtain all the sub-bands as follows

where
Then, we apply the DWT in the same way to the well-exposedness weight map and obtain approximate sub-band

Thus, the approximate sub-band of the fused image is attained by the following equation

The detail sub-bands reflect the edges and texture of input images, and the fusion result of detail sub-bands has a decisive influence on the contrast and visibility of details. Mertens et al. 13 used the same weight map to fuse all detail sub-bands of a Laplacian pyramid. When the decomposition level is small, the contrast of the fused image is low. At the same time, a loss of detail can be expected to occur near strong edges if the decomposition level is too large.
Our proposed novel fusion rule for detail sub-bands is based on the contrast adjustment and detail enhancement. Not only does the rule preserve the details near strong edges, it also enhances the contrast of the fused image.
The contrast value is large along the edge and in the regions containing texture, which coincides with the detail sub-bands in the wavelet domain. Therefore, we use a contrast map to fuse the detail sub-bands. The contrast map can be obtained by calculating the magnitude of the Laplacian filter response. However, because all the values of the contrast and detail sub-bands along the strong edges are too large, this results in over-enhancement of the strong edges in the fused image. This can be expected to lead to a marked loss of detail and intensive change in luminance, that is, dark areas become darker, whereas bright areas become brighter, as shown in Figure 7(a). The detail sub-bands of Figure 7(a) are obtained by weighted fusion with the corresponding approximate sub-bands of the contrast weight map in the wavelet domain.
Fused images with different rules. (a) Fused image with contrast weight directly, (b) fused image before detail enhancement, and (c) fused image after detail enhancement (M = 7).
Although the details of the fused image, of which the weighted fusion directly in the original image space, are not clear, there are no preceding problems near strong edges (see Figure 5(b)). Thus, we compute the fusion weight of detail sub-bands based on the contrast of the simply weighted fused image. The fusion weight of detail sub-bands is computed by referring to the following equation
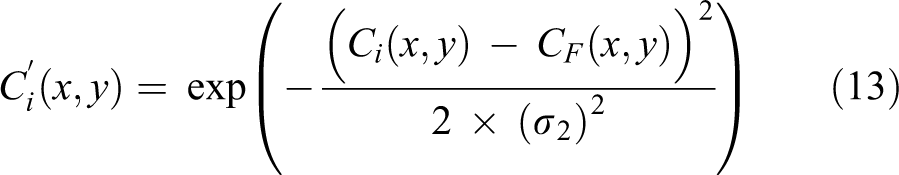
where Ci is the contrast of the ith input image, CF is the contrast of the directly weighted fused image, and σ2 controls the weight of detail sub-bands. When the value of σ2 is very small, the contrast weight of the details similar to that of in the fused image by the well-exposedness will exceed that of other details beyond a lot, which would lead to the low contrast of strong edges in the fused image. The contrast of the weak details will be low if σ2 is too large, but it is not evident because the weak details will be enhanced by the proposed enhancement function. We select the value of σ2 as 1 through experiment.

where wc i is the normalized weight of the ith input image, which is decomposed by the DWT up to M layers. We choose the approximate sub-bands of all layers as follows

The normalization procedure of these approximate sub-bands is the same as determining the well-exposedness weight with equation (11).
If we use the normalized approximate sub-bands of the adjusted contrast weight to fuse the detail sub-bands directly, the strong edges would not have the aforementioned problem, but the contrast of the fused image is quite low, as shown in Figure 7(b). Thus, it is necessary to strengthen the detail component during the fusion process to enhance the contrast of the fused image while preventing over-enhancement of the strong edges at the same time. As shown in Figure 8, the value of the weak details is very small in the low-level detail sub-bands and only the strong edges can be seen in the normalized image. As the decomposition level increases, more weak details will appear in the normalized detail sub-band. In order to enhance the details while suppressing the over-enhancement of the strong edges, we enhance the detail sub-bands by varying degrees along with the decomposition levels. That is, the details in high-level sub-bands should be enhanced greatly, whereas the low detail sub-bands should be enhanced slightly.

Detail sub-bands of different levels in the horizontal direction (after normalization). (a) Original image, (b) level 1, (c) level 2, (d) level 3, and (e) level 4.
Then, the fusion formulas of detail sub-bands are as below

where f(k) is the enhancement function of detail sub-bands. Based on the above analysis, f(k) is a monotonically increasing function. Here, we use a power function to describe the enhancement function, such that f(k) can be described using the following equation

where Max is a large constant, which is set to 12, and Max ≥ M for all the input image sequences. There are two reasons for setting the Max value to 12. One reason is that the decomposition levels M are all smaller than 12 for all image sets in the manuscript. On the other hand, 12 is large enough to decompose input images to different scales of detail sub-bands, so we set the decomposition levels M to Max value 12 for the oversize images. α is the coefficient of the enhancement function, which decides the degree of enhancement for detail sub-bands and n is the exponent of the power function to decide the degree of enhancement for different layers, as shown in Figure 9. The detail sub-bands in high layers are mainly enhanced when n > 1, whereas those in the low layers are also enhanced greatly when n < 1. Hence, the exponent n can be changed for different degrees of enhancement for the different layers of detail sub-bands.
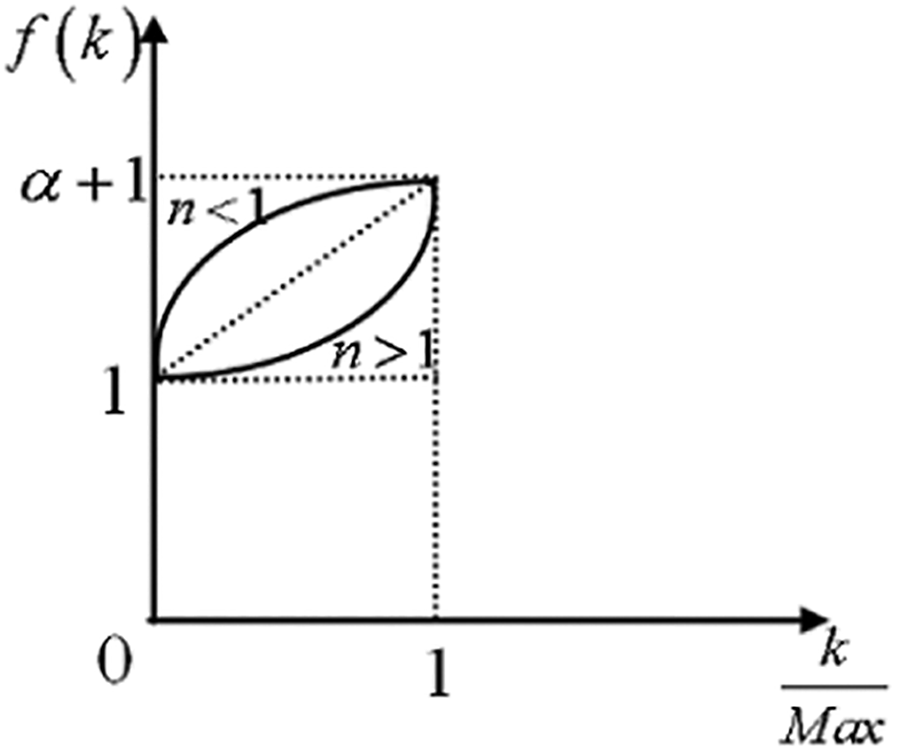
Curve of the enhancement function.
The fused image obtained after enhancement is shown in Figure 7(c), the contrast of the fused image has been clearly improved, and the details around the strong edges are not lost. The multi-exposure image sequence shown in Figure 11(b) is used to compare the results obtained with the multi-scale fusion methods of Mertens et al. 13 and Malik et al., 15 and the fused images are shown in Figure 10.
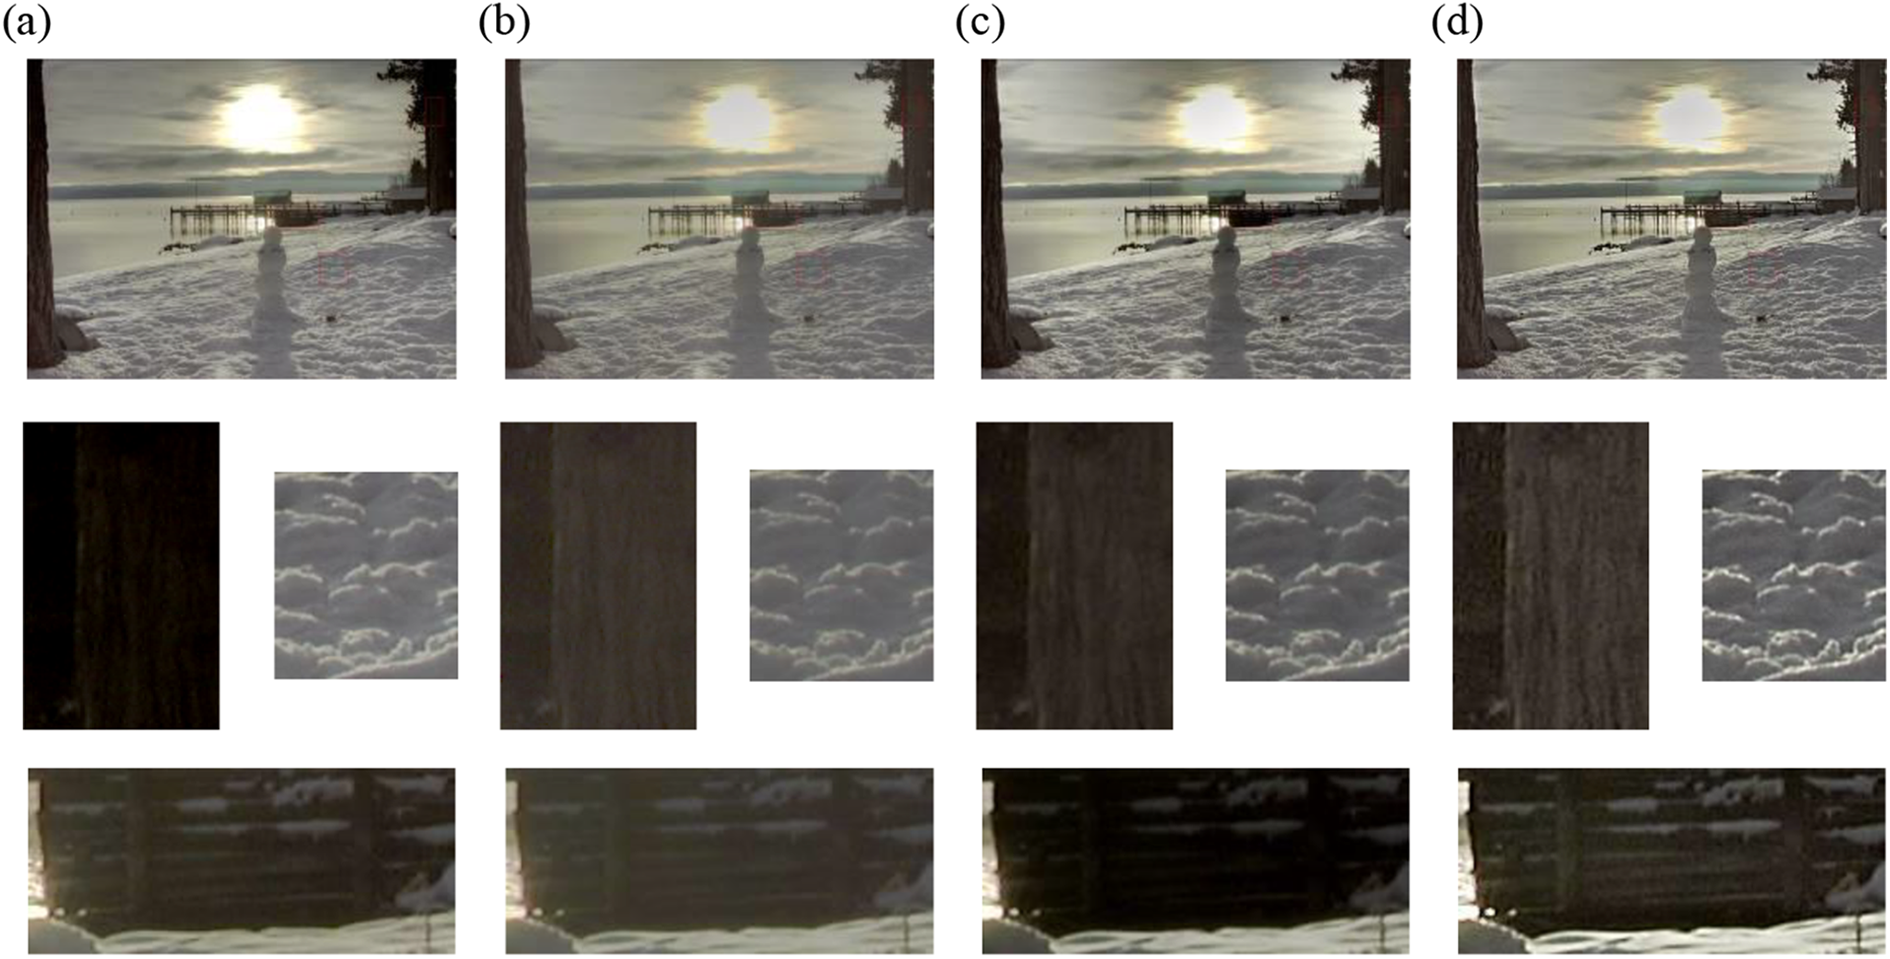

Multi-exposed image sequences: (a) house, (b) tahoe1, (c) groveD, (d) office, (e) nancy_church. (f) treeUnil, (g) vinesunset, (h) clockbui, (i) laboratory, (j) cathedral, (k) centreSportif, and (l) oaks. ((a) Courtesy of Mertens, (j) sequence courtesy of Max Lyons, and (i) sequences are obtained by ourselves with different exposure time, other sequences are courtesy of HDRview). HDR: high dynamic range.
Figure 10(a) shows the result of fusion using the method of Mertens et al. 13 with default parameters. We can see the image is too dark in the region of the tree with an accompanying loss in texture. The approximate sub-bands of the images in Figure 10(b) and (c) are obtained by the proposed well-exposure weight, and the corresponding detail sub-bands are fused by the rule proposed by Malik et al. 15 with different parameters. Intuitively, the contrast in Figure 10(b) is very low in certain regions, such as those depicting snow and a tree, shown in the second row of Figure 10(b). Although the detail sub-bands of the fused image might increase through a decrease in the threshold for contrast enhancement, it would cause the appearance of dark regions and the loss of details in the fused image (see Figure 10(c)). The fused image obtained using the proposed method not only preserves most details of the input images but also produces good contrast.
Experiments and analysis
Image sequences and executable program in our experiment
The image sequences used in this article are shown in Figure 11.
We compared the results of the proposed fusion method with five other different fusion methods (i.e. those of Mertens et al., 13 Li and Kang, 7 Zhang and Cham, 10 Li et al., 14 and Malik et al. 15 ). All the results generated with the four other fusion methods 13,7,10,15 were obtained with default parameters, whereas the fused images of Li et al. 14 were generated by the author himself. The source code of the method of Mertens et al. 13 is available online (http://research.edm.uhasselt.be/∼tmertens/exposure_fusion), and that of Li and Kang is also available online (http://xudongkang.weebly.com).
In addition, our method was also compared with three tone mapping methods, 3 –5 where the results by Reinhard et al. 3 and Durand and Dorsey 4 were generated by the software of luminance HDR (luminance-hdr). And the source code by Shan et al. 5 is available online (http://www.cse.cuhk.edu.hk/leojia/publications.html).
Determination of the parameters of the algorithm
The parameters that need to be determined for the proposed method are coefficient α and exponent n of the enhancement function and the decomposition levels M, where M depends on the size of input images. If M is too small, a large amount of detail is not extracted, which causes low contrast of the fused image, whereas using a value of M that is too large leads to the number of pixels fused by the well-exposedness weight being too small, which causes some regions to remain under- or overexposed in the fused image. We obtain the quantitative relation between M and the size of input images, as in the following equation

where width and height are the size of input images and round() is the function of roundoff. Equation (18) ensures that a sufficient number of pixels fused with the well-exposedness weight and that the decomposition levels are quite large for input images at the same time. Usually, the value of M computed by formula (18) can obtain the desired fused image, but the fused image obtained in this way not be the best for different applications. We can increase M to improve the contrast of the fused image and decrease M to avoid losing the detail.
As shown in formula (17) and Figure 9, α and n determine the degree of enhancement of the detail sub-bands, where α mainly influences the details in the higher layer sub-bands and n mainly influences the degree of enhancement of the details in the lower layer sub-bands. When α is too small, which means the enhancement function is ineffective, the contrast of the fused image remains low (see Figure 12(a)), whereas the detail sub-bands will be over-enhanced when α is too large, in which case the fused image appears unnatural (see Figure 12(b)). When n is too small, the detail components in the lower layer sub-bands will be enhanced greatly, which will lead to a loss of details around strong edges (see Figure 12(c)), whereas the detail sub-bands are enhanced slightly when n is too large, leading to a degradation in the contrast of the fused image (see Figure 12(d)). Our experiments have shown that the fused image is the most well defined when α = 3 and n = 2 experimentally, as shown in Figure 15(f). In addition, the symlet wavelet, that is, sym6, is used in our experiment.
Fused images with different values of α and n. (a) α = 1.4, n = 2; (b) α = 4.6, n = 2; (c) α = 3, n = 1.2; and (d) α = 3, n = 3.2.
Although the fused images are satisfactory in the manuscript, the parameter sets may be not a global optimization by confine of limited image sets. The optimization of parameter sets is a main direction in our next research.
Comparison with other methods
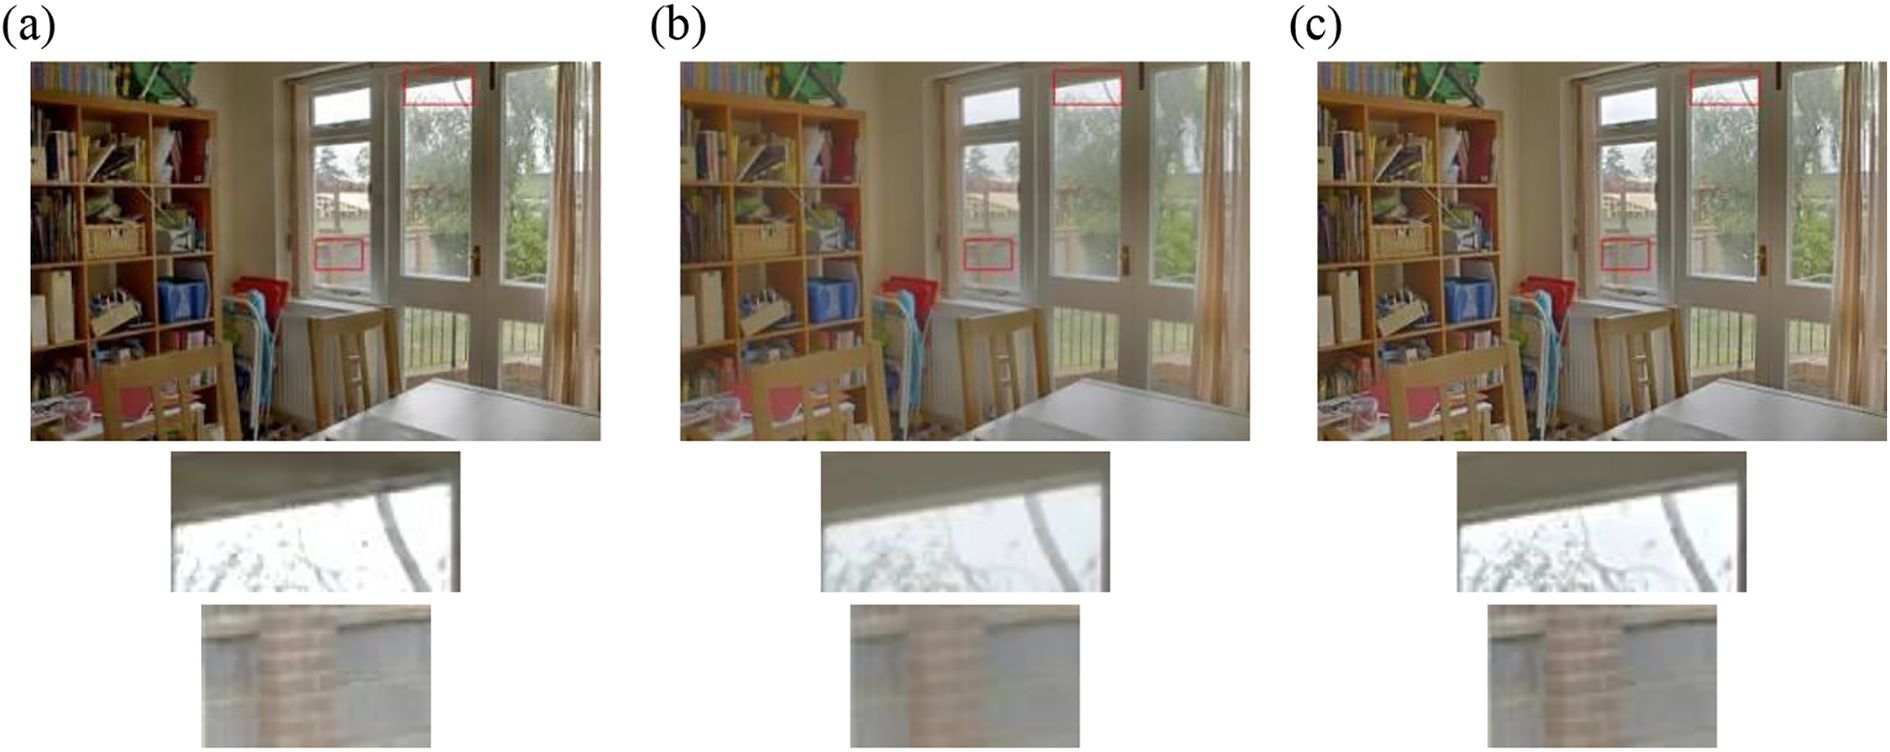
We firstly compared our method with the multi-exposure fusion methods. Our method only uses one free parameter M, which is mentioned along with the fused image in the figures. As shown in the second row of Figure 13, the details have been lost in Figure 13(a), (c), and (e). The third row of Figure 13 shows that the other methods are incapable of reflecting the details of the door handle clearly. In contrast, the key cylinder of the door in Figure 13(d) can be seen clearly. The contrast of the bookcase is low in Figure 13(e), which may be because the threshold value may be too large for the weak details. Additionally, it was also found that the door and window in Figure 13(f) are brighter than those in other fused images, whereas the bookshelf is darker and the two chairs show the least brightness difference (the chairs have almost the same brightness in every input image). All of these results illustrate the effectiveness of our method in preserving details and in producing a consistent luminance distribution with input images. As shown in Figure 14, the images in Figure 14(a), (c), and (d) continue to be affected by overexposure, not only regarding the color of the sky but also in terms of the amount of details of the tree that are lost. The image in Figure 14(f) does not display these shortcomings and exhibits enhanced contrast.


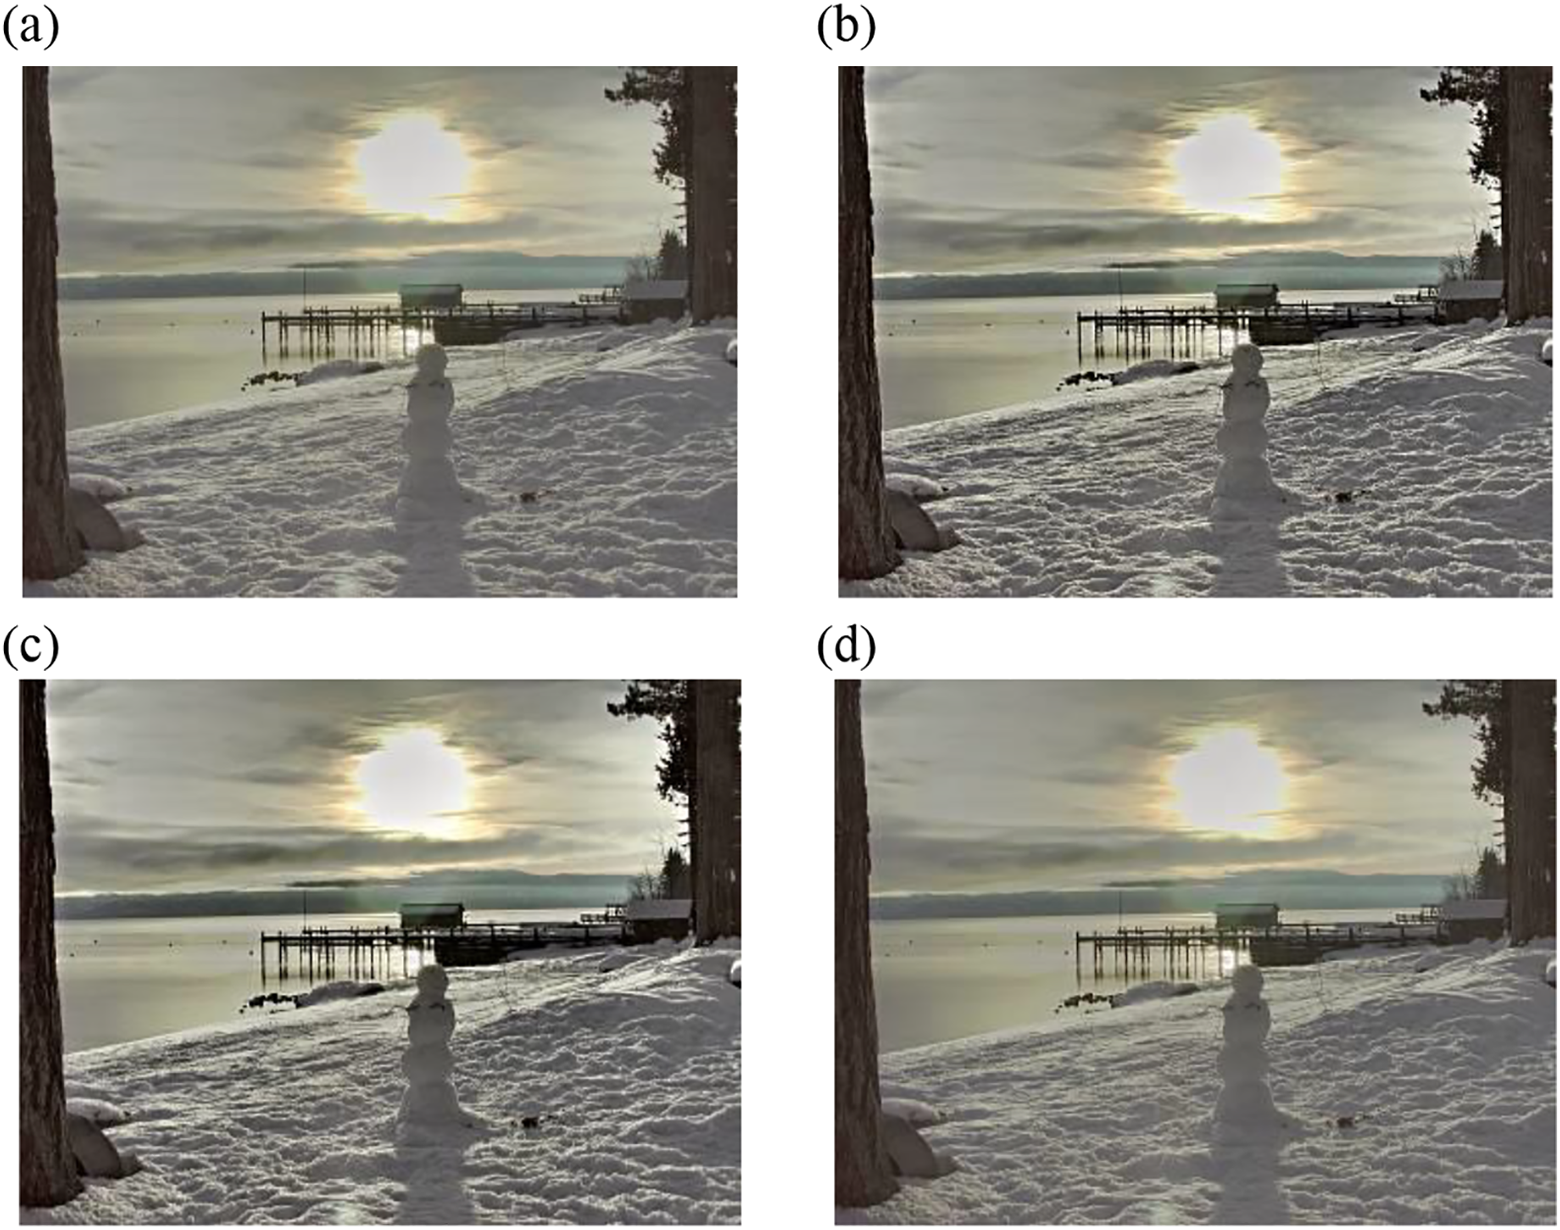
The smooth region of Figure 15(b) displays a marked change in luminance, which implies severe SLI. Figure 15(c) also experiences the same problem, because the image is fused directly in the original space based on local properties. The multi-scale-based fusion method can effectively ensure continuous change of luminance in the smooth region, as shown in Figure 15(a) and (d) to (f). However, the images in Figure 15(a) and (d) remain underexposed and the texture of the tree trunk is not clearly visible. Figure 15(e) appears milky white overall and has low contrast. In Figure 15(f), all the details of input images are preserved and the contrast in the detail regions (such as the snow) is enhanced. In Figure 16(a), (d), and (e), the texture of the window is lost because of overexposure. The middle window in Figure 16(b) appears dark, which is not consistent with the luminance distribution of input images. In contrast, the images in Figure 16(f) do not display these problems and have a satisfactory appearance in terms of contrast.


The performance of the proposed method is also compared with that of three tone mapping algorithms. As shown in Figure 17, the regions of overexposure continue to exist in Figure 17(a) and (b) (see the second row of Figure 17), in which some details of the building and the color of the sky are lost. And Figure 17(c) suffers some artifacts in the edges, such as the buildings, windows, and the paintings. In Figure 17(d), the details of input images are well preserved and the contrast is better defined in comparison (see the third row of Figure 17). In Figure 18, the result of the method of Durand and Dorsey 4 lost the details of the clouds near the sun. The images in Figure 18(a) and (b) are all too dark to distinguish the texture of the tree (see the second row of Figure 18). The result by Shan et al. 5 suffers color artifacts, such as the color of the sky and tree, which all make the fused image look unnatural. It is evident that the contrast seen in Figure 18(d) is the best defined among the four fused images, which is due to the detail enhancing procedure within the proposed method.


Additional results obtained with the proposed method are shown in Figure 19.

Fused images obtained with our method. (a) clockbui (M = 9), (b) cathedral (M = 9), (c) oaks (M = 8), (d) vinesunset (M = 7), (e) treeUnil (M = 8), (f) centreSportif (M = 8), and (g) laboratory(M = 10).
Objective performance comparison
In this section, the objective performance of different fusion methods is evaluated. There are many metrics for image fusion, but most of them are based on the similarity between the input images and the fused image. This is not appropriate in the case of our method because the details of the fused image are enhanced by the proposed enhancement function, such as the metric proposed by Ma et al. 20 for multi-exposure fusion. The metric measures the fused image according to different scales through downsampling based on structure similarity, which results in the evaluation value for the fusion methods based on pyramid decomposition to become large. Zheng et al. 21 used the ratio of spatial frequency error (rSFe) to measure the activity level of the fused image, and we can use this metric to obtain the amount of information lost in the fused image. Thus, we used the rSFe to compare our method with other fusion methods.
Objective evaluation of the proposed method
Table 1 provides the values of rSFe for the fused images by different methods.
Values of rSFe for the fused images by different fusion methods.

rSFe: ratio of spatial frequency error.
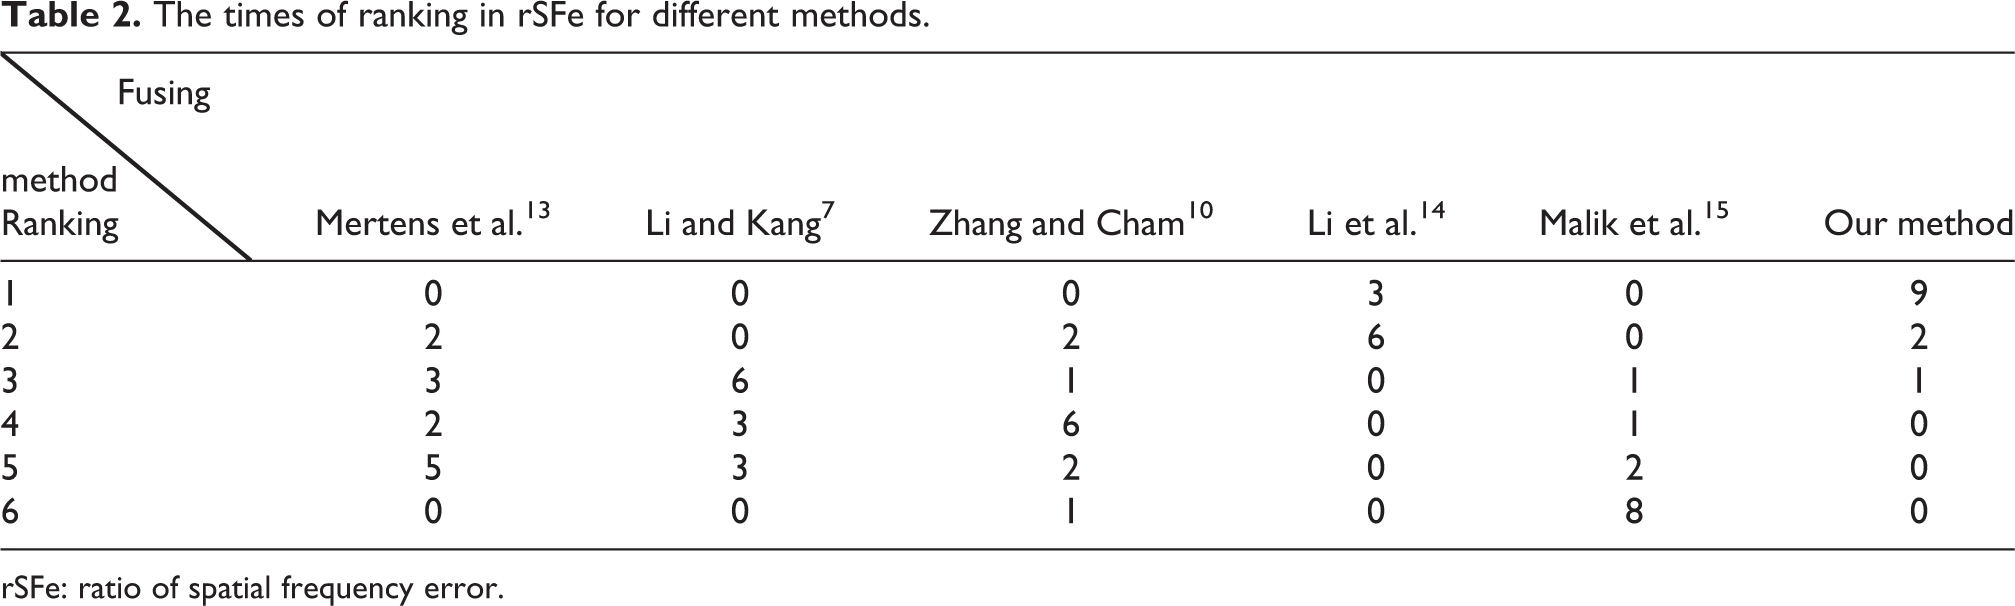
The rSFe is defined as the difference value of the spatial frequency (SF) of the fused image and a reference SF that is computed from input images. Thus, rSFe < 0 denotes an under-fused image, with the loss of some meaningful information or loss of contrast; rSFe > 0 means an over-fused image, with some distortion introduced or contrast enhancement. To clearly illustrate the performance of different methods in rSFe, we sort the value of rSFe from the largest to the smallest for each image set and count the times of the ranking for different fuse methods. The result is presented in Table 2.
The times of ranking in rSFe for different methods.
rSFe: ratio of spatial frequency error.
As can be seen from Table 2, the value of rSFe obtained for the fused image using our method is almost the largest, the times of the first ranking accounting for 75%, which illustrates that preserving information and enhancing contrast in the fusion process through the proposed algorithm are the best. And the fused images by the proposed method do not contain artifacts, which can be seen from the fused images shown and the evaluation result of luminance distribution consistency in the next section. The fusion weight based on the contrast adjusted for the detail sub-bands avoids details being lost around the strong edges, and the improvement in the contrast is owing to the enhancement function. The evaluation results of the fused images tahoe1, nancy_church, and clockbui are very large because input images contain more weak details. The value of rSFe by Li et al.14 is the second largest, which is because that the weak detail regions of fused images are enhanced in the gradient domain. The fused images of Malik et al. 15 get the lowest rSFe value in that the detail sub-bands of the fused image are obtained by summing up the detail sub-bands of input images and then dividing by a threshold value, which would be small for the strong edges and large for the weak details, leading to the loss of the detail around the strong edges and low contrast in detail regions.
Objective evaluation of luminance distribution consistency
As far as we know, the objective metrics intended to evaluate the luminance distribution consistency for image fusion are rarely proposed. In this section, we propose a simple metric to evaluate the relative consistency of the luminance distribution between the fused image and input images. The mean of input images is used to represent the luminance distribution of the original scene

Because the luminance distribution reflects the overall information presented by the fused image, we select pixels with a large interval (50 pixels) to represent the luminance distribution of Lscene. Next, we improve the robustness of the evaluation algorithm by computing the average of the rectangular region of sampled pixels. The efficiency of the evaluation algorithm is improved by setting the size of the rectangular region to 11, which is large enough to remove the influence of noise. These averages are compared with each other to obtain the sequence Seq L of the relative luminance relationship. The value of the sequence is defined in the following equation

where
Then, the same pixels are selected in the fused image and the relative luminance sequence of sampled domains is also computed according to equation (18). The number of the same elements at the same position equals the number of sample domains that has the same relative luminance relationship between Lscene and its fused image. Thus, the evaluation result of the luminance distribution of the fused image F can be computed by the following equation
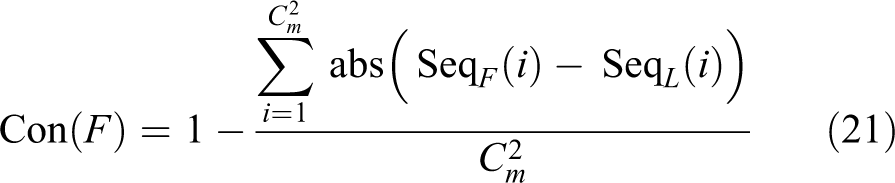
where Seq F (i) is the relative luminance sequence of the fused image.
Using the proposed metric to evaluate the fused images enabled us to quantitatively measure the luminance distribution consistency of all the fusion methods.
The fused image of the “tahoel” sequence obtained using the method of Li and Kang 7 displays severe SLI, which even leads to the false contour in the sky. The corresponding evaluation value is the least among those of the five methods. The fused image of Zhang and Cham 10 presents a similar problem and the evaluation value also remains small. This confirmed that the proposed metric is appropriate to measure the consistency in the luminance distribution of fused images. We also sort the evaluation value and count the times of the ranking to clearly illustrate the evaluation results of luminance distribution consistency. The statistical result is shown in Table 4.
As shown in Table 4, the proposed method performs the best in terms of luminance distribution consistency, which can be seen that the first ranking accounts for 58.3%, and the average evaluation value of the proposed method exceeds those of the other methods from Table 3. And the performance of Li and Kang 7 and Malik et al. 15 in luminance consistency is worse than other methods from Table 4. It is worth noting that although the evaluation values of all methods are relatively high, there are still many regions that experience the problem of SLI because too many pairs of regions are compared.
Evaluation results of the luminance consistency of the fused images with different methods.

The times of ranking in the luminance consistency for different methods.

The efficiency evaluation of the proposed method
We have tested the efficiency of the proposed algorithm. The un-optimized MATLAB, 2015a implementation of the proposed algorithm and other three methods was run on a computer equipped with an i5-6200 2.3 GHz CPU and 8 GB memory. The computation time is given in Table 5. We don’t have the source code of the methods by Zhang and Cham 10 and Li et al., 14 so that the computing time of theirs is compared.
Computation time of different fused methods by MATLAB (second).
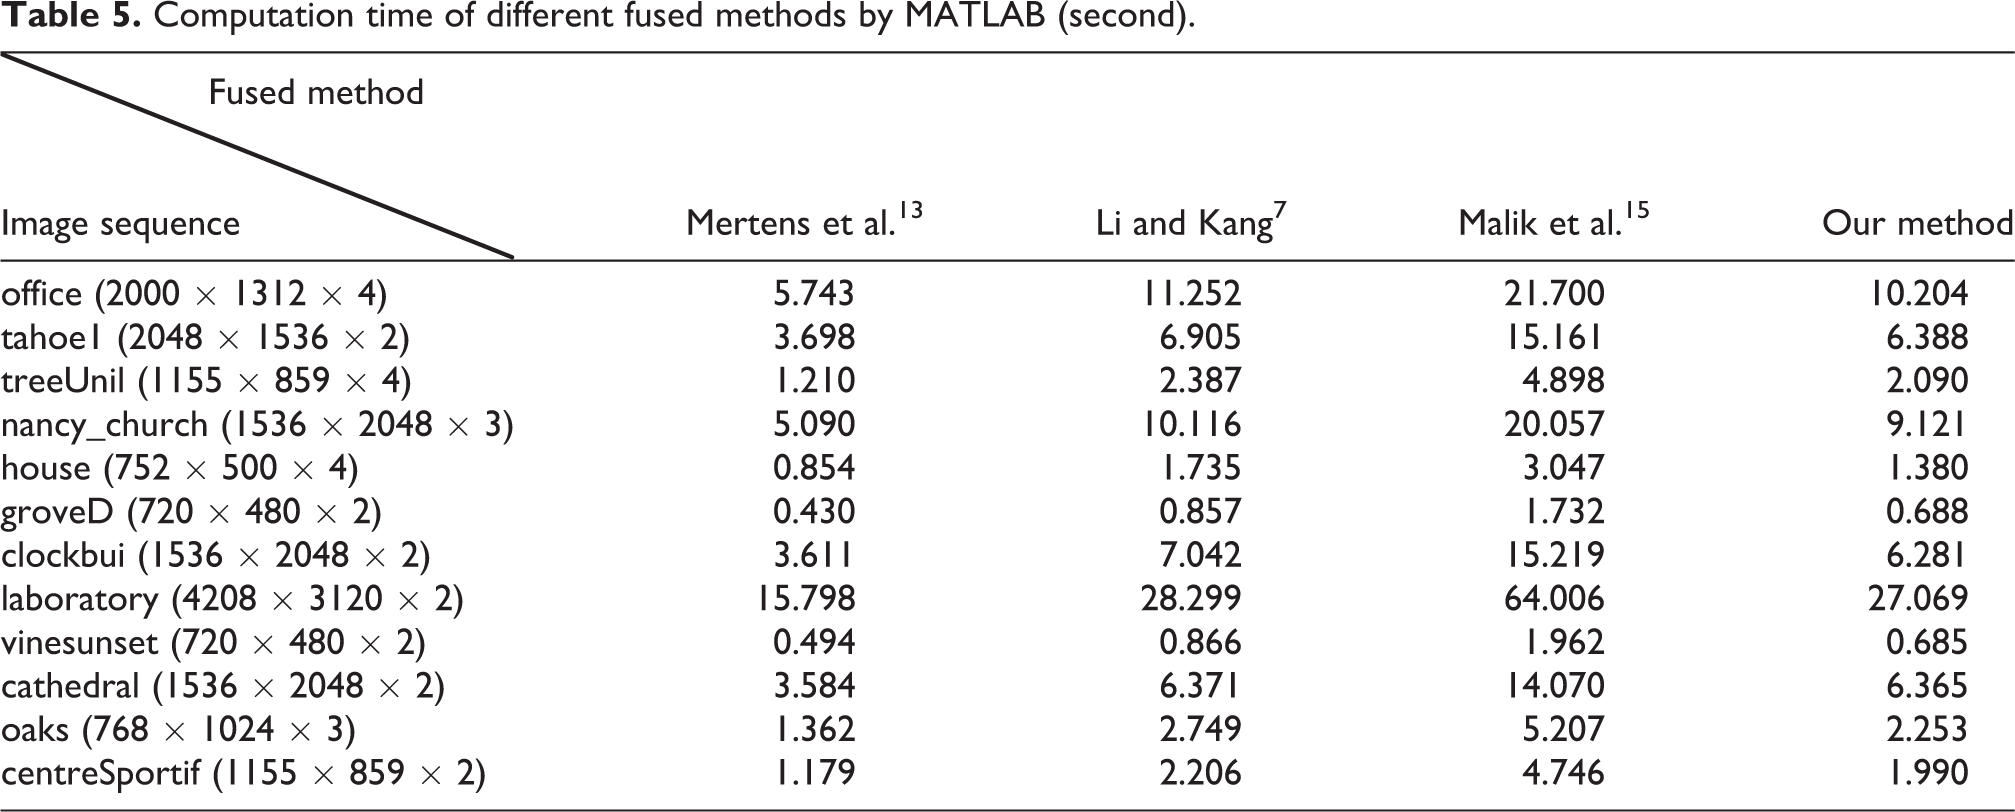
We can see that the efficiency of the proposed algorithm is greater than Li and Kang 7 and Malik et al. 15 and lower than Mertens et al. 13 Because only the luminance component Y is fused in the wavelet domain, that the computing time of the proposed algorithm is much smaller than Malik et al., 15 which fuses all channels of the lab color space in the wavelet domain. We can also find that the computing time of the proposed algorithm is almost proportional to the size of input images from Table 5. The computationally most expensive part of the proposed algorithm is the calculation of the weight maps, wavelet decomposition of input images and weight maps, and weighted summation of sub-bands. The computation of weight maps and weighted summation of the sub-bands is highly parallel in pixel level and it can be accelerated markedly using GPU. The wavelet decomposition of input images and weight maps is parallel in image level, which can also be accelerated markedly using GPU. We have started to program code using CUDA to accelerate the proposed algorithm.
Conclusions and discussion
The multi-exposure fusion method based on a multi-scale analysis can fuse input images in different scales. In this article, we decompose the luminance component Y of input images into the sub-bands of different scales through the DWT. The approximate sub-bands are fused by the proposed well-exposedness weight to ensure the luminance distribution of the fused image consistent with that of the input images, as well as to avoid under- and overexposure. The detail sub-bands are fused by the adjusted contrast weight to prevent the strong edges from being over-enhanced.
In addition, the detail sub-bands are enhanced by the proposed enhancement function to improve the contrast of the fused image. However, during the detail enhancement procedure, the details cannot be enhanced adequately for the low-resolution image. This is mainly due to the fact that both the multi-scale decomposition and the multi-resolution decomposition are executed simultaneously in the DWT, which results in the decomposition level being small for the low-resolution image. As shown in Figure 20, the details of the fused image are not sharper than those of the input images. The problem can be solved using a nonsubsampled multi-scale analysis tool, such as the stationary wavelet transform, so that the decomposition level can be set to a proper constant for all sequences.
Fused image of “door” sequence. (a) Input sequence and (b) fused image (M = 4; image sequence courtesy of SK Nayar).
In the future, we plan to explore new fusion weights with the aim of applying the proposed method to dynamic scenes and multi-focus images.
Footnotes
Declaration of conflicting interests
The author(s) declared no potential conflicts of interest with respect to the research, authorship, and/or publication of this article.
Funding
The author(s) received no financial support for the research, authorship, and/or publication of this article.