
Abstract
Multi-exposure image fusion is becoming increasingly influential in enhancing the quality of experience of consumer electronics. However, until now few works have been conducted on the performance evaluation of multi-exposure image fusion, especially colorful multi-exposure image fusion. Conventional quality assessment methods for multi-exposure image fusion mainly focus on grayscale information, while ignoring the color components, which also convey vital visual information. We propose an objective method for the quality assessment of colored multi-exposure image fusion based on image saturation, together with texture and structure similarities, which are able to measure the perceived color, texture, and structure information of fused images. The final image quality is predicted using an extreme learning machine with texture, structure, and saturation similarities as image features. Experimental results for a public multi-exposure image fusion database show that the proposed model can accurately predict colored multi-exposure image fusion image quality and correlates well with human perception. Compared with state-of-the-art image quality assessment models for image fusion, the proposed metric has better evaluation performance.
Keywords
Introduction
Data fusion has become popular recently and various data fusion algorithms have been proposed. 1 –6 Multi-exposure image fusion is a typical data fusion area, and is considered an effective quality enhancement technique that is widely adopted in consumer electronics. 7 With many multi-exposure image fusion algorithms 8 –13 at hand, it is essential to evaluate their performance. Numerous quality metrics 14 –27 for image fusion have been developed, but few of these measure color characteristics. Therefore, in this article, we propose a method for colorful multi-exposure image fusion assessment.
Multi-exposure image fusion takes a sequence of images with different exposure levels as inputs and synthesizes an output image that is more informative and perceptually appealing than any of the input images. 28,29 In general, the problem of multi-exposure image fusion can be formulated as 30

where K is the number of multi-exposure input images in the source sequence, Xj (i) and Wj (i) usually represent the luminance value (or the coefficient amplitude in the transform domain) and the weight of the ith pixel in the j th exposure image, respectively, and Y denotes the fused image. The weight map Wj often bears information regarding the relative structural detail and perceptual importance at different exposure levels.
In the last few years, numerous multi-exposure image fusion methods have been proposed. 8 –13 The existing multi-exposure image fusion algorithms mainly differ in the computation of Wj . For example, global and local energy weighting algorithms employ global and local energy in source images to determine Wj , respectively. Mertens et al. 8 defined contrast, color saturation, and exposure intensity as measures to compute weights for multi-exposure image fusion. Based on the work of Mertens et al., 8 Li et al. 9 enhanced the details of a given fused image by solving a quadratic optimization problem. Gu et al. 10 extracted gradient information from the structure tensor and smoothed it to compute weights. Edge-preserving filters, such as a bilateral filter, 11 a fast multi-exposure median filter and recursive filter, 12 and a guided filter, 13 have been applied to retrieve edge information to refine Wj . All of these multi-exposure image fusion approaches present diverse fusion performance, as shown in Figure 1. Figure 1(a) shows multi-exposure source images. Figure 1(b) to (i) are fused images generated using the aforementioned multi-exposure image fusion algorithms. 8 –13 One can see that the images in Figure 1(b) and (g) have low brightness. Hence, they may lead to texture information loss. Figure 1(c) and (i) suffer from structure disordering, as highlighted by the red rectangles. In addition, Figure 1(c) contains unnatural artifacts. There are some obvious color distortions in Figure 1(f). Figure 1(h) and (i) present some unnatural black areas, which cause uncoordinated color. Compared with the other fused images in Figure 1, Figure 1(d) and (e) show better image quality. Therefore, it is necessary to conduct studies to assess multi-exposure image fusion quality, to evaluate the performance of different multi-exposure image fusion methods.

With the development of image quality assessment, considerable effort has been made to develop performance measurement for image fusion; these evaluations can be categorized as subjective or objective. Subjective evaluations
14
–16
are reliable but expensive and time-consuming. Most importantly, they cannot be embedded into automated frameworks of systems, which makes them unsuitable for practical applications. Hence, objective algorithms have been developed for image fusion. These algorithms can be categorized into four types.
Based on information theory. Qu et al.
17
adopted summation of the mutual information between the fused and multiple input images to evaluate image quality.
Based on features. Xydeas and Petrovic
18
proposed an edge-based performance measure that computes the amount of edge information that is transferred from the source images to the fused image. A similar idea was employed by Wang and Liu,
19
who retrieved edge strength using a two-scale Haar wavelet. Zheng et al.
20
computed spatial frequency to measure the activity level of the image to estimate the fused image quality.
Based on structure similarity. These algorithms are mostly based on the structural similarity index.
21
Piella and Heijmans
22
combined local image salience with a universal quality index
23
to predict fused image quality. Cvejic et al.
24
and Yang et al.
25
built their quality measures using structural information theory. Ma et al.
30
extracted multi-scale local contrast and patch structures of input images to calculate similarities with the fused image.
Based on human perception. By extracting edge information, Chen and Varshney
26
calculated local saliency and combined it with a contrast sensitive function. Chen and Blum
27
applied the contrast-sensitive function in the frequency domain and preserved local information to measure image quality.
However, most of the aforementioned image quality assessment algorithms only consider fusion cases where there are two input images, which is unsuitable for multi-exposure image fusion. In addition, they suffer from various drawbacks. For example, the mutual information algorithm 17 treats an image as a global entity and attributes a single score to it, without taking individual pixel intensities and regional structures into account. Xydeas and Petrovic 18 only compute the edge similarity between the source and fused image as the evaluator, while ignoring texture information and human perception. The same problem can also be found in the works of Wang and Liu 19 and Zheng et al. 20 Metrics 26,27 estimate the image quality by computing local saliency maps, which unavoidably leads to some background information loss. Algorithms 22,24,25,30 consider the similarities of the source images and fused image based on different weights in grayscale; thus, they are unable to evaluate the quality degradation caused by color information loss. Figure 2(a) and (c) are produced by Gu’s algorithm, 10 while Figure 2(b) and (d) are generated by a global energy weighted algorithm. Obviously, we can see that there exist large differences in color between the two sets of images. The color of objects in Figure2 (a) and (c) is extraordinary and unnatural, which degrades image quality. The mean opinion scores of Figure 2(a) and (b) are 4.9130 and 6.6522, and those of Figure 2(c) and (d) are 3.9565 and 5.0435. However, the quality scores predicted by Mat et al. 30 are 0.9216, 0.9066, 0.8760, and 0.8358, which are not consistent with the mean opinion scores. Therefore, it is necessary to take color information into account in the assessment of multi-exposure image fusion images.

Examples of color information degradation. (a, c) Fused images by Gu et al.; 10 (b, d) fused images by global energy weighted algorithm. MOS: mean opinion score.
To address those aforementioned drawbacks, we propose an objective quality assessment method for colored multi-exposure image fusion based on image texture, structure, and saturation. First, texture similarity is employed to evaluate the performance of image texture preservation. Unlike texture, structure similarity is adopted as a measurement of spatial consistency. With respect to color information, saturation similarity models the accuracy and naturalness of fused images well. Then, an extreme learning machine is used to learn the interaction between texture, structure, and saturation similarities and image quality. Experimental results demonstrate that our proposed model correlates with subjective scores better than other models.
Motivation
A colorful image can be composed of texture, structure, and color information; 31 distortion in the three parts would degrade the overall visual quality. Thus, a colorful image fusion method should correctly combine all these three types of image information. In our algorithm, we employed texture, structure, and saturation similarities to evaluate colorful multi-exposure fusion images.
Texture information
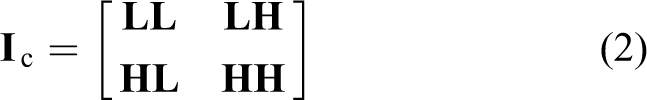
As defined by Shapiro and Stockman, 32 image texture can provide information about the spatial arrangement of color or intensities in an image or a selected region of an image. It has previously been explained that the main information of image texture lies in the middle- and high-frequency regions. 33 –35 The discrete wavelet transform can decompose images into four subbands in low (LL), middle (LH, HL) and high (HH) frequencies, and is often used to extract image texture. 33 –35 Figure 3(b) and (d) are discrete wavelet transform decompositions of the fused images in Figure 3(a) and (c). The middle- (LH, HL) and high-frequency (HH) subimages in Figure 3(b) and (d) contain rich textures of rocks and trees. The amount of texture information contained in the fused image is closely related to its quality. As indicated in Figure 3, there exists a large difference in image quality between Figure 3(a) and (c). The middle- and high-frequency subbands (i.e., LH, HL, HH) in Figure 3(b) have a richer texture than those in Figure 3(d), which is in accordance with the mean opinion score values of Figure 3(a) and (c) of 7.6957 and 4.2609. Therefore, in this work, we use the discrete wavelet transform to extract texture information from images for further analysis.

Structure similarity
Natural images are highly structured, which means that adjacent pixels have strong relevance and carry important structure information of visual content. Maintaining the structural integrity of the source images is a challenging task of multi-exposure image fusion. In most cases, the fused images are subject to structure loss or structure disordering. Wang et al. 21 proposed structural similarity to evaluate image structure distortion. Figure 4 provides a demonstration of the structure similarity maps of two fused images generated from the same source sequence, where brighter regions in the maps indicate better structure preservation. Figure 4(a), which is generated by a local energy weighting algorithm, fails to maintain good structure and its structure similarity map (Figure 4(b)) shows unnatural artifacts around the bold edges of the books and lamp. In comparison, Figure 4(c), which is fused by the algorithm of Li and Kang, 12 shows better structure. Hence, we would like to extract the structure of images based on the model of Ma et al. 30 for multi-exposure image fusion structure assessment.
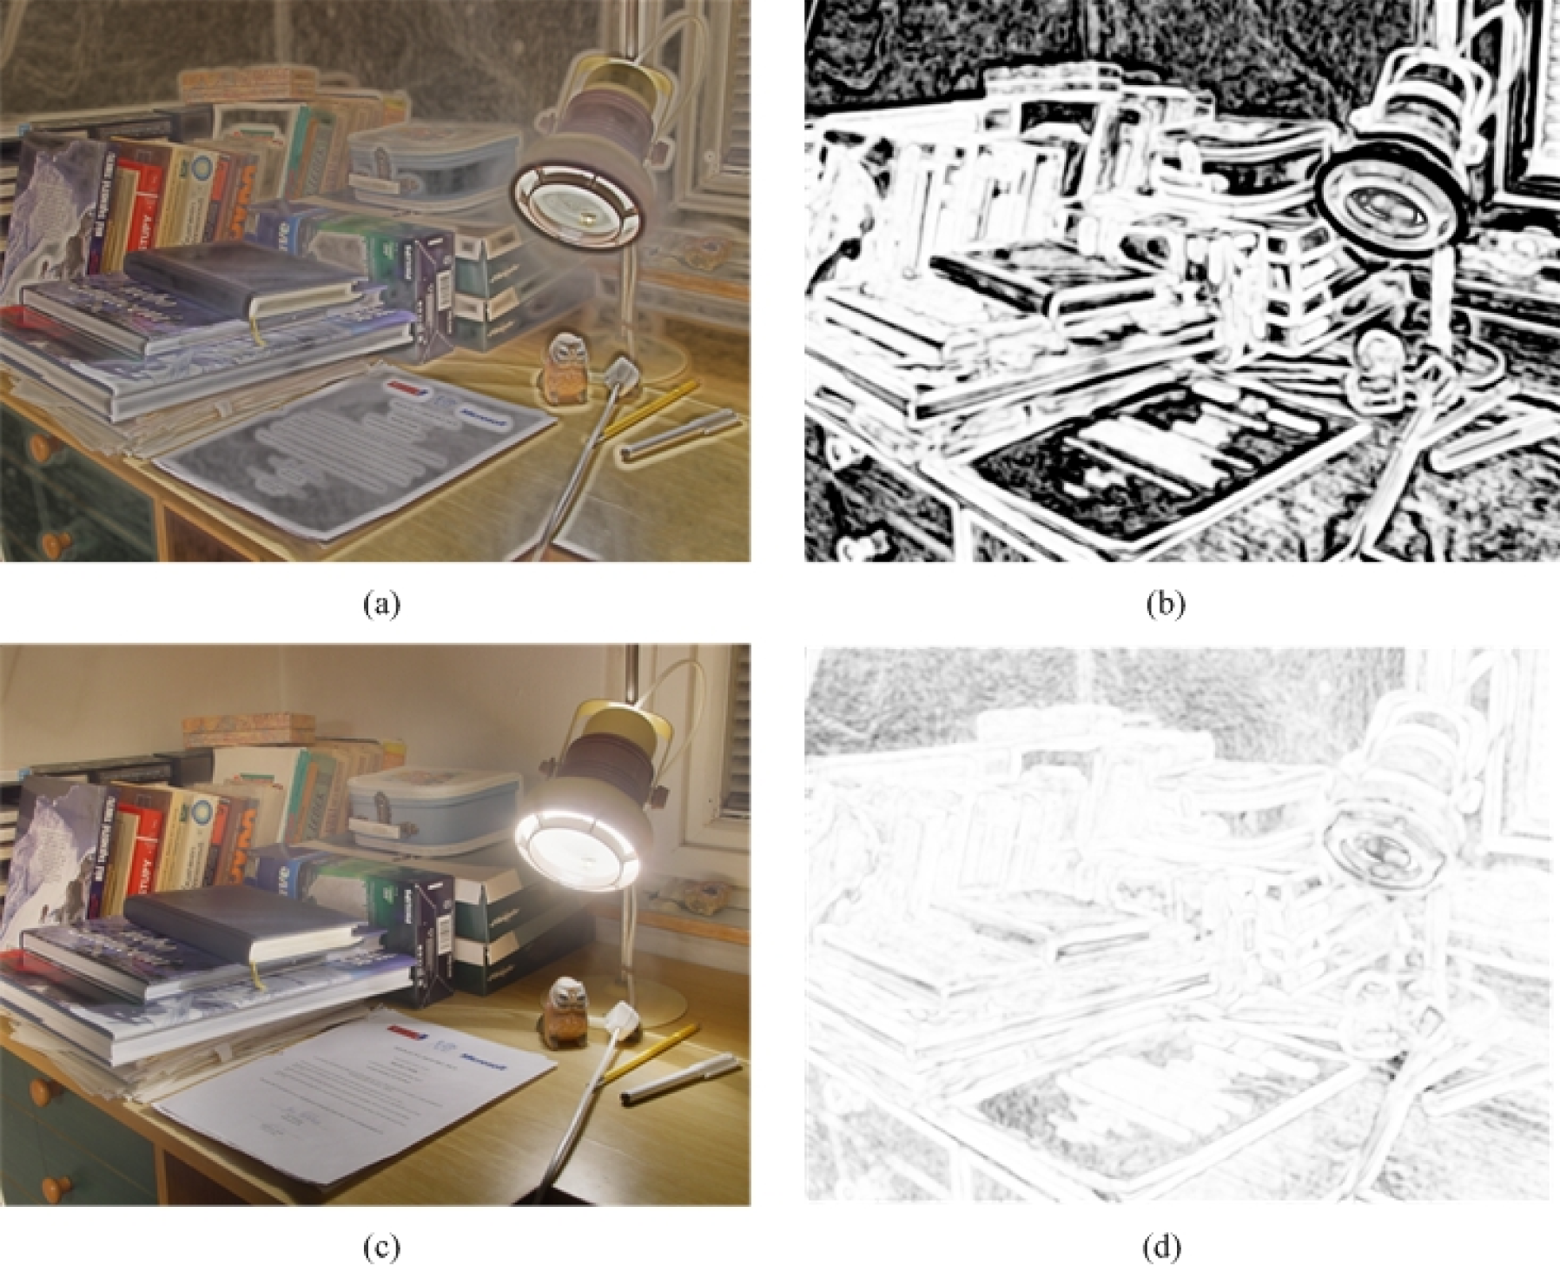
(a, c) Images fused by a local energy weighting algorithm and the algorithm of Li and Kang, 12 respectively; (b, d) corresponding structure similarity maps.
Saturation
The color of images in Figure 2(a) and (c) is obviously distorted and inconsistent with human perception. According to Mohan and Moorthy, 36 saturation is able to describe how human beings naturally respond to color information. Saturation is the colorfulness of a color relative to its own brightness. 37 As shown in Figure 5, pixels with high saturation have bright color. On the contrary, pixels with low saturation have dim color, which means they lose some colorfulness. Therefore, saturation can be applied to evaluate the quality of colorful multi-exposure image fusion.

Saturation distribution map.
Objective quality assessment of colorful multi-exposure image fusion images
Figure 6 shows the flow diagram of our proposed objective quality method for colorful multi-exposure image fusion images. The input source images (multi-exposure images) and multi-exposure image fusion image are colored images. The texture similarity, ascertained using the discrete wavelet transform, the structure similarity, ascertained using the structural similarity index, and the saturation similarity are computed to measure the consistency between source images and multi-exposure image fusion image in terms of texture, structure, and color information. The resultant similarities are thus input to an extreme learning machine to determine the final quality score of the tested fused image.

Proposed model.
Texture similarity
A good fused image should contain a rich texture of source images.
38,39
To estimate texture preservation, we extract the richest texture map from the source images. First, the discrete wavelet transform is applied to the input source images and test fused image. Given an image
where

(a–c) One-scale discrete wavelet transform decomposition results of three source images; (d) maximum wavelet coefficients map of LH, HL, and HH subbands in (a), (b), and (c), respectively. The red and yellow rectangles correspond to the texture of the cave and the trees outside the cave.

Texture similarity calculation. DWT, discrete wavelet transform.
where
In this study, we adopted a three-scale discrete wavelet transform for image decomposition, since the low-frequency subimage LL of the one-scale discrete wavelet transform still contains some image texture. Then the final texture similarity of one fused image is

Structure similarity
As illustrated in Figure 4, the fused images suffer from some structure degradations, such as structure loss or structure disordering. Following the concept of structure similarity, 21 we calculate the structure similarity between the source images and the fused image. Ma et al. 30 built a model to extract the local structure from source images, as

and

where

and

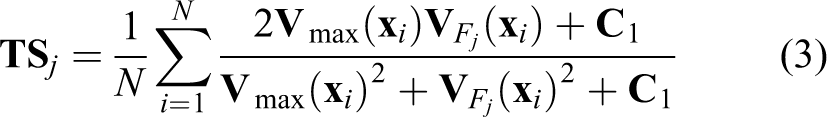
where p ≥ 0 is an exponent parameter and R is used to represent consistency between a set of vectors. In this article, we extract image structure based on the method of Ma et al. 30 and the structure similarity can be computed as

where
where μ
x
and μ
y
are the mean values of
Saturation similarity
Mertens et al. 8 measured the saturation by computing the standard deviation within the R, G, and B channels; this is defined as

where

(a–c) Source images; (d) maximum saturation image. All the pixels are picked up from source images with the maximum saturation. The regions highlighted by red, yellow, and green rectangles in (d) are the most colorful parts of their corresponding exposure images.

where
In this article, the saturation similarity is calculated between the saturation map of fused image and the maximum saturation map to evaluate colorfulness distortion. The saturation similarity can be defined as 40

where
Quality prediction based on extreme learning machine
In this subsection, we are to introduce the quality prediction process of this work. In the literature on image quality assessment, different kinds of method have been used for feature mapping, such as manually designed linear or nonlinear weighted summation or multiplication, 18 –22 neural networks, 41,42 support vector regression, 43,44 , etc. Usually, the manually designed formulas are applied to model the unknown complex relationship between image features and quality score. The learning-based tools (e.g., neural networks, support vector regression) are often time-consuming and suffer from such problems as overfitting and local optimization. 45 Therefore, in this study, we adopt an emergent machine learning technique, that is, an extreme learning machine, for quality prediction.
Huang et al. 45 –47 originally proposed the extreme learning machine for generalized single hidden-layer feedforward neural networks, and it has been used in various applications. 48 –54 The extreme learning machine aims to learn an approximation function based on training data. Suppose that single hidden-layer feedforward neural networks with K hidden nodes can be represented by

where


where θ = (a,b) are the parameters of the mapping function and ∥⋅∥2 denotes the Euclidean norm.
Huang et al. 46 have proved that single hidden-layer feedforward neural networks are able to approximate any continuous target function over any compact subset X with the sigmoid and radial basis function functions. Training extreme learning machines is equivalent to solving a regularized least squares problem, which is considerately more efficient than training support vector machines or learning with back-propagation. Therefore, in our model, an extreme learning machine is employed to map the image features X = [TS SS SAS] into objective quality scores.
Experimental results
In this section, we compare the performance of the proposed algorithm with other state-of-the-art algorithms 18 –20,22,26,27,30,55 –57 on the multi-exposure image fusion database. 30 We analyze the Spearman rank-order correlation coefficients and the Pearson linear correlation coefficients between the objective quality scores and the corresponding subjective scores. Furthermore, a scatter plot of the objective scores predicted by our method versus the subjective scores is also provided, to demonstrate good consistency.
Experimental setup
Database
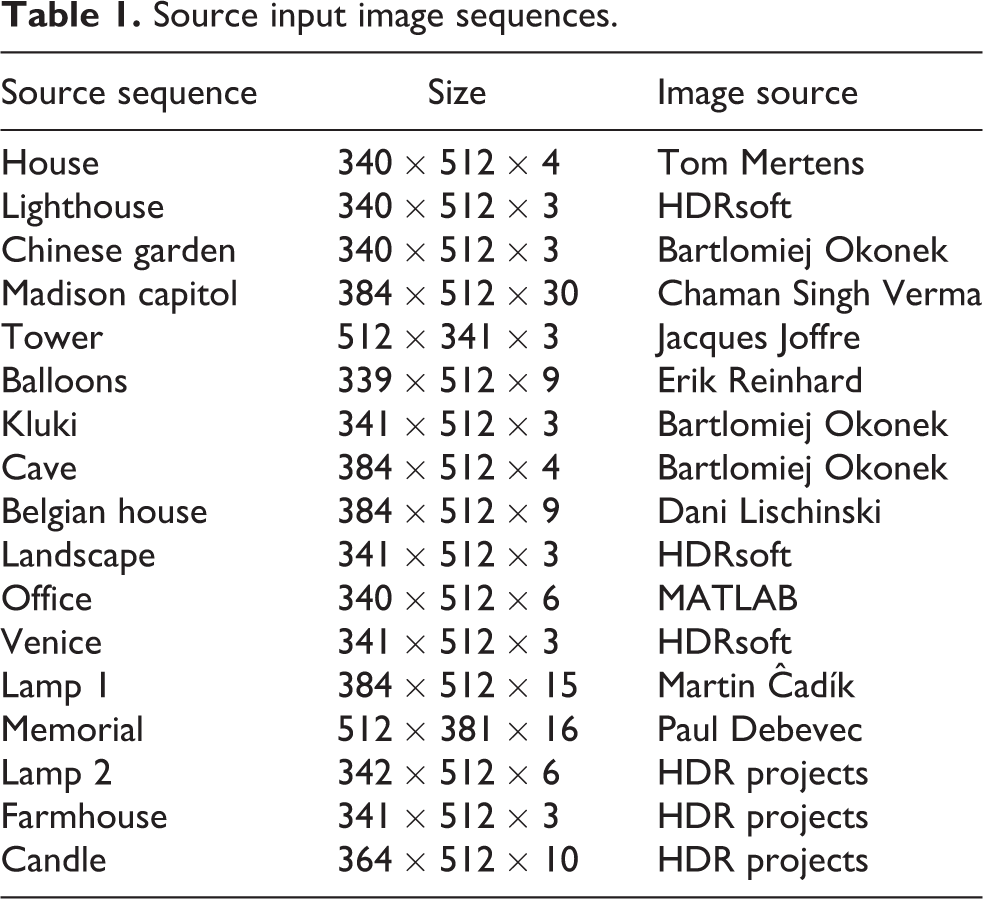
The multi-exposure image fusion database 30 contains 17 natural source image sequences, which are shown in Figure 10 and listed in Table 1. Each source image sequence contains 3 to 30 different exposure images. We choose the best quality source image in terms of subjective evaluation to represent each source sequence, as presented in Figure 10. Eight multi-exposure image fusion algorithms are selected, including (1) global energy weighted linear combination, (2) local energy weighted linear combination, (3) Mertens07, 8 (4) Li12, 9 (5) Gu12, 10 (6) Raman09, 11 (7) ShutaoLi12, 12 and (8) ShutaoLi12. 13 Eventually, a total of 136 fused images are generated, with eight fused images for each image sequence. An example is shown in Figure 1, which includes ten source images at different exposure levels (Figure 1(a)) and eight fused images (Figure 1(b) to (i)).

Input source image sequences in the database. Each image sequence is represented by one image, which is a fused image of the sequence that has the best quality in the subjective test.
Source input image sequences.
Evaluation criteria
As recommended by the Video Quality Expert Group, 58 we use two criteria to evaluate the performance of our proposed image quality assessment model: (1) Spearman rank-order correlation coefficient, which evaluates prediction monotonicity; (2) Pearson linear correlation coefficient to measure prediction accuracy. The relationship between subjective scores and predicted quality scores may not be linear, owing to the nonlinear responses of human observers. A five-parameter logistic regression function is built between the predicted scores and the subjective scores when calculating the Pearson linear correlation coefficient. Assuming that Q and Qp are the predicted scores before and after regression, respectively, the logistic regression function is defined as

where β1, β2, β3, β4, and β5 are regression model parameters.
Parameter setting. The three constants, that is,

Colorful multi-exposure image fusion assessment performance comparison
We compare the proposed approach with state-of-the-art quality metrics for multi-exposure image fusion, 18 –22,26,27,30,55 –57 for the multi-exposure image fusion database. 30 Among these metrics, those of Hossny et al. 55 , Cvejic et al. 56 , and Wang et al. 57 are based on information theory; the metrics of Xydeas and Petrovic, 18 Wang and Liu, 19 and Zheng et al. 20 use feature-based methods; the metrics of Ma et al. 30 and Piella and Heijmans 22 are based on structure similarity; and the metrics of Chen and colleagues 26,27 are based on human perception. Tables 2 and 3 show the Pearson linear correlation coefficient and Spearman rank-order correlation coefficient of the proposed and other compared quality metrics for multi-exposure image fusion. It can be seen that the proposed method delivers the best performance for almost all sets of test images. On average, the Pearson linear correlation coefficient and the Spearman rank-order correlation coefficient of our proposed method for the multi-exposure image fusion database are 0.9299 and 0.8958, which are much higher than the second- (Pearson linear correlation coefficient: 0.8928; Spearman rank-order correlation coefficient: 0.8570) and third-best methods (Pearson linear correlation coefficient: 0.6950; Spearman rank-order correlation coefficient: 0.6198).
Pearson linear correlation coefficient performance evaluation of proposed model against existing models.

Spearman rank-order correlation coefficient performance evaluation of proposed model against existing models.

Figure 11 shows scatter plots of subjective scores versus our proposed model in the multi-exposure image fusion database. Note that the scatter plots of the proposed model exhibit good linearity, tight clustering, and a relatively uniform density. They are consistent with the high Pearson linear correlation coefficient and Spearman rank-order correlation coefficient shown in the bottom row of Tables 2 and 3. We choose a sequence of images fused by the aforementioned multi-exposure image fusion algorithms 8 –13 and list the predicted scores of the algorithm of Ma et al., 30 as well as our proposed algorithm, and mean opinion scores in Figure 12. It can be seen that the mean opinion score and quality score of Figure 12(c) predicted by the method of Ma et al. 30 are 3.9565 (highlighted in blue) and 0.8760 (highlighted in red), while those of Figure 12(a) are 5.0434 and 0.8356. Obviously, they are not consistent. However, the proposed method performs good consistency with the values of 5.4440 and 4.8622 for Figure 12(a) and (c) (highlighted in green). Figure 12(c) and (g) have the same problem as the method of Ma et al. 30

Scatter plots of subjective scores versus our proposed model scores in multi-exposure image fusion database. MOS: mean opinion score.

Fusion images generated by aforementioned multi-exposure image fusion algorithms, 8 –13 with predicted scores of the algorithm of Ma et al. 30 and our proposed algorithm, and mean opinion score values. Numbers in red and green correspond to predicted results of the method of Ma et al. 30 and our proposed algorithm, and those in blue correspond to the mean opinion score values. MOS: mean opinion score.
To further illustrate that the apparent advantages of our proposed model over the other compared methods are statistically significant, a one-sided t test was conducted on the multi-exposure image fusion databases using the Spearman rank-order correlation coefficient values. The one-sided t test tests the equivalence of the mean values of two samples drawn from insensitive populations of a normal distribution. Figure 13 demonstrates the t test experimental results, where the symbols “1”, “0,” and “−1” highlighted in blue, yellow, and red indicate that the row model is statistically better, indistinguishable, or worse than the column model, respectively. The most blue “1” values in the bottom line illustrate that our method is statistically superior to the previous methods for quality assessment of the multi-exposure image fusion database.
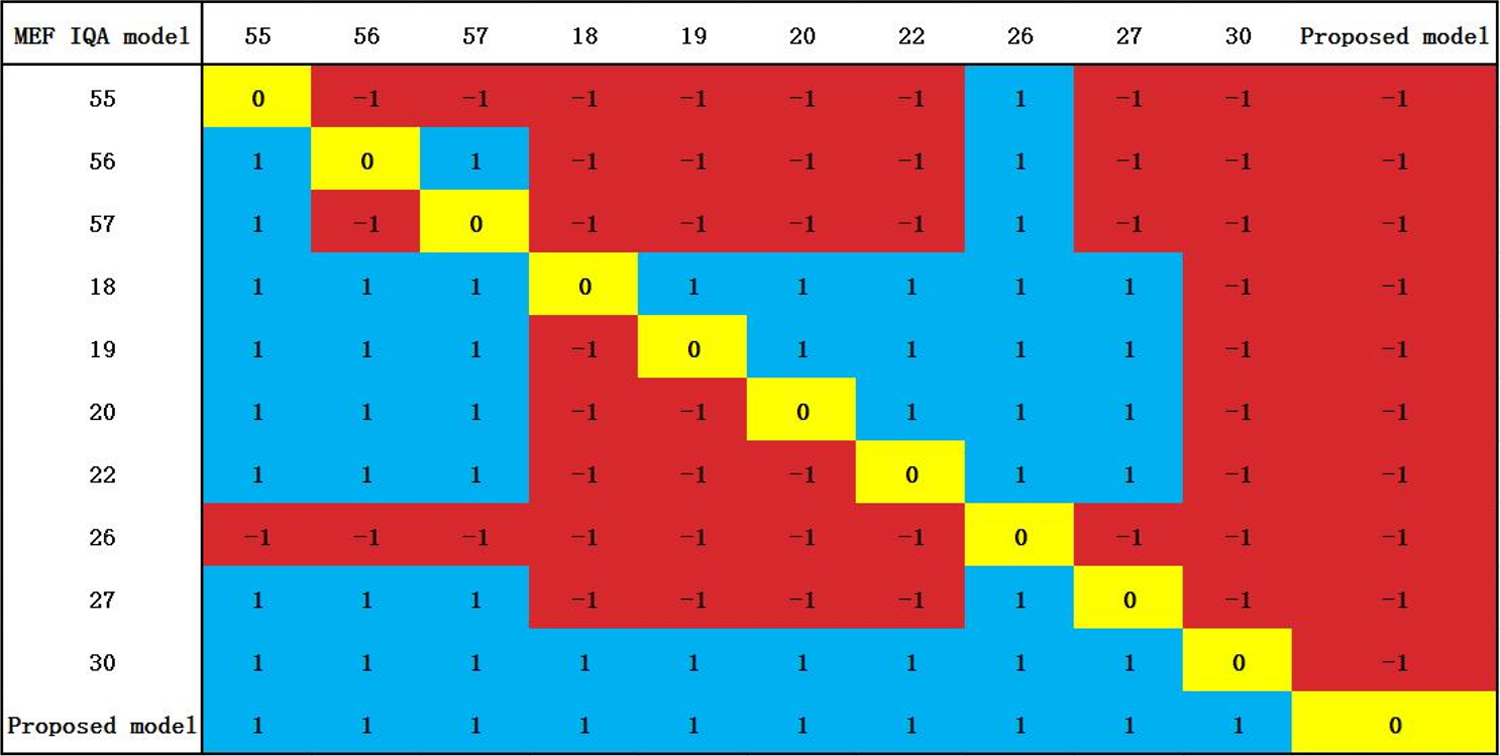
One-sided t test results conducted using Spearman rank-order correlation coefficient values of compared quality metrics provided in Table 3. A value of “1” indicates that the row model is statistically better than the column model, while a value of “−1” indicates that the column model is statistically better. A value of “0” indicates that the two models are statistically equivalent. MEF IQA: Multi-exposure image fusion.
Conclusions and discussion
In this work, we propose a quality assessment metric for colorful multi-exposure image fusion. The texture, structure, and saturation similarities are computed as measurements of texture, structure, and color information. The normalized similarities are mapped to objective quality scores by an extreme learning machine technique. The experimental results on the multi-exposure image fusion database show that the proposed model correlates well with subjective perception and better than other compared state-of-the-art image fusion image quality assessment models. For future research, there is still plenty of room for the quality evaluation of various types of image fusion, including multi-focus image fusion, £¬hyper-spectral image fusion, and multi-source heterogeneous image fusion. These all have their own specific properties and are waiting to be explored.
Footnotes
Declaration of conflicting interests
The author(s) declared no potential conflicts of interest with respect to the research, authorship, and/or publication of this article.
Funding
The author(s) disclosed receipt of the following financial support for the research, authorship, and/or publication of this article: This work was supported by the Major Special Project-the China High-Resolution Earth Observation System (grant number 30-Y20A06-9003-15/16) and partially by the National Natural Science Foundation of China (grant number 61301090).