
Abstract
Accurate calculation of canopy aerodynamic parameters is a prerequisite for precise modeling of a parafoil airdrop system. This investigation analyses the aerodynamic performance of the canopy in airdrop testing combining the leading-edge incision and the trailing-edge deflection. Aerodynamic parameters of the canopy are obtained using the computational fluid dynamic simulations, and then, the output data are used to estimate the deflection and incision factors. The estimated lift and drag coefficients instead of the traditional parameters based on lifting-line theory are incorporated into the eight degrees of freedom dynamic model of an airdrop system and make some simulations. The effectiveness of the proposed method for calculating aerodynamic coefficients is verified by actual airdrop testing.
Keywords
Introduction
In recent years, the parafoil airdrop system (PADS) gradually becomes active in the field of aerospace. It has the abilities of patrolling, military reconnaissance, surveillance, advertising, and so on. Compared with the fixed-wing aircraft and rotor unmanned aerial vehicle (UAV), the PADS has the advantages of high loading ratio and low cost. 1 The Aviation Industry Corporation of China developed a kind of PADS,with the the thrust-to-weight ratio reaching 1:3, whereas the thrust-to-weight ratio of the other types of UAV was just 1:1. Moreover, the PADS can fly at low speed and low altitude, 2 the flight speed of the parafoil is 30–70 km/h, and the flight height ranges from several meters to several thousand meters. In addition, the PADS is easy to be carried by aircraft and missile and can be delivered remotely. 3
The canopy of the parafoil is entirely constructed from fabric with no rigid members, which allows it to be packed and deployed. When inflated, it is just like a low-aspect-ratio wing, containing the upper and lower surfaces, a cross-section, and a rectangular platform. The ribs are sewn in the chord direction at a number of spanwise intervals forming a series of cells. The leading edge of the wing is open over its length so that the ram-air pressure maintains the wing shape. 4 The aerodynamic characteristics of the parafoil have two distinctive features: one is the strong nonlinearity and coupling due to the flexibility of the canopy and another is that the leading-edge incision and trailing-edge deflection (brake deflection) of the canopy are hard to incorporate into analytical models. These two elements make it difficult to accurately model for parafoils, which pose a new challenge to the control of the PADS.
The modeling and control are the most significant problems in the airdrop sysems. Xu and Chen 5 made a review of modeling and control during the airdrop process of transport aircraft, in which the airdrop systems were classified into two scenarios according to the airdrop height. The PADSs belong to the low altitude airdrop, which mainly focus on the control and aerodynamic characteristics to ensure safety; therefore, it is important to compute the aerodynamics of the canopy accurately. In the past decades, most investigations have been conducted on the mechanism modeling of parafoils. Goodrick 6 and Barrows 7 established asix-degree-of-freedom (DOF) of PADS, wherein the parafoil and payload were regarded as rigid connection. Müller et al. 8 proposed an eight-DOF model of parafoil systems, in which the relative motions between airfoil and payload were taken into account. Zhu et al. 9 yielded an eight-DOF dynamic model of the powered parafoil according to the Kirchhoff motion equation. Meanwhile, the nine-DOF models of parafoils were also investigated by some researchers. 10 –13 It is valuable to mention that all the abovementioned studies computed the aerodynamic parameters of the canopy based on the lifting-line theory, 14 which involves a series of assumptions to account for the effects of the leading-edge incision and the brake deflection of the canopy.
To control the airdrop systems, Xu 15 proposed a dynamic surface control of nonlinear systems, which can deal with the uncertainty. There are also many others control methods that can deal with the uncertainty of the PADSs, for example, neural control 16,17 and learning control. 18 However, too much uncertainty in the system always makes the control algorithm unsatisfactory. In order to control a parafoil system more accurately, a precise mathematical model that includes the kinematics and aerodynamics is more desirable. Nowadays, three methods can be used to accurately compute the aerodynamic force, which are the airdrop testing, the wind–tunnel experiment, and the computational fluid dynamic (CFD). 19 Airdrop testing has high cost, and the measured data are limited, which is often used to verify experiments. Owing to large dispersion and poor regularity, it is difficult to utilize the wind–tunnel testing data for simulation analysis. With the development of computers, CFD is an attractive method due to its high reproducibility and low cost.
The existing studies based on CFD mostly focused on the qualitative analysis, and the investigations on the quantitative analysis of the effect of leading-edge incision and trailing-edge deflection were rarely carried out. Ghoreyshi et al. 20 investigated the aerodynamic characteristics of ram-air parachute with open and closed round inlets under the assumption of rigid canopy and compared the results with available wind–tunnel test data. Based on CFD, two estimation methods were used to calculate stability derivatives. Ghoreyshi et al. 21 conducted a numerical simulation on parafoils that had plate form. The airflow regime on canopy was also analyzed in detail. The presence of a complex vortex system inside the air chamber and in the proximity of the inlet was revealed by Andreutti et al. 22 using CFD solvers. Moreover, it pointed out that the Euler simulation was able to describe the macroscopic flow features. In order to study the unique aerodynamic characteristics of the PADS, Altmann 23 combined loads with flexible deformations to investigate the effects of spanwise compression of the wing, cell billowing, and S-shapening of the profiles on aerodynamic characteristics. He also proposed some positive proposals on the design of parafoil systems. Zhu and Cao 24 investigated the influence of arc-angle, leading-edge cut and the plate form of the parafoil on the aerodynamic performance. The abovementioned simulations were carried out from the perspective of the parafoil design, and the modeling and control of the PADS were not considered. Liang et al. 25 studied the modeling of a parafoil in the wind and rain environments. The flap deflection was also investigated, and the modified aerodynamic function was obtained using least squares method. 26 Tao et al., 27 by combing the CFD and the Kirchhoff motion equation, proposed a more accurate model of the parafoil. However, in these models, the leading-edge incision and the ribs were neglected.
To meet the demand of PADS control, accurate modeling is essential. Leading-edge incision and trailing-edge deflection have a significant impact on the precision of the modeling of the PADSs, which were neglected in the traditional method of modeling. This problem highlights the motivation for this investigation, and the ribs of the parafoil are also taken into account in this article. Moreover, the quantitative analysis of the influence of the leading-edge incision is conducted. Furthermore, trailing-edge deflection (the only control input of PADS) is investigated. By solving the Navier–Stokes equation, the aerodynamic parameters of the canopy can be obtained and then is used to identify the aerodynamic function. Finally, the aerodynamic functions are verified by the airdrop testing.
The remainder of this article is organized as follows. “Problem formulation” section describes the origin and formulates the problem. In “Computational approach of aerodynamic coefficients” section, the process of numerical simulations based on CFD is introduced in detail. The next section is to ensure the effectiveness of numerical simulations. “Simulations and analysis” and “Airdrop testing” sections provide the simulation results to verify the proposed approach.
Problem formulation
To calculate the aerodynamic force, the traditional method is dividing the canopy of the parafoil into eight segments evenly along the span direction. 28 The lift coefficient on every segment times a factor from outside to inside (0.6, 1.0, 1.16, 1.24). According to the local velocity and angle of attack (AOA), the aerodynamic force and moment on each segment are computed. The entire aerodynamic force and moment are obtained through the addition of each segment. The aerodynamic on every segment of a parafoil is computed as follows

where the subscript
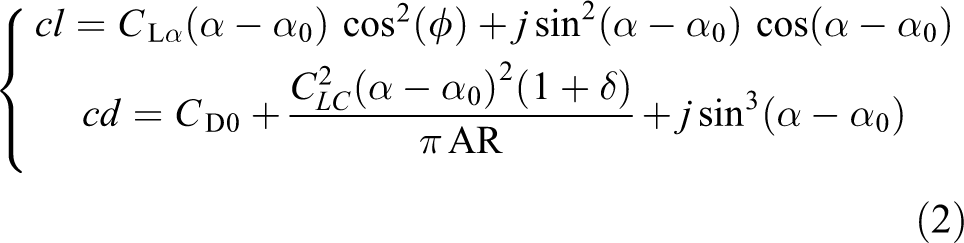
In the determination of

where

where
In the determination of
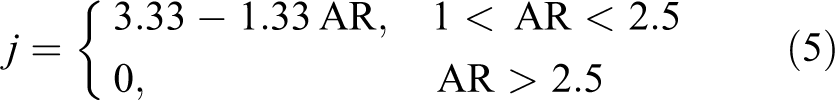
From the above analysis, although the lifting-line theory can be used to estimate the aerodynamic characteristics of a canopy, the effect of leading-edge cut and the flexibility of the parafoil are neglected, and it is not explicit how to deal with the trailing-edge deflection. For illustrating the influence of the incision, we take three 2-D models as an example. The sketches of the parafoil are shown in Figure 1, r is the rope length, b is the spanwise length, ϕ denotes the arc anhedral angle, c denotes the chord length, e represents the relative thickness, h is the length of the leading edge cut, ε is spanwise radian, and the detailed parameters of three models are presented in Table 1. For three models in Table 1, we compute the lift and drag coefficients based on CFD, and the results are shown in Figure 2.

Parafoil aerodynamic shape.
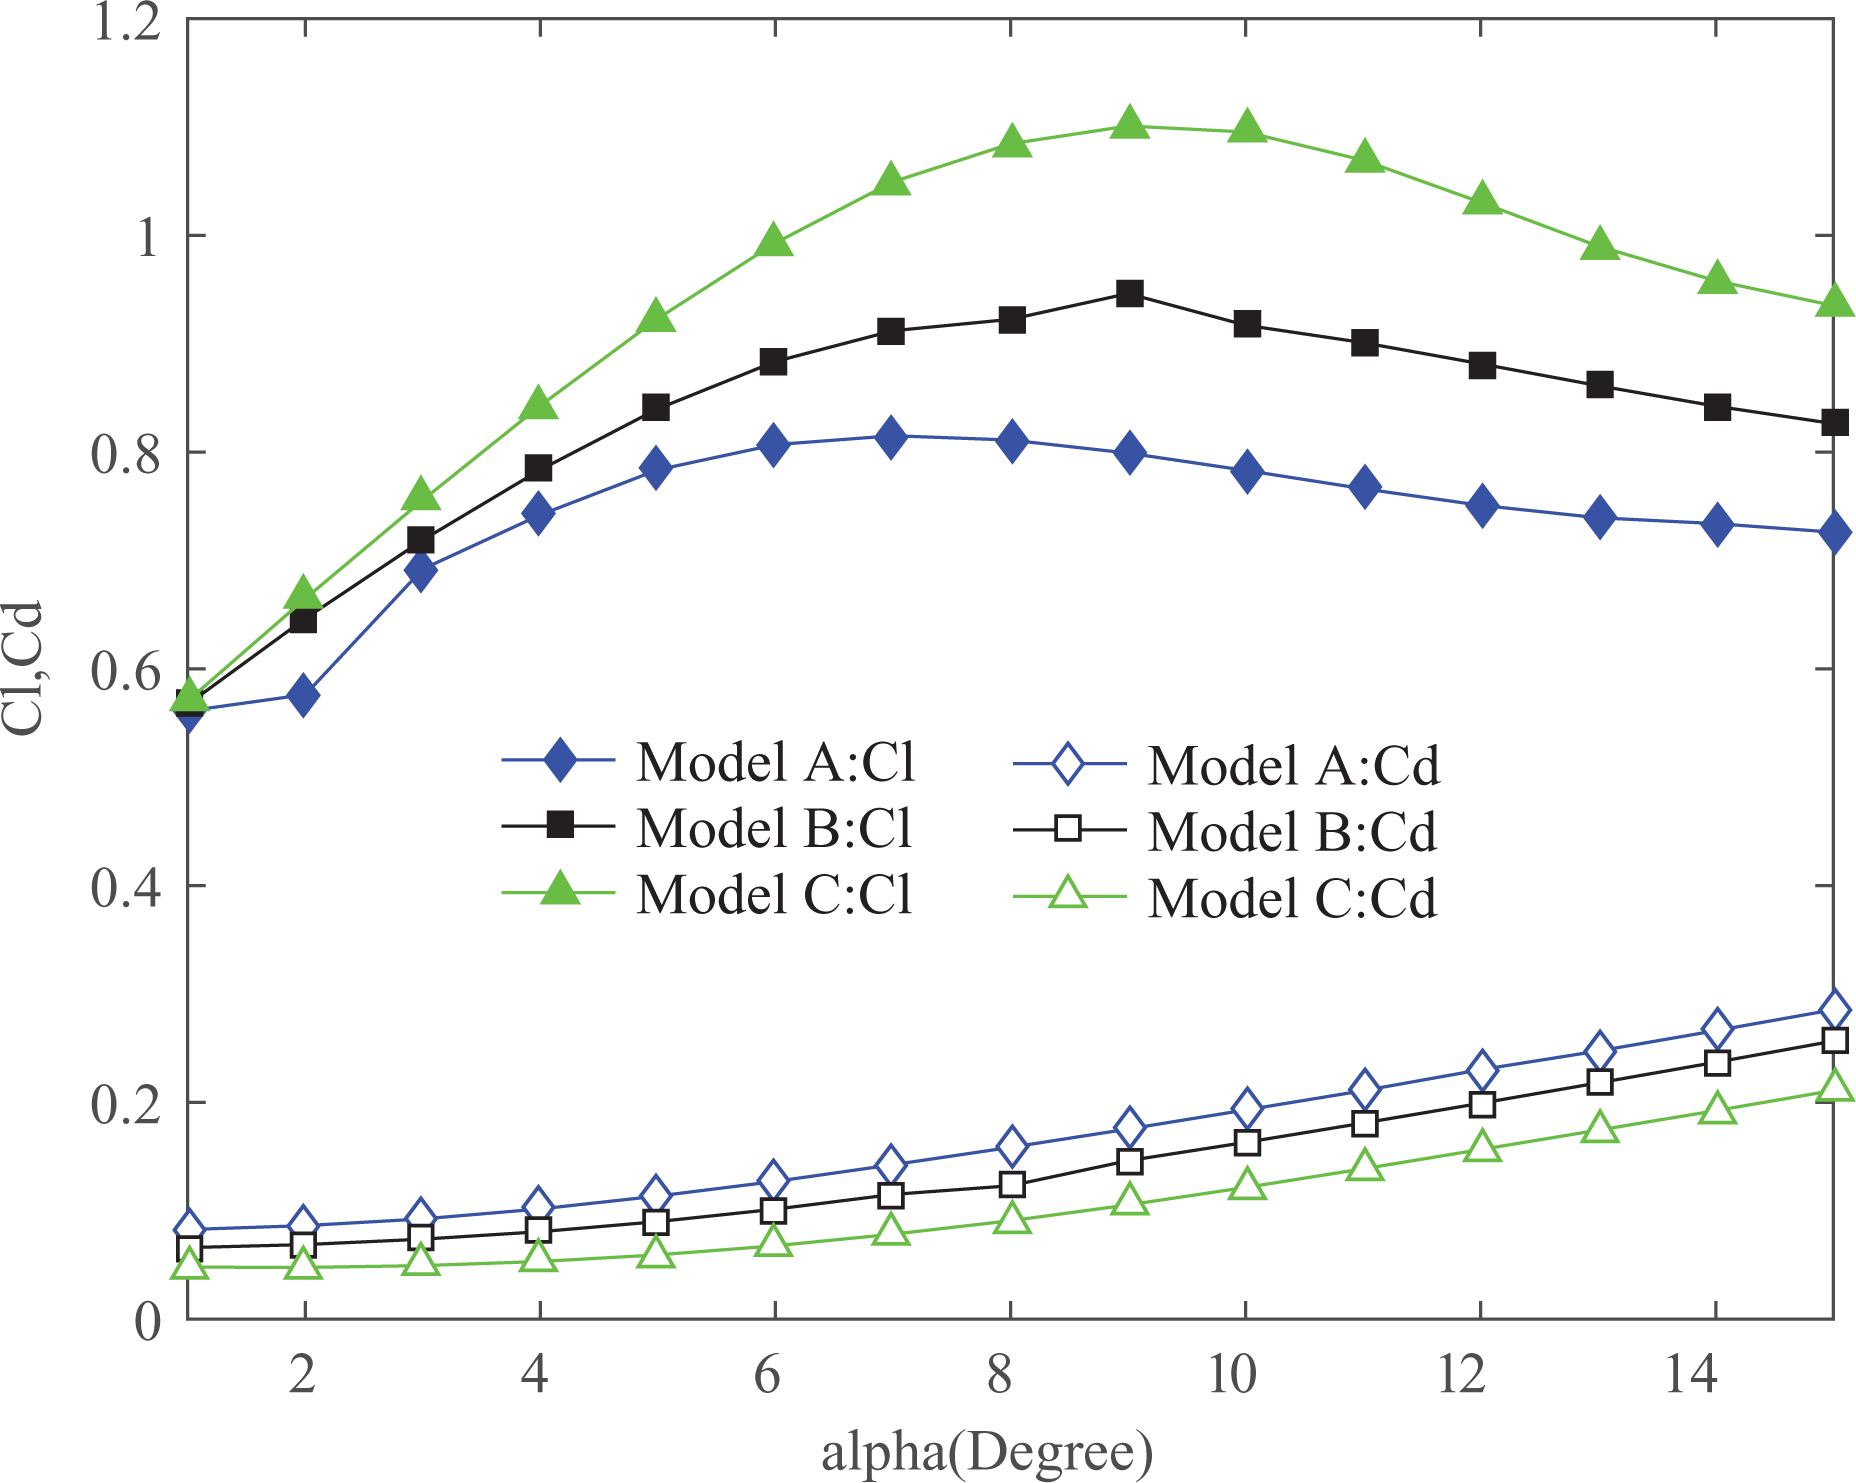
Lift and drag coefficients of three models.
Detailed parameters of 2-D parafoils.

The effects of the leading-edge cut on the aerodynamic performance are relevant to the length and angle. Figure 3 shows the velocity distribution on the wing surface. The longer the incision, the more serious the speed loss as the airflow passes through the leading edge as well as the more front position of peak velocity in upper wing surface. Under these circumstances, the pressure of the upper surface increases with the deceleration of the airflow; therefore, the aerodynamic performance of the parafoil becomes severe. Different from the incision length effect, the incoming velocity does not change with the increase in the slope of the leading edge, and it will result in airflow separation at the trailing edge and deteriorate the aerodynamic performance. Figures 2 and 3 show the significant effect of the leading-edge incision. Qualitative analysis of the effect of the leading-edge incision is far from enough, and it is crucial for accurate modeling of parafoil systems.

Velocity distribution of different models: (a) model A, (b) model C, (c) model A, and (d) model B.
Computational approach of aerodynamic coefficients
To calculate the aerodynamic parameters accurately, it is necessary take into account the leading-edge incision and trailing-edge deflection. The primary purpose of this section is the quantitative analysis of these effects based on CFD. Through comparing the pressure and velocity distributions, the flow regime is revealed, and then, the least squares method is used to identify the aerodynamic parameters. The estimated results are compared with the theoretical results to illustrate the effect of the incision and deflection.
Before computing the aerodynamic parameters, some reasonable assumptions are made. Because we mainly focus on the effect of the trailing-edge deflection and leading-edge incision, the suspension lines are not taken into account in this article. The main purpose of this investigation is to study the stable flight performance; the effect of the canopy flexibility is neglected.
Governing equation
The flow field of the parafoil satisfies the following control equation

where φ is the generalized variable, ρ denotes the density, u represents the velocity of the free-stream flow, Γ denotes the diffusion coefficient, and S is the generalized source term. In equation (6), from the left to right are the transient term, the convective term, the diffusion term, and the source term, respectively. φ, Γ, and S have particular forms in different flow equations. Because of the parafoil working conditions, it is not necessary to solve the energy function. We give the forms of φ, Γ, and S in continuity equation and momentum conservation equation in Table 2.
Detailed parameters of governing equations.

Parafoil models and flow field settings
The CFD models are created by DesignModeler (version 17.2) in Ansys Workbench. As shown in Figure 4, it has 15 cells, and there are holes on the rib to ensure the pressure balance of each air chamber. Specific parameters of the parafoils are given in Table 3. The boundary of the flow field should be far away enough from the disturbance source; 14 however, it is not appropriate if the boundary is too far away because too many grids can cause error accumulation. In practice, the dimension of the flow field is set to 10c, 5c, and 10c, as shown in Figure 5.

Physical model in the airdrop testing: (a) CFD model of parafoil and (b) rib model of parafoil. CFD: computational fluid dynamics.

Flow field dimension.
Detailed parameters of parafoils.

The
Spalart Allmaras model
The Spalart–Allmaras (SA) model 29 is a model that solves a modeled transport equations for the turbulent viscosity. It is designed specifically for aerospace applications involving wall-bounded flows and has been shown to give good results for boundary layers subjected to adverse pressure gradients. The transport variable in the SA model is given as follows

All details of these parameters can be referred in the previous work. 30 Mohammadi and Johari 31 combined the incompressible Navier–Stokes equations with the SA turbulence model, examined the flowfield and forces on the central cross section of a parafoil canopy using the finite volume method, and obtained some positive results, which illustrated the efficiency of the SA models.
Renormalization group (RNG)
model
From the equation of turbulent kinetic energy k, the equation of turbulent dissipation rate ε is introduced. The RNG
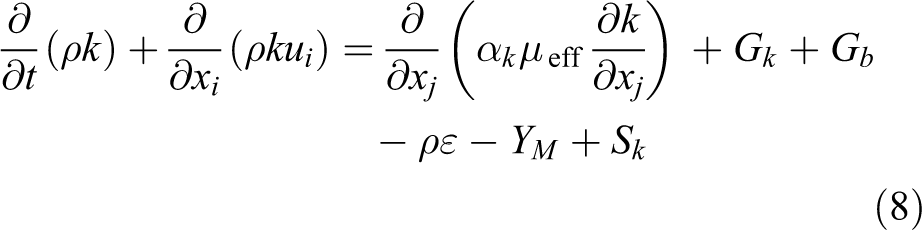
and

The RNG
Mesh generation
To solve the governing equation, the flow field should be discretized. The mesh generation is finished in integrated computer engineering and manufacturing (ICEM)-CFD, and the air chamber is also taken into account. It is indisputable that structured meshes have higher accuracy and less memory requirement compared with unstructured meshes. Owing to the complexity of parafoil models, tetrahedral meshes are chosen in this investigation.
However, only tetrahedral meshes are not sufficient to capture the high gradients of velocity and pressure near the canopy. There are three layers of the near-wall zone: Viscous sublayer: It is the closest layer to the wall; in this segment, the viscous force is much higher than the turbulent shear stress. The flow of fluid is similar to laminar flow motion. Transition layer: Its viscous force and the turbulent shear stress are within the same range. The fluid motion is between turbulent and laminar motion. The transition layer is very thin and is always contributed to logarithmic layer. Logarithmic layer: It is the outermost layer of the near-wall zone. The viscous force is much smaller than the turbulent shear stress. The flow is in an entirely developed tumultuous state. Velocity distribution is close to logarithmic law.
The SA and RNG
Wall function is a semiempirical formula. It is utilized to combine quantities on the wall with the quantities that are unknown in the turbulent core region. To describe the flow in the viscous sublayer and the logarithmic layer, two dimensionless parameters,


where u is the time average velocity of the fluid,
Prism grids are used to treat the boundary layers. The first step of creating computational meshes is to generate the tetrahedral mesh in the whole domain, and then, prism cells are typically extruded from the canopy layer by layer. The first node should be placed at the viscous sublayer, and the height must meet the requirements of wall conditions. The mesh of the flow field and parafoil are shown in Figure 6.

Mesh generation for flow field and parafoil model: (a) meshes of entire fluid and (b) prism mesh near canopy.
Aerodynamic parameters identification
Taking the leading-edge incision and the trailing-edge deflection into account, the aerodynamic function can be modified as follows

where γ and h are the angle and length of the leading edge incision, respectively, and
From Figure 2, the leading-edge cut coefficients

The aerodynamic data required is off-line. According to the least squares method, 34 the unknown parameters are estimated as follows

where


in which

also, we have

In these equations,
Numerical method validation
To verify the effectiveness of the numerical method, it is necessary to compare the simulation results with the available wind–tunnel test data. In addition, mesh dimensions can influence the calculations. Simulation results are meaningful only when the results do not change with the number of grids. Mesh-independent validation is to illustrate that the simulation results are independent with the mesh.
Comparison of wind–tunnel test and CFD simulations
It is helpless that model 1 used in airdrop testing has no available wind–tunnel test data. We adopt model 1 (not the model in this article) in wind–tunnel test 35 as the validated model. The results are shown in Figures 7 and 8. The calculation results of CFD are consistent with the data in wind–tunnel experiment at the small AOA. With the increase of AOA, the simulation results are larger than those of wind–tunnel tests. The reason is that the cell billowing phenomenon of the canopy can result in the deterioration of aerodynamic performance, 23 which is neglected in this article. Overall, the calculation results of CFD have a certain credibility in a reasonable range.

Comparison of lift and drag coefficients between wind–tunnel test and CFD simulations. CFD: computational fluid dynamics.
Comparison of lift and drag coefficients between wind–tunnel test and CFD simulations under deflection. CFD: computational fluid dynamics.
Mesh-independent validation
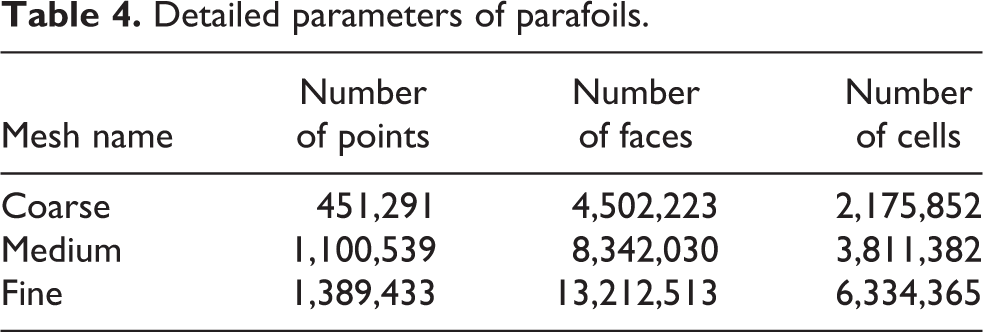
The simulation results based on CFD are related to the density of the mesh; in general, the results are credible only when there is enough mesh in the flow field. To guarantee the accuracy of CFD simulation, the mesh independent is performed first. The mesh density is presented in Table 4. We change the mesh density by adjusting the mesh size. It is worth noting that the specific number of points, faces, and cells may be little different from each other because of the discrepancy of molded dimensions. Table 4 presents the specific mesh parameters of model 1.
Detailed parameters of parafoils.
The lift and drag coefficients predicted by SA turbulence model are shown in Figure 9. To select a suitable turbulence model, four models with no deflection are also computed by the RNG

Mesh-independent verification: (a) model 1, (b) model 2, (c) model 3, and (d) model 4.

Comparison between the SA and RNG
Simulations and analysis
Effects of leading edge incision
In the traditional method, the influence of leading-edge cut was neglected. However, the incision always makes the stall angle smaller and deteriorates the aerodynamic performance of the parafoil. Figure 11 shows the cl and cd of four models with no brake deflection based on CFD. From Figure 11, the lift coefficient decreases while the drag coefficient increases under the influence of leading-edge cut. The larger the AOA is, the more significant the impact on the aerodynamic performance. Comparing four models, with the decrease of leading-edge angle and the increase of length, the canopy obtains smaller lift coefficient and larger drag coefficient at the same AOA. The weight of incision length is higher than the angle.

Lift and drag coefficients based on CFD. CFD: computational fluid dynamics.
The lift-to-drag ratio is shown in Figure 12. It indicates that the leading-edge incision has a small influence on the stall angle. In addition, lift-curve slopes are basically consistent in the case of equal incision length. The lift-to-drag ratio of model 1 is 25% greater than model 2. From models 1 and 3, the length of leading-edge cut has an adverse effect on the aerodynamic performance. In addition, the impact of the leading edge length is larger than the angle. Furthermore, the smaller the leading-edge incision size is, the more slowly the lift-to-drag ratio changes, it is also beneficial to the stability of parafoil system.

Lift-to-drag ratio of four models.
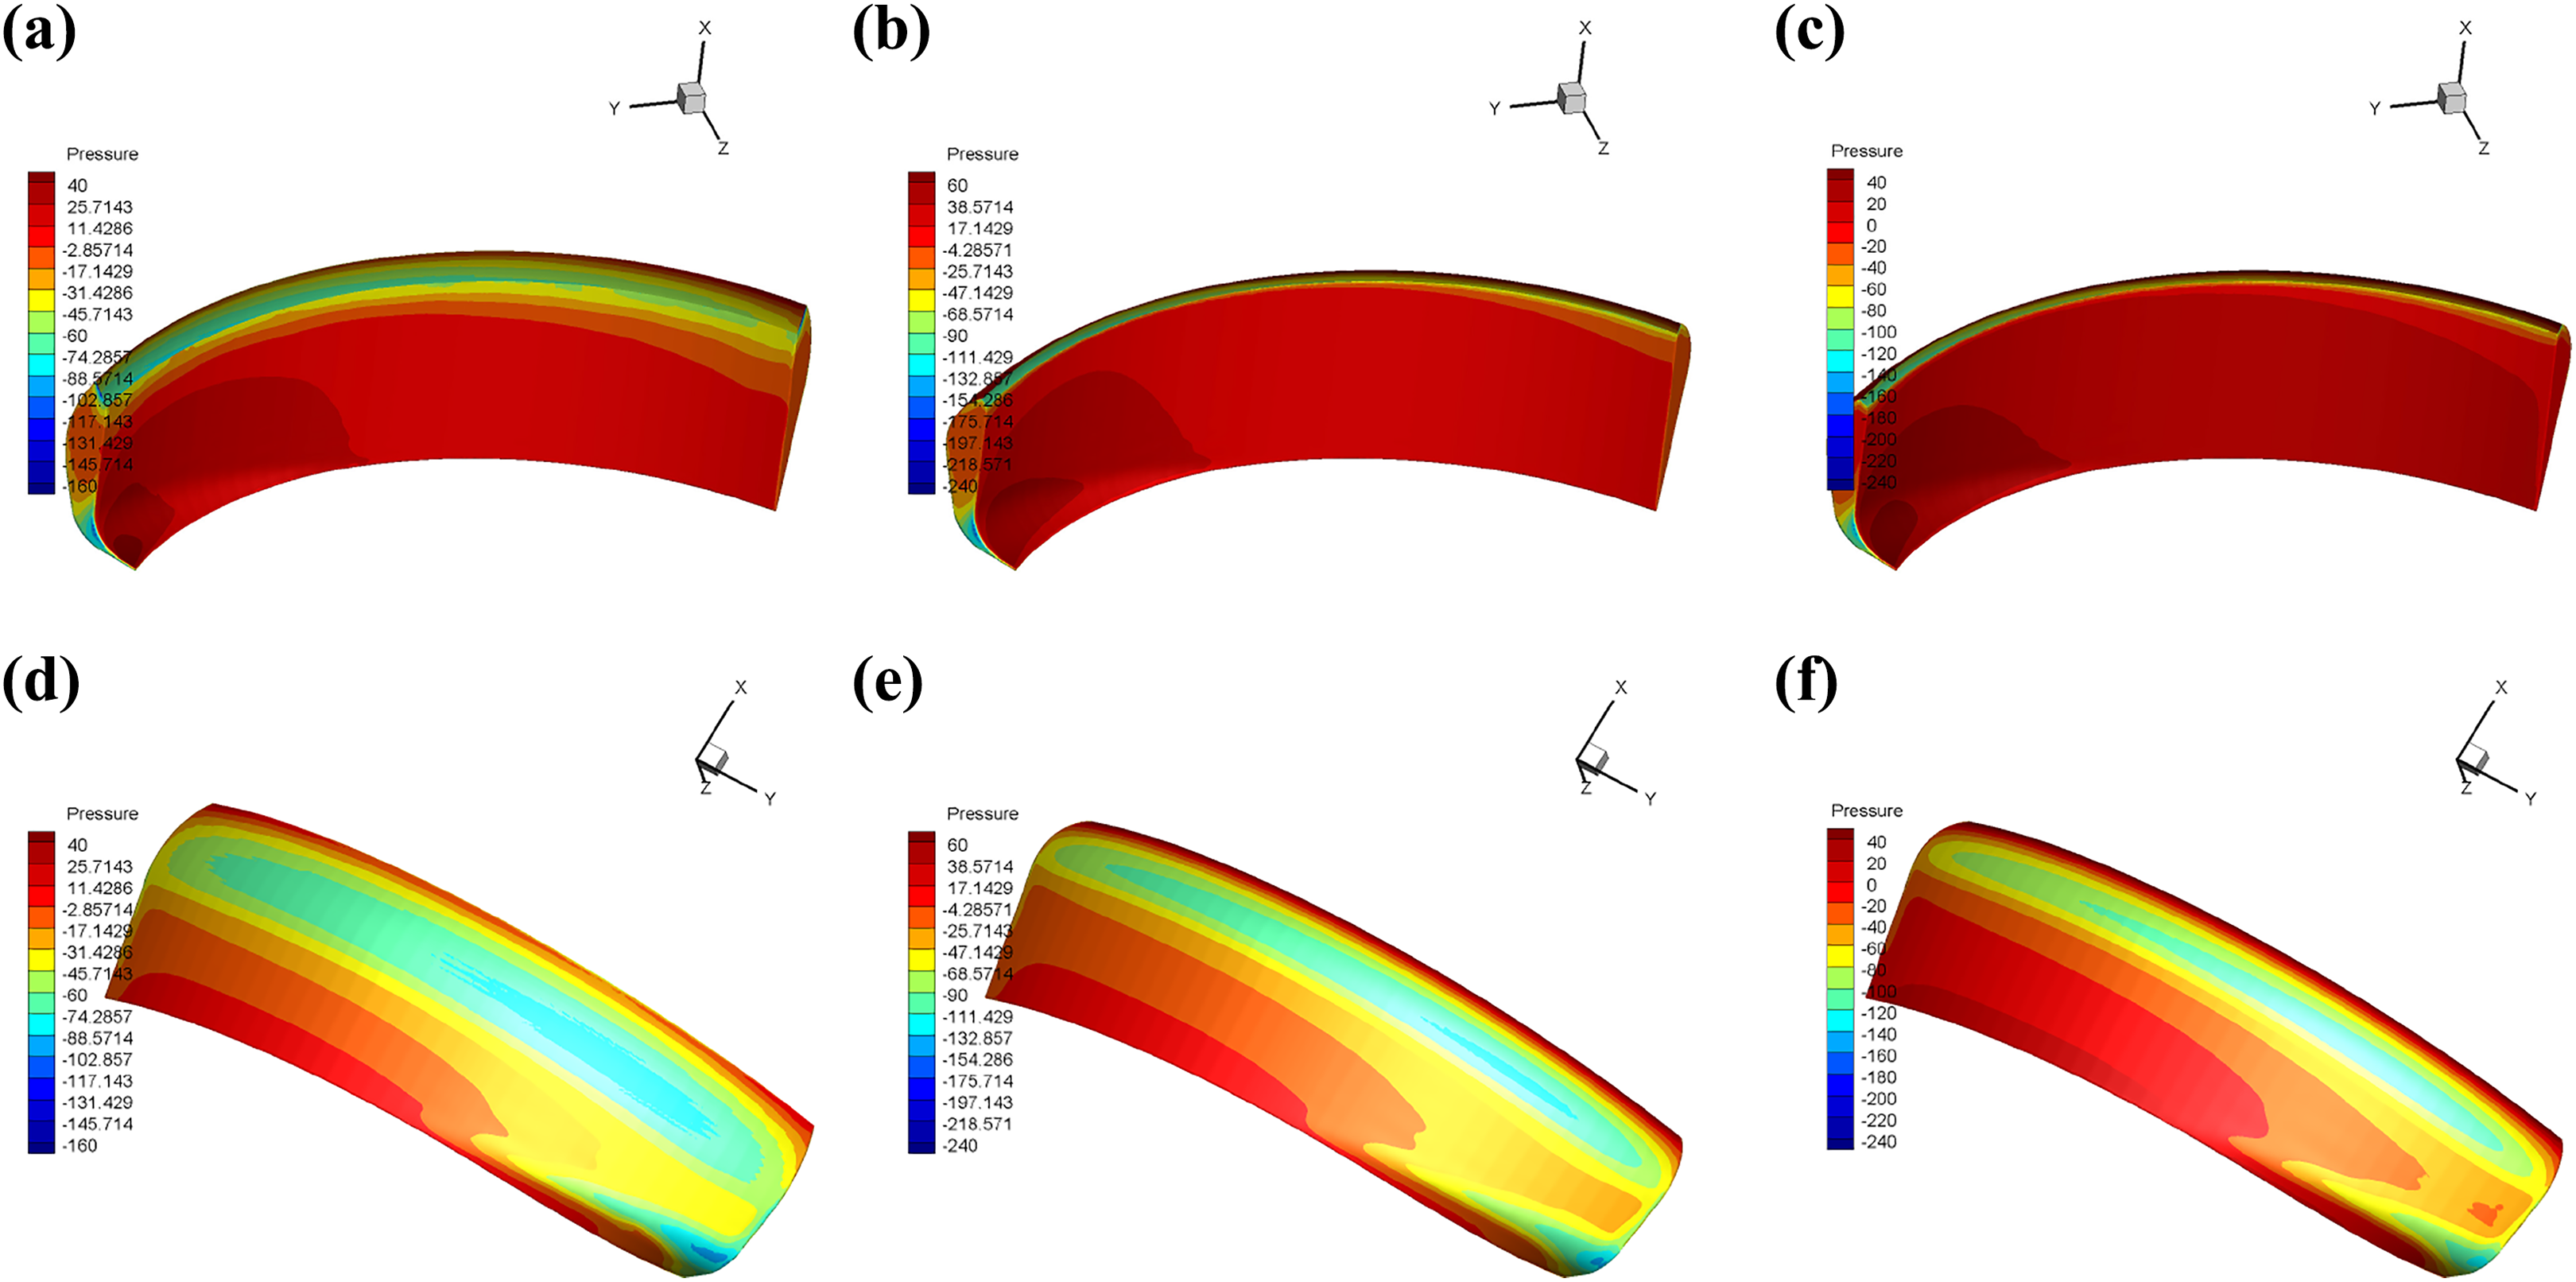
In order to further analyze the influence of leading-edge incision on the aerodynamic performance, the pressure distribution of four models at
Pressure distribution on upper surface: (a) model 1, (b) model 2, (c) model 3, and (d) model 4.

Pressure distribution on bottom surface: (a) model 1, (b) model 2, (c) model 3, and (d) model 4.
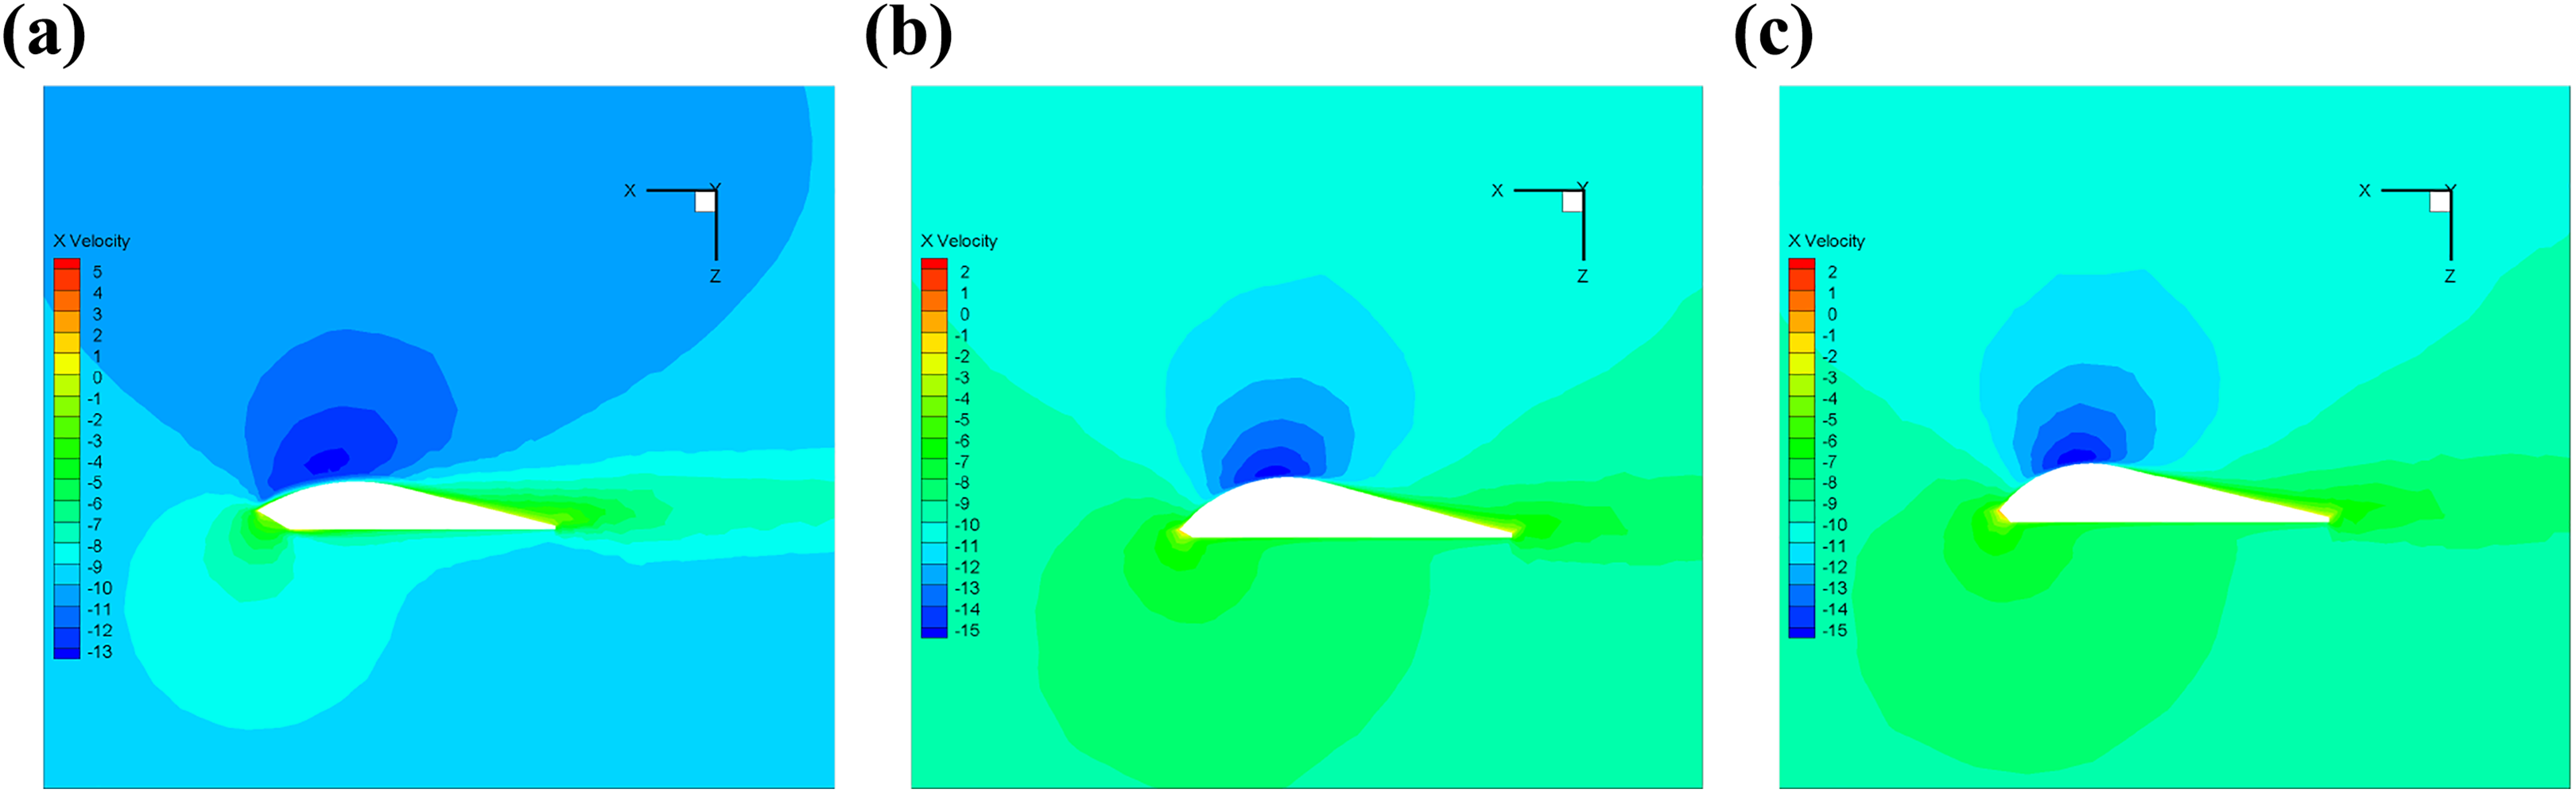
Velocity distribution on middle cross section: (a) model 1, (b) model 2, and (c) model 3.
The analysis of the leading-edge effects gives some instructions on the control of the airdrop systems. Sometimes increasing the length of incision does not influence the stability of the system, it only decreases the speed of airflow passing through the parafoil canopy. However, the angle always leads to the airflow separation at trailing edge; then, the stall angle becomes smaller, although it has little influence on lift and drag coefficients, and the range of effective AOA of PADS also becomes smaller. Therefore, if the parafoil has a relatively long incision, the control inputs can be large to implement the lift lose; while the incision angle is relatively large, the brake deflection should be small in the case of the stall of a parafoil.
Effects of trailing-edge deflection
PADSs can realize the turning motion through pulling a single steering line, and the soft landing can be achieved by pulling the left and right steering lines on the canopy trailing edge symmetrically. The pressure distribution on the canopy is not symmetrical in the case of a single steering line is pulling down. The spanwise circulation of the canopy does not satisfy the elliptic distribution. It is another drawback of traditional models. NASA wind tunnel test
35
and the airdrop testing showed that during brake deflection, only a quarter from the rear of the canopy deflects, as shown in Figure 16. The whole deflection is 75°. In this article, we investigate three deflection of four models, that is,

CFD model with the deflection of model 2. (a) Airdrop deflection, (b) δ = 1/3, (c) δ = 2/3, and (d) δ = 1. CFD: computational fluid dynamics.
To analyze the effect of different trailing edge deflections, the aerodynamic parameters of four models within three kinds of deflections are presented in Figure 17. No matter what the size of the leading-edge incision is, the brake deflection can increase both the lift and drag coefficients. At the small AOA, the lift coefficient increases with the increase in δ. However, as the AOA gradually increases, the lift coefficients reduce instead. In these four models, the drag coefficients increase all the time. Moreover, at the same brake deflection, different models have different aerodynamic characteristics.

Lift and drag coefficients of four models under deflection: (a) model 1, (b) model 2, (c) model 3, and (d) model 4.
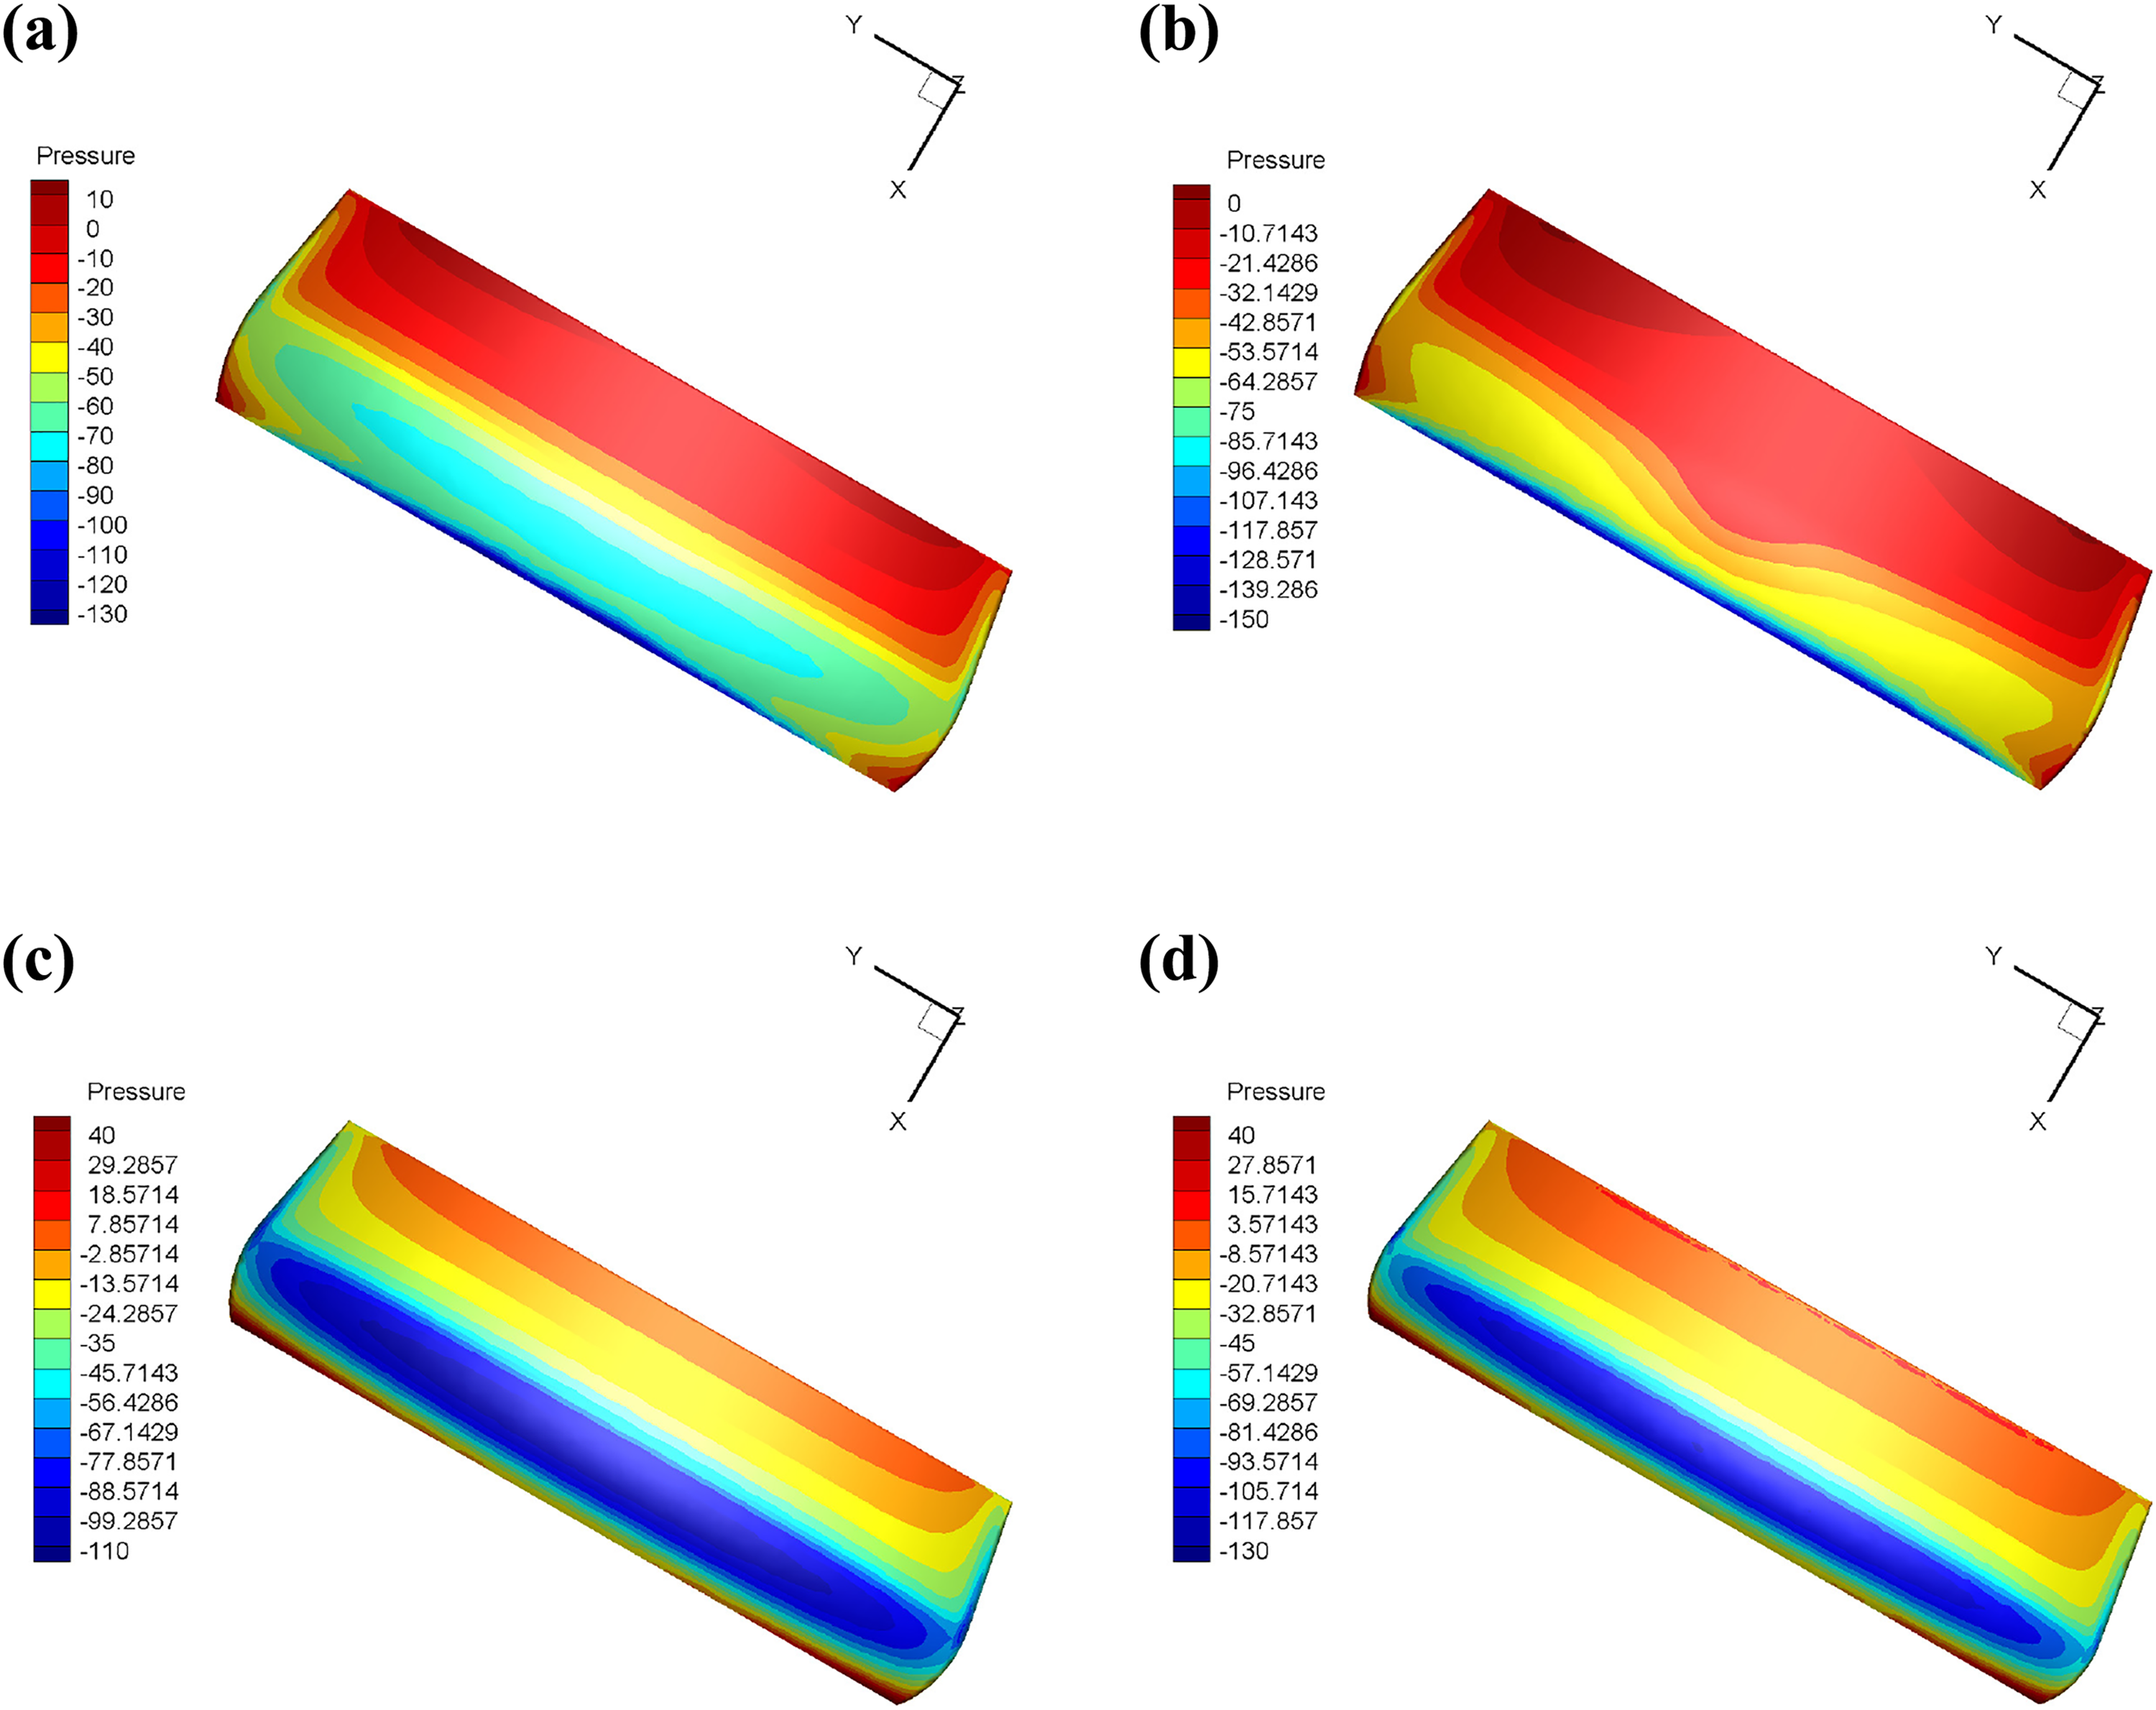
The pressure contours of three models at
Pressure distribution when
The lift-to-drag ratio increment of different models under the same brake deflection is shown in Figure 19. In the case of small deflection, the lift-to-drag ratio of models 1 and 3 change gently. The aerodynamic characteristics of models 2 and 4 strongly vary with AOA. These results indicate that in terms of aerodynamic parameters, the negative effect of increasing length is greater than that of decreasing angle, as for the stability (it refers to the degree of change of aerodynamic parameters) of the parafoil, the effect of angle is much greater than length. As the brake deflection increases, although the increment of the lift-to-drag ratio in models 3 and 4 is larger, the stability is getting worse. Models 1 and 2 change slowly in this case. In the previous study, 36 the brake deflection is converted to the variation of the airflow AOA. From this point of view, when the deflection increases, the AOA is more suitable for models 1 and 2. Overall, the smaller the leading-edge cut is, the better the aerodynamic performance of the parafoil will be.

Increment of lift-to-drag ratio of four models under deflection: (a) δ = 1/3, (b) δ = 2/3, and (c) δ = 1.
Parameters identification results
Because the brake deflection coefficients and the leading-edge cut coefficients are static parameters, parameters identification can be carried out off-line. The results are obtained by the least squares method. Specific parameter values are listed in Tables 5 and 6.
Identification parameters related to cl.

Identification parameters related to cd.
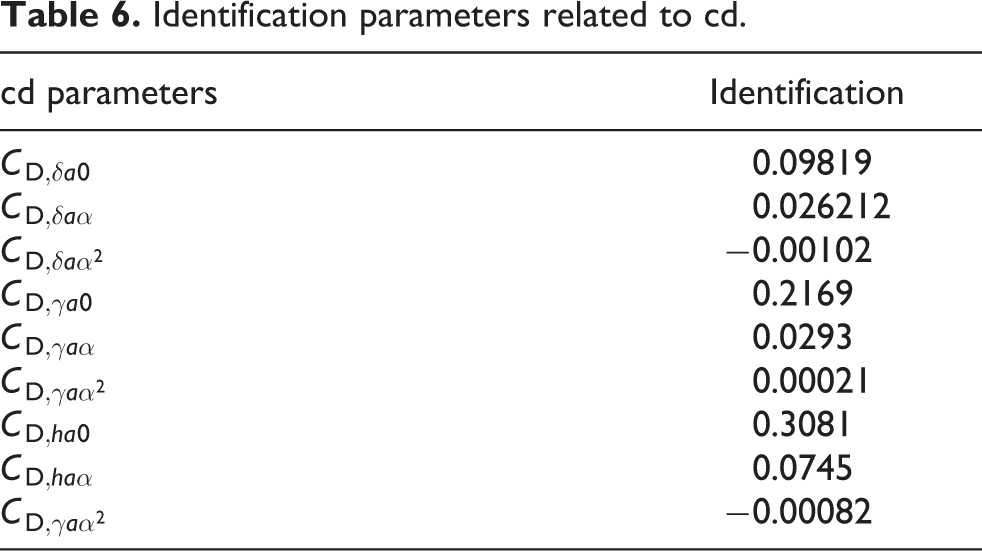
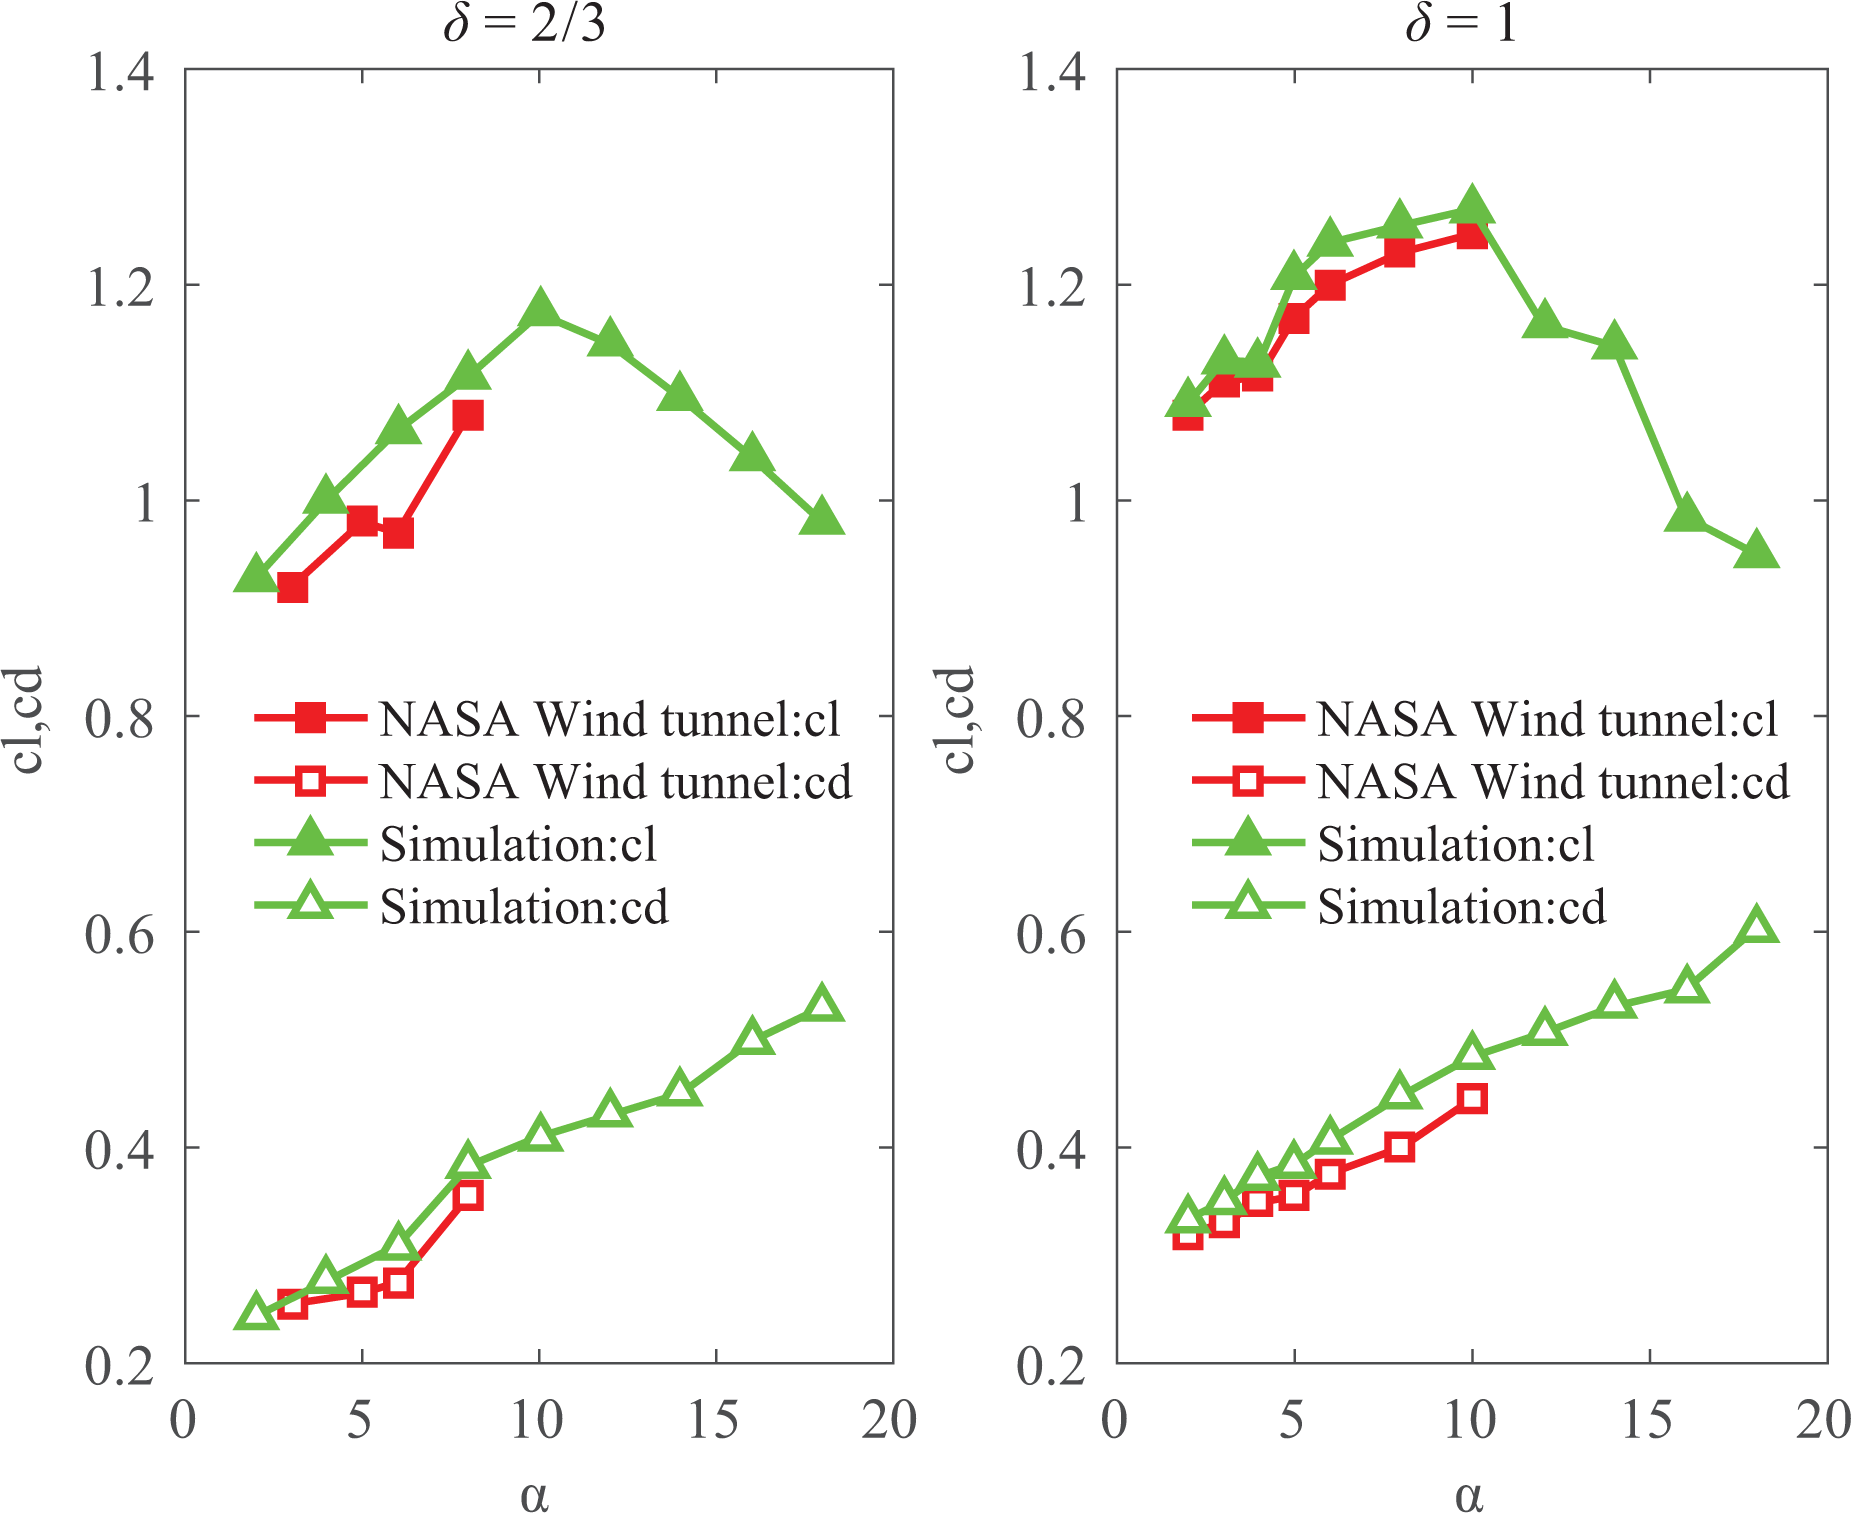
From Tables 5 and 6, it is known that the result is the same as that of numerical calculation, the influence of incision length is greater than the angle of the incision, and the coefficient of the quadratic term is very small. To evaluate the result of parameter identification results, we compare it with the theoretical data, and the results are shown in Figure 20. The parameter identification results are consistent with the theory, the lift coefficient calculated by CFD is smaller than that calculated by theory, and the drag coefficient is larger, because CFD takes the effects of incisions and turbulence into account. With the increase in attack angle and brake deflection, the deviation between them is growing. From the analysis above, CFD has the ability to accurately predict the aerodynamic performance of the canopy in a certain range.

Comparison between CFD simulations and theory results. CFD: computational fluid dynamics.
Airdrop testing
The effectiveness of the proposed approach based on CFD can be validated by airdrop testing. Our research group conducted an airdrop testing using model 1 in this article at Xu Chang city, Henan Province. The parafoil system was carried off to 400 m above sea level and released from a hot air balloon, as shown in Figure 21. The elevation of the airdrop ground was 90 m, the elevation of the releasing site was 403 m, and the altitude loss of parachute opening was 40 m. The left steering line is pulled down by

Airdrop testing: (a) released from balloon and (b) soft landing.
The flight data collected by the GPS module were in the form of latitude and longitude. After conversion and processing, comparison results of simulations and airdrop test are shown in Figures 22 and 23.

Comparison of airdrop testing and simulation: (a) horizontal velocity and (b) vertical velocity.

Horizontal trajectory in airdrop testing and simulation.
From Figure 21, the horizontal velocity and the vertical velocity model show good agreement with that of the airdrop testing, although there are still some deviations. We all know that the horizontal motion of atmosphere has a greater influence than the vertical. 37 That is why the error in the horizontal direction is larger than that in the vertical direction. The wind speed measured by the anemometer is very small on the day of airdrop testing, and the trailing-edge deflection is set as constant, and this is the reason that the velocity of the vertical direction changes little. In addition, the cell billowing always appears on the canopy of the parafoil under the action of airflow. 23 The cell billowing also affects the aerodynamic force which will be the future work. Another source of errors is the complicated noise in the flight process. From the above analysis, the aerodynamic coefficients calculation based on CFD can accurately describe the characteristics of the actual parafoil system.
Conclusions
In this article, the effects on the aerodynamic characteristics of the leading-edge incision and the trailing-edge deflection are addressed. By comparing the pressure and velocity distribution, following results are obtained.
Increasing the length and angle has adverse effect on the aerodynamic performance. The length has a great effect on the lift and drag coefficients, while the angle has an influence on the stability of the parafoil. In the case of the unilateral brake deflection, the pressure distribution is not symmetric. The increment of the lift to drag ratio is relevant with the incision size.
The incision and deflection factors are identified using the CFD method and least squares method. By comparing with the theoretical value, the necessity for accurate calculation of aerodynamic parameters is explained.
The estimated parameters are incorporated into an eight-DOF model; simulation results of basic motions of the parafoil system and comparisons with results from airdrop testing illustrate that the proposed method in this article can accurately predict the aerodynamic parameters. This work can lay the foundation for the accurate modeling of the PADS.
The future work will include as follows: Taking the fluid–structure interaction between canopy and airflow into account, the accurate modeling of the PADS will be realized. Based on the accurate model, we will realize the integrated design of the parafoils, control, and trajectory optimization of the PADS.
Footnotes
Declaration of conflicting interests
The author(s) declared no potential conflict of interest with respect to the research, authorship, and/or publication of this article.
Funding
The author(s) disclosed receipt of the following financial support for the research, authorship and/or publication of this article: This article was supported by National Science Foundation of China under Grant Nos. 61273138, 61573197, and 61603051, the National Key Technology Research and Development Program of China under Grant (2015BAK06B04), the Research Fund of Tianjin Key Laboratory of Process Measurement and Control under Grant NO. TKLPMC-201613.