
Abstract
A fish-eye lens achieves a large field of view at the cost of image distortion, and underwater imaging by a fish-eye lens introduces refraction when light passes through the different medium. To obtain three-dimensional information, under these circumstances, a stereo matching algorithm is proposed that analyzes the geometric characteristics of an underwater fish-eye image, taking into account distortion and refraction. First, the underwater imaging model of a stereo fish-eye camera is established, and the epipolar curve of the underwater fish-eye image is calculated. Then, in the matching step, an adaptive window based on mean-shift segmentation is proposed to further alleviate the impact of distortion. Experiments are performed on synthetic images and natural scene images. The results show that the proposed model and the calculated epipolar curve are effective and that the adaptive window method could improve the precision of stereo matching on underwater fish-eye images.
Keywords
Introduction
In recent years, the application of imaging devices in underwater environments has become a common practice. Such devices can be used on autonomous underwater vehicles, on remotely operated vehicles, and by divers. 1 As a result, three-dimensional (3-D) perception in underwater environments has attracted increasing attention. 2,3 Stereo matching is a key step in obtaining 3-D information, and the epipolar line is the most important constraint. Stereo matching based on general-perspective images has been studied extensively, and a detailed comparative study has been conducted by Scharstein and Szeliski. 4 However, stereo matching based on underwater general images remains challenging. Epipolar line of underwater image would bend because of the refraction, and thus it becomes epipolar curve. Queiroz-Neto et al. 5 performed stereo matching by ignoring the effect of refraction. Ferreira et al. 6 made an approximate estimation of refraction and then removed the effect of refraction from the underwater image. These methods do not calculate the epipolar curve using a refraction model and often suffer from errors. To address this problem, Zhang et al. 7,8 calculated epipolar curves by taking refraction into account but only obtained a sparse disparity map based on scale-invariant feature transform (SIFT) feature points, which could not describe a 3-D scene in detail. Gedge et al. 9 calculated epipolar curves based on a refraction model, thus improving the accuracy of dense matching. In summary, obtaining an accurate dense disparity map of underwater images requires an imaging model of refraction and an epipolar curve as an essential constraint while searching for correspondences.
The abovementioned studies focus on general images. A general camera’s field of view (FOV) is usually 50°–60°, whereas a fish-eye camera has a minimum FOV of 180°. Compared with general cameras, fish-eye cameras can capture more information of an ocean scene. Until now, few studies have investigated the stereo matching of underwater fish-eye images. Naruse et al. 10 studied underwater 3-D measurement using fish-eye images, first converting the central parts of fish-eye images in air to general images and then performing the remainder of the process on the rectified parts. Thus, the large FOV of the fish-eye lens had not been fully utilized, and the distortion rectification introduced a significant error. Yamashita et al. 11 studied a stereo matching algorithm for underwater panoramic images acquired through a convex mirror and a general lens rather than using a fish-eye lens. The vision system was complex, and the captured images were also rectified before the stereo matching.
None of the previous works performed stereo matching on unrectified underwater fish-eye images. In order to avoid errors introduced by rectification, we work on unrectified images. A complete imaging model of the underwater fish-eye lens is established, and an epipolar curve is calculated based on the model. Note that, in addition to distortion caused by refraction, fish-eye cameras introduce serious distortion. Some of the abovementioned works use features to achieve sparse disparity map, while others use regular rectangular windows without consideration of the distortion. In order to deal with this problem and to achieve dense stereo matching of underwater fish-eye images, adaptive support windows that include the matching cost calculation are designed.
The main content of this article is organized as follows. A refraction model is built, and an epipolar curve is derived in the “Epipolar geometry” section. Then, a stereo matching algorithm based on an adaptive support window is presented in the “Stereo matching for underwater fish-eye image” section. “Experimental results and analysis” section presents our experimental results on both synthetic images and natural scene images, followed by concluding remarks in the “Conclusions” section.
Epipolar geometry
In general, the epipolar constraint is the most important constraint in the field of stereoscopic vision and reduces the field of search from a two-dimensional area to a one-dimensional straight line. Similarly, the epipolar constraint is essential to underwater fish-eye images. However, the distortion from a fish-eye lens and the refraction caused by underwater imaging make an epipolar line become a curve, called an epipolar curve.
Figure 1 shows a pair of fish-eye cameras in a canonical configuration, with baseline B and focal length f. In this configuration, points eL1, OL, eL2, eR1, OR, and eR2 lie on the same line. The distance between the optic center and the refractive surface is h, nA is the refractive index of air, and nW is the refractive index of water. Set OL as the origin of the coordinate system. A transparent waterproof cover is needed when placing the lens underwater. Therefore, light travels through water, glass, and air successively. The waterproof cover is very thin and negligible, so we suppose that refraction only occurs when light passes from water to air.
12,13
Our fish-eye lens has an FOV of 180° and can be modeled by an equisolid projection model:


Imaging model of underwater binocular fish-eye lens. According to this model, we can get an epipolar curve on the right image from a point pL on the left image.
where θ is an angle of incidence and r is the radius on images.
In this study, we regard the left image as the reference image and the right image as the target image. The derivation of the epipolar curve is as follows.
Let

Suppose that pL is projected from qL, which is on the left lens’ hemisphere surface. Then, qL is projected from QL on the refractive surface, but the corresponding object point of QL could be any point

where d is the distance between Qi and the refractive surface. The projection of Qi on the right refractive surface is QRi, with coordinates

where Li2 is the distance between QRi and the right optic axis.
The projection of QRi on the right lens’ hemisphere is qRi, and the projection of qRi on the right image is

From the abovementioned formulations, if we take different values for d, we obtain different pRi on the right image, and we can estimate a curve using a piecewise linear approximation of points pRi, that is, the epipolar curve of pL on the right image. Theoretically, the range of d is
Li2 in equation (4) is still unknown and is computed as follows. 9
Figure 2 is part of Figure 1, and the variables in Figure 2 have the same meaning as those in Figure 1. From Figure 2, we have

Refraction occurs at the junction of water and air. This is part of Figure 1. In order to obtain the epipolar curves, Li2 should be calculated.
where Li1 represents the distance between Qi and the right optic axis.
Equation (6) is a fourth-degree polynomial of Li2, but only one root is physically valid, which always lies in
Computation of epipolar curve.

The epipolar curve’s calculation is completed separately, and the result is stored in a lookup table (LUT), which can be called directly in the subsequent stereo matching. For each imaging model, the LUT only needs to be calculated one time.
Stereo matching for underwater fish-eye image
Adaptive window based on mean-shift segmentation
To reduce the image ambiguity, local stereo methods commonly aggregate the support from neighboring pixels in a given size-constrained window. In order to accurately estimate the disparity near depth discontinuities, a local support window is needed to adapt its shape and size and, thus, only collects support from pixels of the same depth.
14
In addition, for underwater fish-eye images, a support window of fixed shape and size is not reasonable because of inhomogeneous distortion. In this case, color is a reliable feature. Therefore, we adopt an adaptive support window based on mean-shift color segmentation.
15
Mean-shift segmentation is based on the hypothesis that pixels lying in the same segment have similar disparity values. Therefore, segmentation is yielded in the presence of low-textured surfaces and depth discontinuities.
16
According to Figure 3, the adaptive window is constructed as follows:
Both the left and right images are segmented by mean-shift method and a label of each segment is obtained (Figure 3(a) and (e)). Let i1 be a pixel of the left image that lies in segment Ll1, and establish a k × k rectangular window Di1
4with i1 as center. Then, the overlap of Ll1 and Di1 is marked as Ji1. If j1, j2…jmax are pixels on an epipolar curve (red curve in Figure 3(f)) of i1 in the right image, then area Jj1 can be obtained as in step 2. The overlap of Ji1 and Jj1 is marked as Jij, in which case Jij is the final adaptive support window of i1 and j1.

Adaptive window based on mean-shift segmentation. The two images in the first column (a and e) are label figures of the left and right images, respectively. Then, (b) to (d), and (f) to (h) are enlarged versions of the areas within the green border in (a) and (e), respectively. (b) Left segmented region Ll1 (area bounded by blue edge), (c) left rectangular window Di1 (area bounded by red edge), (d) left adaptive window Jj1 (area bounded by yellow edge), (f) right segmented region Lr1 (area bounded by blue edge), (g) right rectangular window Dr1 (area bounded by red edge), and (h) right adaptive window Ji1 (area bounded by yellow edge).
It is worth explaining that the image segmentation might obtain inconsistent segmentation results on the left and right images. 17 This is why we use the overlap Jij computed in step 4. The dissimilarity between pixels i and j can be calculated using mean absolute difference (MAD) measures 4

where i and j are the corresponding pixels in the left and right images, respectively, and Jlij and Jrij are their support windows, and nall is the total number of the pixels in the adaptive support window.
Then, winner-takes-all (WTA) strategy 4 is chosen to select the corresponding point for i. The main steps of our stereo-matching algorithm are illustrated in Figure 4.

Flow block diagram of the algorithm.
Experimental results and analysis
Our experiments are performed in MATLAB [version R2010a]. The natural scene images are captured by a binocular vision system, and the synthetic image is made by Persistence of Vision Raytracer. As shown in Figure 5, the binocular vision system is mainly made up of two parts: a binocular fish-eye camera system, whose model is NM33-F, and a laptop computer equipped with a 2.67-GHz Intel Core i5 CPU and 2-GB memory. The binocular vision system is placed behind a large, water-filled tank.

(a) Overview of laboratory equipment. The binocular fish-eye camera system is outside pool and the objects are inside pool, just as shown in (b).
Test images are shown in Figure 6 and are the reference images of a pair.

Test images. Both the synthetic image (a) and natural scene images (b and c) are used as the test images for the experiment. The synthetic image is obtained by software Persistence of Vision Raytracer. For natural scene images, many regions are not submerged in water.
Figure 7 shows some selected feature points in Figure 7(a) with their corresponding epipolar curves in Figure 7(b) of a synthetic scene. It is obvious that each epipolar curve in the right image exactly goes through the corresponding point.

Examples of epipolar curves. The red crosses within blue circles show chosen points in the left image (a), which are used to calculate the epipolar curves in the right image (b).
In general, disparity is defined as the difference between the x-coordinates of two corresponding points. However, for underwater fish-eye images, disparity exists not only in a horizontal direction but also in a vertical direction. Thus, we need to redefine disparity: disparity of a pixel i in the left image is the index number of a pixel in i’s epipolar curve in the right image (if i’s corresponding point is the mth pixel in the epipolar curve, then the disparity of i is (m − 1)).
Figure 8 shows sparse stereo matching results based on the SIFT feature. 18 The left column is obtained by the SIFT matching method, and the right column is obtained by our method. Table 1 presents the percentage of bad matching and the running times.
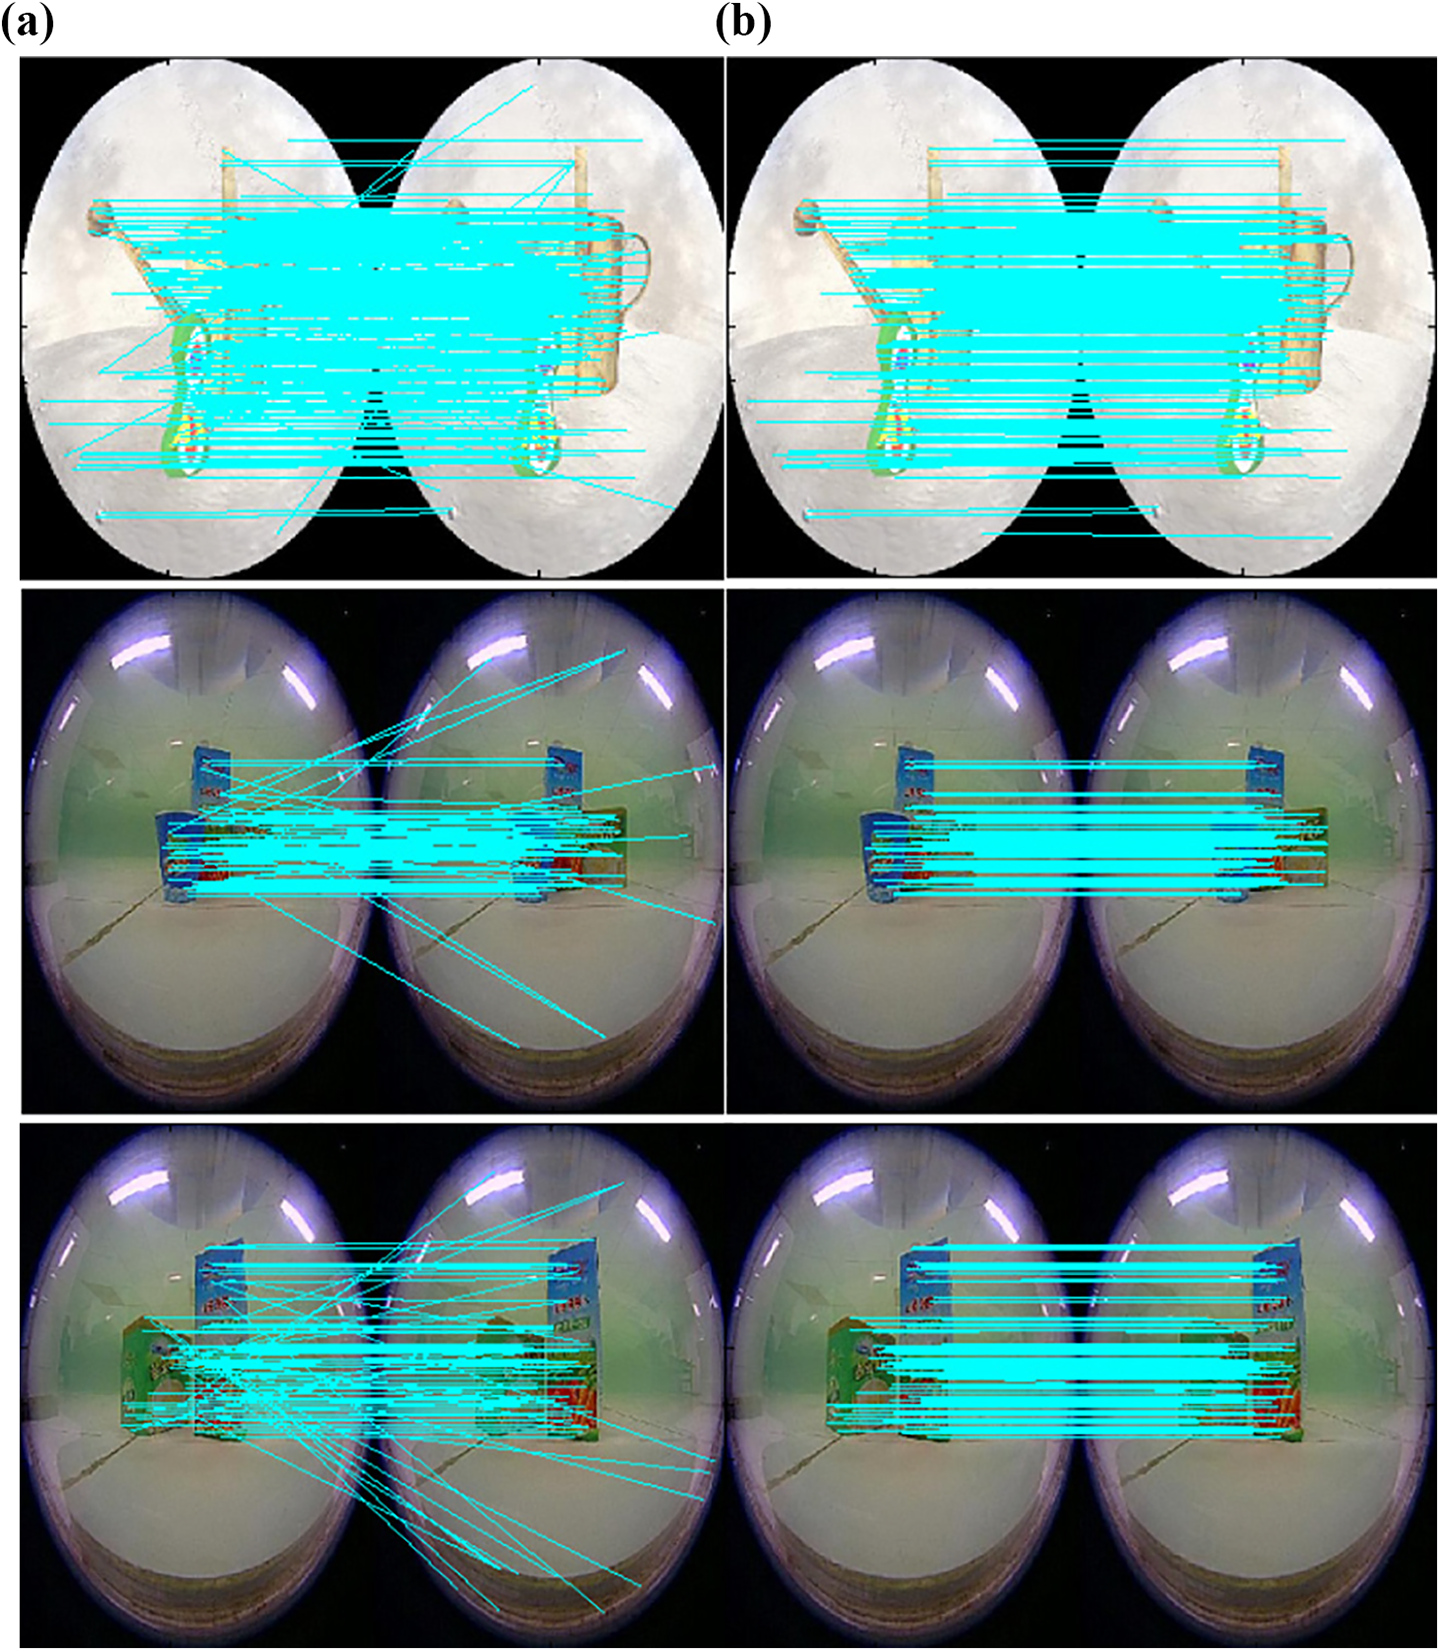
Sparse matching results: (a) matching results from SIFT matching method and (b) matching results from our method (epipolar curve + adaptive support window). The feature points both in (a) and (b) are SIFT points. SIFT: scale-invariant feature transform.
Evaluation of sparse matching based on SIFT points.

SIFT: scale-invariant feature transform.
In Figure 8 and Table 1, we observe a significant improvement in accuracy. In general, an SIFT descriptor is a high-dimensional vector that is robust to scale variance, rotation, and translation. However, SIFT does not work well in matching underwater fish-eye images, because they are incapable of dealing with the distortion in omnidirectional images. 19 Furthermore, underwater fish-eye images have refractive distortion. However, our method obtains a better result with the help of the epipolar curve, even though it uses the simplest matching method (MAD to calculate matching cost and WTA to select corresponding points). The high accuracy of our algorithm proves that the derived epipolar curve is accurate and effective. Our method incurs a higher cost in terms of time than the SIFT method. For very few points, our method uses most of the running time on the image segmentation part.
Figure 9 shows dense disparity maps obtained from a rectangular window and an adaptive support window. Both methods use the epipolar curve described here. Because many regions of the captured images are not actually submerged in water (e.g. the fluorescent tube), we use a mask to indicate which parts of the image are considered for stereo matching. For convenience, the method with rectangular support windows is called “method 1,” and that with our adaptive support window is called “method 2.”

Dense disparity map: (a) matching results from regular rectangular window method (epipolar curve + rectangular support window) and (b) matching results from our method (epipolar curve + adaptive support window). Depths range from close (red) to far (blue).
There is no data set similar to the Middlebury used for the performance evaluation of underwater fish-eye images, and we have no ground truth of the test images. Therefore, we evaluate the disparity map in Figure 8 as follows: randomly pick 1% points in Figure 8(a) and calculate the percentage of bad matches. The quantitative evaluation results are presented in Table 2.
Evaluation of dense matching.

In Figure 9, method 2 significantly improves the matching accuracy over method 1. Improvements are yielded in the presence of disparity-discontinuous regions: There is serious foreground hypertrophy in the results of method 1, and it is obvious that the adaptive support window based on color segmentation can solve this problem very well. In addition, in the natural scene image 1, the matching results of some points in disparity-discontinuous regions are shown in Figure 10.
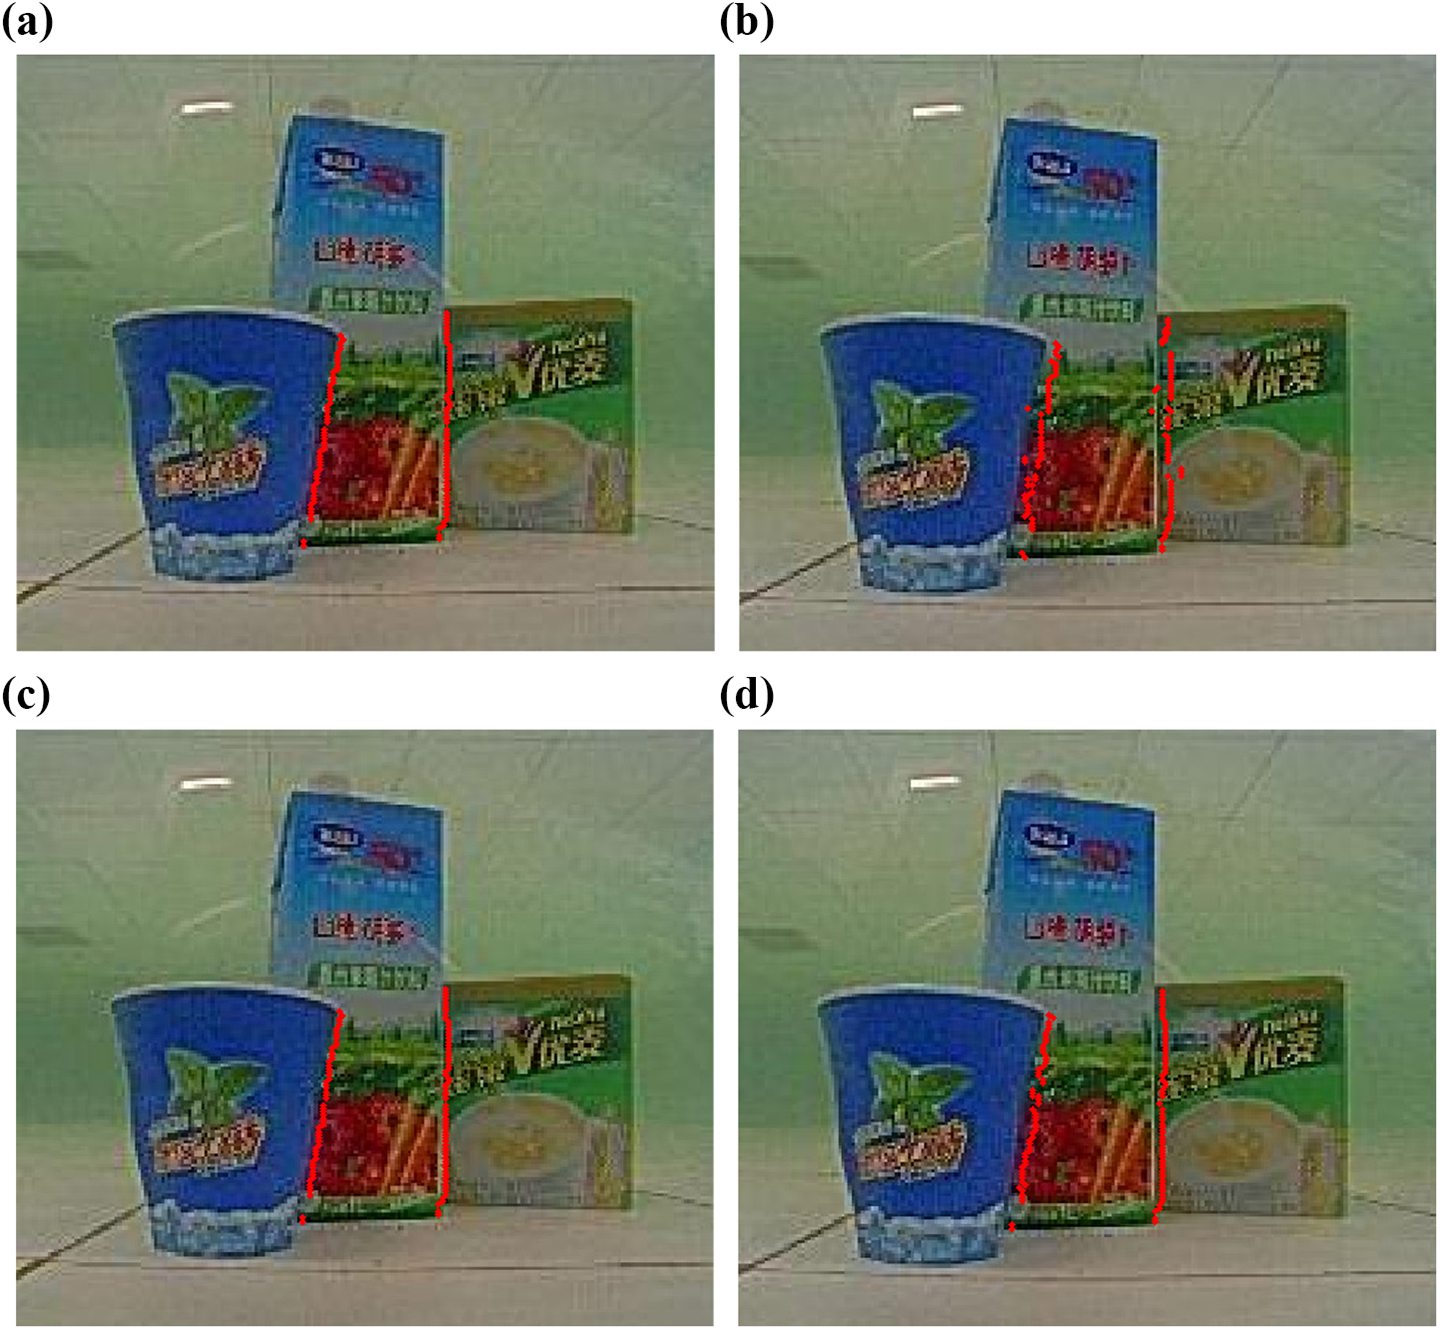
A comparison of the matching results between points in disparity-discontinuous regions using method 1 (b) and points in disparity-discontinuous regions using method 2 (d). The mismatch rate of method 1 is 60.8% and that of method 2 is only 15.2%. The regular rectangular window in method 1 leads to more mismatches in disparity-discontinuous regions.
For non-occlusion regions, in the case of rich texture, such as the pattern area on the box in the natural scene images, the adaptive support window is relatively small to contain points belonging to the same segment. In the low-textured area, such as the floor in the synthetic image, the window is relatively large to contain more neighboring information.
The computational complexity of both methods 1 and 2 is
Conclusions
The stereo matching of underwater fish-eye images is studied. In order to obtain 3-D information accurately without rectification, we examine how the distortion of fish-eye images and refraction jointly affects the epipolar geometry and obtain an epipolar curve on the basis of imaging model. In addition, an adaptive support window for underwater fish-eye stereo matching is proposed. By means of experimental results, the necessity and effectiveness of epipolar curve are proved. In addition, the proposed method with an adaptive support window is able to improve the accuracy of matching results compared to the method with a fixed rectangular window.
Footnotes
Declaration of conflicting interests
The author(s) declared no potential conflicts of interest with respect to the research, authorship, and/or publication of this article.
Funding
The author(s) received no financial support for the research, authorship, and/or publication of this article.