
Abstract
The details of an onboard visual-based navigation system that allows an unmanned aerial vehicle to perform power line following are presented in this article. A histogram of oriented segments method was developed to establish the main angle orientation of power lines. The histogram of oriented segment is also used to discard segments that are not power lines in the images. The components of the unmanned aerial vehicle flight system which include the platform configuration and the hardware used are also presented. A set of tests were designed to validate the methods and the overall system. The system was tested with a sequence of images taken from different perspectives in real inspection tasks. Tests were performed with images taken using an unmanned aerial vehicle with a camera, pointing vertically downward, and also using different kinds of cameras. The techniques developed for unmanned aerial vehicle navigation were employed over power lines using a multirotor. The results showed that a vision system based on the developed techniques is able to give important information to an unmanned aerial vehicle in order to perform autonomous flight missions.
Introduction
Due to the importance of emergent methods that improve the inspection and maintenance of electrical infrastructure, current trends of research show advances in technologies for power line inspection using computer vision techniques. Unmanned aerial vehicles (UAVs) have received increasing attention and have proliferated due to their low cost, advances in control theory, mechanical design, and suitable power supply. All this has propitiated the development of more stable systems in comparison with the traditional helicopters that consist of more than two propellers, some of them are called quadcopters, hexacopters, and octocopters.
The use of UAVs for inspection tasks is very attractive as they help to prevent risks and minimize costs for capturing images and videos 1,2 in comparison with the use of helicopters. Nowadays, the UAVs are an alternative for aerial electrical infrastructure inspection. 3
Most of the work related with visual inspection of electrical infrastructure is based on image processing techniques. Since power lines are fundamental to maintain the electrical supply and distribution, different methods for line detection have been used. 4 –8
Other line detection methods, such as the straight line detection described in the work of Burns et al., 9 the line segment detector (LSD) 10 and edge drawing lines (EDLines), 11 present good results in terms of accuracy and have been considered an alternative for comparing power line detection methods 5 Recently, a method for line detection based on integer operations which uses a circle-based search (CBS) is presented in Ceron et al. 12
The line detection process requires a segmentation stage using different filters such as Prewitt, Sobel, Scharr, 13 and edge drawing 14 (which is used in the EDLines line detection method). Another option is the use of steerable filters 15 as presented in the work by Liu et al. 5 A method for background removal with a pulse-coupled neural network (PCNN) filter has been presented in Li et al. 16 This method was improved in Zhang et al., 17 where the Hough transform and the Kalman filter were used. In the same work, the Otsu filter is employed instead of PCNN with good results. A method for line detection based on region growing, ridge filters, and chain codes was developed in Yao et al. 7
After the application of a line detection method a post-processing stage can be used. This stage is in charge of connecting segments by using geometrical properties as shown in Liu et al. 5 Also, this stage can consist of a clustering of related lines as presented in Zhang et al. 17
Additionally, different sensors have been used, such as infrared 7 and Laser Imaging, Detection and Ranging (LiDAR). Multisource feature fusion information such as point clouds, color, and texture have been used for power line corridor inspection processes that include power line and vegetation 18 Although the use of a combination of different sensors such as LiDAR or RGB-D is highly useful for object detection and recognition, the payload of a UAV is limited. For this reason, this work seeks to explore 2-D image techniques for object detection with common cameras.
Related work
Autonomous visual-based navigation for UAVs is a complex process that requires short computing times and accurate measurements in order to provide suitable and safe control commands to the device. It is clear that UAV navigation requires real-time measurements to produce a response within a specified time (at least 100 ms), otherwise severe consequences including failure may affect the device. The evaluation of the performance of a visual-based navigation system for power line following is presented in simulation for a fixed wing UAV in some works for example in the study by Mills et al. 19 In a previous work, the simulation of a visual-based navigation process for power line following in a 3-D environment using a closed-loop control is presented in Ceron et al. 20
The relevance of visual-based navigation methods has been proved viable as shown in works for example in the study by Sanfourche et al. 21 Also, in the work of Sa et al., 22 high-speed vision for pole inspection was used. This is a case where the GPS information is not enough and unsuitable for close fly navigation. Additionally, in the work of Zarandy et al., 23 a real-time multi-camera vision system based on Field-programmable gate array implementation is presented. These examples show the advantage of the vision systems for UAV autonomous navigation.
The analysis of the line orientation from images taken with a camera pointing vertically downward is valuable (see Figure 1) for the detection of power lines and for correcting the UAV orientation when it is navigating autonomously.

Images of power lines taken from a top-down view.
Problem and main contributions
In this work, a robot operating system (ROS)-based environment was used. It is key to highlight, the evaluation with a real multirotor UAV of a power line following system represents an important concern in the area of robotics.
The main contribution presented in this article is the development of a set of techniques to detect line features and this includes an adapted version of the CBS algorithm, a method to obtain the power line orientation defined as a histogram of oriented segments (HOS), and a process to detect power lines. Another contribution is the design and development of a system that performs onboard visual-based navigation for power line following using the developed techniques.
The remainder of this article is organized as follows: Line detection methods are introduced in the “Power line detection using CBS” section. HOS is described in the “Histogram of oriented segments” section. The autonomous navigation system architecture is illustrated in the “Autonomous navigation system” section. Experiments and results are presented in the “Experiments and results” section and finally, the conclusions and future work are presented in the “Conclusions” section.
Power line detection using CBS
In Ceron et al., 12 a line detection method called CBS was presented. This process shows a favorable performance compared to Hough, LSD, and EDLines. In this work, we extend the process to power line orientation and UAV navigation. The process used a discrete circle algorithm to generate positions for line searching.
The CBS method is presented in Algorithm 1. In this algorithm, the method ValidPoint is in charge of searching in the range of possible line orientations [0, 2π] with the values of Dx and Dy, where there are more points that belong to a line. This is done using a drawing circle algorithm to generate the positions of points by symmetry. The method NextCircle is in charge of finding the next valid points in the same direction detected with the values of Dx and Dy in order to move to the end of the line (see Figure 2). Also, r is the actual radius that is increased by incr in order to repeat the searching with different radii. It is good to note that the points that belong to a detected line are deleted. The output of the algorithm is a list of segments. Each segment has an initial point (xi,yi ) and final point (xf,yf ).

LocateLine.

CBS process. CBS: circle-based search.
The main difference with the original version presented in Ceron et al. 12 is that the linking stage is avoided in order to reduce the computational cost. Instead of a linking stage an HOS is used.
The results of different state-of-the-art line detection algorithms using the navigation images of this work have been added in Table 1. In this table, we can observe that the CBS method is competitive with respect to the other methods.
Computation times of line detection methods in miliseconds.
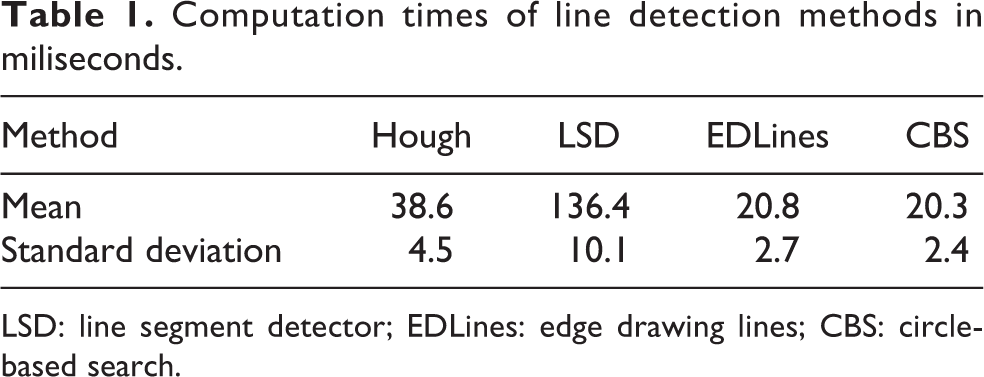
LSD: line segment detector; EDLines: edge drawing lines; CBS: circle-based search.
In Table 2, a comparison between different methods for line detection using 14 images is presented. In the used images, three power lines are presented and the number of false positives (FP), true positives (TP), false positives (FP), and false negatives (FN) are obtained by counting each segment detected. In this table, it is remarkable that the number of FP is greater in the LSD method, since it detects a lot of small segments. The CBS presents a good balance in short time compared with the number of FP compared with the other methods.
Quantitative results of line segment detected for 14 images.

LSD: line segment detector; EDLines: edge drawing lines; CBS: circle-based search.
Precision Recall: Using the total of TP, FP, and FN for each line detection method. The precision and recall values were obtained in testing by using the follow expressions


In Table 3, the average of precision and recall values is shown. The CBS method shows a good precision which is similar or superior to the other methods.
Precision and recall for line detection methods.

LSD: line segment detector; EDLines: edge drawing lines; CBS: circle-based search.
Nevertheless, the improvement of this performance requires the use of more advanced methods related with computational intelligence that are proposed as a future work.
Histogram of oriented segments
According to Ceron et al., 12 in a power line detection process using a camera pointing vertically downward, different characteristics can be highlighted aiming at improving the detection such as length of the line (the longer segments should have more importance than smaller ones), direction with higher number of long lines (a histogram of orientations is considered), and structure of lines (power lines present a pattern of parallel lines in a top-down view).
Following the abovementioned characteristics, in this work, a measure based on the linear content of the image is proposed. The measure is obtained from an HOS that has three purposes: First, obtaining the orientation angle of the power lines for UAV navigation. Second, selecting the power lines in the scene. Third, defining a way to differentiate between a scene with and without power lines.
As a prerequisite, the image has to be taken, when possible, from a top-down view, and the radial distortions must be corrected. It is assumed that the main linear components in the scene are power lines. This histogram is defined in the interval from 0° to 180°. The main idea is to obtain a histogram of line segment angles that are pondered with the length of each line.
Let (xi,yi ) be the coordinates of the initial point and (xf,yf ) the coordinates of the end point of a k segment.
The following are the steps to obtain the HOS: Obtain lines in the overall image. The segments detected are collected in a list of M elements. Create an array H of 180 elements which corresponds to angles in the interval [0°, 180°). Initialize the array with zeros. For each line segment line
k
dx = xf
− xi
. dy = yf
− yi
. length = norm(line
k
).
θ = ComputeAngle(dy, dx). Correct θ to interval [0°, 180°). Use this angle as an index in the histogram and accumulate the length of line.
H[θ]+ = length.
The ComputeAngle(dy, dx) function is obtained by using the atan2(dx, dy) function and is corrected in order to have angles within the interval [0°, 180°) in the histogram
Main angle
Due to the fact that the HOS contains the most representative angles that are present in the scene, it is possible to get the maximum values. These values are an estimation of the line orientation. After the histogram is obtained, the main angle θ main is extracted as the index which corresponds to the maximum of the histogram as shown in the following

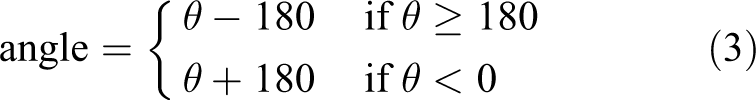
After this, the angle range is transformed to the range [−90°, 90°] in order to use this as a control variable in the visual navigation system as shown in Figure 3. The correction of range is given by θ = −(90 − θ main).

Main angle of power lines from a top-down view.
In Table 4, the main angles for the set of images in Figure 1 are presented.
Main angle detection in images of Figure 1.

Once the main angle θ is obtained, the image can be segmented by selecting lines with similar angles. This way, only lines with angles close to the main angle are selected.
The algorithms were tested in different rural scenarios where it is possible to find different man-made objects such as water channels, roads, and fences. For instance, in Figure 1(g), the power lines intersect a set of fences. In this case, the angle of the power lines is correctly detected as can be seen in the eighth column of Table 4. The developed method is able to detect power lines from a top-down view.
HOS as a global descriptor
The information obtained with the HOS is useful not only for obtaining the main angle of the power lines but also to discriminate whether power lines exist in the scene. This is done by comparing the maximum value of the histogram with a threshold. Angle estimations are selected only when the maximum of the histogram is greater than a threshold which is obtained from the data set.
Autonomous navigation system
UAV system description
In this work, a low-cost hexacopter platform-type DJI 550 that was adapted to carry the equipment is used (see Figure 4). In order to enable the navigation tasks that include vision processing and position control, an onboard companion computer was employed. We used an ODROID U3 computer with an ARM processor and a 32 bits Pixhawk flight controller of controlled by the companion computer. The system runs under linux Ubuntu 14.04. OpenCV is used for implementing computer vision algorithms and ROS Indigo to integrate the robotic platform.

UAV platform and flight tests. (a) Hexacopter, (b) camera pointing vertically downwards, and (c and d) test flight. UAV: unmanned aerial vehicles.
For the vision system, two USB cameras were tested. An action camera Mobius (equipped with wide-angle lens) and an ELP industrial camera USBFHD01M (see Figure 4(b)).[Please provide manufacturer’s details for “ELP industrial camera USBFHD01M,” if applicable.] Although it is possible to obtain the calibration parameters of the action cameras it is a challenge to reduce the radial distortion. This makes it difficult to detect rectilinear objects since they generate curves instead of lines. The detected lines appear as curves, specially at the extremes of the image. Nevertheless, with the main angle obtained from our line detection method, it is possible to get an estimation of the line orientation.
In order to get better results in terms of the rectification of images an ELP camera was used. This device provided images that are suitable for the line detection process plus a frame rate that permits closed-loop control. The UAV system consisted of a set of related components that are shown in Figure 5. The main components of the system are the UAV flight platform, the flight controller, the sensors that include GPS, IMU (Inertial Measurement Unit, that includes three axes magnetometers, gyroscopes, accelerometers, and compass), camera, and the onboard computer to run the developed software. In this system, the flight controller receives setpoints from the onboard computer and sends sensored information to it. The vision sensor (camera) sends frames of images to the onboard computer.

UAV system. UAV: unmanned aerial vehicles.
System architecture
In this work, tasks involved in a mission of power line navigation are coordinated by a task manager (see Figure 5). The task manager receives data through sensors that include an accelerometer and a GPS. Also, it uses high-level information obtained from the image provided by the camera. The information extracted by the developed vision module using the proposed algorithms is an input for the control in the task manager.
A position control interface for the Pixhawk flight controller is used; this interface receives the desired commands from the task manager during the UAV mission.
For the implementation, a set of ROS-based modules have been developed. The most representative procedures are explained in Algorithms 2, 3, and 4. The main modules are the following: Vision module: This module performs the video capture, image smoothing, camera calibration, edge segmentation, line detection, histogram of oriented lines, and computing of the main angle. Navigation task manager: This module determines the set of autonomous actions to be performed by the UAV during a flight mission. The main tasks are Take off, Ascend (vertical flight), Rotate, Move_forward, Move_until (see Algorithm 2), Align (see Algorithm 3), Follow lines (see Algorithm 4), Return, Descend, and Land.

Move until.
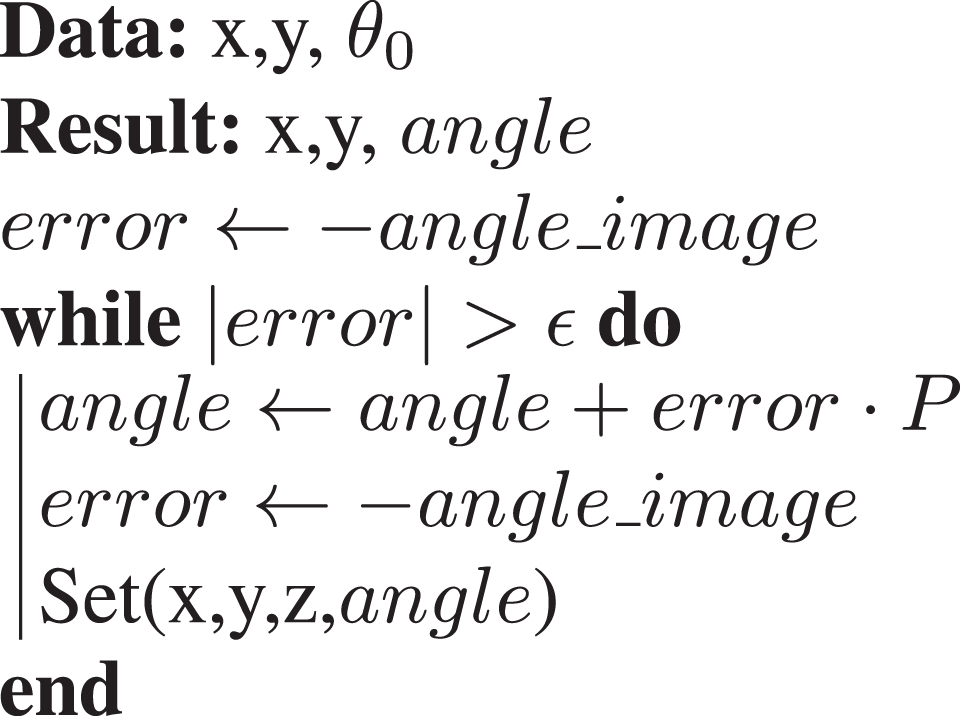
Align.

Follow_lines.
In these algorithms, the initial yaw orientation of the UAV with respect to the north is θ 0. The angle variable is the orientation in UAV coordinates. In the alignment algorithm, the control loop aims to reduce the angle error. This loop continues until the absolute value of error is less than a threshold ε. In the designed high-level architecture, a proportional control is implemented based on the main angle of the detected lines in order to align and follow lines. The scheme of the visual servoing system is presented in Figure 6. An image-based visual servoing was implemented. This control uses the angle obtained in the vision module. In a low-level part, a position control receives the reference for power line following to keep a safe flight.
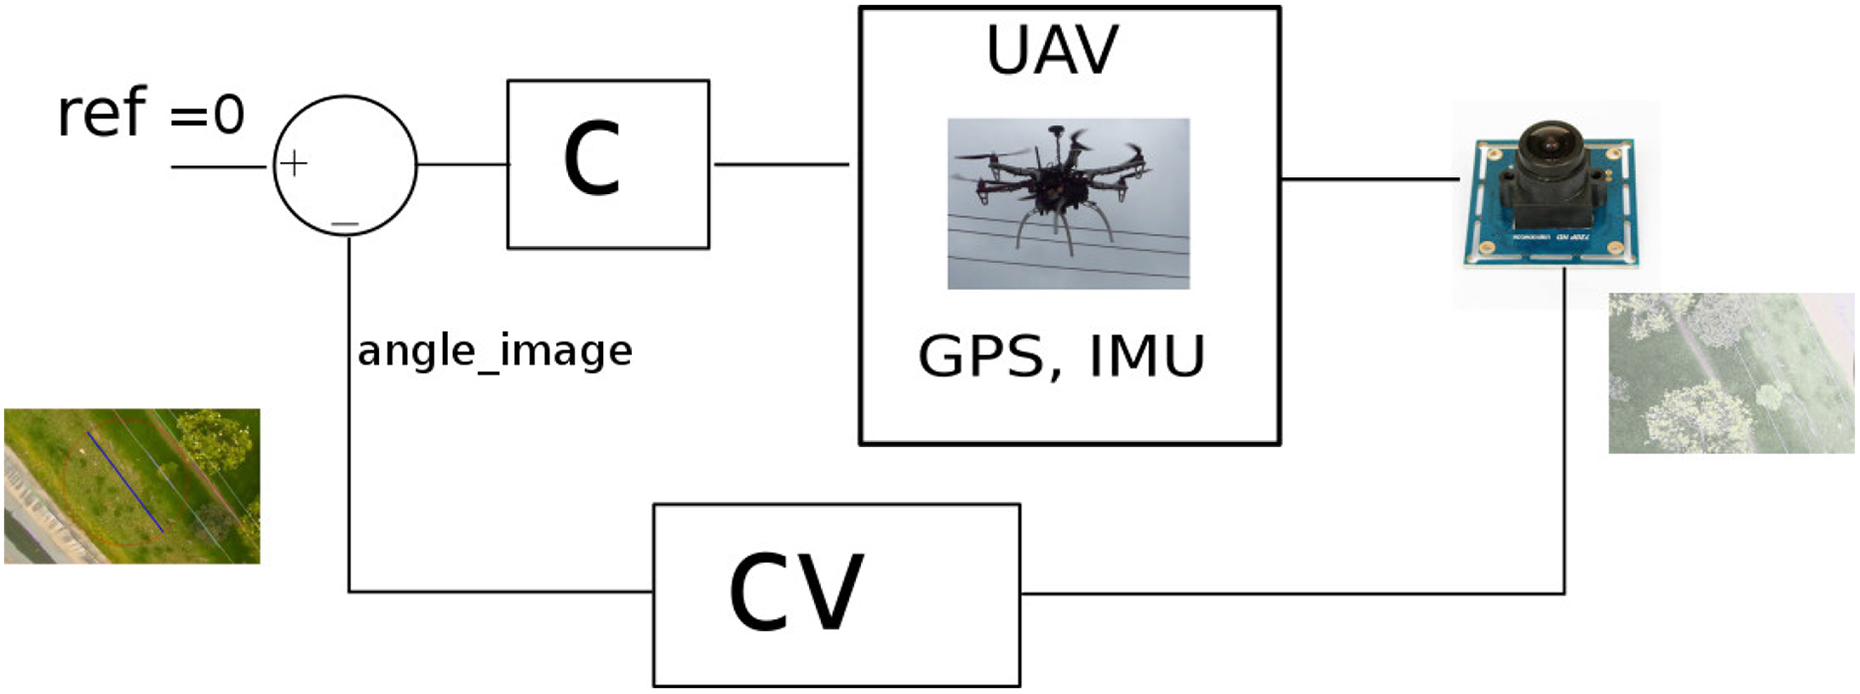
Control system.
This kind of control was used because the addressed problem considers only power line detection from a top-down view; this is to simplify the flight strategy and avoid collisions. In Figure 6, the computer vision techniques are located in the block (CV) that receives the image from the camera.
The increment used in each iteration is defined with the r variable; an incremental error is considered. The function Set(x, y, z, angle) mentioned in the algorithms is used to send a position setpoint and a yaw angle to the UAV. The position (x, y, z) is updated in the algorithms: Move_until and Follow_lines.
Experiments and results
Several experiments have been conducted in order to validate the proposed approach for power line following that includes the evaluation of CBS line detection method, the HOS algorithm, and the UAV autonomous system.
Three types of experiments were performed. First, using images from a real power line inspection in an off-line process. Second, using a video taken with an action camera. Third, using an embedded real-time system to accomplish the autonomous visual-based navigation strategy of power line following with the presented algorithms.
Data set
Three data sets of power lines captured using aerial vehicles were employed. First, a subset of 800 images from a video sequence of a real inspection task taken from a helicopter. This information was used to compute the main angle with the HOS. Second, a set of 1097 images of a video sequence are taken with a UAV with a camera pointing vertically downward in continuous flight during the line following process.
First test: Data collection of power lines inspection
A set of images taken from different perspectives of a power line inspection process in a continuous flight are used. In Figure 7, some images are shown.
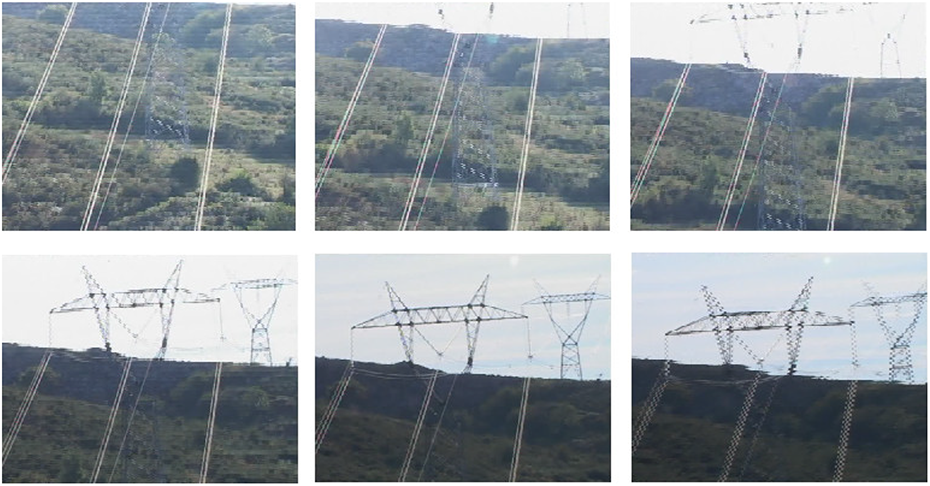
Some images from a power line inspection sequence.
The results of the main angle calculation obtained in a sequence of frames from an electrical inspection are shown in Figure 8. In this figure, the vertical axis is the detected angle (in degrees) and the horizontal axis is the number of the frame. Also, four images related to the approximate angle orientation are shown.
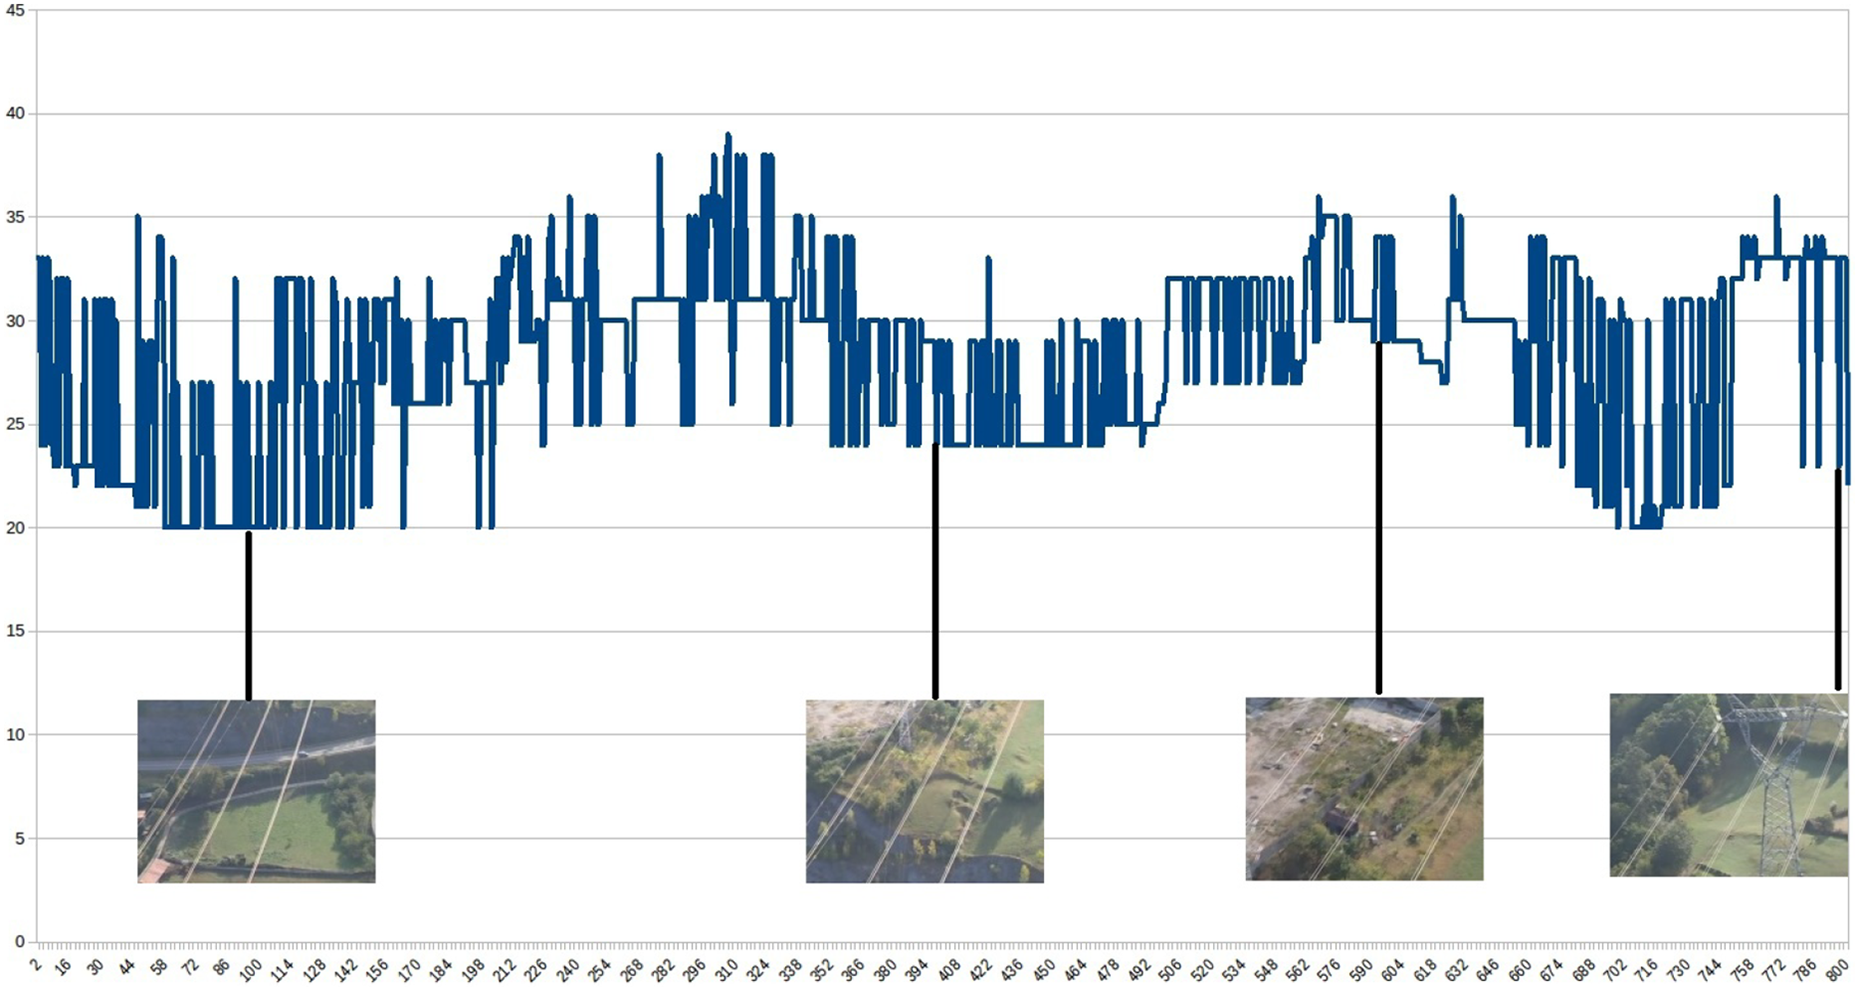
Angle obtained in a sequence of images from a perspective view.
It is relevant to note that the presented process showed a good estimation of the power line orientation since the images in this sequence were taken from different perspectives and backgrounds. The variation in the results among consecutive frames oscillates around 5°.
Taking into consideration that the process shown in Figure 8 has the purpose of angle detection in a frame sequence that contains power lines taken from a perspective view, each frame contains a different view of the objects in the scene. The changes in camera pose due to the movement modify the linear content at the scene. This makes that some edges can be more distinctive at different times then some changes are produced in the detected lines. As a result, the detected orientation angle oscillates from frame to frame as it is shown in the mentioned figure.
For this kind of behavior, it is possible to use a moving average filter in order to reduce the variations in the control signal as it is shown in Figure 9. The average filter is shown in the following expression


Filtered signal of the angle obtained.
Due to the fact that obtaining the main angle from a perspective view is a particular case with many oscillations, the next tests use sequences taken from a top-down view.
Second test: Line detection using a video taken with an action camera
In this experiment, an action camera pointing downward was attached to the UAV in a manual flight. For this, the CBS line detection algorithm was validated in a video sequence of 2 min. The frames had to be rectified using a camera calibration toolbox. The result of the HOS method applied to some frames of an action camera video of the main angle detection is shown in Figure 10, where the main angle is represented with a blue line in the center of the image. The rest of segments are colored with different colors in order to differentiate from each other. In spite that the corrected image shows some curvature distortion, the algorithm was able to detect the power lines in the scene and reject the others as can be seen in the following video:
Main angle detection with an action camera [https://youtu.be/RsKAst6o-0o].

Results of HOS in some frames taken with an action camera. (a) frame 1, (b) frame 2, (c) frame 3, and (d) frame 4. HOS: histogram of oriented segments.
As it can be seen in the video, the proposed method is able to detect the main direction of the power lines, since the accumulator used gives important information about the principal segments with the same direction in the scene. It is good to note that although the frames of the video present many different objects such as parts of a water channel, a pole, and trees that can be detected as line segments, the system is able to detect the main angle of the power lines accurately.
Third test: Lines following using an onboard vision system
The proposed approach was tested with the companion computer equipped with the autonomous navigation system. The system included the CBS algorithm and the HOS process execution. With the onboard vision system, the UAV performed a navigation over power lines. The UAV had to make a horizontal flight to detect the lines with the camera pointing vertically downward. The camera shots frames with a resolution of 640 × 480 pixels. As it is mentioned in Table 1, the CBS algorithm takes 20 ms aproximately with this image size. The HOS process takes less than 5 ms to obtain the main angle. An experiment of a power line following mission was prepared. The mission consisted of the following tasks: take off, ascend, move_until, align, follow_lines, rotate (180°), follow_lines, rotate (−90°), move_forward (the same distance required by UAV to reach the power lines from the origin), descend, and land as shown in Figure 11.
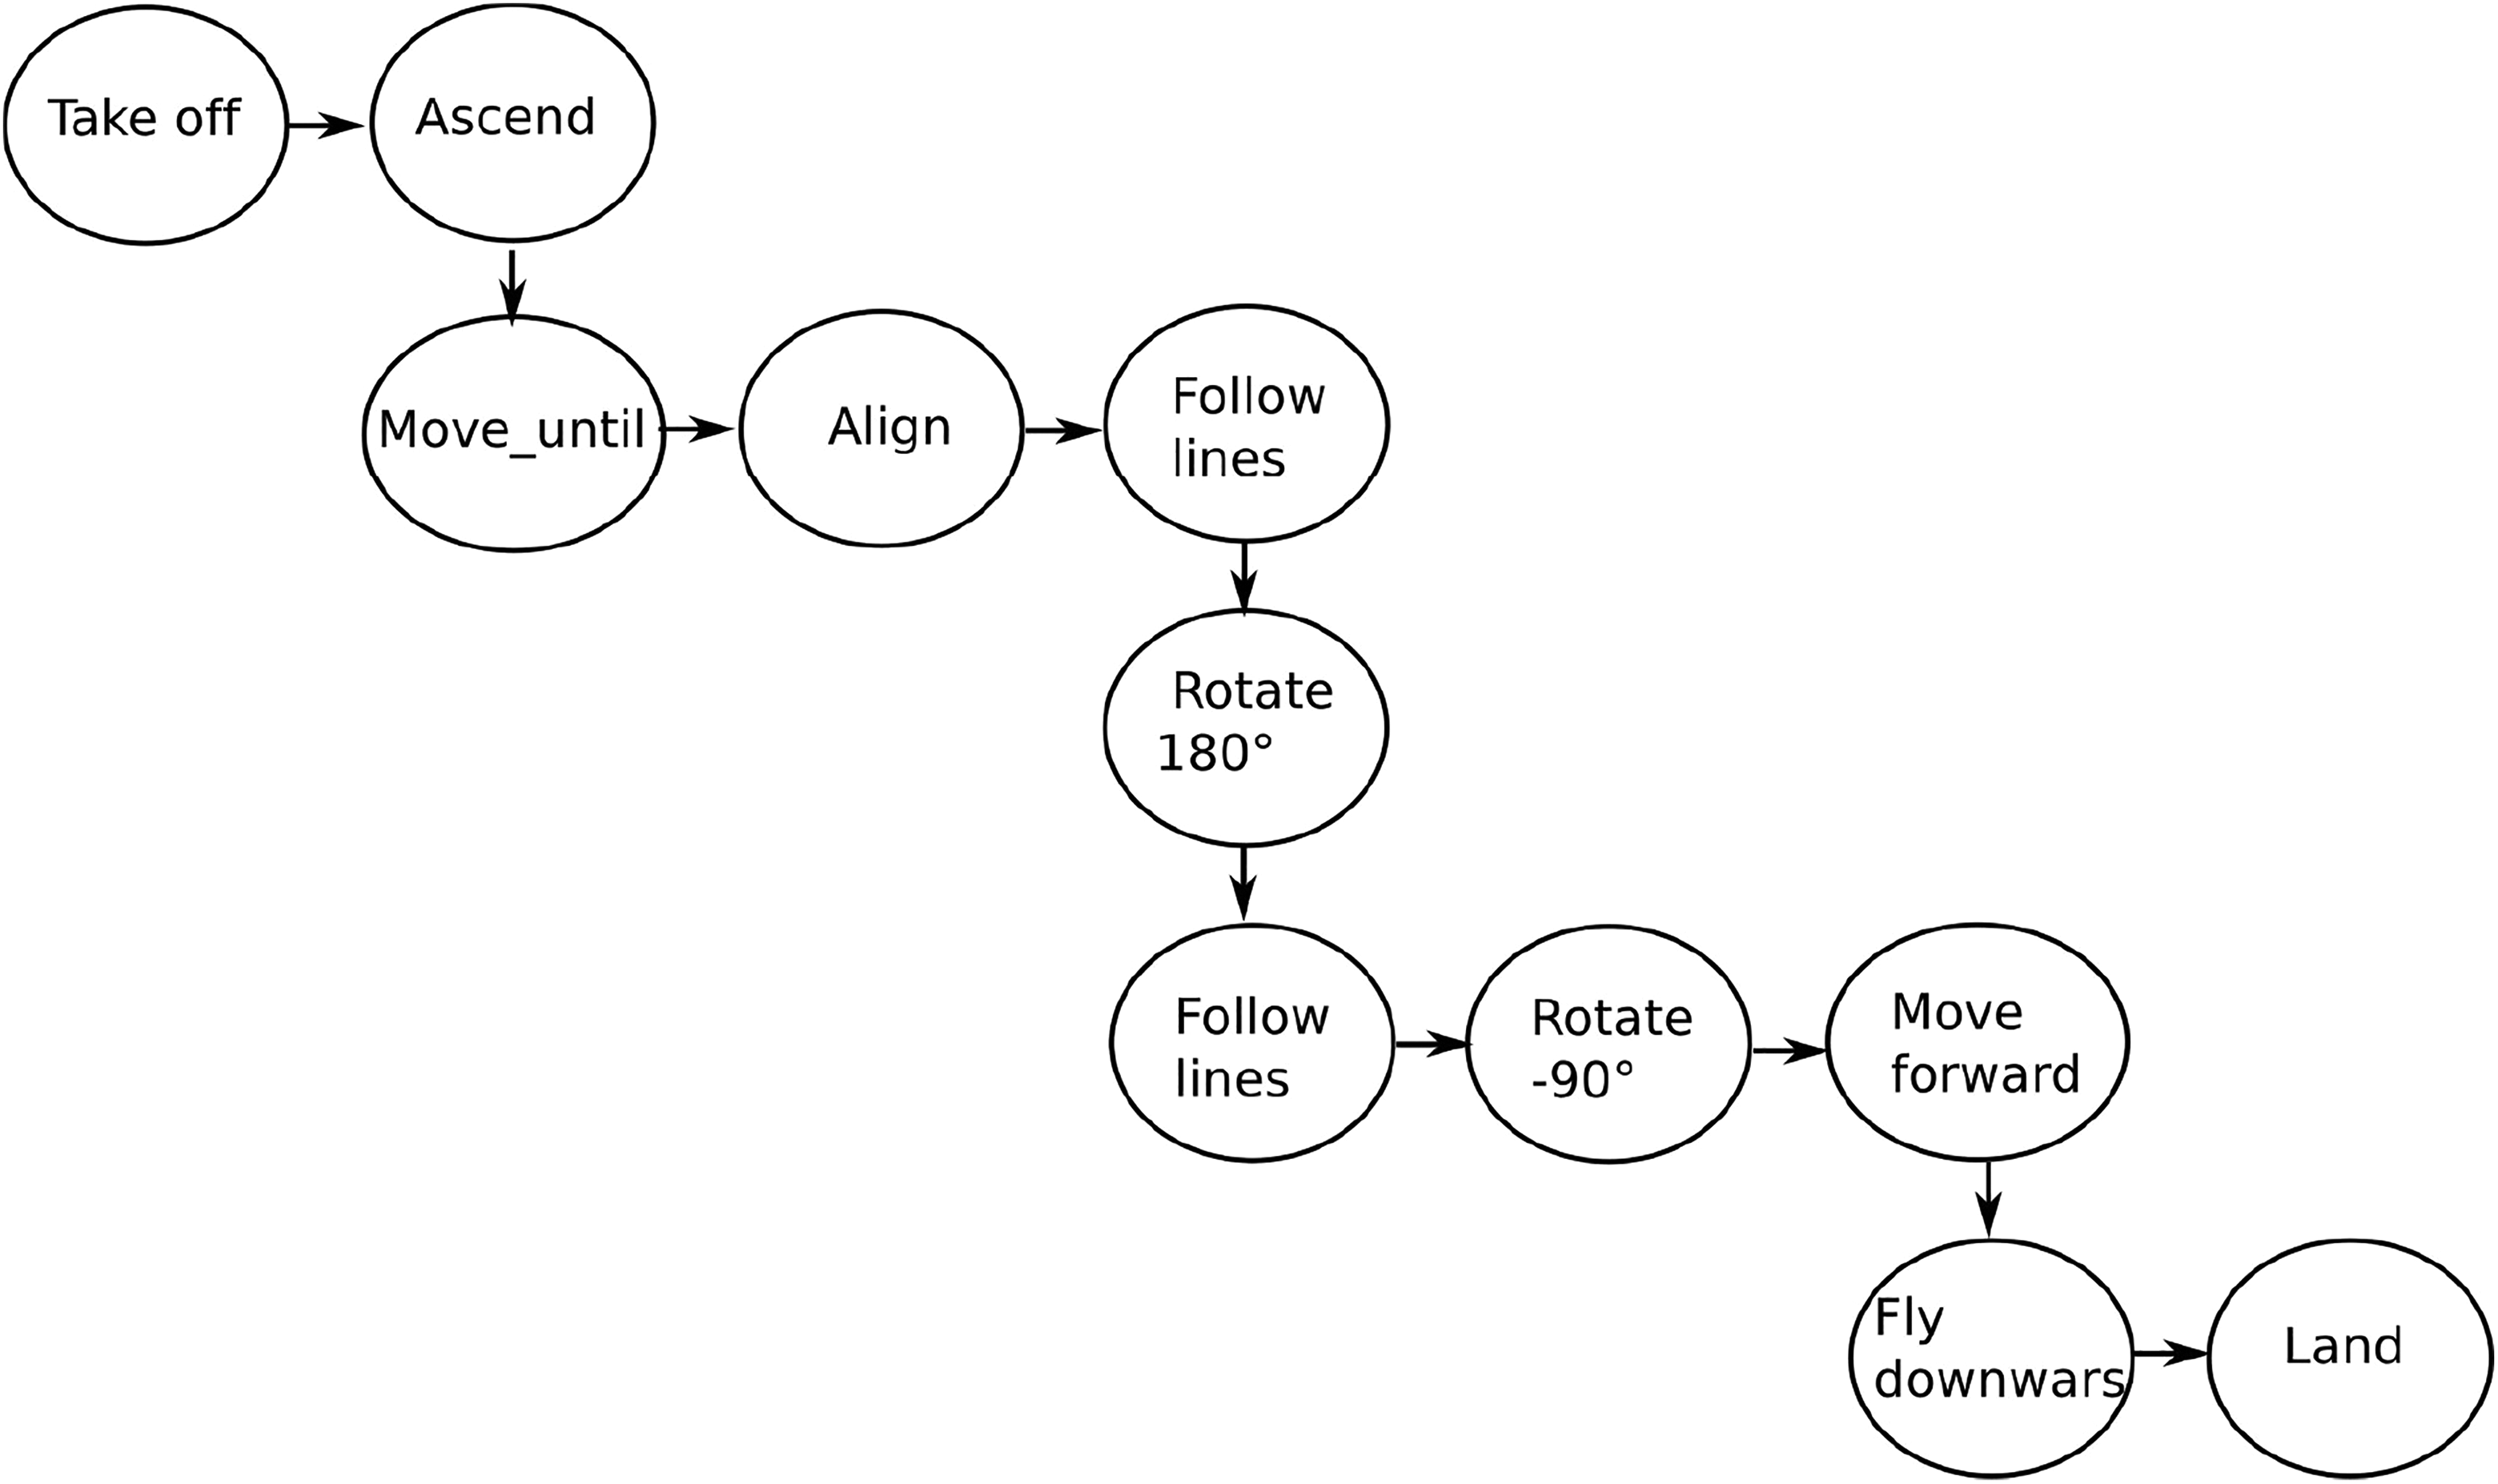
Autonomous mission process stages.
A data logger was used to record the information that included the position and captured images in each flight. Four flight missions were performed in different days. The HOS is used to detect if power lines are present in the scene. The UAV flight forward continues until the power lines are detected n times. The number n is used to score the number of detections. When n is higher than a threshold (e.g. four detections), the alignment process is initiated. The alignment process continues until the alignment error in the image is less than 5°. After that, the following lines process is started.
In this test, the results of different autonomous navigation missions are presented. In Figure 12, some images obtained and recorded with the data logger during the process of an autonomous navigation mission are shown. The blue lines represent the detected orientation in each image.

Complete autonomous power line following mission. (a) Take off, (b) ascend, (c) move_until, (d) detect, (e–h) align, (i, j) follow, (k) return, and (l) descend and land.
The flight information recorded with the data logger is presented in Figure 13. Here, four trajectories of power line following are shown (trajectory in blue and power lines in red). In first place, we tested a mission composed of the following stages: take off, ascend, move_until, align, follow_lines, and return (the return stage was performed manually) as it is shown in Figure 13(a) and (b), from a perspective view.

Trajectories obtained in two different missions of four flights. The positions in these figures have been measured in meters. (a) Test 1, (b) test 2, (c) test 3, (d) test 4, (e) upside view test 3, and (f) upside view test 4.
In second place, we tested a completely autonomous mission of power line following consisting of the stages presented in Figure 11. One of the main purposes of the stages prepared was that the UAV returns to its initial take off location. The results of two autonomous missions are shown in Figure 13(c) and (d), from a perspective view, and in Figure 13(e) and (f), from an upside view. As it can be seen the UAV satisfactorily performed the complete process using the onboard companion computer with no human intervention during the flight. Such achievement was done using our line detection and main angle detection methods.
This process can be seen in the following videos: Test flight [https://youtu.be/c60UfQ7FKyI]. Data logger [https://youtu.be/pa4fqoGJmDU].
In the last video, the lines appear in the image during the autonomous process of power line following.
Finally, a linear regression using singular value decomposition was computed with the 3-D positions of the autonomous trajectory of power line following of the visual-based control. The results of the linear regression are shown in Figure 14.

Linear regression of a power line following path (trajectory in blue and regression in red). (a) Following 1, (b) following 2, (c) following 3, and (d) following 4.
As a result a 3-D line is obtained in the parametric form (see equation (6))

where

where i is an index for the points in the trajectory.
The results of the average error calculation (see equation (8)), expressed in meters, for each trajectory of N points (3-D positions) and for each one of the four missions, are shown in Table 5. The obtained error gives a measurement of the variations in the desired trajectory. This error depends on different aspects such as wind presence, camera resolution, and the delay in response of the control system. This error can be reduced by using a camera with better resolution and an onboard computer with better configuration for performance

Average error of each mission in meters.

On the other hand, a measurement of the location of lines in the images was obtained in order to quantify the offset of the detected line to the center of the image. This distance is considered as an approximation of the error in each frame.
The error in pixels of the line following process in an autonomous mission was less than the 18% of the width of the image. In Figure 15, an example of the measured Euclidean distance in pixels is shown.

Distance between power lines and the center of the image.
Conclusions
The monitoring process of electrical infrastructure requires the development of automated non-intensive methods of inspection that allow the evaluation of the actual state of lines without expensive or dangerous interventions over the installation surroundings.
The HOS permits computing the direction of linear content in images. The main peak of this histogram is an estimation of the orientation of power lines in countryside environments. Since many of these lines are presented in the environment surrounded by trees and other types of vegetation, histograms can be used not only to obtain an orientation but also for segmenting the lines that are related with the main orientation angle. Additionally, the HOS can give an estimation of the presence of power lines in the image.
The results shown in Figure 8 indicate that the line orientation help the UAV to remain in a trajectory following power lines. An additional advantage of the proposed methods is that the computing time of the detection algorithms (see CBS method and HOS) for different types of images (including from UAV or aerial inspection) is short. The use of this information is very valuable for the UAV navigation system.
The proposed navigation system enables the UAV to perform an autonomous flight without any manual intervention of an operator (or pilot) using the proposed techniques that include the CBS line detection method and the HOS method with a low-cost UAV.
From the experimental work, we conclude that power lines are very difficult to detect with the same accuracy in all frames of a video. This is due to different reasons: There are thin elements which are affected by the abrupt movements of the UAV, the difference of backgrounds found while flying, and illumination changes.
As future work, a technique of power line detection based on a machine learning approach could be useful to deal with complex scenes in which edge detectors are not effective. The development of a system with a fixed wing platform could be useful for long-distance inspections. Finally, the study of the effects of oscillation of the detected main angle can be considered in order to improve the control strategy using methods such as filtering.
Footnotes
Acknowledgements
The authors appreciate the collaboration of Professor Luis Mejias of Queensland University for sharing a data set of power line images. The authors appreciate the collaboration of Professor Pascual Campoy of the Universidad Politecnica de Madrid for his valuable recommendations and his Computer Vision Group.
Declaration of conflicting interests
The author(s) declared no potential conflicts of interest with respect to the research, authorship, and/or publication of this article.
Funding
The author(s) disclosed receipt of the following financial support for the research, authorship, and/or publication of this article: This work was supported by the Vicerrectoria de Investigaciones - Universidad Militar Nueva Granada through the INV ING 2120 project.