
Abstract
In this article, we tackle the problem of developing a visual framework to allow the autonomous landing of an unmanned aerial vehicle onto a platform using a single camera. Specifically, we propose a vision-based helipad detection algorithm in order to estimate the attitude of a drone on which the camera is fastened with respect to target. Since the algorithm should be simple and quick, we implemented a method based on curvatures in order to detect the heliport marks, that is, the corners of character H. By knowing the size of H mark and the actual location of its corners, we are able to compute the homography matrix containing the relative pose information. The effectiveness of our methodology has been proven through controlled indoor and outdoor experiments. The outcomes have shown that the method provides high accuracies in estimating the distance and the orientation of camera with respect to visual target. Specifically, small errors lower than 1% and 4% have been achieved in the computing of measurements, respectively.
Introduction
Nowadays, the mobile robot localization has an important role in the development of robot systems. A continuous monitoring of the vehicle pose is mandatory when dealing with autonomous real-time applications. The pose estimation is achieved by means of onboard sensors 1 such as odometers, inertial measurement units, infrared and ultrasonic sensors, Radio Frequency IDentification (RFID) tags, 2 visual sensors, and so on. Among all of these, vision systems have opened new scenarios concerning the accurate robot localization, 3 –5 taking advantage of their accessible cost.
The localization problem also affects the field of aerial robotics, since autonomous pose estimation can enable unmanned aerial vehicles (UAVs) to be employed in several innovative scenarios of great interest. The most common applications of UAVs are rescue operations and medical assistance, inspection and monitoring of disaster areas, surveying and mapping of areas inaccessible to humans, commercial aerial surveillance, forest fire detection, military services, and several other applications.
One of the most challenging tasks for UAV is landing. In this regard, the aerial vehicles must be able to autonomously land onto a dynamic or moving platform. During these operations, a high safety level is required in order to avoid damages to themselves or other external agents. Most of the autonomous landing systems employ computer vision (CV) algorithms as well as other auxiliary sensors as Global Positioning Systems, gyroscopes, and accelerometers (Inertial Measurement Units [IMUs]), and so on. These algorithms are able to recognize known patterns which can be natural or artificial (i.e. human-made). In the latter category, different methods were proposed over the years in order to detect artificial drone pads such as helipad-shaped targets, landing platforms made of concentric circles, 6,7 squared markers, 8 and so on.
In this article, we propose a vision-based method able to provide the pose of a landing pad with respect to the camera. The pose estimation of UAV on which the camera is fastened is implicitly computed. The algorithm has to support continuously the flying vehicle during its landing phase. We consider the standard helipad (made of the marker H inside circles) as visual target because it is commonly located at airports, on the top of skyscrapers, on large ships and oil platforms, hospitals, and so on. By computing the curvatures of H contour, we are able to identify its 12 corners, which are then used to estimate the homography matrix and evaluate the pose information of heliport with respect to the camera.
The article is organized as follows: The second section discusses the related works. Then, the explanation of visual algorithm which allows to find the helipad marks is presented in “Computer vision algorithm” section, whereas the description of experiments and their outcomes are reported in “Results” section. Final remarks and future works are in “Conclusions and further works” section.
Related works
In literature, there are many methods based on CV for helipad detection and pose estimation of UAVs. 9 In Prakash and Saravanan, 10 an algorithm which employs the scale invariant robust features was implemented to detect the features of character H. A preloaded template image of the helipad is matched with the aerial images by using these invariant features. The method also deals with blurred images that are typically due to vibrations of UAV or external weather conditions. The authors claimed that the average helipad detection time was found equal to about 300 ms.
Another algorithm able to recognize the international standard helipad was proposed by Lee et al. 11 By computing the edge distribution function of the circle and the inner H, it is possible to extract a signature useful to locate the visual marks in the aerial image.
A shape recognition approach based on geometric features such as the area, perimeter, and invariant Hu moments was proposed in Saripalli et al. 12 –14 to detect the visual target. Such features are commonly employed in task of optical character recognition because of their invariance to translation, rotation, and scaling. A similar methodology was presented in Sanchez-Lopez et al. 15 where the principal component analysis (PCA) applied to the first seven Hu moments is performed for each blob contained in the image. Afterward, an artificial neural network takes as input the information obtained from the PCA processing and provides the classification of blobs. The signature of H is used for extracting its corners and then computing the helipad pose. Further analyses and experimental validations were presented by Sanchez-Lopez et al. 16
Silva et al. 17 proposed a global search procedure able to detect the best vantage points in the environment where is more likely to find the heliport. Then, for each vantage point, the UAV moves toward it and a vision-based local search of the helipad is performed. The local method aims at ranking all the objects of the scene according to their likelihood to be the heliport. Such likelihood is learnt during the takeoff phase and it is based on the saliency regional descriptor related to helipad marks.
Other two methods which rely on machine learning were presented by de Oliveira et al. 18 in order to automatically detect two types of landing pads. These pads consist of the traditional characters “H” and “X” inside circles. Six classifiers based on Haar-like features and local binary patterns (LBPs) were trained in order to recognize the artificial helipad marks. The outcomes proved that the Haar-based method was more accurate than the LBP-based one, although the latter is faster than the former.
In the study by Wu and Tsai, 19 an omni-vision–based localization algorithm was presented to support the drone landing on standard helipad. The method assesses the proper geometric features of points, circles, and lines of heliport marks in order to estimate pose of helicopter with respect to the landing site. Specifically, the method owns a first stage aimed at approaching the heliport and a second one that constrains the drone to fly between the outmost boundaries of the H mark and docking on its center. The computed relative distance errors were below 5% and the orientation errors were smaller than 2.5 considering a distance range of 1.20 m.
In the study by Premachandra et al., 20 another method for searching the heliport was described. The data from the camera and an ultrasonic sensor were processed by an onboard Raspberry Pi unit. The altitude of the drone was computed by means of the ultrasonic sensor, whereas the “H” mark was recognized exploiting the Hough transform framework.
A monocular vision–based real-time target recognition was proposed by Lin et al. 21 as well. The helipad contours are used to perform the point feature mapping and clustering. The algorithm is able to recognize the international landing target in a cluttered environment providing the 4 degrees of freedom pose of drone with respect to pad.
Proposed approach
The algorithm presented in this work falls in the category of papers which detect autonomously the helipad target and estimate its pose with respect to the vision camera. We propose a novel approach to detect the helipad in order to achieve high accuracies of pose measurements meeting simultaneously the strict processing time constraints of a real-time application. In fact, the analysis of the related literature reveals that many methods require high computation resources that are not always available onboard the drone. On the contrary, faster and simpler algorithms do not continuously ensure enough robustness in the searching step of heliport marks.
Hence, we devised a quicker and robust image processing pipeline able to return the accurate pose measurements, ensuring continuous aids to the drone during its landing over the platform. The analysis of the local curvatures enables to detect precisely the locations of H corners, then geometrical considerations on the distance among couple of corner centroids allow the detection of the main direction of the helipad. The algorithm is quite simple and avoids the computational costs of the standard approaches based on feature extraction, template matching, line fitting, and so on.
CV algorithm
As before mentioned, the aim of the algorithm is to provide the pose of the target platform with respect to the camera observing the pattern. Thus, the pose estimation of UAV on which the camera is attached is directly derived.
The target used in our experiment was the standard international helipad having the character H inside circles as illustrated in Figure 1.

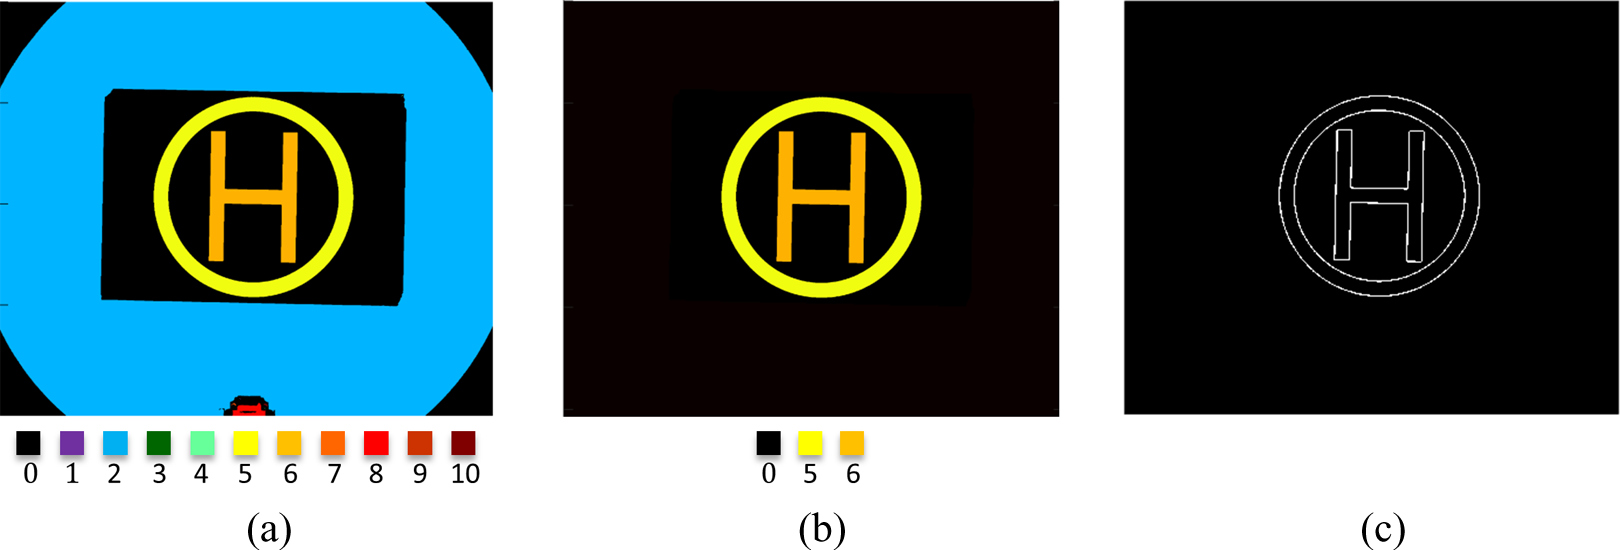
(a) Output image obtained after applying the Wiener filter, (b) noise detected in the image during the application of median filtering, and (c) resulting binary image after the thresholding step.
The main steps concerning the helipad detection and pose estimation can be listed as follows: image acquisition and preprocessing, helipad mark extraction, corner detection of helipad, corner matching, and pose estimation.
The details of each step are explained in the following paragraphs.
Image acquisition and preprocessing
It is a typical and essential step to preprocess the images in order to get an improvement of their quality. This preliminary stage aims at reducing the undesirable noise effects and highlighting the particulars of image. Therefore, a cascade filtering is applied to images before extracting the information useful in the other steps.
The acquired image represented in the red–green–blue color space is converted in grayscale in order to focus only on the luminance information. As a matter of fact, in many applications of CV the hue and saturation information are not quite necessary, whereas the luminance is more suitable in distinguishing visual features or extracting edges. Since the captured aerial images might be affected by blurring due to abrupt vibrations of UAV or to external weather conditions, a Wiener filtering 22 is performed as well. In Figure 1(a), the result obtained by applying this filter is shown. Afterward a median filter 23 is used to achieve the noise reduction on the image. This filtering is widely used because of its important capability in preserving edges and removing the unavoidable noise (refer to Figure 1(b)). Finally, the resulting image obtained from the previous steps is segmented by thresholding (see Figure 1(c)). By taking advantage of the high contrast in the helipad region between the dark background and the light foreground, we are able to extract the binary image by employing an adaptive thresholding 24 on the intensity values. In this way, strong illumination gradient in the image is taken into account and a more robust segmentation is achieved.
Helipad mark extraction
Once the binary image is computed, we detect all the connected components (i.e. blobs) inside the image under investigation (refer to Figure 2(a)). By exploiting some intrinsic properties of each blob such as the location of its center of mass, the Euler number, the eccentricity, the perimeter, and the area, we are able to identify the blobs which represent the helipad marks, namely the character H and the circumscribing circles.
(a) All the candidates before the cascade processing labeled using different colors. Ten different blobs are identified for the image under investigation. Some of these blobs are not quite visible because their areas are very small (few pixels). (b) Final helipad marks represented by the two remaining blobs after the detection procedure and (c) contours of helipad.
Among all the extracted blobs, the ones having a small area value in terms of pixel number are discarded from the successive processing. A second level of analysis is performed by evaluating the corresponding Euler number of the remaining candidates. Specifically, the Euler number is an integer value defined as number of connected components minus the whole numbers. Consequently, this value should be equal to zero for circle blobs and one for H blobs. Therefore, blobs having a different Euler number are discarded. Moreover, blobs having Euler number equal to zero but eccentricity much larger than zero are rejected as well. In fact, eccentricity equal to zero indicates that the blob is a circle, whereas eccentricity equal to one stands for a line segment. All the middle eccentricity values indicate possible ellipses.
The next level of classification takes advantage of the knowledge that the blob H has to be inside the circle blob. As a consequence, their corresponding centroids should be near, namely their Euclidean distance has to be small (ideally zero).
The last classification level checks the ratios between the areas and perimeters of blobs. In this regard, the actual ratios computed by considering the circle and the H blobs should keep their expected values, namely they should be invariant with respect to rotations and scale changes. The equation (1) defines mathematically the above conditions.

The capital letters P and A stand for the perimeters and the areas of blobs, whereas the subscripts a and e point out the actual and the expected values, respectively. The value δ is set to 0.05.
The main steps of helipad mark detection are summarized in algorithm 1.
Helipad mark extraction.

At the end of detection procedure, we can identify which blobs among all the candidates are the helipad marks. By looking at Figure 2(a), 10 different blobs can be detected. The black color indicates the image background. After the first classification step, the blobs 1, 3, 4, 7, 9, and 10 are discarded from the computation. The second step filters out the blobs 2 and 8 as well. In fact, they own negative Euler numbers.
At this stage only two blobs remain, that is, the blobs 5 and 6. The third and fourth steps check if the Euclidean distance of their centroids and the ratios of related areas and perimeters are still met. The ultimate extracted blobs are shown in Figure 2(b).
Once the helipad marks have been identified, the Canny edge detector is performed in order to extract the contours (please refer to Figure 2(c)). Since the corner detection step aims at finding the 12 corners of H edge, we operate only on the inner contour. The two-dimension (2-D) image pixel coordinates belonging to edge are arranged in a sorted matrix which will be the input of the following computations.
Corner detection of helipad
The main purpose of this step is to find the H corners. Although there are many corner detector algorithms in the state of art, 25 –27 we implemented a faster and more accurate method to achieve this goal. The corners could be detected at the intersection of the 12 straight lines of character H as well. In this regard, feature extraction operators as the Hough transform, 28 convolutional-based techniques having specific kernels, 22 and line following algorithms might be used to detect such straight lines. However, all these methods return many false positive detections as they heavily depend on the parameter settings and can be computationally expensive. The proposed approach tries to overcome the above limitations.
The method is based on the radius-of-curvature computation for each pixel belonging to the helipad contour. In details, let S be the pixel seed under investigation and N 1 and N 2 be the neighboring pixels to S (located at an integer distance of n pixels along the edge), we compute the circle passing through these three points as shown in Figure 3. It is worth underlining that the distance value n between the seed point and the neighboring points is settled according to contour length. The smaller the edge length, the smaller the distance value and vice versa. In this way, different edge lengths of H (due to distance variations between the camera and the heliport) does not affect the corner detection process.

The seed pixel is represented by the blue cross, whereas the neighboring pixels are the red crosses. The radius of the circle defines the value R related to seed point.
At the end of this step, a radius of curvature R will be associated with every 2-D point of H edge. By evaluating the array of radii, it is possible to efficiently detect the corners of interest. A big radius value denotes that the point is far from a corner. On the contrary, a small value indicates that the point might be a possible candidate to be a corner.
In summary, the smallest values of curvature array stand for all the possible corner candidates.
However, the false positive ones could be detected by the algorithm. As a consequence, we identify the possible outliers by taking advantage of knowledge of H size and exploiting the Euclidean distances between these points and the centroid of H contour.
By looking at Figure 4(a), three expected distance values can be derived from the geometry of H-shaped edge. In details, the Euclidean distances of the four outer corners from the center OH are equal to Do , whereas the four inner corners have an Euclidean distance of Di . Finally, the remaining four middle corners own distance values equal to Dm .

(a) Sketch of the actual size of H together with the three expected Euclidean distances referred to one inner corner, one middle corner, and one outer corner. (b) Candidate corners identified by using the radius-of-curvature method and the Euclidean distance checks. (c) Twelve centroids of the actual corners and (d) six centroids (blue crosses) of the clustered corners (dark red ellipses).
At this stage, three checks are performed. Specifically, the Euclidean distance of a corner candidate C from the centroid OG of the edge under investigation is compared with the three expected ones by employing equation (2), where [px] stands for pixel units.

The expected adaptive distances are derived by estimating the value x in Figure 4(a). In this regard, by knowing the contour length Es
(expressed in pixel units) and the geometry of H, the value x (in pixels) is computed accordingly (
In this way, in the event that a candidate pixel has a distance value much different with respect to these three adaptive parameters, then it is labeled as outlier, and thus it is discarded from the computation. Conversely, if one of the three checks is satisfied, the candidate is labeled as inlier. The value ε represents a small value which depends once more on the total edge length. However, it is worth highlighting that such distance comparisons are valid if the perspective deformations are not too accentuated.
At this point, all the inlier candidates can be detected by performing the Euclidean distance checks. In case more inlier candidates are found in proximity of an actual corner (refer to Figure 4(b)), we provide their centroids. At the end of the process, 12 corner locations are returned as observable in Figure 4(c). Once the 12 corners have been detected, we group them in pairs by using the hierarchical clustering thus identifying six centroids (see Figure 4(d)). This step is mandatory to accomplish the following steps.
Corner matching
The six centroids obtained in the previous stage are useful to estimate the principal directions of H mark. This information is exploited to correctly match the corners in the image with their corresponding ones in the three-dimension (3-D) reference system. In this way, the heliport pose can be estimated. All the eligible straight lines passing through a pair of 2-D points taken among the six centroids are computed. As a consequence, 15 lines will be detected since each pair of points must be considered once (see Figure 5(a)). Subsequently for each obtained line, we compute the four distances of other remaining centroids with respect to itself. As an example, by looking at Figure 5(b), the red segment on the left side of H stands for the straight line under investigation, whereas the distances of other centroids are represented with green dotted lines. At the end of the step, 60 distance measurements are collected. Therefore, the smallest distance D MIN among all the computed ones enables to identify the line going through the main direction of the H (the red line in Figure 5(b). Hence, the vertical direction of H is defined as the slope of such line. Conventionally, we define the horizontal direction as the perpendicular to the vertical one. In Figure 5(c), the green arrow represents the vertical direction of H and the red one stands for the horizontal direction.

(a) Computing of all possible straight lines passing through the six centroids, (b) detection of vertical direction of H mark, and (c) obtained principal directions. (d) Partitions of H in four quadrants and (e) corresponding partition of actual target with the corner associations.
The knowledge of principal directions enables to split-up the H mark in four quadrants as shown in Figure 5(d). Therefore, rotations of H in the image do not affect the corner matching step since we are always able to identify the quadrants. The center OG of new reference system is placed at the centroid of H edge. If the perspective is not too accentuated, three corners for each quadrant can be distinguished. By computing the Euclidean distances between such corners and the centroid of H, it is possible to associate them to the related 3-D corners. As an example, the three 2-D corners of first quadrant Q1 in Figure 5(d) are matched with the corresponding 3-D ones in Figure 5(e) by evaluating the Euclidean distances. Since the corner 1 has the largest Euclidean distance from the center OG , it means that it represents the outer corner of Q1. On the contrary the corner 3, which has the least Euclidean distance value, stands for the inner corner of Q1. Consequently, the corner 2 represents the middle corner since it has an average distance value.
In case that a quadrant does not have inside three corners, we discard it from the computation because we are not able to properly accomplish the matching. However, we need at least four correspondences to attain the pose estimation.
Pose estimation
The last step of the method has to provide the 3-D pose of the heliport with respect to camera. At this stage, the 2-D corners have to be corrected from distortion effects due to camera lens curvature. Therefore, a preliminary calibration step aimed at extracting the intrinsic camera parameters is mandatory in order to ensure accurate measurements. 29 –31
The 2-D and 3-D correspondences are related to each other as follows

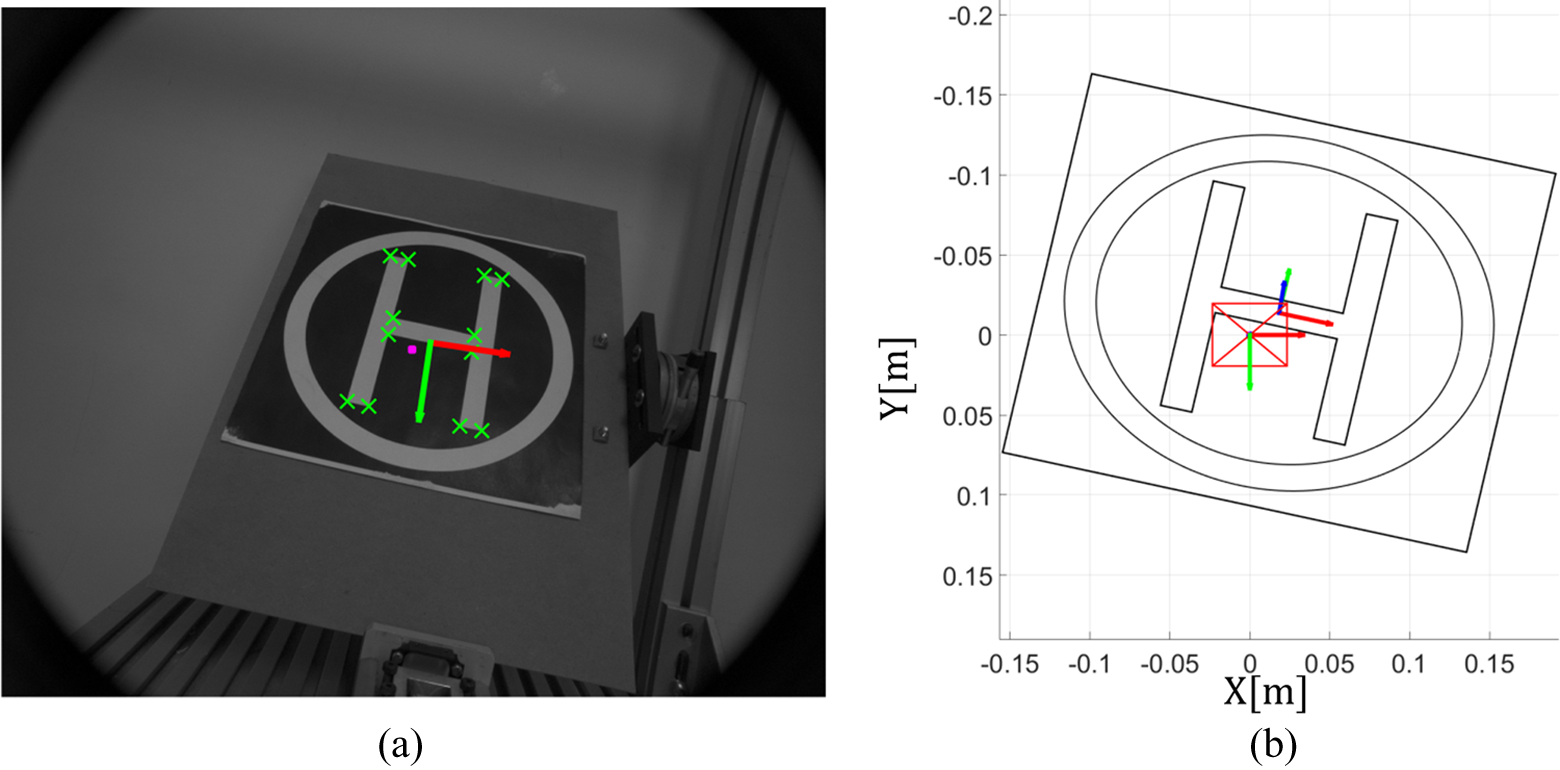
By looking at equation (3), (u, v) are the 2-D corner coordinates expressed in pixels, K is the intrinsic camera matrix, [R|t] represents the extrinsic matrix, and P contains the 3-D homogeneous metric coordinates of corresponding corners. Since our aim is to estimate the extrinsic matrix, we need at least four correspondences to compute it. By exploiting the direct linear transformation method, 32 we can estimate the homography matrix between the 2-D and the corresponding 3-D points. Thus, the rotation matrix R and the translation vector t can be calculated accordingly. Figure 6 reports an example of the computed pose by our algorithm.

(a) Example of output image after the algorithm and (b) 3-D view of heliport with respect to camera reference system.
Results
The effectiveness and accuracy of proposed vision algorithm have been validated through controlled indoor and outdoor tests performed at our institute. “Indoor experiments” section describes the indoor setup together with the discussion about the related experiments. “Outdoor experiments” section introduces the outdoor tests and its outcomes, whereas “Time performance” section discusses the performance of our method in terms of processing time.
Indoor experiments
The experimental setup for indoor tests is shown in Figure 7. The used camera is the UI-2280SE-M-GL produced by Imaging Development Systems (IDS) 33 having a resolution of 2448 × 2048 pixels. It has been fixed onto a rotational stage in order to provide angle variations along the Z CAM axis. The panel containing the heliport mark has been attached to another rotational stage used to provide rotations along the XH and YH axes (see Figure 6(b)). Finally, a translational stage has been employed to vary the distance between the camera and the landing target. In this way, we can simulate some of UAV movements during the flight.

(a) Overview of acquisition setup for the indoor tests, (b) enlargement of translational and rotational stages along with the camera, and (c, d) enlargement of the second rotational stage used to provide both pitch and roll angle variations.
The first validation has been performed on the analysis of single images, evaluating the relative errors concerning the distance estimation of heliport. Specifically, the camera has been moved away from the visual target by means of the linear support by steps of 0.10 m. The other auxiliary stages have been locked in order to avoid other unwanted movements. In details, the panel has been kept parallel to image plane, that is, the roll, pitch, and yaw angles have been held to 180°, 0°, and 0°, respectively (refer to Figure 7(a)).
The distance measurements D have been derived as the Euclidean distance among the two reference system origins by using equation (4)
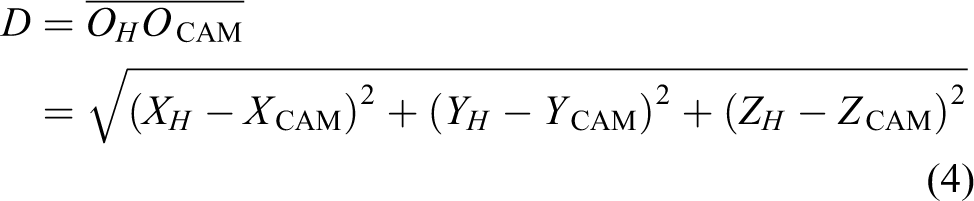
The method has been evaluated in short and long distance measurements. Specifically, Table 1(a) reports the relative errors by taking into account short distances in the range [0.57–1.67]m, whereas Table 1(b) assesses higher distances ranging in [1.51–3.01]m.
Relative errors in distance estimations by considering (a) short distance range and (b) long distance range between the camera and the helipad target.a

RMSE: root mean squared error.
aA displacement step of 0.10 m has been considered in both tests. The relative RMSEs, obtained by considering the nominal and the actual values, are reported as well. The values in bold represent the highest relative errors related to each table.
All the relative errors have been derived by means of equation (5) as following reported

where av stands for the actual value returned from the processing algorithm and ev is the expected value, namely the information received by the ground truth.
The maximum relative error observable in Table 1(a) corresponds to 0.72%, that is, a maximum error of about 0.012 m has been done by considering short distances. The absolute error between the total expected displacement of 1.10 m and the actual one of 1.115 m is found equal to 0.015 m. On the contrary, by looking at Table 1(b), one can notice that the highest relative error is 0.82%, corresponding to an error of 0.021 m. However, an absolute error of 0.014 m is obtained by considering the entire actual displacement of 1.514 m and the expected one of 1.50 m. The computed absolute errors seem to be almost equal in both tests concerning short and long distances, although the relative errors slightly increase their values in long distance tests. However, this experiment has proven that the relative errors are always below 1%. Therefore, our algorithm is able to perform well in estimating distances as further proven by the low root mean squared error (RMSE) values.
Other similar tests have been carried out to assess the vision system in estimating angle variations as well. The validation is obtained by imposing controlled rotations to both the panel and the camera. More specifically, the rotations have been performed separately for each axis by keeping a distance of about 0.50 m. In this way, we are able to evaluate how the method works for the single rotational movements.
As shown in Table 2, relative errors concerning the roll and yaw variations are below 1%. On the contrary, the analysis of pitch rotations shows relative errors limited to about 3%. Hence, the errors in Table 2(b) are slightly higher than other ones. This behavior might be due to the accuracy of corner extraction from H mark. In fact, as already described in the previous section, some of corner candidates could be located near the actual corner. Therefore, the method merges these points providing only their centroid. As a consequence, inaccuracies in the estimation of corner locations might slightly affect the actual pose estimation.
Relative errors in rotation estimations between the camera and the helipad target evaluated along (a) the X-axis, (b) the Y-axis, and (c) the Z-axis along with their RMSE values.

RMSE: root mean squared error.
Nevertheless, both the small relative errors and RMSE values obtained in the experiments enable to affirm that our algorithm is able to achieve high accuracies in estimating the target pose. In this regard, this method performs better than the one proposed in Lin et al. 21 in terms of accuracy. More specifically, the average RMSE values found in the other work were 0.029 m and 1.786° for the distance and the angle estimations, respectively. Instead our average RMSE values are equal to 0.0085 m and 0.263°. Hence, one can highlight how our methodology returns more accurate measurements.
In order to compare our outcomes with the study by Sanchez-Lopez et al., 16 further experiments have been carried out to estimate the reliability of algorithm in the event that stationary frames were acquired. Specifically, we considered two different orientations of target with respect to the camera: In the former test, we forced the panel and the camera plane to be parallel, whereas in the latter, we considerably tilted the target plane. In both the tests, we acquired a sequence of 300 frames corresponding to an acquisition time of about 70 s. Furthermore, different working distances between the camera and the heliport have been taken into account. As the heliport size is 29 cm, the distances have been chosen by considering approximately multiples of such size.
Figure 8 shows a test with the helipad parallel to the acquisition system, whereas in Table 3 some statistics related to the processing are reported.

Output image after the processing and (b) 3-D view perspective of target with respect to camera reference system. In this case, the working distance was about twice the heliport size.
(a) Mean values by taking into account approximated multiple distances of the heliport size (29 cm) and (b) SDs.a

SD: standard deviation.
aEach row reports the information related to the processing of 300 stationary frames. The values in gray rows are used to compare our data with the study by Sanchez-Lopez et al., 16 having an helipad size of about 20 cm.
Table 3(a) reports the average values of the 3-D positions (XH , YH , ZH ) of the heliport origin OH and its orientations (roll, pitch, yaw) with respect to the camera reference system at different distances (multiples of helipad size). Instead Table 3(b) contains the standard deviation (SD) values.
One can observe that the SDs concerning the helipad position are significantly small while the Euler angles seem to be noisier. In this regard, the roll and pitch angles show the larger variations. Nevertheless, these fluctuations increase when the distance is bigger, that is, when the drone is far from the heliport.
By comparing this work with the work of Sanchez-Lopez et al., 16 it is possible to note how the proposed vision algorithm is able to provide more accurate information of the heliport pose. In fact, by considering a distance of about six times the heliport size (see gray rows in the Table 3(b)), our SDs are one order of magnitude smaller than the other work. The helipad size in the study by Sanchez-Lopez et al. 16 is about 20 cm.
In the second experiment, we tilted the target plane as shown in Figure 9. In this case, we can observe that the noise of Euler angles (see Table 4(b)) is noticeably reduced in comparison with the previous test (refer to Table 3(b)) by considering all the distance values. Hence, we can state that the vision algorithm provides more accurate estimates in the event that the helipad is tilted with respect to the camera, that is, when the drone might be in a dangerous pose.
(a) Resulting image after the processing steps and (b) 3-D view of helipad. Here, the working distance is twice the heliport size.
(a) Mean values and (b) SD values considering the helipad tilted.a

SD: standard deviation.
aA sequence of 300 stationary frames has been analyzed.
In the same way, we compare the results of Sanchez-Lopez et al. 16 with ours. In this case, a distance of about three times the heliport size is considered for accomplishing the comparison. By looking at the gray rows in Table 4(b), we can note how our values are considerably smaller proving once more the reliability of method in returning the pose of camera with respect to the visual target.
Outdoor experiments
The efficiency of our methodology has been proven by performing outdoor tests as well. In fact, abrupt light changings or strong sunlight reflections might negatively affect the algorithm when it is working. Therefore, the proposed approach has been evaluated in presence of critical situations as well.
In Figure 10(a), the outdoor setup is shown. In this case, two rotational stages and one linear support have been used to provide controlled movements. Therefore, by following similar procedures to the indoor experiments, both distance and angle variations have been run.

(a) Acquisition setup used in the outdoor experiments, (b) some of the example images used for testing the algorithm in critical situations, and (c) some of data set images employed in the accuracy assessing.
The nominal distance between the camera and the pad has been given by means of a dot laser range finder 34 having an operating range from 0.1 to 10 m and a precision of 1 mm.
The Figure 10(b) shows some random outdoor images where the reflections, shadows, and light changings are more evident. Nevertheless, the algorithm is still able to provide the heliport pose proving once more its robustness and reliability against to external noise. Figure 10(c) reports some of the data set images employed for the controlled experiments.
In the first controlled test, the distance between the camera and the helipad has been varied by steps of 0.05 m. The other two rotational stages have been held thus enabling the analysis of the only distance movements.
Table 5(a) reports the obtained distance estimations. The relative errors have been computed by exploiting once more the equation (5). By comparing these results with those of Table 1(a, b), one can note that the relative errors are quite similar. In fact, they are still below 1% and a maximum relative error of 0.98% has been found. Therefore, the vision algorithm well performs in the distance estimation in both indoor and outdoor environments.
Relative and RMSE errors concerning the (a) distance estimation, (b) roll, (c) pitch, and (d) yaw angle estimations.a

aA displacement of 0.05 m and a rotation step of 5° has been considered in the distance and angle tests, respectively. The values in bold represent the highest relative errors related to each table.
Slight increases of relative errors have been observed by evaluating the rotational movements. Specifically, rotations by steps of 5° have been taken into account as for the indoor experiments.
The relative errors of roll angles reported in Table 5(b) are very comparable with the one of Table 2(a). In this case, the obtained maximum error is 0.43%, which is almost negligible.
The error analysis of other two angles, that is, the pitch and yaw ones in Table 5(c, d), shows increased values with respect to those of indoor test (see Table 2(b, c)). In this regard, the maximum relative errors related to pitch angle for the indoor and outdoor experiments are 2.71% and 3.98%, respectively. Hence, a maximum error increase of about 1.3% is observable by analyzing the outdoor data.
Similarly, a maximum increase of relative errors of about 0.5% is found for the yaw angle when the indoor and outdoor data are compared. In fact, the maximum obtained errors are 0.94% and 1.45%, respectively.
The errors of outdoor tests are slightly higher than the indoor ones. This is likely due to the external disturbance factors (see unavoidable reflections, shadows, blurring) that might affect negatively the algorithm during the helipad mark detection and corner extraction.
The obtained outcomes enable to affirm again that the proposed approach is still accurate and reliable in the computing of pose estimation in outdoor contexts as well. In fact, the relative errors in the distance and angle estimation are bounded to 1% and 4%, respectively. Moreover, the low RMSE values prove once more the effectiveness of the presented algorithm.
Time performance
Finally, a discussion about the processing time is due since it has an important role in this framework. The method has to provide the information of target pose in few milliseconds. As an example, by considering a working frequency of drone control system of about 5 Hz, the vision method should supply the information of interest in less than 200 ms.
In this way, the pose of drone can be quickly estimated and the control algorithm can provide continuously the reference signals to rotors through the data returned from the vision system.
The proposed algorithm has been programmed in Matlab which is not actually indicative of the processing time for real experiments. However, by comparing our method with other works mentioned in “Related works” section in terms of processing times, we obtain the results reported in Table 6. Our methodology in searching the helipad marks is the fastest against to others by considering the average processing time. Although the method in the study by Lee et al. 11 presents almost similar processing times, it is worth underlining that it was programmed on a dedicated onboard processing unit. Therefore, the algorithm code is already optimized to run in real-time contexts. Conversely, our algorithm performs much better than the method in the study by Prakash and Saravanan 10 which has been realized in Matlab.
Processing times of the main methods in detecting the helipad and estimating its pose.a

aThe average processing times of our method obtained by analyzing 2000 frames on two different computers are the lowest ones. The values in bold represent the two lowest average helipad detection times.
Higher consumption times are evident in the study by de Oliveira et al. 18 as well. Although the lowest processing times found in that paper have been reported in Table 6, it is possible to appreciate how our method is far better. In fact, the other classifiers require more processing times to provide the classification output, namely to affirm if the helipad has been found or not.
The algorithm has been run on two machines having different hardware features. Specifically, the first computer was a laptop (PC#1) with Intel(R) Core™ 2 Extreme CPU @ 3.06 GHz, Microsoft Win7 Professional with SP-1 64 bit operating system, and 4 GB of RAM.
The installed version of Matlab was the release R2013a 64-bit. The second computer was a desktop (PC#2) having Intel(R) Core™ i5-3470 CPU @ 3.20 GHz, RAM of 8 GB, and Win7 Professional 64-bit operating system. It uses the Matlab release R2015a 64-bit. As observable from Table 6, the second machine offers higher performances, as predictable from the better features owned.
The results obtained with the proposed approach are very encouraging since the implementation of the processing algorithm on an embedded system using general-purpose programming languages (e.g. C, C++, C#) should reduce significantly the needed elaboration times and allow us to affirm that the proposed methodology can be used in real-time context.
Conclusions and further works
In this article, a fast, robust, and accurate vision-based algorithm for assisting UAV landing has been presented. The method aims at identifying the helipad in the image. Once the H has been found by means of cascade checks, its corners are detected by using a method based on the curvature computation. Then, the 12 corners are matched with the corresponding ones expressed in the reference system fixed on the H. Finally, the homography matrix is estimated in order to evaluate the 3-D pose of heliport with respect to the camera reference system.
A quantitative validation of the proposed algorithm has been carried out through controlled indoor and outdoor experiments performed at our institute. In this regard, outcomes show small errors, lower than 1% and 4% in the distance and angle estimations, respectively.
Further proves have been done by analyzing stationary frames of the heliport. Small fluctuations of the pose estimation have been observed, especially when the target plane and the camera plane are considerably tilted. Finally, an average helipad detection time of about 80 ms has been found, whose value is the lowest in comparison with other literature works.
Future works will lead to the implementation of the presented method on a low-cost single-board computer in order to assess the camera pose in real time. Specifically, the vision system will be attached to a UAV and actual attitude information will be the input of the control system of drone. In this way, the robustness and reliability of algorithm in supporting the UAV landing will be further proven.
Footnotes
Acknowledgement
The authors would like to thank Mr. Michele Attolico for his valuable contribution during the experiments and its technical support.
Declaration of conflicting interests
The author(s) declared no potential conflicts of interest with respect to the research, authorship, and/or publication of this article.
Funding
The author(s) received no financial support for the research, authorship, and/or publication of this article.