
Abstract
A study was conducted to evaluate the surface roughness levels of fruits and vegetables by a novel tactile sensor. Firstly, the effective areas of the sensor were determined through the mechanical analysis with the ANSYS software, and the sensitive elements of polyvinylidene fluoride piezoelectric films and strain gauges were randomly arranged in these areas. When the sensor contacted with the surfaces of the fruits and vegetables, the signals produced by the sensitive elements were output and tactile features were obtained. Secondly, the D-score criterion was applied to evaluate the contribution of every tactile feature component in expressing the surface roughness levels. According to the value of D-score, the strategies of the sequential forward selection and equential forward floating selection were used to guide the optimization of feature components selection. Back propagation neural network model was applied to evaluate the performance of the optimal features. Finally, the experimental results revealed that the identification accuracy of the algorithm was up to 93.737%, which demonstrated that the optimal feature subsets possessed fewer dimensions while maintaining a high performance in expressing the surface roughness characteristics of the fruits and vegetables. The results also provided a basis for the optimized design of the tactile sensor.
Introduction
The application of agricultural robots in picking, sorting, grafting, and other tasks is becoming more and more extensive. 1 –3 End effectors of the robots are the key to determine the quality of the work. Some physical characteristics of fruits and vegetables can’t be measured with the visual information alone, so it is necessary for the robots to identify the surface characteristics by touching way with the fingers of end effectors, for example, surface roughness characteristics. 4 The surface physical characteristics can allow the robots to analyze the interaction process and evaluate contact status between the end effectors and the grasped object, 5,6 then the appropriate grasping strategy was chosen in real time, which can minimize the damage to the grasped object and help the robots complete the soft grasping task well. 7,8
At present, some researchers have made a little contribution on the achievements of surface roughness measurement. Wireless tactile probe was an important method to detect the surface roughness of objects in the early stage. 9 –11 The motion trajectory and the surface texture information will be received when the tactile probe contacted with the surface of the objects in a small scale. However, the application of tactile probe is easily limited because of its corner radius. In addition, the probe can’t cover the entire surface of texture features and may have a scratch on soft surfaces.
Muhammad 12 and Sohgawa 13 have designed a micro-electro-mechanical system (MEMS) tactile sensor array to scan the surface and evaluated the spectrum of the scanning signal, and the surface roughness features with different levels can be identified. However, because of the stiffness of the MEMS material, it is difficult to be applied to measure the curved surface. 14
The polyvinylidene fluoride (PVDF) piezoelectric film has a series of virtues, such as light weight, high sensitivity, and it can be made into a variety of shapes for the tactile sensor. Therefore, it becomes a better sensitive material. Chen 15 designed a PVDF tactile sensor for detecting surface texture, and the signals with different touching speed and normal pressure between the sensor and the measured surfaces were analyzed. Takamuku et al. 16 used the PVDF piezoelectric film and strain gauge to designed robotic tactile fingers and detected the surface roughness characteristics by touching way. Jamali and Sammut 17 obtained the texture and roughness signal using tactile sensor sliding on different types of surfaces, and a successful classification of objects with different surface roughness was carried out. Wettels et al. 18 developed a finger-shaped sensor array that mimicked the full cutaneous sensory capabilities of the human finger. When the robot finger contacted with the object, the contact force deforms the skin and underlying fluid, resulting in changes in the electrical impedance, then, the texture information of object surfaces and other contact information can be detected. Mazid and Russell 19 designed a newly opto-tactile sensor for object surface assessment in robotic applications. A mathematical model has been developed relating the sensor output voltage to the geometrical parameters of surface roughness. The sensor concept provides opportunities for object recognition and grasping for robotic handling of different types of materials. Hu et al. 20 proposed a novel finger-shaped tactile sensor based on a thin piezoelectric PVDF film for surface texture measurement. By controlling the 2-dimensional motion of the finger-shaped sensor along the object surface, the output charge of PVDF film changes with the small height/depth variation of surface texture.
Although these surface roughness detection were carried out in different ways, the structure and layout of the tactile sensor were a little complex. Moreover, some redundant and uncorrelated features have been kept, which can lead to degraded accuracy of detection and the longer computing time. Thus, it is necessary to simplify the design procedure of the tactile sensor and optimize the features selection.
The focus of our research is to design a tactile sensor with the PVDF piezoelectric films and strain gauges in a simple way to estimate the surface roughness of fruits and vegetables. Estimating the surface roughness characteristics of fruits and vegetables is an effective way to help robot adjust grasping strategy and improve the success rate of grasping. The corresponding tactile features selection for expressing the surface roughness levels of fruits and vegetables was also studied.
“Surface roughness estimation system design” was illustrated in the second section. In “Experiments data” section, we performed the experiments using a robotic end effector equipped with the tactile sensor designed, and abundant experimental data were obtained. The details of tactile feature selection for expressing surface roughness of the fruits and vegetables are demonstrated in “Optimal tactile feature expressing the surface roughness” section. Finally, a brief conclusion was made in the last section.
Surface roughness estimation system design
Flow chart of designing surface roughness estimation system is shown in Figure 1. Firstly, a tactile sensor similar to the shape of human fingers was designed. Sensitive elements of the PVDF piezoelectric films and strain gauges were placed inside. The layout rule of the sensor was that as many sensitive elements as possible should be fixed in a silicon rubber randomly. The silicon rubber was adopted to imitate human finger skin. 17,21 The random arrangement simplified the sensor design and production and made it easily adapt to different grasping tasks. A lot of sensitive elements were applied to increase the sensitivity of the tactile sensor.
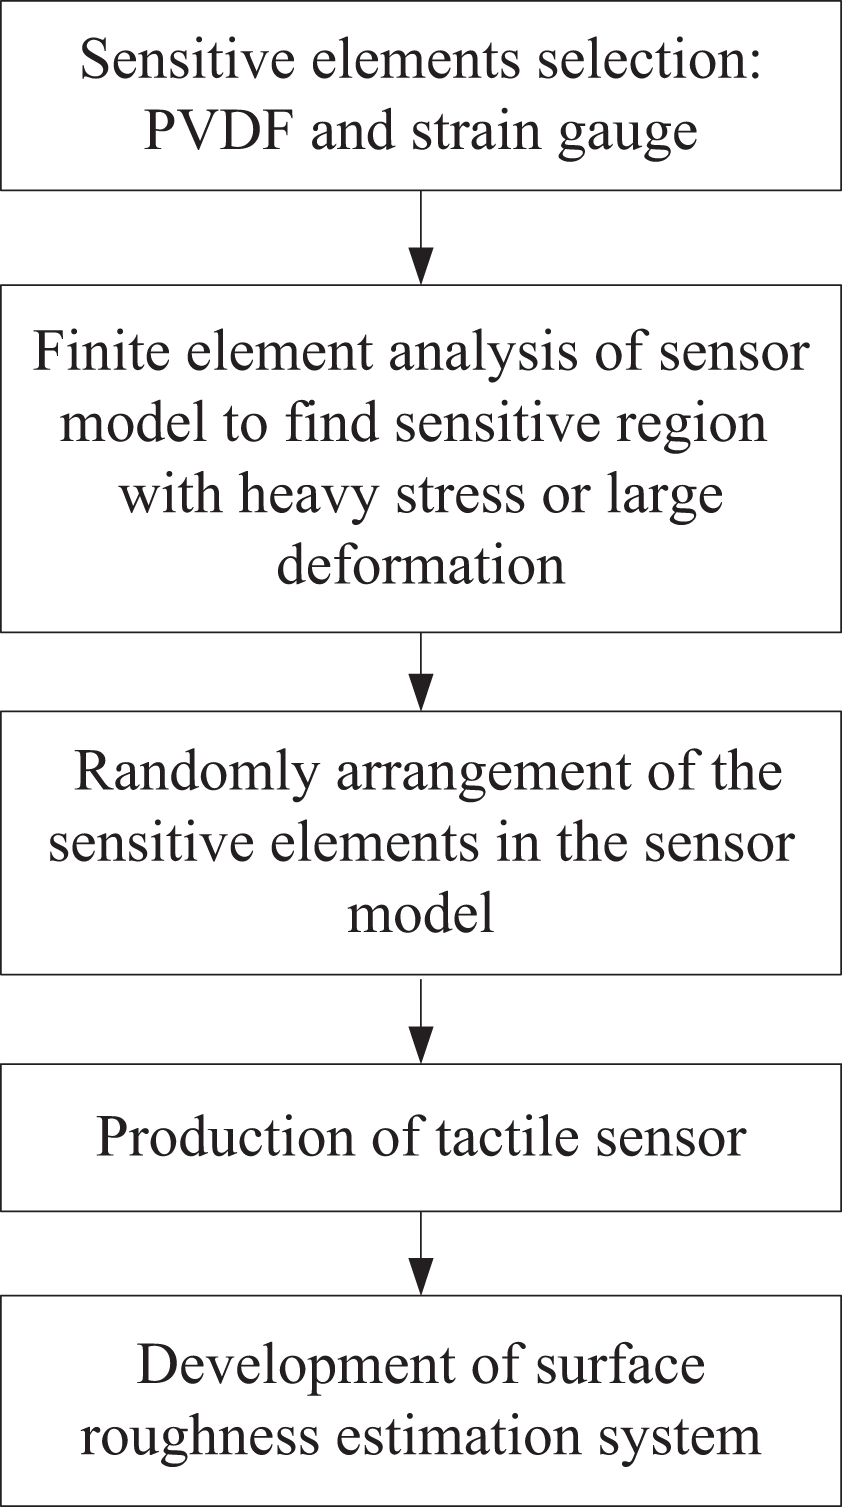
Flow chart of designing surface roughness estimation system.
Under the premise of the random arrangement, the sensitive elements should be arranged as far as possible in the position with heavy stress or large deformation to ensure the sensor output more sensitive. So, finite element analysis of the sensor model was conducted, and the internal stress and deformation were observed to make sure that the distribution of the sensitive element was reasonable.
The size of the tactile sensor designed was 40 × 30 × 15 mm3. Due to the limited space of the tactile sensor, four pieces of PVDF piezoelectric films and four strain gauges were applied. 3-D model of the tactile sensor was imported into ANSYS (v 15.0) finite element software (ANSYS, Inc.) for static analysis. Because the silicon rubber is a kind of super elastic material, the Mooney–Rivlin model is constantly used to describe it in the finite element analysis. 22 The HYPER58 was selected as the element type of super-elastic unit, and the elastic modulus E was set as 2.14 MPa and Poisson’s ratio was 0.48.
According to the movement of the model on an object surface, 100 N of the normal pressure and 50 N of the friction were exerted on the surface of the model. The action time was 10 s. After calculation, the results of the stress distribution and deformation of the silicon rubber model were obtained. Figure 2(a) reveals the stress distribution of the sensor model and the heavy stress concentrates on the middle of the model. The maximum values appear in the positive direction of Z-axis, while the minimum value concentrates on the direction of X-axis. Figure 2(b) shows the displacement distribution of the model. It can be seen that the large displacement happens at the center of model, which is near to the area of upper surface. The largest deformation appears on the edge of the model in positive direction of the Z-axis.

Finite element analysis of tactile sensor: (a) stress distribution of the model and (b) deformation distribution of the model.
The steps of producing the tactile sensor were as follows: firstly, 3-D printer was used to produce the mold of the tactile sensor. Then, the sensitive elements of the PVDF and strain gauges were randomly arranged into the mold, and the installation location was selected as far as possible in the areas with heavy stress and large deformation. Finally, the 703 silicon glue was poured into the mold. The Figure 3 shows the tactile sensor after its hardening.

Tactile sensor.
After the production of the tactile sensor, a surface roughness estimation system (Figure 4) was developed. A parallel gripper EVG 55 was used as the robotic end effector, which was manufactured by SCHUNK Company (Germany). One of the fingers was equipped with the tactile sensor, and the force sensor was installed in another finger. The signals of the PVDF piezoelectric films and the strain gauges were amplified by the charge amplifier and strain amplifier, respectively. The amplified signals were sampled and transferred into computer by NI Corporation’s NI-9215 data acquisition equipment. Data acquisition software with multichannel was developed based on LabVIEW 2010 (Laboratory Virtual Instrument Engineering Workbench).

Surface roughness estimation system: (1) Strain amplifier, (2) charge amplifier, (3) National Instruments data acquisition equipment, (4) Industrial PC, (5) multichannel data acquisition software, (6) end effector, (7) Tactile sensor, and (8) force sensor.
Experiments data
In this work, three kinds of the fruits and vegetables, that is, cucumber, cantaloupe, and apple were selected to indicate different surface roughness levels (Figure 5). The surface roughness level of cucumber was defined as rough, the cantaloupe was as relatively rough, and the apple was as smooth.
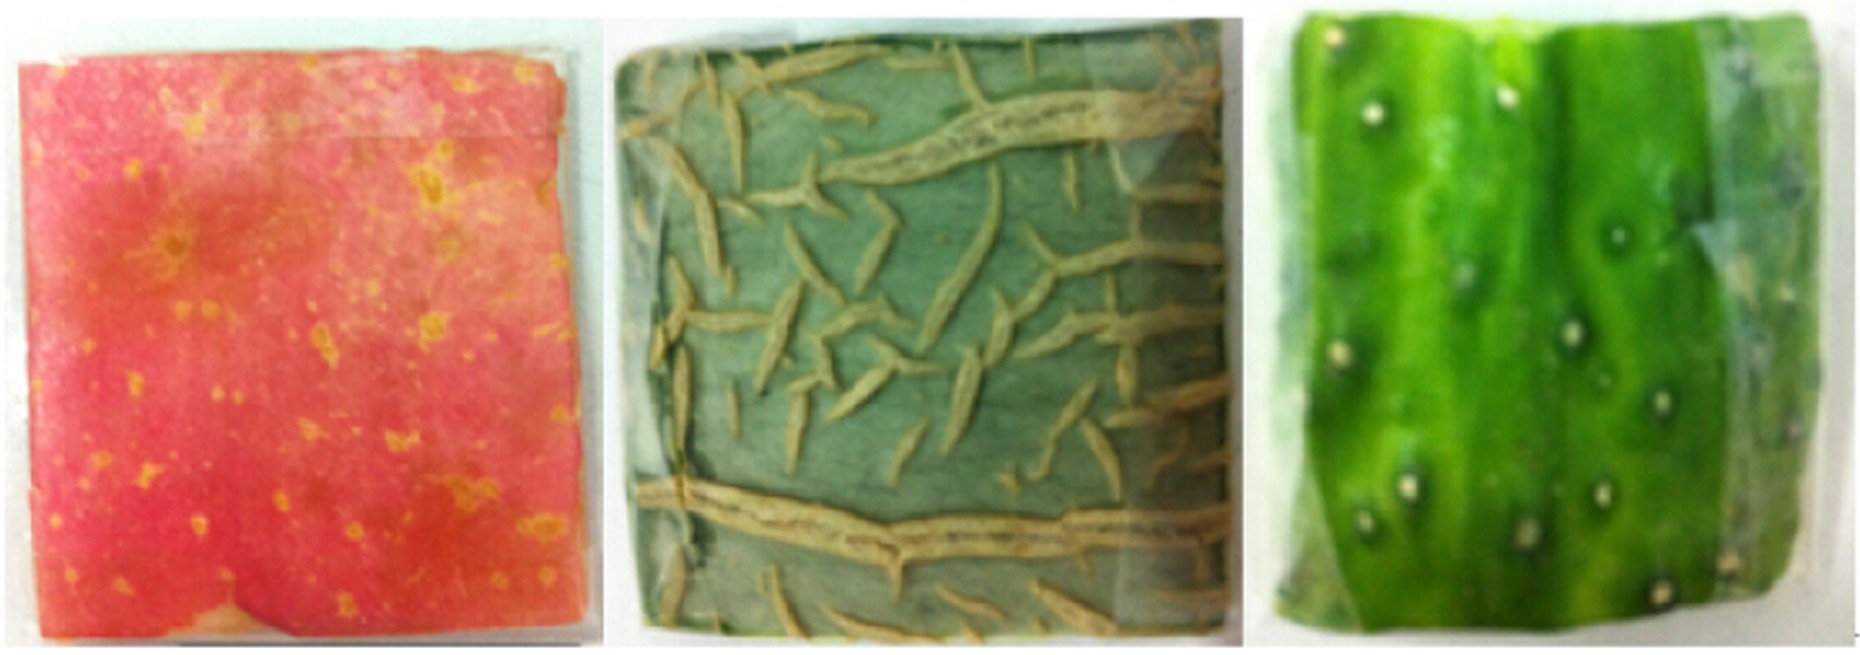
The surfaces of the samples: apple, cantaloupe, and cucumber
In the process of tactile information acquisition, the two fingers of robotic end effector closed firstly, then the tactile sensor contacted with the samples of the fruits and vegetables. Once the grasping force reached 1 N, the fingers stopped further closing and maintained this constant normal pressure force. Then, the fingers of end effector moved along the surface of each sample of fruits and vegetables. During the fingers moving, the output signals of sensitive elements of the tactile sensor were sampled. The sampling frequency in the experiment was 1000 Hz. A total of eight signals were recorded for each sample of the fruits and vegetables, including four signals from the PVDF piezoelectric films and the others from the strain gauges.
From the output signals of the tactile sensor, features expressing surface roughness were extracted. For the output signals of each PVDF piezoelectric film, the maximum value of signals T max, the minimum T min, and the difference T dk = |T max − T min| between them were selected as the feature components. For output signals of each strain gauge, just the difference P dk = |P max − P min| was chosen as one of the feature component. So, a feature vector with 16 dimensions was obtained for each sample of the fruits and vegetables. The first 12 components were produced by the PVDF piezoelectric films and the rest were from the strain gauges. The 14 samples were applied for the each kind of the fruits and vegetables, and 10 repeated experiments were carried out. So, a total of 420 feature data with 16 dimensions were obtained.
A group of signals of the PVDF piezoelectric films and strain gauges for each sample are shown in the Figure 6.
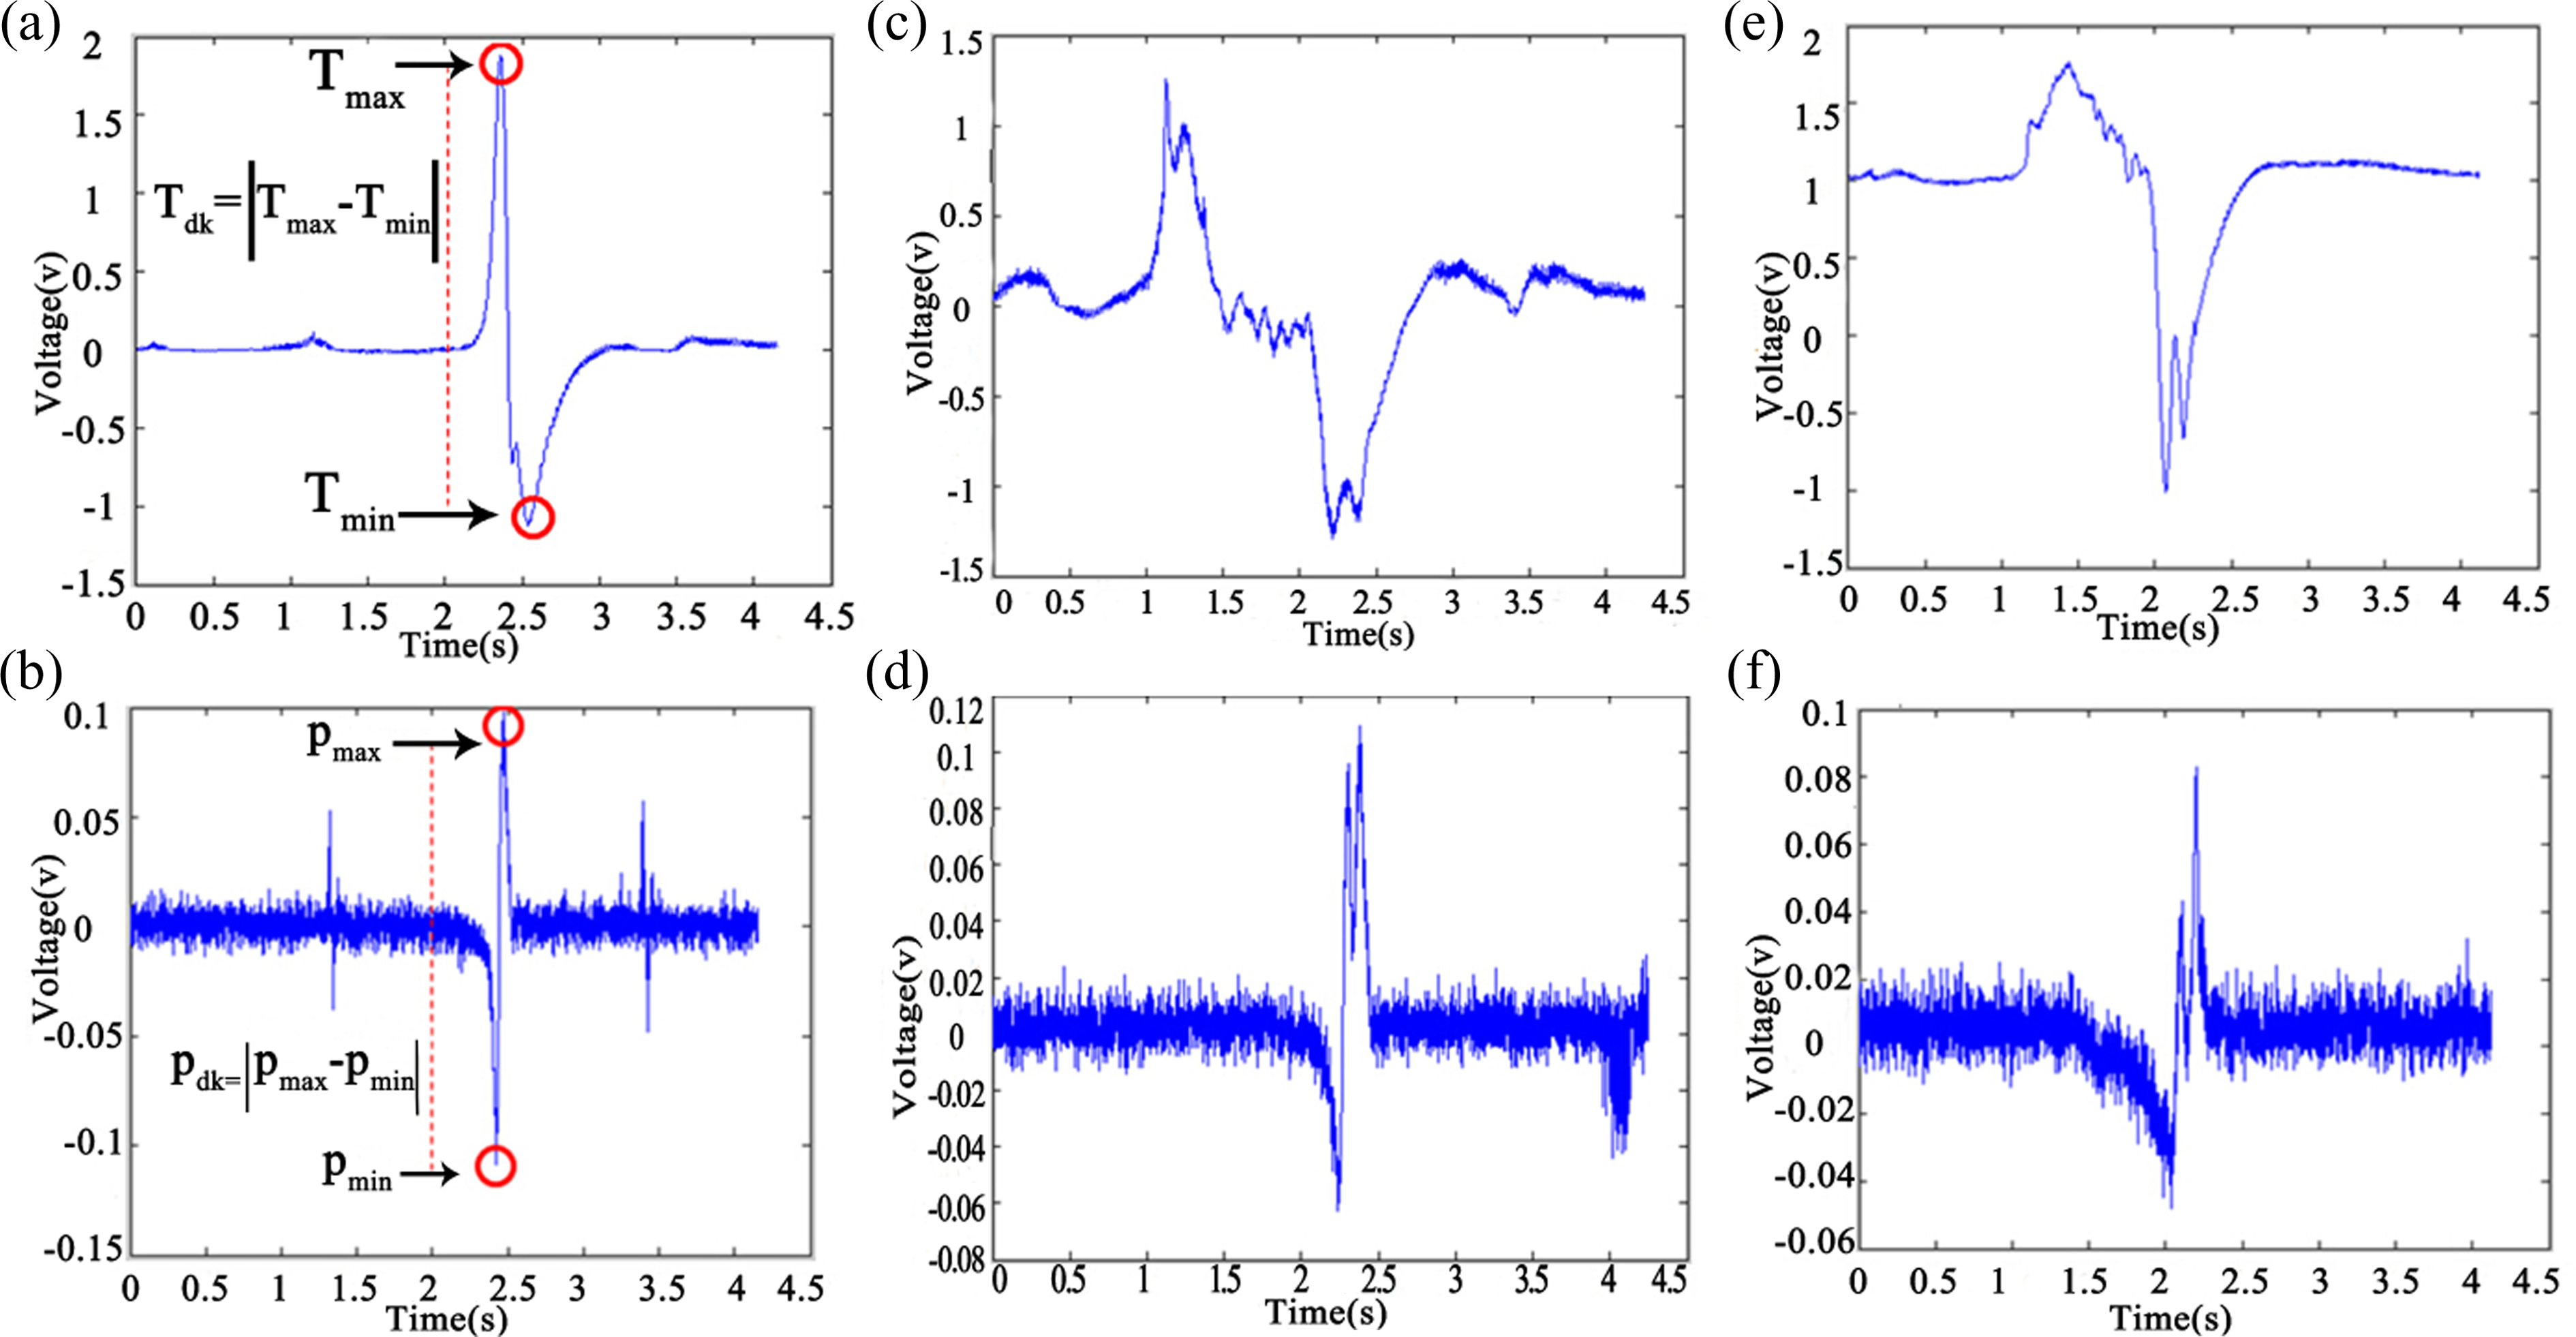
Tactile sensor output of the samples: (a) PVDF signal of the apple, (b) strain gauge signal of the apple, (c) PVDF signal of the cantaloupe, (d) strain gauge signal of the cantaloupe, (e) PVDF signal of the cucumber, and (f) strain gauge signal of the cucumber. PVDF: polyvinylidene fluoride.
Optimal tactile feature expressing the surface roughness
In order to evaluate the effectiveness of sensitive elements that was randomly distributed in the tactile sensor, and reduce the feature dimension to simplify the characterization of surface roughness, it is necessary to compare the contribution of the each component of the 16 dimensions feature in expressing the surface roughness characteristics of the fruits and vegetables.
D-score values of each tactile feature component
Traditional F-score feature evaluation criterion is an important evaluation criterion according to the rule of inner-class distance and between-class distance. In other words, the F-score can measure the ability of each component of features in identifying different categories. So, it is a simple and effective method for feature selection. 23
The traditional F-score feature evaluation criterion is applicable only to the classification problems with two categories. Moreover, it does not consider the influence of the dimension on the identifying capability of the features. Therefore, Xie et al. 24 introduced the D-score feature evaluation criterion

where c is the number of categories to be identified, mj ,i is the average value of ith feature of category j data, mi is the average of ith feature of the all data, nj is the numbers of all jth category data, and xj ,k,i is the ith eigenvalue of kth of category j data. The greater the D-score value, the better identification ability of this feature is.
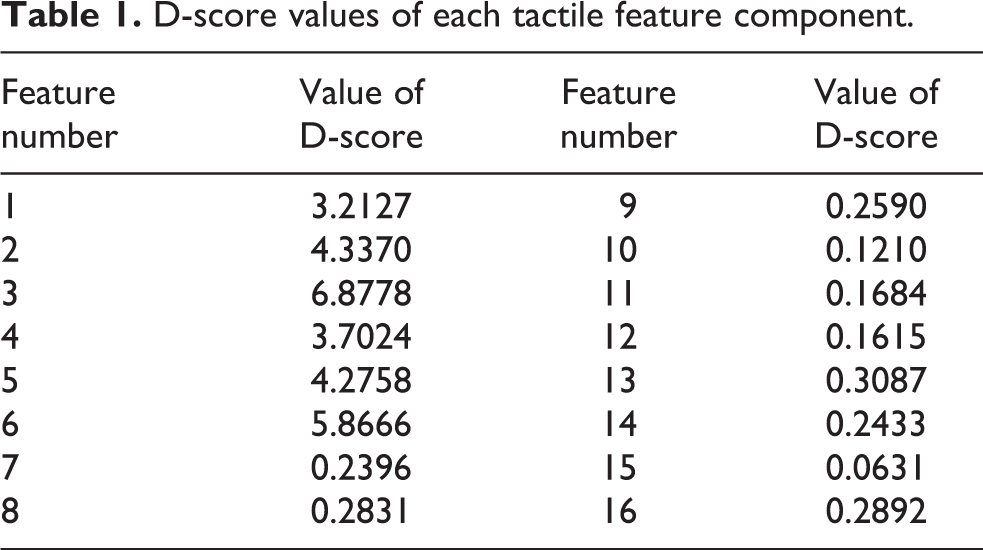
For 420 feature data with 16 dimensions, the value of D-score was used to evaluate the contribution of the each feature component in identifying the surface roughness levels of the fruits and vegetables. According to equation (1), the D-score value of the each feature component was calculated and the sequence of D-score value from big to small was: 3 > 6 > 2 > 5 > 4 > 1 > 13 > 16 > 8 > 9 > 14 > 7 > 11 > 12 > 10 > 15. As shown in Table 1, it can be seen that the ability of the each feature component in expressing surface properties of fruits and vegetables was apparently different. The greater the D-score value, the better identification ability of this feature component was.
D-score values of each tactile feature component.
If all feature components were applied to identify the surface roughness directly, the computational complexity would be increased obviously. On the other hand, some of the disadvantage factors between each feature component can’t be detected and removed, such as information redundancy and negative correlation factor. Thus, it is necessary to select the optimal feature components subset from the 16 dimensional features.
So, evaluating the performance of each feature is the precondition for applying these feature selection methods. Back propagation (BP) neural network has a good ability of nonlinear mapping, and it is widely used in target recognition. 25,26 Here, BP neural network was applied to build a model for evaluating performance of the each feature component in identifying surface roughness levels of the fruits and vegetables (Figure 7).

Schematic diagram of BP neural network model. BP: back propagation.
Three-layer neural network structure was adopted in BP model, and the activation function used for hidden layers was logsig. The number of neurons in the input layer of the BP network was equal to the dimensions of the input feature. The number of hidden nodes was set as 12. The output layer neuron node number was set as 3. Thus, a BP neural network model had been built. The normalization of the data was conducted by the method of maximum–minimum

where xk was the kth data, x min was the minimum value of data, and x max was the maximum value of data.
The neural network learning rate was set as 0.1, the maximum number of iteration was 1000, and the target error was 0.0001. The weight and bias were randomly initialized in the range of [0, 1]. The 80% of all 420 feature data were set as training samples, and the remaining 20% were testing samples.
Optimal selection of tactile features
Feature dimension reduction is able to delete the redundant components in the tactile feature vectors and improve computational efficiency. Generically, feature dimension reduction can be divided into two categories: feature selection and feature extraction. 27 Feature selection is to select the most effective feature components with the purpose of reducing the dimension of feature space. However, feature extraction maps the features with high dimension to new features with low dimension by some functions.
The sequential forward selection and the sequential forward floating selection are two major feature selection methods. 28 The sequential forward selection is also called increasing set method, which started with an empty set. Firstly, an optimal feature is added to the feature subset. Then, the next optimal feature in the rest of features is added to the original optimal subset. The better performance of identification can be obtained by combining the two added optimal features. Repeat the process until the requirement or some stopping condition is met. But the problem is that once a feature is added, it cannot be removed. The sequential forward floating selection can solve this problem. If the accurate rate increases, the selected feature is retained, otherwise it is discarded and the next optimal feature will be selected.
Sequential forward selection
According to the principle of sequential forward selection strategy, the feature component 3 with the biggest D-score was applied as a feature subset to establish the training set firstly. After training, with corresponding testing samples, the identification accuracy of BP neural network about surface roughness levels could be obtained. Then, the feature component 6 with the second biggest D-score was put into feature subset as the training set together with the component 3 and so on. Each feature component was added sequentially to the training set according to the D-score values from big to small, and the identification results are shown in Table 2.
The identification accuracy of BP neural network with sequential forward selection.

BP: back propagation.
When the feature subset consisted of only feature component 3, the identification accuracy of BP neural network was only 66.38%. When the feature subset consisted of feature components 3 and 6, the identification accuracy was greatly improved, reaching more than 89%. However, when the feature components 2, 1, 11, and 15 were added to the feature subset, the identification accuracy of BP neural network declined. So, it does not mean that the more number of feature components, the higher the identification accuracy was. Some components were redundant, which not only have negative influence on the identification accuracy but also caused model more complex. Taking the BP neural network detection model into account, the feature components 1, 2, 3, 4, 5, 6, and 13 can be chosen as the optimal feature subset, and corresponding accuracy of identifying the surface roughness of fruits and vegetables was 93.37%.
Sequential forward floating selection
The results of sequential forward selection indicated that some feature components had negative influence on the identification accuracy. In order to finding the better feature subset, the sequential forward floating selection algorithm was applied further. The optimal feature subset obtained by this method can maintain the capacity of the former feature subset in identifying surface roughness levels of the fruits and vegetables while deleting the redundant components.
With the BP neural network roughness level detection model, the feature dimension reduction of sequential forward floating selection is shown in Table 3. The up arrow in the table indicated that the identification accuracy increased, otherwise declined. When the feature components 3 and 6 were added to the feature subset in order, the identification accuracy of BP neural network was improved. But when the component 2 added to the feature subset, the accuracy decreased. So, it should be removed. Except the components 5, 4, and 12, the other features added to the feature subset can’t improve the identification performance, even degrade it. So, the components 3, 6, 5, 4, and 12 can be considered as the best subset of features, the identification accuracy was 93.737%.
The identification accuracy of BP neural network model with sequential forward floating selection.

BP: back propagation.
By comparing the results of two kinds of feature selection strategies, it can be found that the optimal feature subset is not the same. It was clear that there were redundant components in original features, which indicated that the corresponding sensitive elements mounted in the tactile sensor were unnecessary.
Although the best subset of features wasn’t the same, there was intersection indeed between two optimal subsets. These feature components were all from PVDF-sensitive elements, thus it is can be seen that the effectiveness of PVDF-sensitive elements was better than strain gauges in detecting the surface roughness characteristics of the fruits and vegetables.
Conclusion
In this study, a tactile sensor was produced by randomly arranging the sensitive elements, which can simplify the sensor design and make it easily adapt to different grasping tasks. The ability of each feature component in identifying surface roughness levels of the fruits and vegetables was investigated. The redundant feature components indeed existed. The optimal feature subset could be obtained by deleting the redundant feature components, which possessed more efficient performance in expressing the different levels of surface roughness of the fruits and vegetables. The identification accuracy of BP neural network model reached 93.737%. The PVDF-sensitive elements in the tactile sensor were more excellent than strain gauges in surface roughness perception. This work can provide the basis for improving the tactile sensor design
Footnotes
Declaration of conflicting interests
The author(s) declared no potential conflicts of interest with respect to the research, authorship, and/or publication of this article.
Funding
The author(s) disclosed receipt of the following financial support for the research, authorship, and/or publication of this article: The author(s) received financial support from National Natural Science Foundation of China (31471419) and Natural Science Foundation of Zhejjiang Province (LY17F030006) for the research and publication of this article.