
Abstract
In this article, the design on the shock absorber of the lunar probe soft landing can be considered as a single- or multi-objective optimization problem. Here, the optimized objective parameters include the maximum toppling stability, defined as D min, and the minimum stroke of primary strut energy absorption, SP max. However, the two optimized variables are conflict objectives. In order to give an overall consideration about the multi-performances of landing, the multi-objective optimization strategy is proposed and nondominated sorting genetic algorithm II is employed to find the best decision parameters of the shock absorber design. To conduct the optimizations, firstly, the worst landing cases and safety boundaries for both toppling and primary strut energy absorptions are obtained by the computer simulation experiments. Both single- and multi-objective optimizations are then implemented aiming to expand the stability boundary. The results show that the landing stability is effectively improved after optimizations, and also demonstrate that the multi-objective optimization strategy is superior to that of the single-objective optimization.
Keywords
Introduction
The Moon, as the nearest celestial body to the Earth, has become increasingly attractive for space scientists because of its abundant natural resources and high potential as a future territory. 1 Robots play very important role in the development of lunar exploration. They provide the means to operate in extreme environments, the endurance to survive harsh conditions, and, of course, they personify intelligence and autonomy of all sorts. More and More sensors have been used to help the robot to understand the world. For object recognition, tactile sensor is currently introduced and progressive research has been performed on it in the study by Liu et al., 2 –5 its information is processed by various learning algorithms. Based on these successful results, visual–tactile fusion framework is proposed by Liu et al. 6,7 to recognize object. Another researches about the robot location 8 accumulated the sonar data to overcome the limitations of sensor performance. While for space robots, especially for lunar exploration, we first overcome the problem of soft landing, then solve the problems of recognition, perception, location, and so on.
During the lunar exploration, the soft landing is a challenging problem, where the landing operation will occur at an uncertainty of the landing sites and flight states. Furthermore, in the touchdown seconds, great impact forces may be induced to the spacecraft, measures must be taken to attenuate the shock energy. The legged-type lander 9,10 is widely adopted to implement the soft landing in previous lunar exploration missions, such as unmanned Lunar and Surveyor, manned Apollo programs, and Chang’e-3 project.
For guaranteeing the stability and safety of the lunar module, and protecting the devices inside it, landing dynamics and landing stability analysis during the landing phase is an important task. Researchers have dedicated to develop mathematical models for soft-landing dynamics simulation about the legged-type lunar lander in the past decades. 11 –15 In addition, analysis of landing stability has received great interest in the literature. 16 –23 On the hardware side, to achieve a successful soft landing, the landing gear must provide sufficient energy absorption capability and also must prevent the landing vehicle from toppling. 24 The aluminum honeycomb is always selected as the shock absorber because of its ease of use and reliability. The honeycomb shock absorber is usually designed to multilevel buffer forces, 11 among which, the low-level buffer force is to prevent the probe from toppling in the worst landing case, and the high-level buffer force is to absorb the impact energy to avoid reaching its limit. Therefore, an appropriate design of the honeycomb shock absorber directly affects the landing stability for the lunar probe.
The shock absorber design aims to obtain the optimal allocation scheme on every-level buffer force, so as to improve the landing stability for the probe. 25 The related research on the design optimization of the shock absorber is less because of the complexity of the landing stability analysis itself as well as the complexity of the optimization problem on dynamic systems. According to the landing stability requirements, the design optimization of the shock absorber is a multi-objective optimization problem, which is one of the most common research topics. So far, several approaches have been introduced to solve the multi-objective optimization problems among which intelligent optimization techniques (evolutionary algorithms) are special. 26 Nondominated sorting genetic algorithm-II (NSGA-II) 27 is the commonly used algorithms in intelligence optimization. In this article, the optimized objectives include the minimum toppling distance, defined as D min, and the maximum stroke of the primary strut SP max. However, these two objectives conflict with each other. In order to give an overall consideration of multi-performances for the landing stability, the multi-objective optimization strategy is proposed and NSGA-II is employed to find the best design parameters of the shock absorber. From the landing stability results, the effectiveness of the multi-objective optimization is verified by comparison with the single-objective optimization.
The outline of this article is as follows: the first section is the “Introduction;” the “Lunar probe landing dynamics model” is established in the second section; the third section gives the “Landing stability analysis;” the “Multi-objective optimization method” is introduced in the fourth section; “Optimum design results and discussions” of the proposed method are finally presented in the fifth section; and the last section is the “Conclusion.”
Lunar probe landing dynamics model
Configuration of the lunar probe
The lunar probe is composed of a main body and four landing gear assemblies as shown in Figure 1. The four gear assemblies are uniformly distributed around the main body. Each gear consists of a primary leg strut, two secondary leg struts, and a footpad. Shock absorbers located inside the strut are employed to absorb the energy when the lander impacts with the lunar surface.

Configuration of the landing gear.
From Figure 1, we can see that each leg strut comprises an outer cylinder, an inner cylinder, and a honeycomb shock absorber. The honeycomb absorber is installed between the outer and inner cylinders to absorb energy when the strut is extended or compressed.
Figure 2 illustrates the typical honeycomb load–stroke curves for primary and secondary strut assemblies. The primary strut has the shock attenuation capability in only compression stroking, and the secondary struts have shock attenuation capability in both tension stroking and compression stroking. Note that two stages of load level are designed for the primary strut. The initial low force level is intended to enhance the toppling stability, while the higher force level is used to limit loads on the vehicle body to avoid bottoming out the strut.

Characteristics of honeycomb crush-load. (a) Primary strut load–stroke curve. (b) Secondary strut load–stroke curve.
Dynamics model
The landing dynamics simulation model is established by using the multibody dynamics simulation software ADAMS (ADAMS 2005 developed by MSC Software Corporation). Each leg strut is attached to the main body through a universal joint with two rotational degrees of freedom. A translational joint is applied to enable the strut’s compressing and extending between the outer and inner cylinders of each leg strut. Each secondary strut is connected to the outer cylinder of the primary strut with a spherical joint permitting all three rotations, the joint connecting the footpad and the inner cylinder of the primary strut is also spherical type. Figure 3 shows the lastly established dynamics simulation model.

The whole dynamics model for lunar lander.
The honeycomb buffer force is simplified as the action and reaction force between the outer and inner cylinders. Its value is according to the load–stroke curve when the honeycomb is compressed. Mathematically, the honeycomb force can be expressed as a function about the relative stroke and speed between the outer and inner cylinders
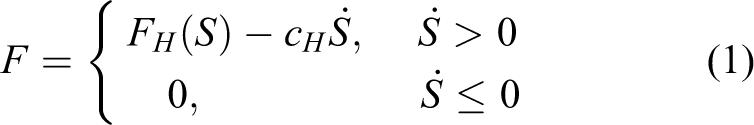
where F denotes the buffer force, FH
is the load when the honeycomb is compressed, cH
is the damping coefficient, and S and
The contact force between the footpad and the lunar surface is divided into a normal force perpendicular to the lunar surface and a tangential force parallel to the surface. The normal force Fn is modeled as a nonlinear spring damper

where kL
is the stiffness coefficient, cL
is the damping coefficient, e is the nonlinear exponent, and δ and
The tangential force Ft is simply computed by the Coulomb friction formula

where μL is the frictional coefficient between the footpad and the lunar surface.
Landing stability analysis
Landing stability criteria
According to the requirements of toppling stability and energy absorption, the landing stability criteria of the landing gear system can be categorized as follows: no vehicle toppling happens and no excessive stroke of any shock absorber occurs.
A parameter representation of the vehicle toppling is the minimum stability distance D min, the bigger the better. The stability distance Di (i = 1, 2, 3, 4) is the distance from the mass center of vehicle to the overturn plane which passes through any two adjacent landing gear footpads as shown in Figure 4. SPi (i = 1, 2, 3, 4) represents the stroke of the ith primary shock absorber.

Parameters of vehicle toppling.
The landing stability criteria are consequently expressed as follows: Dmin ≥ 0, where
where S
threshold denotes the threshold value for the stroke of the primary shock absorber.
Landing stability simulation
In this section, parameter sensitivity simulations are performed to analyze the landing stability. The input parameters include vertical velocity (vv ), horizontal velocity (vh ), yaw angle (θx ), pitch angle (θy ), lunar slope angle (αs ), and landing weight (mL ), as shown in Figure 5.

Initial landing condition parameters.
Ranges of initial landing parameters are listed in Table 1, which are determined according to the actual situation.
Ranges of initial landing condition parameters.

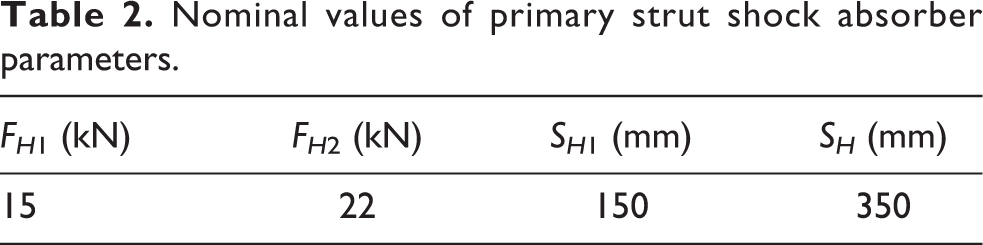
Parameters of the primary strut shock absorber are listed in Table 2, where FH 1 and FH 2 denote the first- and second-level buffer forces, respectively, SH 1 is the buffer stroke of the first honeycomb, and SH is the total buffer stroke.
Nominal values of primary strut shock absorber parameters.
Considering the above input conditions, landing dynamics simulation experiments are carried out to analyze the lunar probe soft-landing stability. Results show that the lunar probe is able to land safely under all possible initial conditions. Meanwhile, the worst landing conditions for vehicle toppling and primary stroke shown in Figure 6 are finally acquired.

Worst sets of landing conditions. (a) Worst landing condition for vehicle toppling. (b) Worst landing condition for primary stroke.
Safety margin analysis is then implemented in order to further explore the ultimate capability of the lunar probe to bear the initial conditions. Under each worst landing case, the vertical and horizontal velocities, vv and vh , are gradually increased to examine the landing stability, until the lunar probe overturns or any primary stoke exceeds the threshold value. Finally, the safety boundaries for both performances are found, which result in the envelope of the design velocity as illustrated in Figure 7.

Landing stability boundary. : boundary for toppling;  : boundary for stroke of the primary shock absorber;
  : design velocity envelope.
From Figure 7, it can be concluded that when αS ≤ 10° and θy ≤ 4°, the initial vertical and horizontal velocities should be within the pentagon envelope to ensure a stable landing absolutely. In addition, we can see that the stability margin of the toppling boundary is higher than that of the primary strut stroke. Hence, the design optimization of the shock absorber is meaningful in consideration of improving the overall landing stability.
Multi-objective optimization method
Since there is not only one performance indicating the landing stability, the multi-objective optimization strategy is introduced to the design optimization of the shock absorber. Unlike the single-objective optimization problem which provides only a single optimal solution, the multi-objective optimization problem will provide a set of points known as Pareto optimal set which represents the trade-off solutions between conflicting objectives.
Multi-objective optimization model
The multi-objective optimization is to search a series of solutions, when each objective function achieves its optimum value under certain constrained conditions. A general multi-objective optimization problem can be described mathematically as follows

where
Pareto dominance: Given two vectors
Pareto optimal solution: A decision vector
Pareto set: The set of Pareto optimal solutions is defined as
Pareto front (PF): The PF is defined as
Multi-objective NSGA-II
To obtain the PSs, a number of techniques have been proposed in the literature, in which the NSGA-II has gained much attention from the researchers due to its effectiveness and easy implementation. The NSGA-II 28 is an improved version of NSGA 29 developed from the well-known genetic algorithm (GA) and nondominated sorting concept. In the past decades, the NSGA-II has been widely applied in design optimization of various problems. In this article, the NSGA-II is used to solve the shock absorber design optimization problem.
The flow chart of this algorithm is presented in Figure 8.

Flow chart of NSGA-II. NSGA: nondominated sorting genetic algorithm.
Optimum design results and discussions
For the shock absorber design optimization, the aim is to improve the landing stability of the lunar probe. The design variables are the first-level buffer force (FH 1), the second-level buffer force (FH 2), and the buffer stroke of the first honeycomb (SH 1). In this article, both single- and multi-objective optimization approaches are used to solve the problem. The results indicate the superiority of using the multi-objective optimization strategy for design optimization.
Single-objective optimization
In this study, the single-objective optimization problem is to maximize the D min. SP max is regarded as a constraint function, and each design variable has their respective threshold values. The corresponding model is expressed mathematically as

A single-objective GA is employed to solve this optimization problem. Parameter settings of GA are specified in Table 3.
Some parameters of the employed genetic algorithm.

The optimization history curves are plotted in Figure 9. One is the objective value D min and the other is the constraint value SP max. From this figure, it can be seen that the value of the optimum point in each generation is optimized in comparison with the previous generation and converges to the global optimum solution at last.
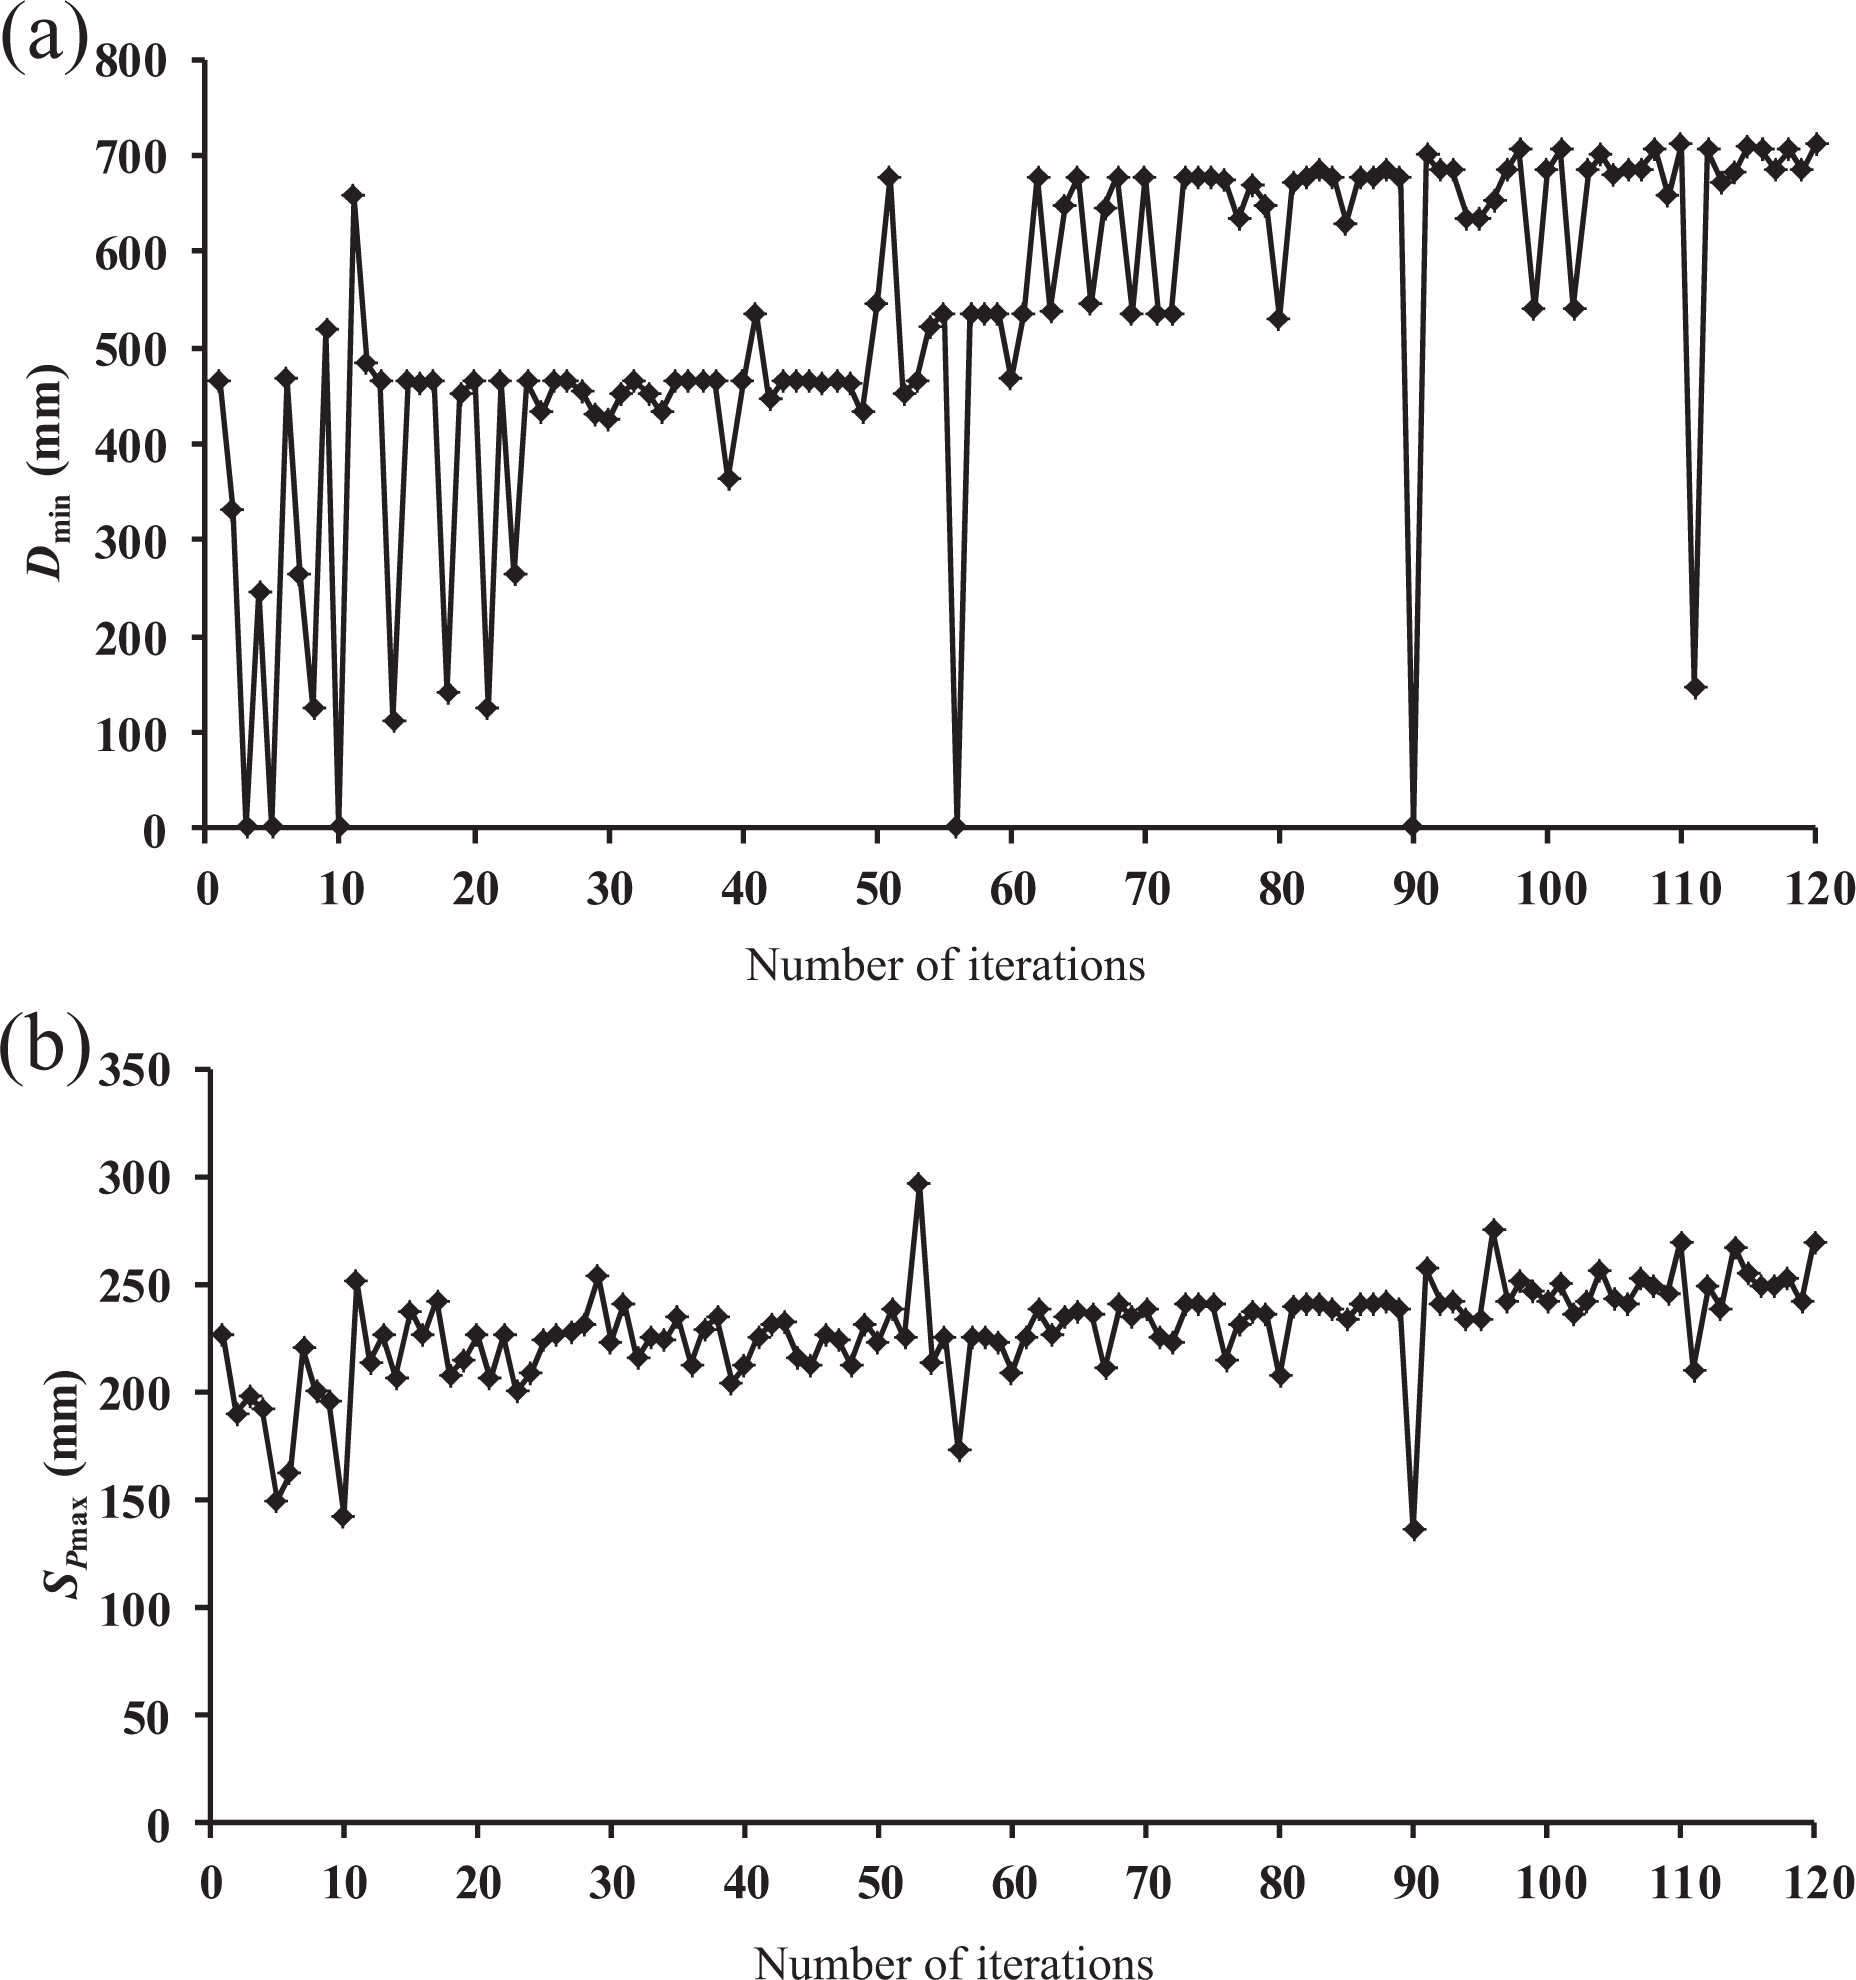
Optimization history graphs of landing performance parameters by GA. (a) History curve of D min optimization. (b) History curve of SP max optimization.GA: genetic algorithm.
The design variables as well as the stability parameters are listed in Table 4. It can be seen that D min increases to 711 from 343, but at the same time, SP max increases to 270 from 195. In general, the desired result is that the D min is increased, while the SP max is decreased. However, the situation implies that D min and SP max are contradictory with each other. The improvement of one performance will result in the deterioration of the other.
Single-objective optimization results.

Multi-objective optimization
As mentioned above, the D min is contradictory with SP max. That is, the increasing D min results in the increasing SP max, which does not meet the design requirement. Therefore, the multi-objective optimization is employed to maximize D min and minimize SP max. The corresponding model is expressed mathematically as follows

The NSGA-II is utilized to solve the above multi-objective optimization problem. Parameter settings of NSGA-II are specified in Table 5.
Some parameters of the NSGA-II.

NSGA: nondominated sorting genetic algorithm.
The results of the optimization are illustrated in Figure 10 with D min on the horizontal axis and SP max on the vertical axis. The trend of PF is depicted with a solid line. It shows the PF of multi-objective optimization for the enhancement of the D min as well as reducing the SP max. The last front is PF in which all the points are optimum points and they are nondominated.

Optimization history graphs of landing performance parameters by NSGA-II. : Pareto front;  : feasible solution;
  : non-feasible solution. NSGA: nondominated sorting genetic algorithm.
Meanwhile, the corresponding Pareto optimal solutions are also shown in Table 6. , from which the 11th individual is arbitrarily selected as the final optimal solution. We can see the D min reaches 678, while the SP max is 227.
Pareto optimal set.
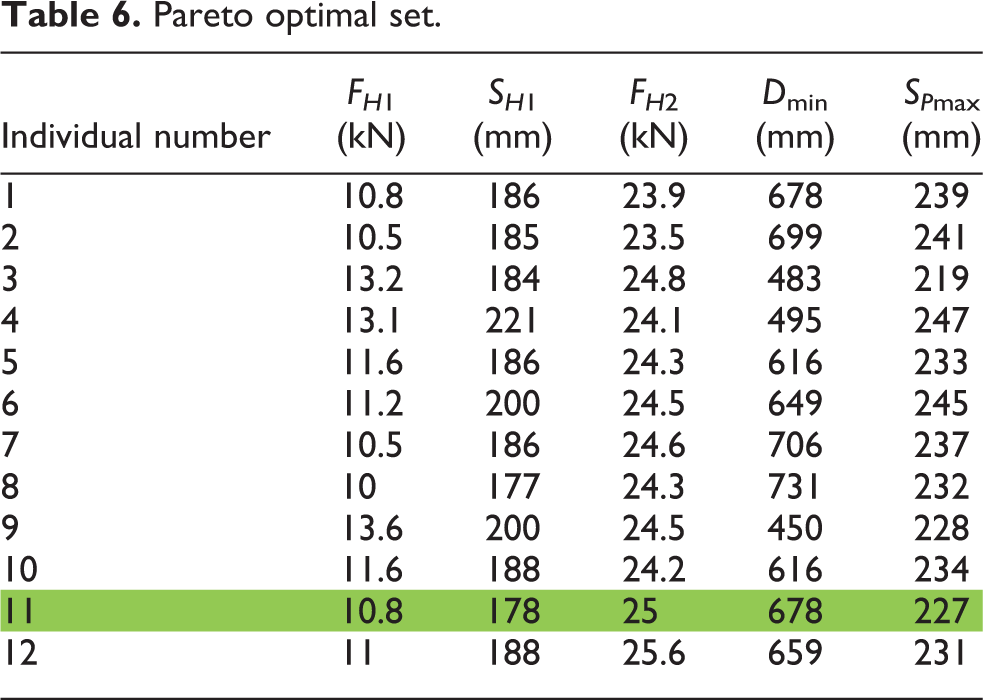
Figure 11 shows the history curves about D min and SP max before and after optimization. The optimized values are shown in Table 7. From the results, it can be obtained that the D min increases to 678 from 343, and the SP max increases to 227 from 195 by NSGA-II, while D min is up to 711 from 343 and the SP max up to 270 from 195 by GA. The multi-objective optimization can take effective measures to increase D min and meanwhile decrease SP max, which conforms to the design regulations. In addition, it shows that the NSGA-II is an effective method to solve the multi-objective optimization.

Comparison of time history curves of D min and SP max before and after optimization. (a) Minimum toppling distance D min. (b) Maximum primary stroke SP max.
Comparison of optimization results.

Using the values of FH 1, SH 1, and FH 2 obtained after the multi-optimization, landing dynamics simulations are implemented under the two worst cases, namely, toppling and primary stroking. Time history curves of the locations and velocities of the lander mass center are illustrated in Figures 12 and 13, respectively.

Time history curves of locations and velocities under the worst case for toppling. (a) Vertical location of the mass center. (b) Horizontal location of the mass center. (c) Vertical velocity of the mass center. (d) Horizontal velocity of the mass center.

Time history curves of locations and velocities under the worst case for primary stroking. (a) Vertical location of the mass center. (b) Horizontal location of the mass center. (c) Vertical velocity of the mass center. (d) Horizontal velocity of the mass center.
Based on the multi-objective optimization results, the soft-landing stability of lunar probe is analyzed. In Figure 14, the comparison curves are plotted. Here, the dotted lines are the parametric boundaries before optimization, and a pentagon is surrounded, its area is about 10. While the solid lines denote the parametric boundaries after optimization, and the other pentagon is surrounded, its area is about 13. It can be clearly observed that the safety boundaries for landing are extended by 30% using the multi-objective optimization method. Then, the dynamic performance of the lunar probe can be improved. Finally, the adaptability to initial conditions is enhanced.
Comparison of landing stability boundaries before and after optimization. : boundary for toppling (before optimization);  : boundary for stroke of the primary shock absorber (before optimization); : design velocity envelope (before optimization);
  : boundary for toppling (after optimization by NSGA-II);
  : boundary for stroke of the primary shock absorber (after optimization by NSGA-II);
  : design velocity envelope (after optimization by NSGA-II). NSGA: nondominated sorting genetic algorithm.
Conclusion
In this article, the multi-objective optimization is first proposed to design the shock absorber of the lunar lander to improve the landing stability. The NSGA-II is then employed to solve this optimization problem. The following conclusions can be drawn from this investigation: To evaluate the landing stability of the lunar probe, the landing dynamics model is established. The toppling distance D
min indicates the overturning prevention capability, and the stroke of the primary strut SP
max indicates the energy absorption capacity. Landing simulation experiments are conducted to obtain the worst landing cases: the minimum Dmin and the maximum SPmax. At last, the envelope for the initial horizontal and vertical velocities is acquired, which provides references for the subsequent optimization design of the shock absorber. To maximize the Dmin and to minimize the SPmax simultaneously, the multi-objective optimization using NSGA-II is performed to find the best design values for the honeycomb shock absorber. After the optimization, the overall landing safety boundary is enhanced by 30% in comparison with the initial result. This work indicates that the multi-objective optimization approach is effective and superior for the shock absorber design.
Footnotes
Declaration of conflicting interests
The author(s) declared no potential conflicts of interest with respect to the research, authorship, and/or publication of this article.
Funding
The author(s) disclosed receipt of the following financial support for the research, authorship, and/or publication of this article: The project is supported by the National Natural Science Foundation of China (11202010, 61340044) and the Fundamental Research Funds for the Central Universities (YWF-10-01-B30).