
Abstract
Dynamic k-coverage planning for multiple events with mobile robots is proposed in the article. In mobile sensor networks, movement with the minimum energy for multiple events detection is a challenge which is discussed in the article. The problem of multiple events coverage is divided into two subproblems, namely mobile robots’ uniform deployment and nodes’ selection. Assuming that sparse mobile robots randomly deploy in the environment, mobile robots need to uniformly deploy firstly in order to effectively communicate with static nodes and extremely cover the entire region. A weighted-sub-Voronoi-half-gravity method and a weighted-sub-Voronoi-half-incenter method are presented for mobile robots’ uniform deployment. Two algorithms guarantee mobile robots are deploying with a higher coverage ratio. Meanwhile, analog game theoretic algorithm is proposed for nodes’ selection (static node’s selection and mobile robots’ selection). Only one static node is selected to detect an event and notifies candidate mobile robots which can communicate with the selected one of the event’s occurrence. Moreover, k mobile robots are selected for event coverage. The proposed algorithm achieves k-coverage of each event with less energy consumption. Performance analysis and simulations show that the proposed algorithm achieves very good results.
Introduction
Multi-robot systems have been widely used in search and rescue task, 1,2 intruder detection mission, 3 –6 and environmental monitoring mission. 7 In these tasks, regional coverage and event detection are fundamental problems. However, each mobile robot possesses limited sensing capability and battery power. 8,9 If mobile robots deploy in a region sparsely, complete sensing coverage is a difficult task for multi-robot system.
If a region in which a point is not covered by any mobile robots exists, a coverage hole emerges. Coverage holes may affect the overall performance of multi-robot systems: decreasing the data reliability and destroying communication links. So, coverage holes’ detection and holes’ repair (namely each point in the region is possibly covered by any mobile robots) are essential problems for regional coverage.
In the problem of coverage, unbalanced energy consumption exists among mobile robots due to mobility and communication. The maximum coverage area with the minimum number of mobile robots and the minimum energy consumption is a challenge for multi-robot coverage.
Many scholars concerned about holes detection and repair. Wang et al. 10 proposed three algorithms, namely VECtor-based algorithm, VORonoi-based algorithm, and Minimax algorithm, to detect coverage holes and repair them. Minimax algorithm gets the best performance compared with other two algorithms in most scenarios. But VOR and Minimax algorithms cannot repair coverage holes completely in case of a node locating close to a narrow edge in its Voronoi polygon. While VEC only moves at a low sensor density. Mahboubi et al. 11 proposed four movement strategies, namely maxmin-vertex strategy, minmax-edge strategy, maxmin-edge strategy, and VEDGE strategy (the combination of minimax- and maxmin-edge), to select a candidate location within its Voronoi polygon as the node’s new location to increase the coverage. Dai et al. 12 detected coverage holes and identified border nodes based on the distance between a node and the vertex or edges of its Voronoi cell. Classic Voronoi diagram represents positions of holes with vertices, while it cannot accurately describe positions and sizes of holes.
Moreover, in the problem of event detection, k-coverage is presented to guarantee the accuracy of the event that can be detected. 13 If each event is within the sensing range of at least k mobile nodes, it is defined as k-coverage. Nodes’ selection with the minimum movement energy to prolong the network’s lifetime is a challenge for k-coverage of event. 14
Many works have been proposed to detect the event and cover it. Alam et al. 13 proposed a game theoretic model (GTM) for event coverage, and it can balance the energy consumption due to mobility and keep the traveling distance minimum. It considers the following factors including distance from an event, remaining energy, density, and the likeliness of event occurrence around it. But it cannot apply in a network with less number of mobile nodes because density has a large influence on the node’s selection algorithm, and it may select a node with larger movement energy to cover the event. Ammari and Das 15,16 proposed a pseudorandom sensor placement strategy that guarantees k-coverage of a region of interest (RoI). Meanwhile, centralized and distributed methods are proposed to move sensors toward a RoI and achieve k-coverage of RoI while minimizing the mobility energy. Alam et al. 17 proposed an on-demand k-coverage method for event detection by adjusting the sensing radii of k-1 static nodes once the event is detected by at least one node. The optimal node set whose sensing radii are to be adjusted is selected based on a cost function comprising energy consumption and aggregated event detection probability. However, it needs a large number of static nodes for k-coverage. Lambrou 18 proposed an uncovered region monitoring algorithm in a sensor field consisting of sparse static nodes and mobile nodes. Single mobile node moves to search two nonconnected uncovered regions with the minimum average detection delay or the maximum dynamic coverage. However, the performance of path planning strategy depends on the neighborhood size.
Our major contributions can be summarized as follows: The problems of regional coverage and multiple events coverage with the minimum
movement energy in mobile sensor networks are solved in the article. A weighted-sub-Voronoi-half-gravity (WSVHG) algorithm and a
weighted-sub-Voronoi-half-incenter (WSVHI) algorithm are proposed for the maximum
coverage of the region with sparse mobile robots and they guarantee the shortest
movement distance. Nodes (including static nodes and mobile robots) selection algorithm with analog game
theoretic algorithm is proposed for the selection of activated ones. Only a static
node is selected as the activated one, and it depends on the remaining energy of the
static node and the number of mobile robots which can communicate with the static
node. k mobile robots are selected as activated nodes, and they
depend on (i) the remaining energy, (ii) movement energy, and (iii) communication
energy.
The remainder of the article is organized as follows. “Problem description and system models” section introduces several system models. “Mobile robots’ uniform deployment” section describes the mobile robots’ uniform deployment algorithm. “Nodes’ selection algorithm” section presents the static node’s selection algorithm and mobile robots’ selection algorithm. The fifth section presents simulations and discussions. The sixth section concludes the article.
Problem description and system models
Problem description
Mobile sensor networks exist many static nodes and sparse mobile robots for k-coverage of each event. Static nodes uniformly deploy for 1-coverage of the region. Mobile robots randomly deploy in the region for detecting events. Mobile robots can effectively moves through the field to monitor coverage and detect events.
In order to effectively communicate with static nodes and possibly cover the entire region, mobile robots need to uniformly deploy in the region (that is the problem of mobile robots’ uniform deployment). WSVHG and WSVHI are proposed for uniform deployment of mobile robots. Events occurred in the region are detected by static nodes firstly. But only one is activated to detect each event and notifies candidate mobile robots which can communicate with the activated one of the event’s occurrence, k mobile robots are selected based on analog game theoretic algorithm to move and cover the event.
Energy consumption exists in the process of sensing, communication, and movement. Therefore, we present several models for k-coverage of each event.
Voronoi diagram
Voronoi diagram divided the region into a number of polygons called Voronoi cells. Definitions of Voronoi diagram and Voronoi cell are given as follows.
Definition 1: (Voronoi cell)
Consider a node set
Definition 2: (Voronoi diagram)
The set of all Voronoi cells given by
Each Voronoi cell contains one point and two adjacent Voronoi cells share a Voronoi edge. Each point only needs to sense its own Voronoi cell.
Minimum number of static nodes for 1-coverage
In the square region
Nsta is computed based on the following description. The
sensing area of static node si is
Assuming that the sensing disk of si intersects with the
sensing disk of si+1 as shown as the shaded
part in Figure 1, the area of
overlapping sensing between two static nodes is computed with equation (1)

where the distance between si and si+1 is less than rs and θ represents the angle subtended by the chord of intersection between two sensing disks to the center of the disk.
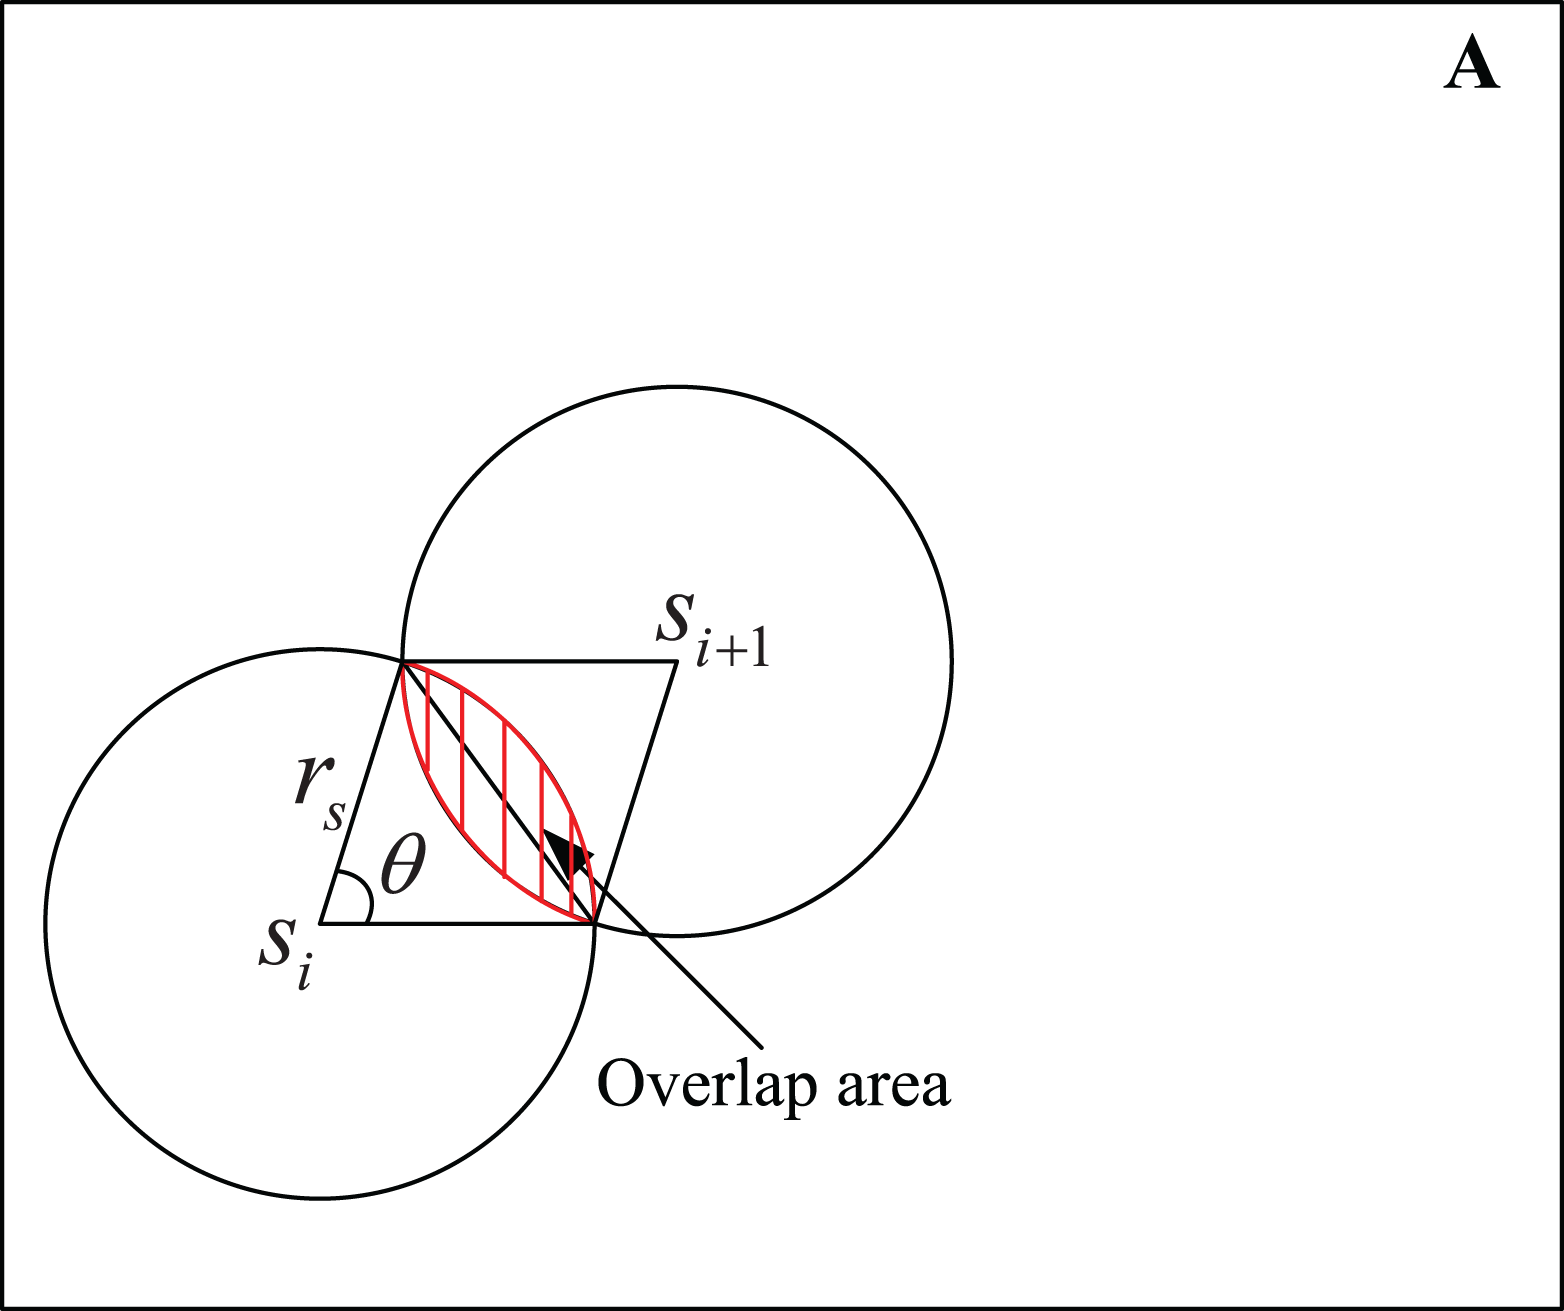
Area of overlap.
Assuming that the sensing disk of a static node intersects with another

where
The minimum number of static nodes required for 1-coverage of region
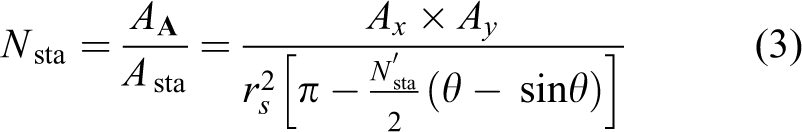
where Ax denotes the length of
Sensing model of mobile robots
Nmob mobile robots randomly deploy in region
Sensing models available in the literature are broadly classified into three types 23 : disk sensing model, probabilistic sensing model, and directional sensing model. Disk sensing model is used in this article.
Assuming that the position of a mobile robot s is

where d(s, P) denotes the Euclidean distance between s and P, and Rs denotes the sensing radius of a mobile robot.
Moreover, static nodes use this model to detect events.
Model of event occurrence
In wireless sensor networks, time property and spatial property are important for events. 24 Based on the time property (occurring at a point-in-time or a time interval) and spatial property (occurring at a certain position or a region), we describe the event model used in the article.
Definition 3: (event model)
Static event occurs in time interval [tON, tOFF
] with position
Energy model
Energy is a critical resource in a wireless sensor network and mobile robots. Energy model specifically refers to the energy consumption in the process of data transmission, data reception, sensing, and movement. In the article, static nodes and mobile robots have the same energy model of sensing and energy model of communication. Moreover, mobile robots exist energy consumption of movement, but static nodes not exist energy consumption of movement. Therefore, we take mobile robots as examples to explain the energy model.
Energy consumption of sensing
A mobile robot j with sensing radius Rs
uses sensors to detect surrounding environment, and there exists energy consumption of
sensing in the process. Energy consumption of sensing

where parameter αs is related to the sensing technology in use and varies in the range 2,4 in the case of sensors adopting an active sensing technology, and α stands for the loss coefficient. 17,25,26
Energy consumption of communication
In the process of communication, there exist data transmission and data reception;
therefore, the energy consumption of communication of a mobile robot j,

where

where
And

where ct denotes energy/bit needed to run the transceiver circuit.
Energy consumption of movement
Considering a mobile robot j with traveling distance L, the energy consumption of movement is defined as

where em is the energy cost for a mobile robot to move one unit distance. 16
Degree of coverage
k (degree of coverage, DOC) is an important performance for accurate and reliable event detection in mobile sensor networks. Increasing k increases the quality of service metrics at the cost of higher network traffic, energy consumption, and deployment cost. While decreasing k would exhibit degraded accuracy and loss of robustness. 17
In the article, ki represents the DOC of a static node
i, and the set of DOC in mobile sensor networks is denoted by
Mobile robots’ uniform deployment
Nmob mobile robots randomly deploy in a large square region. WSVHG and WSVHI are proposed for uniform deployment. The difference between two algorithms is the target selection of each mobile robot in each sub-Voronoi cell. Taking WSVHG as example to detail, and WSVHI is briefly described as the last part. The pseudocode of WSVHG is described in algorithm 1, where Nej represents the number of sub-Voronoi cell in j-th Voronoi cell. Wh1(l), Wh2(l), and Wh(l) are described as follows.
Weighted-sub-Voronoi-half-gravity (WSVHG) algorithm

Movement distance weight
The movement distance weight Wh1(l) of the l-th sub-Voronoi cell is computed with equation (10)
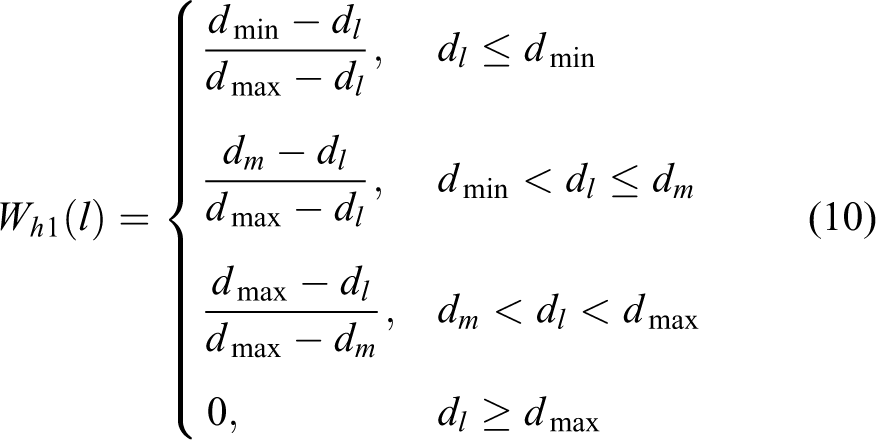
where dl denotes the distance between a mobile robot and its
target in l-th sub-Voronoi cell, dmin denotes
the distance between a mobile robot and its nearest Voronoi vertex, and
dmax denotes the distance between a mobile robot and its
farthest Voronoi vertex.
Target of a mobile robot in l-th sub-Voronoi cell is selected based on the midpoint between the gravity of l-th sub-Voronoi cell and the current position of a mobile robot.
Coverage hole area weight
The coverage hole area weight Wh2(l) of the l-th sub-Voronoi cell is computed with equation (11)
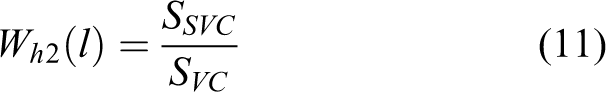
where SSVC represents the hole area of l-th sub-Voronoi cell and SVC represents the hole area of a Voronoi cell. SSVC and SVC are calculated based on the geometric relationship between the sub-Voronoi cell/Voronoi cell and its sensing disk.
Coverage hole weight
A coverage hole weight of l-th sub-Voronoi cell for one mobile robot is defined

Equation (12)
is composed of two terms. The first term represents the movement distance weight of
l-th sub-Voronoi cell and the second term represents the coverage hole
area weight of l-th sub-Voronoi cell. μ1,
μ2 are adjustable positive parameters and
In equation (10), if target of a mobile robot in l-th sub-Voronoi cell is selected based on the midpoint between the incenter of l-th sub-Voronoi cell and the current position of a mobile robot, the algorithm is defined as WSVHI algorithm.
The proposed mobile robots’ uniform deployment algorithms, WSVHG and WSVHI, not only consider the coverage hole area of each sub-Voronoi cell, but also consider the distance to its target in each sub-Voronoi cell. The coverage hole’s area of each sub-Voronoi cell is larger, the greater the chance of selected, and it can repair coverage holes perfectly and achieve the goal of mobile robots’ uniform deployment. The moving distance is larger, the smaller the chance of selected, and it can prevent the excessive moving energy consumption.
Nodes’ selection algorithm
The objective of nodes’ selection algorithm is to select one activated static node to detect an event and select k mobile robots to cover it. Analog game theoretic algorithm is proposed for nodes’ selection. We model our problem among candidate nodes as a selection weight defined based on the related parameters, enumerate all the selection weights, and finally select a node with the highest weight.
In the article, multiple static nodes may detect the same event, and only one needs to be activated to transmit event’s information and DOC.
All mobile robots which can communicate with the activated static node compose the candidate set. k mobile robots in the candidate set need to be selected to sense the event. Multiple events may occur at the same time, while one mobile robot only can detect one event.
Static node’s selection algorithm
Assuming that Nde static nodes detect an event

where
Enumerating all the ωs of Nde nodes, and one with the maximum weight is selected to be activated. If multiple nodes have equal maximum weight, the one with the greater remaining energy is to be selected. If multiple nodes have equal maximum weight and equal remaining energy, the one with the greater nm is to be selected. In case further tie, any one of them is selected randomly.
Mobile robots’ selection algorithm
Assuming that nmc mobile robots communicate with the
activated static node, their numbers are stored in set Sm.
k robots in Sm need to be selected to
detect
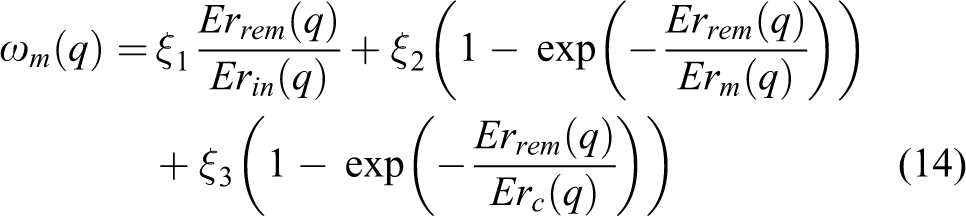
where
Enumerating all the ωm of nmc
robots, and selecting k larger as activated robots to detect
Target position which a robot moves to detect the event is computed with equation (15)
(
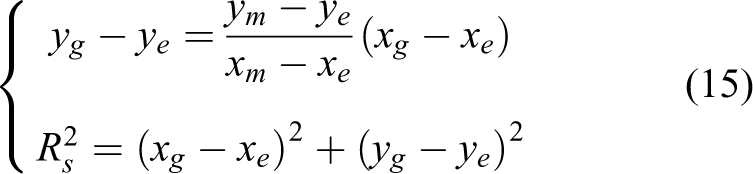
where
Data transmission
Data transmission in the process of static node’s selection and mobile robots’ selection is shown in Figure 2.

Data transmission process.
Nde static nodes which detect an event at the same time transmit information in accordance with the order of SS, the information includes the remaining energy of the static node, number of mobile robots which can communicate with the static node, position of the static node, and position of an event. Meanwhile, static nodes except the first one in SS (because it only needs to transmit information to other nodes) exist an energy consumption of reception. Last one in SS computes ωs, selects the activated static node, and notifies the activated one. Thus, the static node’s selection requires Nde data transmission.
nmc mobile robots which can communicate with the activated static node also transmit information in accordance with the order of Sm. First one in Sm receives information from the activated static node. Information transmitted between two mobile robots contains the position of an event, position of the activated static node, position of the mobile robot, and remaining energy of the mobile robot. Meanwhile, mobile robots except the first one in Sm exist an energy consumption of reception. Last one in Sm computes ωm, selects k activated mobile robots, and notifies them. Thus, activated mobile robots’ selection requires nmc + k data transmission.
The total number of data transmission in the selection of activated static node and in
the selection of activated mobile robots is
Simulations and discussions
Several simulations are carried out for illustrating the performance of the proposed
algorithm using Matlab R2011a. Experimental environment is 50 m × 50 m.
Nsta static nodes uniformly distribute in the environment for
1-coverage and the minimum Nsta is computed based on equation (3). Mobile
robots and events randomly deploy in the environment. In order to completely detect events,
we hope the candidate set Sm larger, so we assume that the
communication radius of a static node is equal to the communication radius of a mobile
robot, that is,
The list of parameters.

In the simulation, coverage efficiency reflects the degree of redundancy of networks. Coverage efficiency PCE is equal to the ratio between the sensing area in the network and the sum of all sensing disks (equation (16)).
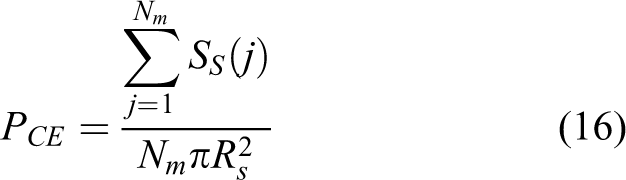
where SS(j) denotes the sensing area of the j-th node and Nm denotes the number of mobile robots randomly deployed in the region.
Coverage ratio reflects the DOC of networks. Coverage ratio PCR is equal to the ratio between the sensing area in the network and the area of region (equation (17))

where SA denotes the area of region
Algorithm validation
The simulation is used to validate the effectiveness of the proposed regional coverage and k-coverage of events algorithm.
In the simulation, 25 mobile robots with Rs = 5 m and Rc = 17 m randomly deploy in the environment; 126 static nodes with rs = 3 m uniformly distribute in the environment. The initial Voronoi diagram of mobile robots is shown in Figure 3(a), the average coverage ratio is 50.18%, and the average coverage efficiency is 63.89%. Voronoi diagram is built based on the number of mobile robots.

Mobile robots are uniform distribution: Each mobile robot is expressed by ‘*’ and each static node is expressed by ‘o’. (a) Initial Voronoi diagram of mobile robots. (b) Final Voronoi diagram with WSVHI. (c) Final Voronoi diagram with WSVHG. WSVHI: weighted-sub-Voronoi-half-incenter; WSVHG: weighted-sub-Voronoi-half-gravity.
In order to maximize the coverage region, WSVHG and WSVHI are used for holes detection and repair. The final Voronoi diagram of mobile robots with WSVHI is shown in Figure 3(b). The final coverage ratio increases to 71.90% and the final coverage efficiency increases to 91.55%. The final Voronoi diagram of mobile robots with WSVHG is shown in Figure 3(c). The final coverage ratio increases to 72.84% and the final coverage efficiency increases to 92.74%. From figures, it is to be noted that mobile robots deploy more evenly in the final Voronoi diagram than in the initial Voronoi diagram.
In order to validate the proposed nodes’ selection algorithm (a static node’s selection and k mobile robots’ selection), we assume that k is provided in advance. When k changes, validating that the proposed algorithm can successfully achieve k-coverage of events.
Two events occur in the region at the same time, and the initial configuration is shown in Figure 4(a). Event 1 (position is (2.6 m, 4.5 m)) is sensed by nearly three static nodes (the numbers are 1, 11, 12, and position are (2.6 m, 1.5 m), (0 m, 6 m), and (5.2 m, 6 m), respectively), but only one is activated to transmit information. Based on equation (13) to compute weight values of three nodes are 0.736, 0.736, and 0.76, respectively. So node 12 is activated to sense event. Event 2 is sensed by one static node and it is activated to transmit information.
Assuming k = 2. For event 1, five candidate robots can communicate with node 12. Based on equation (14), we can compute weight values of five candidate robots and two robots are selected to cover the event finally. Moreover, other two robots are selected with the same algorithm to cover event 2. Figure 4(b) shows event coverage’s trajectories of activated robots. Each robot moves till detecting the event.
Assuming k = 3, k = 4, and k = 5, event coverage’s trajectories of activated robots are shown in Figure 4(c), (d), and (e), respectively.

Algorithm validation: each static node is denoted by ‘o’, each mobile robot is denoted by ‘♦’, event 1 is denoted by ‘▴’, event 2 is denoted by ‘★’, ‘*’ denotes trajectories of each mobile robot, and each circle represents the sensing disk of each node. (a) Initial configuration. (b) Event coverage’s trajectories when k = 2. (c) Event coverage’s trajectories when k = 3. (d) Event coverage’s trajectories when k = 4. (e) Event coverage’s trajectories when k = 5.
But if based on OVSC (on-demand variable sensing k-coverage) 17 to select static node, any of them (nodes 1, 11, 12) can be selected randomly under the circumstances because they have the equal strongest signal and the same remaining energy. Assuming that node 1 is selected to be activated, there only have three robots within its communication radius. Selecting mobile robots for 4-coverage and 5-coverage of an event based on OVSC cannot be achieved (only have three robots within the communication radius of node 1). While the proposed algorithm can achieve it, because the selection of activated static node is related with the number of mobile robots which can communicate with each node. So, node 12 is activated to sense event 1 with the proposed algorithm. The proposed algorithm has better performance than OVSC. 17
It can be noted from several figures that WSVHG and WSVHI can extremely cover the region and analog game theoretic algorithm can successfully select the optimal static node to transmit information and k mobile robots to cover each event.
Regional coverage algorithm comparison
The simulation compares the proposed WSVHG and WSVHI algorithm, which are used for regional coverage with VOR and Maxmin-edge in the previous researches.
In the simulation, 10 mobile robots with Rs = 6 m and
Rc = 17 m are randomly deployed in the environment. The
algorithm is set to terminate when 15 rounds are carried out in each simulation. The
maximum coverage ratio is
It is to be noted that all results presented in this simulation are the average values obtained by performing 10 simulations with random initial locations for mobile robots. Figure 5 shows several results of the comparison. In each round, it is averaged with the coverage ratio/efficiency of 10 simulations, and the average value is average coverage ratio/efficiency.

The proposed algorithm comparison with existing algorithms. (a) Average coverage ratio comparison. (b) Average coverage efficiency comparison. (c) Average movement distance comparison.
Figure 5(a) and (b) shows the average coverage ratio and average coverage efficiency in each round with different algorithms. With the increment of round, the performance of mobile networks becomes better. Moreover, the average coverage ratio/efficiency with WSVHG and WSVHI is much higher than with VOR and Maxmin-edge. It is to be noted that WSVHG and WSVHI have better coverage performance.
Figure 5(c) shows the average movement distance for all mobile robots in each round with different algorithms. The smaller of the average movement distance, the less of the movement energy. From the figure, it is to be noted that the average movement distance with WSVHG and WSVHI is much smaller than with VOR, but larger than with Maxmin-edge. That is, movement energy with WSVHG and WSVHI is much smaller than with VOR. However, movement energy with WSVHG and WSVHI is larger than Maxmin-edge. How to detect the region with the maximum coverage and the minimum movement energy will be the future work.
Moreover, values of all kinds of performance are shown in Table 2, which intuitively and quantitatively describes the performance with different algorithms. WSVHG and WSVHI have higher coverage efficiency and coverage ratio than VOR and Maxmin-edge and have smaller movement distance than VOR.
Performance comparison with different algorithms.

WSVHG: weighted-sub-Voronoi-half-gravity; WSVHI: weighted-sub-Voronoi-half-incenter. Italic values used to highlight the advantages of the WSVHG and WSVHI.
With the above comparison, it can be observed that the proposed regional coverage algorithms with WSVHG and WSVHI have higher coverage ratio and coverage efficiency compared with other existing algorithms. Meanwhile, the proposed algorithms can maximize the coverage of mobile networks and maximize the utilization of each mobile robots.
Event coverage algorithm comparison
The simulation compares the proposed analog game theoretic algorithm with GTM proposed in Alam et al. 13 for multiple events coverage. Three events randomly deploy in the region as shown in Figure 6.

Initial configuration: each event is expressed by ‘★’, each static node is denoted by ‘o’, and each mobile robot is denoted by ‘♦’.
Different number of mobile robots
In the simulation, the number of mobile robots varies from 20 to 31, the sensing radius is Rs = 5 m, and the communication radius is Rc = 17 m. K = 2.
The total remaining energy and the total energy consumption of all mobile robots in each scenario are computed and results are shown in Figure 7.

Results with different number of mobile robots. (a) Total remaining energy of all mobile robots. (b) Total energy consumption of all mobile robots.
In Alam et al., 13 density around a mobile node’s current location has a great influence on the node’s selection, so it may select a node which has a higher density, but it has larger movement energy to cover events. Nevertheless, our proposed analog game theoretic algorithm for event coverage mainly depends on the movement energy, remaining energy, and communication energy simultaneously.
From Figure 7(a) and (b), it can be observed that the total remaining energy of all mobile robots in each scenario with the proposed algorithm is much more than the remaining energy with the algorithm in Alam et al., 13 and the total energy consumption of all mobile robots in each scenario with the proposed algorithm is much less than the energy consumption with the algorithm in Alam et al. 13
The proposed algorithm achieves k-coverage of each event with the minimizing energy consumption.
Different communication radii
In the simulation, communication radius of each mobile robot varies from 15 to 30 m. The number of mobile robots is 23 and its sensing radius is Rs = 5 m. The sensing radius of a static node is rs = 3 m.
Because the required DOC (k) is determined based on the number of mobile robots which can communicate with a static node, so k is varied with the change of the communication radius.
The total remaining energy and the total energy consumption of all mobile robots and k in each scenario are computed and results are shown in Figure 8. Figure 8(a) illustrates the total remaining energy of all mobile robots in the process of event coverage with different communication radii, Figure 8(b) illustrates the total energy consumption of all mobile robots with different radii, and Figure 8(c) shows the DOC with different communication radii.

Results with different communication radii. (a) Total remaining energy of all mobile robots. (b) Total energy consumption of all mobile robots. (c) DOC variation. DOC: degree of coverage.
From figures, it is to be noted that the increment of the communication radius will lead to the increment of k and the increment of energy consumption. We note that the total remaining energy of all mobile robots in each scenario with the proposed algorithm is much more than with the algorithm in Alam et al., 13 and the total energy consumption of all mobile robots with the proposed algorithm is much less than with the algorithm in Alam et al. 13
From the above comparisons, it can be observed that the proposed algorithm effectively achieves k-coverage planning of multiple events with the minimum energy consumption.
Conclusion
The article studies the k-coverage planning of multiple events using a wireless sensor network and mobile robots. Regional coverage and event detection are main subproblems. WSVHG and WSVHI are proposed for regional coverage with the maximum coverage ratio/efficiency and the minimum moving distance. Static nodes uniformly distribute in the region for 1-coverage. Multiple static nodes may detect an event, but only one is activated and used to notify candidate mobile robots. Candidate mobile robots are within the communication radius of the activated node. Analog game theoretic algorithm is used for the selection of k mobile robots which cover one event. One mobile robot only detects one event. Simulations compared with other existing algorithms show that the proposed algorithm can cover the region with the maximum coverage ratio/efficiency and achieve k-coverage of events with less energy consumption.
Footnotes
Declaration of conflicting interests
The author(s) declared no potential conflicts of interest with respect to the research, authorship, and/or publication of this article.
Funding
The author(s) disclosed receipt of the following financial support for the research, authorship, and/or publication of this article: This work was supported in part by the National High-Tech Research and Development Program 863, China (2015AA042307), National Natural Science Foundation, China (61601256), Shandong Provincial Scientific and Technological Development Foundation, China (2014GGX103038), Shandong Provincial Independent Innovation and Achievement Transformation Special Foundation, China (2015ZDXX0101E01), the Fundamental Research Funds of Shandong University, China (2015JC027), and the Fundamental Research Funds of Qilu University of Technology (0412048472).