
Abstract
Human daily activity recognition has been a hot spot in the field of computer vision for many decades. Despite best efforts, activity recognition in naturally uncontrolled settings remains a challenging problem. Recently, by being able to perceive depth and visual cues simultaneously, RGB-D cameras greatly boost the performance of activity recognition. However, due to some practical difficulties, the publicly available RGB-D data sets are not sufficiently large for benchmarking when considering the diversity of their activities, subjects, and background. This severely affects the applicability of complicated learning-based recognition approaches. To address the issue, this article provides a large-scale RGB-D activity data set by merging five public RGB-D data sets that differ from each other on many aspects such as length of actions, nationality of subjects, or camera angles. This data set comprises 4528 samples depicting 7 action categories (up to 46 subcategories) performed by 74 subjects. To verify the challengeness of the data set, three feature representation methods are evaluated, which are depth motion maps, spatiotemporal depth cuboid similarity feature, and curvature space scale. Results show that the merged large-scale data set is more realistic and challenging and therefore more suitable for benchmarking.
Keywords
Introduction
Human daily activity recognition via a low-cost vision system is essential for providing appropriate health care to elderly people, 1,2 or patients in early-stage Alzheimer’s disease. 3 Human daily activity analysis is also critical for developing intelligent surveillance systems. Recently, Kinect sensor has been widely used for the purpose due to its low cost and invariance to visible lights. The depth map acquired with Kinect could not only provide the three-dimensional (3D) structure of scenes but also the 3D motion of targets. Human daily activity recognition based on RGB-depth data has been an active research topic.
Activity representation is key to activity recognition. Various feature extraction methods have been proposed. Wang et al. 4 applied skeleton extraction on the silhouette contour of subjects to retain distinctive feature points. Chu et al. 5 proposed the block multibilateral two-dimensional linear discriminant analysis to extract features from contour of a moving object. Oreifej and Liu 6 proposed histogram of oriented 4D normals to describe depth sequences for activity recognition. It represents the depth sequence using a histogram that captures the distribution of the surface normal orientation in the 4D space.
The availability of RGB and depth channels makes it possible to apply multimodal data fusion 7 for improved performance. The benefits of multimodal fusion have been proved in many aspects. Liu et al. 8 developed a structured kernel sparse coding model, 9,10 to integrate multiple sets of sonar measurements to improve room-level object localization. Then, Liu et al. fused both visual and tactile inputs for object recognition. 11 Zheng et al. 12 presented a wearable system that fused the measurements of 11 different sensors for locomotion mode recognition. Dobrisek et al. 13 fused the information of audio and video for emotion recognition. As for the problem of activity recognition, multimodal fusion is also popular. 14 –18 However, when fusing the RGB and depth channels across different data sets, the channel format must be unified, which is one of the motivations of this work.
With the popularity of learning-based technology, algorithm performance has increasingly depended on the scalability of data set to a large extent. However, RGB-D-based daily activity recognition has not really utilized big data, largely due to the fact that data sets that contain massive activities rarely exist. Collecting a massive data set with lots of variations will involve both many subjects and long processing time. Most of the existing RGB-D-based activity recognition frameworks 18 –20 are benchmarked on relatively small data sets, which are limited in the number of action categories, the diversity of background scenes, the number of participants, or the variations in each action. The most commonly used such data sets include the RGBD-HuDaAct data set, 21 –25 SDUFall data set, 26 and UCLA Multiview Action 3D data set. 27 –30 Due to the limited scalability of these data sets, they can be hardly used to justify large-scale learning approaches such as deep learning.
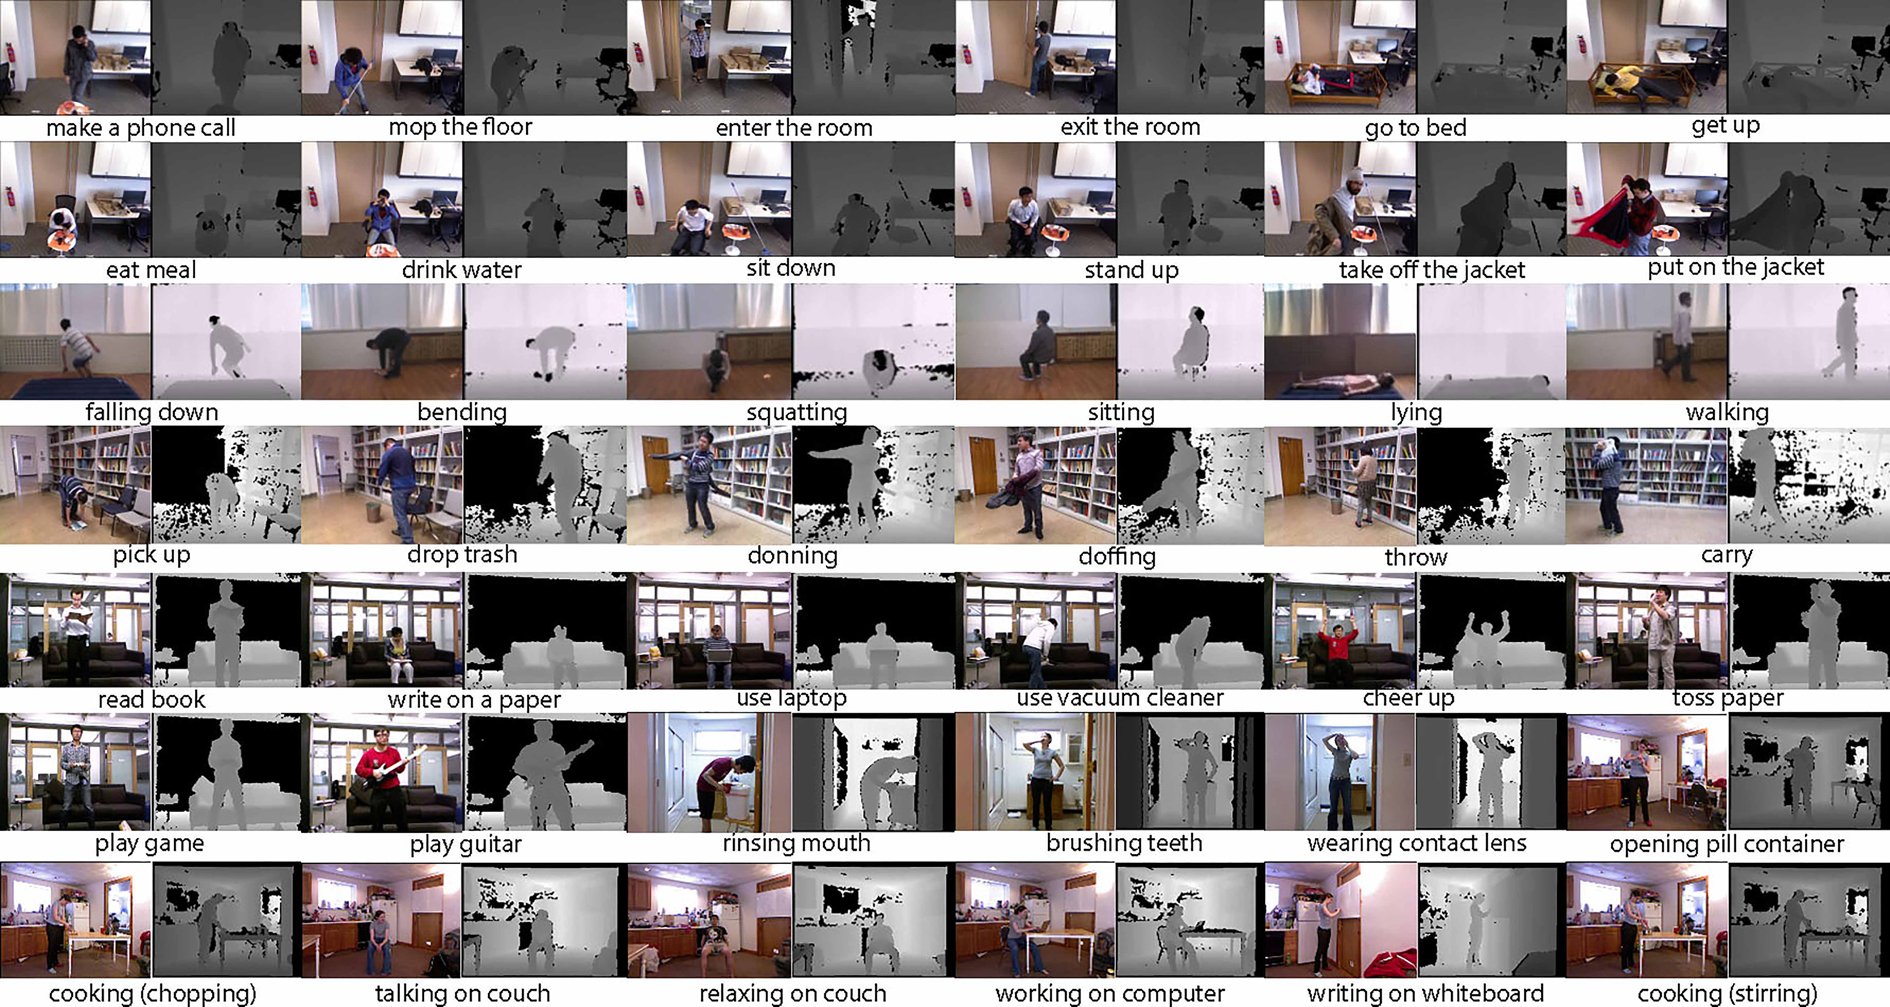
To stimulate the usage of deep learning on RGB-D-based activity analysis, this article provides a large-scale RGB-D activity data set by integrating data from several publicly available data sets. A glance of these data sets is shown in Figure 1. The purpose of this data set is providing a public data testbed applied for the research of complicated learning-based activity recognition approaches. Especially, as the integrated data set covers various activities recorded in both the color and the depth channels, many feature extraction algorithms could be evaluated and benchmarked.
In the integrated data set, we propose activity-layered definition and categorize all activities in a two-layer hierarchy named basic activity and subactivity. The data set comprises 4528 video clips totally depicting 7 basic activities (up to 46 subactivities) performed by 74 subjects. Moreover, the data set covers other variations such as interacting/not interacting with contexts, different backgrounds, and light turning on/off. In the data set, although videos are acquired with different versions of Kinect Sensors, depth and RGB color images are well aligned, greatly facilitating the studies of various state-of-the-art approaches that use both RGB and depth maps. As a benchmark case, we evaluated three activity analysis approaches that have been previously assessed on the existing public data sets. We found that these approaches show lower accuracies on our integrated data set. This well proves the challenges of our data set. Note that for fair comparisons, the analysis approaches are applied on depth map only.
The rest of the article is organized as follows. In the second section, publicly existing RGB-D data sets are first introduced. The third section gives an overview of the integrated data set and describes details how we built the data set. Benchmarking results of the three feature extraction approaches are shown in the fourth section. The final section provides conclusions.
Existing RGB-D daily activity data sets
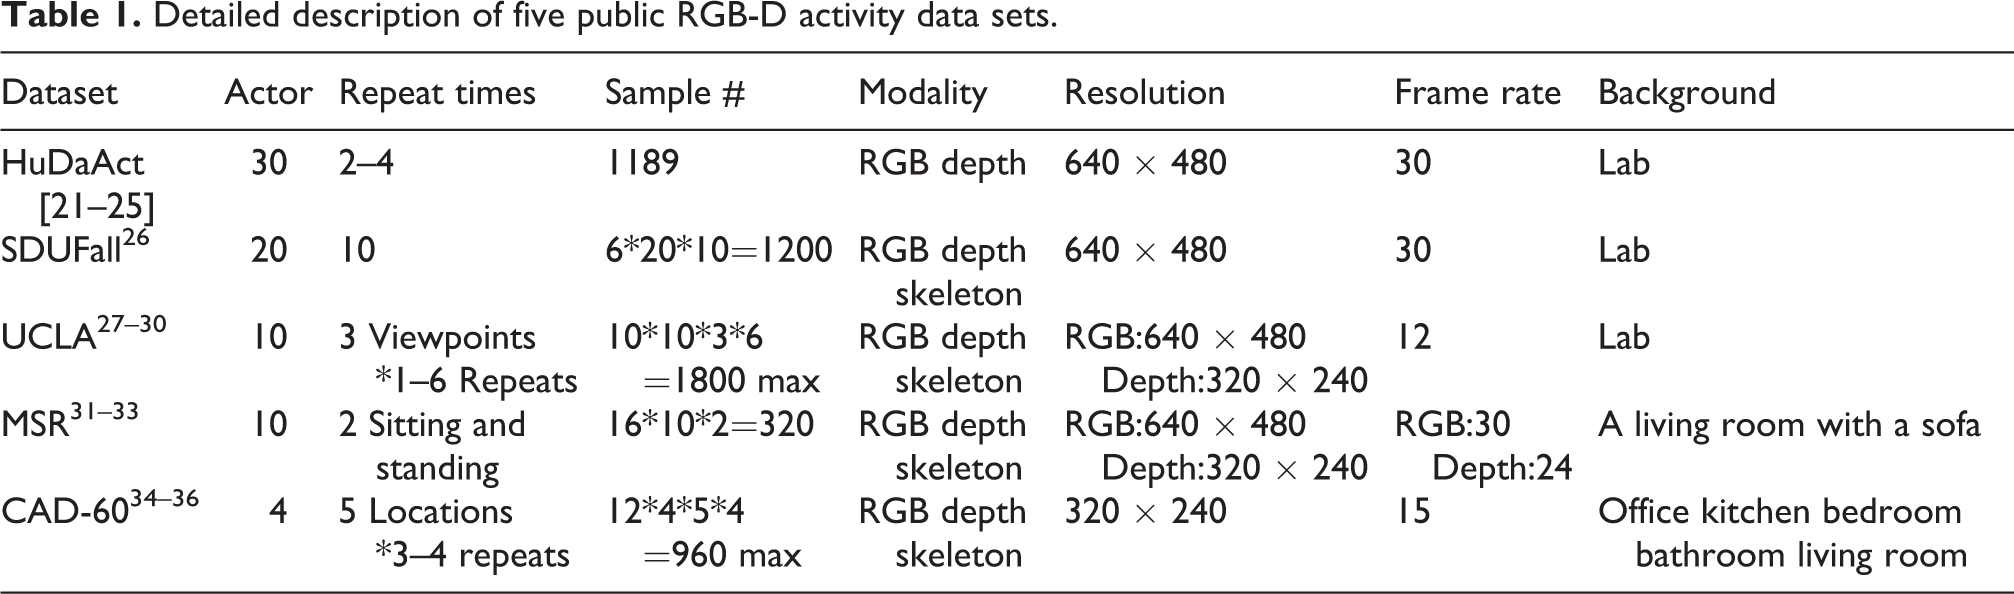
There exist several publicly available RGB-D data sets that have been widely used for human daily activity recognition. Table 1 summarizes the details of these data sets, while Figure 2 lists the activity categories defined in each data set. Here are more details.
Detailed description of five public RGB-D activity data sets.

Activity categories of the merged five public RGB-D data sets. Each data set has different types of daily activities. It brings difficulties to data set integration but guarantees that the integrated data set will cover rich daily activities.
RGBD-HuDaAct data set
This data set was originally released in Ni et al. 21 It has a larger scale of samples and contains synchronized color-depth video streams. In addition, there are rich intraclass variations in the data set, such as standing still, sitting, or exchanging use of left and right hand. Hence, this data set can be employed for the task of daily activity recognition. However, the data set does not provide the corresponding skeleton information, which is freely available from Kinect. Moreover, since the background is limited to a single lab environment with a fixed camera, the data set cannot be used for robustness test.
SDUFall data set
It was released specifically for fall detection benchmarking using Microsoft Kinect sensor. 26 This data set provides color, depth as well as corresponding skeleton channels. Rich intraclass changes are included such as carrying or not carrying large objects, turning the light on or off, and changing direction and position relative to the camera. Moreover, the data set provides background-only frames so as to facilitate extracting subjects from background. However, all the actions are captured against a single background and the number of action categories is limited to be six.
Northwestern-UCLA Multiview Action 3D data set
Compared to the previous two data sets, this data set is the first that provides multiple views recorded with three cameras at different angles. It has been widely used for cross-view action recognition. 27 –30 Nevertheless, this data set was collected against a single environment, and the number of participants and activity samples is relatively small.
MSR Daily Activity 3D data set
This data set contains 16 daily activities. 31 –33 Specifically, two of the activities (sitting and standing) involve interactions between subjects and environmental settings such as sofa. However, in the data set, the RGB and depth channel are recorded separately and therefore not strictly synchronized. Besides, the videos are also captured with a single fixed-angle camera.
CAD-60 (Cornell activity data set)
It provides RGB-D images and skeleton data (coordinates of joint positions and orientations) captured in five different natural scenes. 34 –36 The data set contains 12 categories of daily activities performed by 4 subjects, but the number of samples in each category is moderately imbalanced.
MV-TJU data set
This is another multiview activity data set that consists of 22 categories collected under 2 lighting conditions (light and dark). 37 But the background is clean without any objects involved.
Berkeley multimodal human action data set
This data set has temporally synchronized and geometrically calibrated data captured by five different systems, which are Mocap System, Camera System, Kinect System, Accelerometers, and Audio System. 38 It consists of 11 low-level activities and can provide various data modalities.
Among all these existing data sets, we decided to fuse the following five typical data sets: RGBD-HuDaAct, SDUFall, Northwestern-UCLA Multiview Action 3D dataset, MSR Daily Activity 3D dataset, and CAD-60. The reasons are as follows. First, these five data sets are most widely used in human daily activity recognition. Second, these data sets are complementary to each other. There are more human daily activities in the RGBD-HuDaAct data set and MSR Daily Activity 3D data set, and activities in these two data sets do not overlap with each other. The SDUFall data set contains falling and squatting activities that are not provided in the other data sets. The UCLA data set uniquely provides multiple views for human activity recognition. CAD-60 provides very different human daily activities, and it is the only one that repeats each activity against five different indoor scenes.
Merging the public data sets
We integrated the five RGB-D data sets introduced in Figure 2 to form a comprehensive RGB-D data set. However, the practical integration is not direct. Each data set has different activity categories, and even for the same activity, individuals may act in different ways. Moreover, the same activity may have different interpretations due to the interactions with different objects and scene contexts. Moreover, occlusions, cluttered backgrounds, varying illumination conditions, and different camera viewpoints also make the integration challenging. Furthermore, it is hard to define a unified data format to store all the data samples from all the five data sets. In the following subsections, we describe details how to overcome these practical challenges.
Activity hierarchy
The other four data sets are manually downloaded except for the SDUFall data set which is built by ourselves. The first step to integrate these sub-data sets is to define an activity hierarchy, which should cover all the activity types in all the sub-data sets. The activity hierarchy of each individual sub-data set is illustrated in Figure 2. Clearly, the data sets have very different activity types. Therefore, it is urgent to define unified activity categories.
When considering daily activities of a single individual, they usually could be summarized into several basic human activity categories such as walk, sit, or stand, regardless of his or her interactions with context. Based on the intuition, a layer-wise activity definition is proposed to build the integrated RGB-D activity data set. We define a two-layer activity hierarchy to describe all activity categories. First, insights into all sub-data sets indicate that basic activities such as sit, stand, walk, bend, and lie down are universal to all the sub-data sets. Therefore, we include them in the first layer of our activity hierarchy. Meanwhile, we found that some activities are a transition from one activity to another, for example, changing from sitting to standing and vice versa. To cover these activities, we also define two transitional basic activities—sit down and stand up. In total, we have seven basic activities as the first layer of the activity hierarchy, which are bend, sit, stand, sit down, stand up, walk, and lie down. In practice, the seven basic activities are named as a01, a02,…, a07, in the order as mentioned earlier. Second, we split each basic activity into some subactivities as the second layer. These sub-activities are defined to specify the more subtle variations such as with/without interactions with contexts. Table 2 summarizes the details of these subactivities.
Seven basic activity categories and their corresponding subactivities.

Notes: Each basic activity contains a different number of sub-activities. The large differences of the sub-activities within each basic activity bring the major challenges in classifying these activities.
Such an activity hierarchy has two aspects. First, it efficiently classifies all the activities in the large-scale data set. Such a structure facilitates the data management and allows easy integration of other data set. Second, the basic activities cover almost all of our daily activities, while the subactivities capture the more subtle variations in each basic activity category.
Practical data integration
To integrate the subdata sets, a protocol is needed to unify the data type and storage format. With a simple scanning to the subdata sets, we find that most data sets store their data on a per-subject basis, and this way will not cause bias to activity classification. Therefore, we build the integrated data set on the same per-subject basis. Moreover, to facilitate data I/O, we convert all data samples from the subdata sets to the same form of image sequences. As for the skeleton channel, we use their original .txt format.
RGBD-HuDaAct
The video data of 30 subjects are stored in 30 separated folders. The data format of all activity samples is ONI, which shows that the original information is recorded by OpenNI. As a consequence, we need to read the data saved in ONI format and then convert the readings (color and depth videos) into corresponding image sequences through OpenNI. For the videos that are too long, we choose one frame from every 10∼20 frames to conduct feature extraction.
SDUFall
The data of this data set are from 20 actors. Activities recorded in color and depth videos are transformed into image sequences, respectively. For the data set, we discard the skeleton information due to the uncertainty and inaccuracy of Kinect tracking.
UCLA Multiview Action 3D dataset
This is a three-view data set, but for integration, we ignore the multiview facts and treat the samples from three different cameras as three independent samples with the same activity label. Each sample contains three channels—RGB color, depth, and skeleton. In practice, we convert the RGB video of each sample to an image sequence. Depth channel in its PNG image format is kept as it is, but the range of depth values is unified to 0-255. The corresponding skeleton channel is also kept as it is. All the data samples are restructured and renamed in the following format #subject_#activity type_#repetition.
MSR Daily Activity 3D data set
Data samples in the data set are stored on a per-subject basis. Each activity sample contains three channels—depth, RGB color, and skeleton. The depth channel was stored in BIN format. For integration, we converted it into image sequences using self-developed C/C++ codes. The RGB color channel was originally AVI videos. We also converted them into image sequences using the same frame rate as for depth conversion. The corresponding skeleton channel is kept in its original .txt format.
CAD-60
The data set was collected from four subjects. All activities of the same subject are separately stored in a folder named by the subject index. Each data sample contains both a color image sequence in PNG and the corresponding depth image sequence in PNG. The same activity was repeated several times by the same subject. In practice, we manually split each sample into a few segments, each of which covers a complete activity period. The same activity label is assigned to each of the segments. Since the data set contains skeleton data, we also manually segment them in accordance with their corresponding RGB-D sequences. Moreover, we change the range of depth pixel values to be 0.255.
Data set summary
After integrating the five data sets, our large-scale RGB-D datanset is comprised of 4528 samples performed by 74 actors against several different complex scenes. The background scenes include both experimental laboratories and ordinary natural scenes such as bathroom and bedroom. All actions are categorized into seven basic activities as presented in Table 2. Each basic activity contains several subactivities that have subtle differences. Note that not all the five subdata sets contain all the seven basic activities. Each data sample is recorded in two forms, that is, a color image sequence and its corresponding depth sequence. For some video samples, the skeleton information (coordinates of joint positions and orientations) is also included as provided in the original subdata sets. This large-scale RGB-D data set can be downloaded from the link: http://www.sucro.org/homepage/wanghaibo/SDUFall++.html.
There are 74 folders in total, indexed by the numbers from 001 to 074. Each represents one subject. The order of these 74 folders is in accordance with the processing order of the 5 subdata sets. Each activity category may be repeated many times. Thus, under each subject folder, there are subfolders whose names are in the form of “#(the basic activity index)_#(the sub-activity index)_#(the repeating index).” The repeating index starts from e01.
Data set superiority
The superiority of our data set is mainly in three aspects. (1) Our data set is a comprehensive and standardized data platform which combines the characteristics of five subdata sets. It is large scale; therefore, we can utilize the data set for benchmarking. (2) The data set contains a variety of daily activities performed by 74 people. It provides sufficiently abundant information for researchers to do benchmarking. (3) Generally speaking, this data set is large enough to evaluate complicated learning-based approaches for daily activity recognition.
Experimental results
In this section, three feature extraction methods are tested on the large-scale data set. In the following, we first briefly overview the three methods, then describe the experimental settings, and finally show important findings.
Method introduction
Depth motion maps feature
Depth motion maps (DMMs) feature was presented in Chen et al. 20 The authors project each depth frame in a depth video sequence onto three orthogonal Cartesian planes (f, s, t), where f represents the X − Y plane, s represents the Y − Z plane, and t represents the X − Z plane. Under each projection view, the absolute difference between two consecutive projected maps is accumulated across an entire depth video sequence forming a DMM, shown in Equation 1

where i represents the frame index;
Spatio-temporal depth cuboid similarity feature
The spatiotemporal depth cuboid similarity feature (DCSF) was presented in Xia and Aggarwal 39 to describe the local 3D depth cuboids around the spatiotemporal interest points (STIPs) extracted from depth videos. The whole algorithm contains two parts. First of all, the authors extract STIPs from depth videos using a filtering method and then apply noise suppression on these STIPs to remove ones resulting from noise. Second, they extract 3D cuboids which contain the spatiotemporally windowed pixel values around STIPs with an adaptable supporting size. DCSF is based on the self-similarity to encode the spatiotemporal shape of a 3D cuboid. They divide a cuboid into a series of voxels (nx × ny × nt ) and define a block as containing a certain number of voxels. After computing a histogram of the depth pixels contained in each block as well as doing normalization, they use the Bhattacharyya distance to define the similarity shown in Equation 2, which describes the depth relationship of the two blocks. The final feature vector is generated by concatenating similarity scores for all combinations of blocks

Note that p and q are block labels.
Curvature space scale feature
Curvature space scale (CSS) feature was presented in Ma et al., 26 which is extracted from human contour and behaves well in human activity recognition. It is based on the curvature space scale which describes the changeless feature of a curve in a plane under different space levels. 40,41 If we do the convolution between human contour curve and one-dimensional Gauss distribution function G(μ,σ), the human contour curve will shrink to be a convex curve, with increasing σ by a small step Δσ. We can get the curvature of human contour curve after convolution as shown below


μ and σ in Equation 3 represent the arc length and the transform scale separately. We are interested in the points where curvature sign changes under convolution scale σ and the points where K(μ,σ) = 0 are called as ZP points. The ZP points are written as ZP+ where convolution changes from minus to plus and as ZP− in contrary. Obviously, ZP+ and ZP− are in pairs in a closed curve. The coordinates (μ,σ) of all ZPs of human contour curve under different scales form a set of continuous curves named CSS image 26 which has the horizontal coordinate axis μ and the vertical coordinate axis σ. We get the maxima point of each curve on a CSS image and concatenate them as our feature vector. This feature can reflect the depth and position information of a depressed or raised contour curve.
Experimental design and settings
An illustration of our experimental evaluation framework is given in Figure 3. CSS feature extraction was implemented in C++, while DMMs and DCSF were implemented in MATLAB. For DMMs and DCSF, in order to extract feature more conveniently in MATLAB, each video sequence in the large-scale RGB-D data set is first transformed into the corresponding MAT file.

Experimental evaluation framework of three feature extraction methods.
Feature extraction
The background frames from SDUFall in the large-scale data set are removed for DMMs extraction. DMMs feature only utilizes the depth information in the experiment. We use the method in Chen et al. 20 to get the three fixed sizes of DMM v , which are 183 × 242 (DMM f ), 183 × 103 (DMM s ), and 103 × 242 (DMM t ).
For DCSF extraction, the number of STIPs is set to 500 and the noise threshold is set to 4 in the section of noise suppression. A larger value will remove more noise, but it may cause a serious degradation of STIPs. The number of voxels for each cuboid is set to be nxy = 4, nt = 2, and the other parameter settings are set the same as in Xia and Aggarwal. 39
In order to extract the CSS features, only the depth data were used. Before extracting CSS, we use the background subtraction technique to extract human foreground in SDUFall directly because this data set provides background images. However, there are no background frames in the rest four data sets, so we use the image-processing software such as PhotoShop (PS) to eliminate the human foreground and take the processed image as background frame. After getting the human foreground images, image preprocessing is applied to extract human silhouettes, as shown in Figure 4.

Image preprocessing steps: (a) original depth image (from the UCLA dataset); (b) background map manually obtained with PhotoShop (c) binary image of human foreground after eliminating the background map; and (d) the normalized human contour curve.
Division of training set and testing set
Feature vectors are first L2-normalized for DCSFs. Then duplicated and zero rows in the feature matrix of each activity are removed. Since not all the subdata sets contain all the seven basic activities, 3/5 of subjects in each subdata set are selected randomly and then their features are putted together as the training set. The rest is left as the testing set.
Bag of Words model
Since DMMs generate fixed-length feature vectors for different length video clips, the generated features can be fed into the classifier directly. But for DCSF and CSS, feature dimensions of different length samples are different, so we use the Bag of Words (BoW) model 42 to generate a fixed-length representation of all video samples. In the BoW model, the codebook is generated by performing k-means algorithm on the training feature vectors. Vectors in the codebook named codewords are defined as the centers of the clusters. By mapping DCSF or CSS feature of an activity sample to the codebook, we get a histogram of the counts of the codewords, which is the BoW feature representation for each video sample. The value of K is very important when applying the k-means algorithm.
Activity classification
An l2-regularized collaborative representation classifier with a distance-weighted Tikhonov matrix proposed in Chen et al. 20 was utilized for activity recognition with the three feature representation methods. This classifier is based on sparse coding, representing a test sample using atoms sparsely picked out from a dictionary formed by all the training samples. The residual is calculated between a test sample and its sparse representation by atoms belonging to the same activity in the dictionary. After getting residuals of all activity categories, the label is the activity which has a minus residual. Such a classifier has lower computational complexity and can generate state-of-the-art results.
Results and analysis
Parameter K in BoW
The number of K-means clusters is critical to the BoW model. Here, we chose to evaluate the influence of K on the recognition accuracies of the DCSF and CSS approaches. Results are shown in Figures 5 and 6, respectively. Varying the number of K leads to similar accuracy changes for both DCSF and CSS. However, the peak accuracies of DCSF and CSS are different although they almost have the same optimal values of K. For DCSF, the peak classification accuracy is 69.54% with K = 250, while for CSS the peak accuracy is 59.07%.
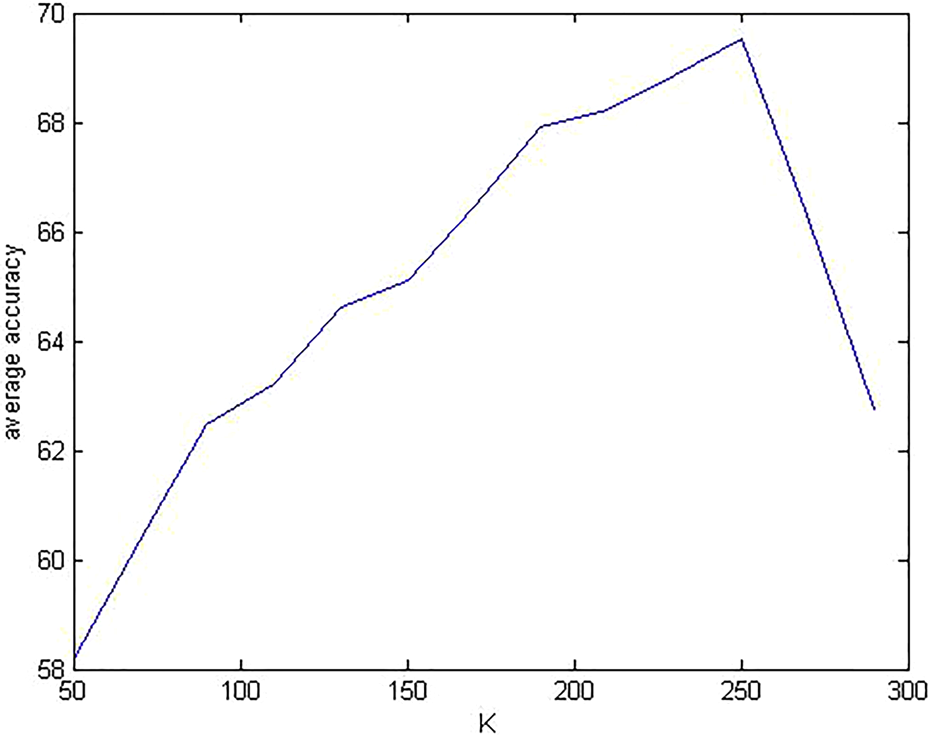
The choice of K in BoW for DCSF. BoW: Bag of Words; DCSF: depth cuboid similarity feature.
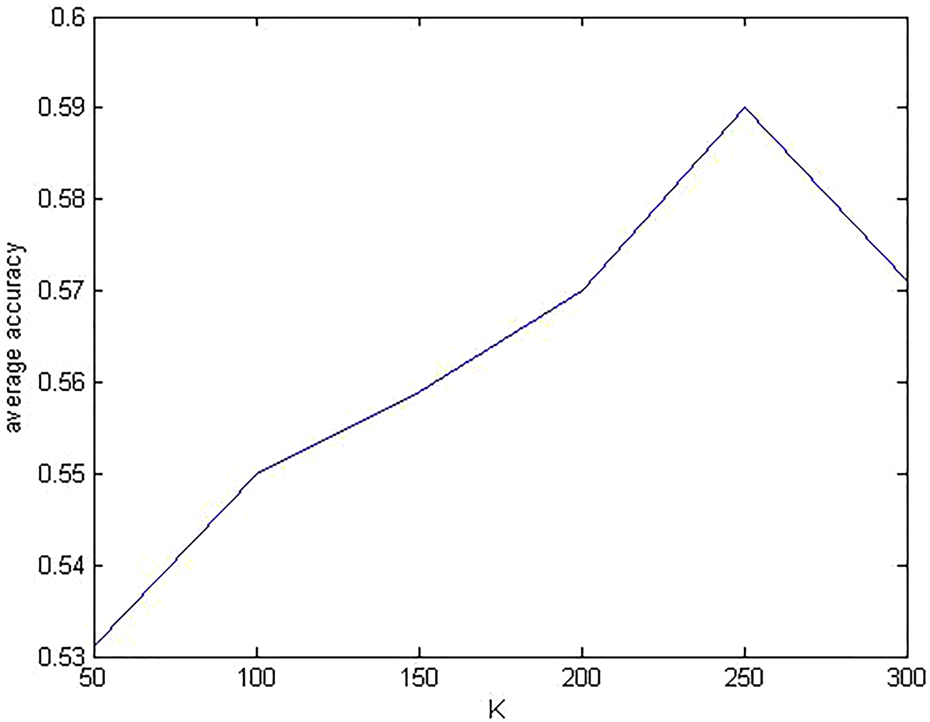
The choice of K in BoW for CSS. BoW: Bag of Words; CSS: curvature space scale feature.
Performance of the large-scale RGB-D activity data set
Since the large-scale RGB-D activity data set is obtained by merging the five subdata sets according to a certain order, we apply the three features on the five subdata sets at first. And then these three features are applied on the integrated large-scale RGB-D activity data set. The purpose is to compare the recognition accuracies on the five subdata sets with that on the large-scale RGB-D activity data set. Recognition accuracies are shown in Table 3. For DCSF and CSS, we use their optimal K values in building the BoW model. For each subdata set, samples of 3/5 randomly picked subjects are used as the training set. The rest is used as the testing set. Division of training set and testing set on the large-scale data set has been described in section Experiment. The same classifier is applied throughout the experiments.
Recognition accuracies of the evaluated handcrafted features on the large-scale RGB-D activity data set and the five individual subdata sets.

DMMs: depth motion map; DCSF: depth cuboid similarity feature; CSS: curvature space scale feature.
From Table 3, we can see that for each feature, recognition accuracy on the large-scale RGB-D activity data set is apparently lower than the ones reported on the subsets. This justifies that handcrafted features have limitations in handling more variations. Also, we notice that the three handcrafted features perform very differently on different subsets. This tells us that although these handcrafted features are robust to certain types of variations, they may not be robust to the other types of variations. Among the three features, CSS has the lowest classification accuracy of 59.07% on the large-scale RGB-D data set, while DCSF has the highest 69.54% accuracy. However, apparently 69.54% is far from sufficient for practical applications. Because the large-scale RGB-D activity data set contains more samples and activity classes under several different indoor scenes, so it is much more complicated and puts forward higher requirements to algorithms. Therefore, more complicated features should be developed. Abovementioned experimental results show the availability and reliability of the large-scale RGB-D activity data set. And they have also proved that this data set is practical and challenging for human daily activity recognition.
Classification results of DMMs, DCSF, and CSS
Figure 7 shows the confusion matrixes of the three handcrafted features on the large-scale RGB-D data set. We can find that sitting down and standing up are not well recognized by all of the three features. Sitting down is likely to be misrecognized as bend as they have similar motion orders. For standing up, DMMs feature has the lowest recognition rate of 29%, which is apparently lower when compared to the rates of DCSF and CSS. Particularly, with DMMs, the rate of misclassifying standing up as stand goes up to 20%. This is probably because the transition from sitting to standing is too short that most of the time standing up consists of standing.

Classification results of three methods on the large-scale RGB-D activity dataset: (a) DMMs; (b) DCSF; and (c) CSS. DMMs: depth motion map; DCSF: depth cuboid similarity feature; CSS: curvature space scale feature.
Average recognition rates of DMMs, DCSF, and CSS are 66.08%, 69.54%, and 59.07% shown in Table 3. Figure 8 illustrates the recognition accuracies of three features with respect to each activity category. Among the seven activities, sit, stand, walk, and lie down are more likely to be correctly recognized. Bend and stand up have lower recognition accuracies. We also notice that CSS has the worst overall performance compared to the other two feature extraction approaches. For DMMs, feature vectors are generated by calculating the sum of absolute difference between two consecutive projected maps across an entire depth video sequence. Therefore, DMMs fully ignore the temporal information of activities, which is critical to certain activity discrimination. On the other hand, DCSF depends on STIPs for key point detection. Too few or too many STIPs may negatively affect the performance of DCSF. Figure 7(c) shows that the recognition rate of sit is also low in addition to sitting down and standing up when applying CSS feature on the large-scale data set. CSS feature based on human silhouettes is invariant to rotation, translation, and scaling, but it needs accurate silhouette segmentation which is difficult to achieve for some activities even by the state-of-the-art background subtraction methods.

Recognition accuracies with respect to the seven activity categories.
Based on the abovementioned experimental results and analysis, the large-scale RGB-D activity data set is valuable for human daily activity recognition under multiple indoor scenes. From the recognition results shown in Table 3, three features applied on the large-scale data set all do not get very high accuracies, which show that this data set can be used as a challenging benchmark to stimulate the research of algorithms for activity recognition. Note that all of the three features in this article only use the depth information considering that the depth images are less sensitive to the influences of the external environment and can also provide information about 3D structure of the scene as well as the 3D motion of humans. However, ignoring features on RGB images may miss other important information on appearance and texture. Combining depth with RGB color will definitely boost recognition accuracies. How to efficiently fuse the four channels will be one of our next steps.
Conclusion
In this article, we integrate five public RGB-D data sets to build a large-scale RGB-D activity data set for human daily activity recognition on the big data. Our data set contains up to 4528 activity samples from 74 subjects, against several complex natural environments. A two-layer activity hierarchy is proposed to the large-scale data set, and all activity samples are categorized into seven basic daily activities, each of which is further split into a different number of subactivities. As a baseline benchmark, we evaluated three hand-crafted feature extraction approaches on the integrated data set. The recognition accuracies of these approaches are apparently lower than the ones reported on publicly available existing data sets, which justify the challenges of the integrated data set. We believe that the dataset is of great significance to the research of human daily activity recognition using RGB-D images. Given the scales and variations in the data set, researchers can apply large-scale learning-based technologies like deep learning to the problem.
Although many efforts have been taken for human daily activity recognition, we still face many challenges. In our future research, we will focus on the following three aspects: (1) The evaluated three feature representations only use the depth information but ignore the RGB channels. We will adapt these approaches to RGB-D channels. (2) We will test convolution neural network (CNN) on the integrated RGB-D activity data set. The focus will be on justifying the robustness of CNN to the challenging variations in the integrated data set. (3) In the article, the recognition is conducted only with respect to the seven basic activities but not to the subactivity layer. Classification of the subactivities will be our next step.
Footnotes
Declaration of conflicting interests
The author(s) declared no potential conflicts of interest with respect to the research, authorship, and/or publication of this article.
Funding
The author(s) disclosed receipt of the following financial support for the research, authorship, and/or publication of this article: This work was supported in part by the National Hightech Research and Development Program 863, China (2015AA042307), Shandong Provincial Scientific and Technological Development Foundation, China (2014GGX103038), Shandong Provincial Independent Innovation & Achievement Transformation Special Foundation, China (2015ZDXX0101E01), and the Fundamental Research Funds of Shandong University, China (2015JC027).