
Abstract
This article focuses on the implementation details of a portable interactive device called Image-projective Desktop Varnamala Trainer. The device uses a projector to produce a virtual display on a flat surface. For enabling interaction, the information about a user’s hand movement is obtained from a single two-dimensional scanning laser range finder in contrast with a camera sensor used in many earlier applications. A generalized calibration process to obtain exact transformation from projected screen coordinate system to sensor coordinate system is proposed in this article and implemented for enabling interaction. This permits production of large interactive displays with minimal cost. Additionally, it makes the entire system portable, that is, display can be produced on any planar surface like floor, tabletop, and so on. The calibration and its performance have been evaluated by varying screen sizes and the number of points used for calibration. The device was successfully calibrated for different screens. A novel learning-based methodology for predicting a user’s behaviour was then realized to improve the system’s performance. This has been experimentally evaluated, and the overall accuracy of prediction was about 96%. An application was then designed for this set-up to improve the learning of alphabets by the children through an interactive audiovisual feedback system. It uses a game-based methodology to help students learn in a fun way. Currently, it has bilingual (Hindi and English) user interface to enable learning of alphabets and elementary mathematics. A user survey was conducted after demonstrating it to school children. The survey results are very encouraging. Additionally, a study to ascertain the improvement in the learning outcome of the children was done. The results clearly indicate an improvement in the learning outcome of the children who used the device over those who did not.
Introduction
In recent years, development of touch screen is getting high attention. Samsung’s display tables known as SUR40, 1 Microsoft’s PixelSense 2 and Surface Table 3 are results of this interest. These devices detect fingers, hands and objects placed on the screen using a camera. Though many of the new interactive display systems deliver a high quality of graphics with good interactive experience, 4 they are expensive and not easy to be transported. These are important requirements for being used in fields like education in developing and underdeveloped countries. 5
On the other hand, research was going on in order to design a projective screen as an interactive screen. The first instance of desktop projection system was in the study by Wellner, 6 where a projector and a camera were used. By using suitable sensors, it was possible to provide interaction on a much larger screen. These days, effort is constantly being made in a way such that interaction is possible at a personal level. Handheld projectors 7 are compact, portable and use laser or light-emitting diode (LED) as light source. SixthSense 8,9 was developed using this technology. It is a wearable gestural interface that augments the physical world with digital information and enables the use of natural hand gestures to interact. Such devices use camera-based gesture recognition by finger-tracking through coloured marker worn on the finger. 10 In the category of projective display, though head-mounted device was first developed long ago by Sutherland, 11 a lot of interest has been generated recently owing to the release of Google Glass. 12 All these devices require a user to wear a device or some kind of tracker. This will impede the natural movement of the human body to some extent, and especially it is not suitable for small children.
We have designed an interactive device using a two-dimensional (2D) scanning laser range finder instead of a camera. As a result, the system is portable and do not require the users to wear any markers. Similar system was used earlier as step-on-interface in which the projected screen was used as bidirectional interface.
13,14
Through this, information was presented from a mobile robot to the user, and the user instructions were delivered to the robot. A similar device named Image-projective Desktop Arm Trainer (IDAT)
15
–17
was designed for upper limb rehabilitation. Image-projective Desktop Varnamala Trainer (IDVT; Varnamala is a Hindi word for alphabets) is the next generation of IDAT. However, there are many differences that make IDVT distinct from IDAT. To lower the total cost, a less expensive sensor has been used. To compensate for lesser accuracy, a new calibration methodology was introduced to improve the positioning accuracy of the visual feedback system (see ‘Calibration’ section for details). This also makes the system adaptable to different kinds of display systems. Earlier studies revealed that there are significant variations in the way people use a touch screen of a mobile device.
18
The same is more pronounced while using an interactive device like IDVT or IDAT. For the prediction of user’s behaviour, a learning-based method has been proposed (see ‘Learning-based prediction’ section for details). Finally, the target group in both cases are different. The IDAT device, though it was meant for arm trainer, was found to captivate the children because of the gaming part. This was observed while it was demonstrated in many exhibitions like IREX 2013
19
and H.C.R. 2014.
20
Therefore, we have adapted the system for educational purpose of children. In short, the IDVT is different from IDAT in the following ways: IDVT is used for educational purpose and as an application of interactive screen. For this, a game-based teaching software was developed. IDVT uses a less accurate sensor (2D scanning laser range finder) with accuracy of ±30 mm as against ±10 mm used earlier. New calibration and learning-based algorithm to accommodate measurement inaccuracies. Generalized calibration algorithm which may be used for conversion of ordinary screens to touch-sensitive screens.
Game-based learning has been found to be suitable for learning alphabets and basic arithmetic operations. 21 –23 A brute majority of the implementations of games for learning are targeted at higher and secondary school education. 24,25 They are not suitable for younger students in primary schools. 26 Additionally, many of these are based on desktop environments and do not involve interaction beyond the standard keyboard and mouse. Also there has been no earlier attempt to create such content specifically in Indian languages. It can be noted that there are approximately 310 million native speakers of Hindi language around the world which accounts for 4.7% of the total world population (fourth largest spoken language). 27 Nobel peace prize for the year 2014 being awarded to two individuals from south Asia ‘for their struggle against the suppression of children and young people and for the right of all children to education’ 28 reiterates the fact that a significant effort is required to improve the conditions of children’s education in this region. The proposed device has been accordingly named SAKSHAR, which in Hindi means ‘literacy’. We feel that the devices like SAKSHAR will give a boost to the learning of alphabets by the children and, thus, improve literacy.
The structure of the article is organized as follows. The second and third sections discuss the construction/calibration of the set-up. The fourth section discusses about the methodology for prediction of user’s behaviour. The results of the user survey are discussed in the fifth section. Finally, the conclusions are given in the sixth section.
SAKSHAR:IDVT
In this section, we will give an overview of the SAKSHAR device.
System configuration
The device is shown in Figure 1. It consists of a projector, scanning laser range finder and a computer. The graphics rendered by the computer is projected on a flat surface. The scanning laser range finder, which is mounted on the device, provides the information about the place which has been touched by the user. The URG-04LX-UG01 29,30 sensor is a 2D scanning laser range finder (Hokuyo, Osaka, Japan) and has applications in mobile robotics. Detailed specifications of sensor is available in Appendix 1. Since the sensor is small and light weight, it is easily portable. It has detection range of approximately 5 m and makes measurement in polar coordinates. Note that many earlier applications for building big interactive displays used cameras for sensing. 31,32 Camera is suitable for use in controlled environments, as small changes in illumination demand fine-tuning of the segmentation process. Using two cameras, three-dimensional data can be obtained. But to cover a large area, more number of cameras are required. 33 Other options for sensors are Leap motion 34 and Kinect. 35 Leap motion, which has the capability of accurate detection (within small volume forming a hemisphere of 1 m radius and field of view of 150°), cannot be used for large displays. Kinect is another device which has a very low resolution and may not distinguish between holding a hand slightly above the surface (say, 1 cm above surface) and touching the surface. The sensor we have used allowed detection over a large area (across approximately 270°, and a radius of 5 m) thus making it suitable for being used in large displays. The display may be 5 m in size according to the range of sensor. If the plane along which the scanning is done is kept parallel to the display surface and close to it, the user’s action of touching the display can be easily identified. Note here that the current development has been primarily designed for touch detection and therefore other actions like click, move, push, pull, and so on, are not discussed in this article. However, camera may be suitable for implementing such functionality on a smaller sized screen owing to the limited field of view of the cameras. 36 –38 The sensor can be easily calibrated by using the method proposed in ‘Methodology’ section. The configuration of the projector with respect to the sensor is measured using two translations and one angular rotation as shown in Figure 2 (details will be discussed in ‘Methodology’ sub section). The projector and sensor are mounted on a stand made of aluminium alloy that ensures strength with light weight. The sensor is placed at the bottom of the stand, almost touching the projection surface. This converts it to a screen plane. On the other hand, projector is placed inclined and focused on the ground plane.

SAKSHAR: IDVT device. (a) System configuration and (b) person playing a game.
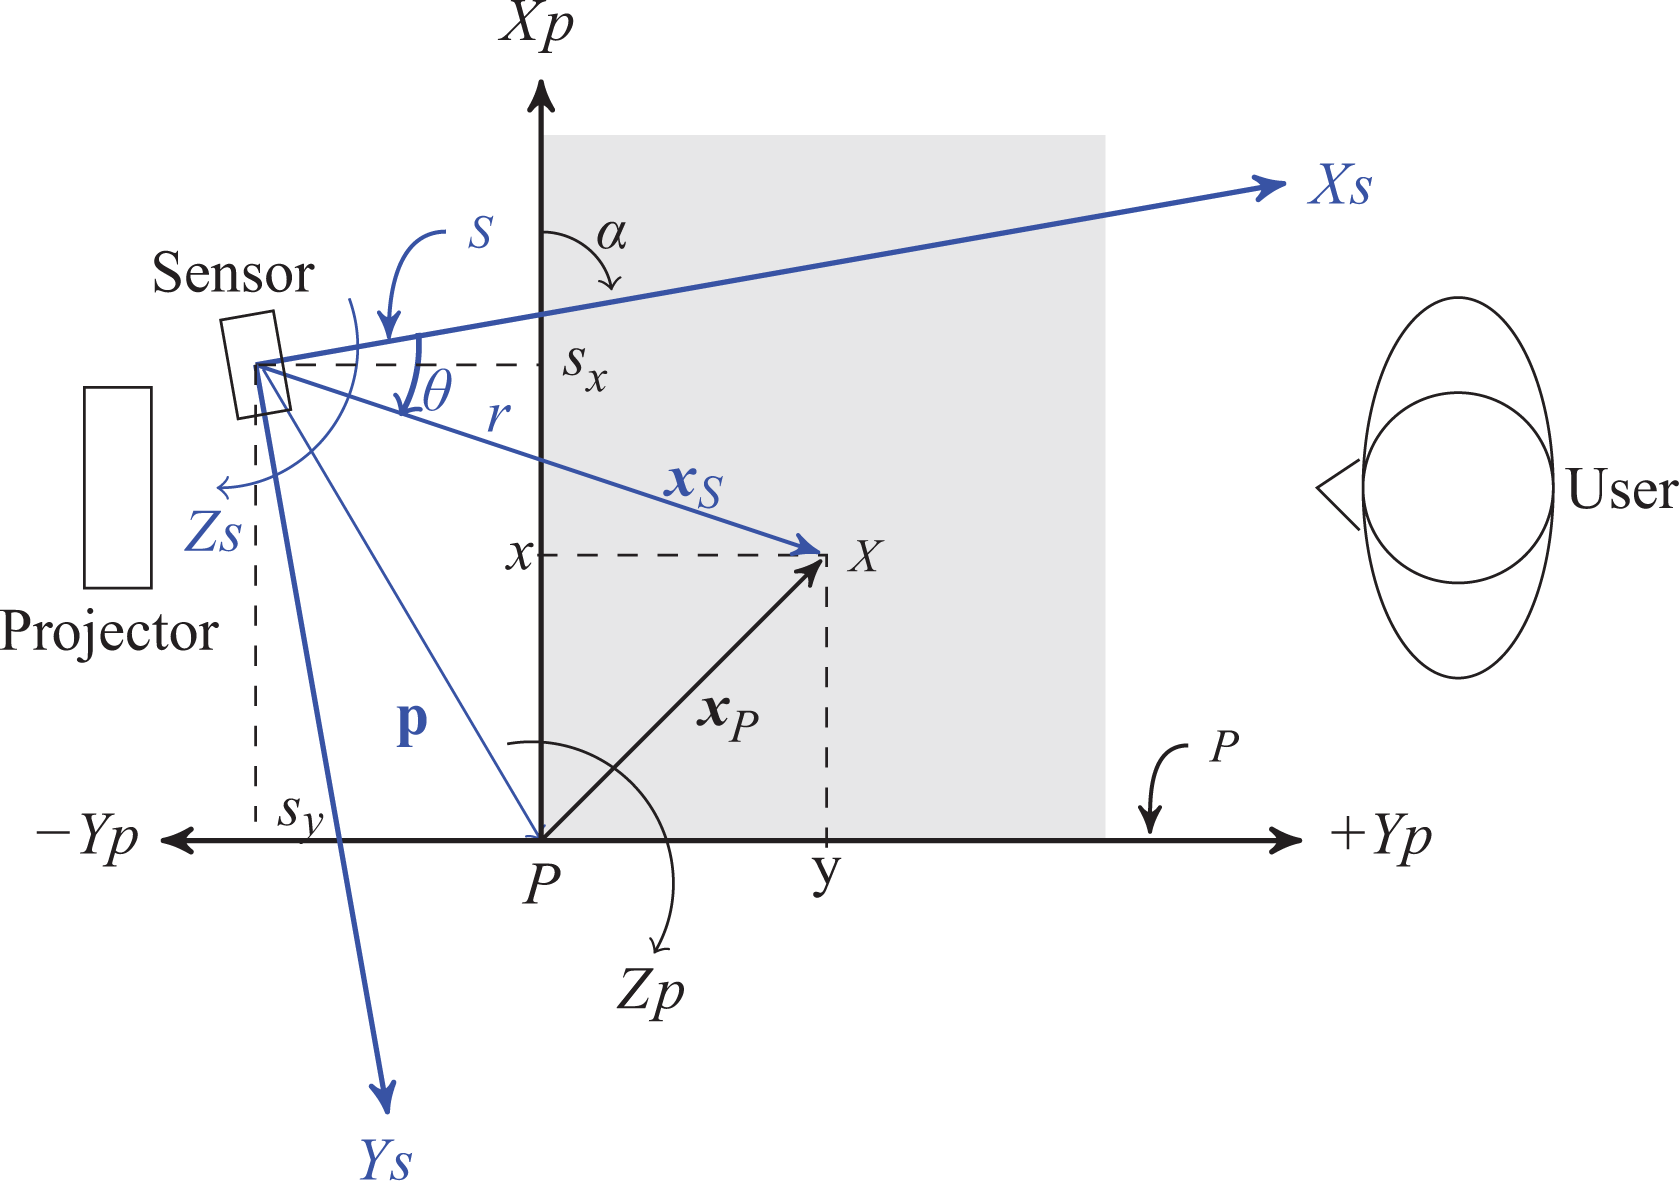
Transformation of coordinate axis.
Though we have not found such a portable interactive educational device for comparison, we will compare SAKSHAR with other non-portable interactive displays for large screens. The major difference is that we have used a single scanning 2D laser range scanner sensor instead of a camera. 36 –38 The devices that use camera are difficult to calibrate and highly dependent on illumination and other image processing–related factors. Issues related to illumination are also prominent while using other sensors-like Kinect as proposed in the study by Sharma et al. 39 Additionally, the conventional displays are fragile and thus difficult to transport. The proposed set-up is very cheap (about US$2000 based on the prices of the components procured in India in April 2016) when compared to any of the commercially available interactive surfaces (e.g. Samsung SUR 40 costs about US$17,000). The high cost of the commercial devices may be principally due to the price of the LED screen. SMARTBOARD is also expensive (more than US$3600), and like other display systems it is also not portable. For the proposed SAKSHAR:IDVT, except the sensor (costing US$1000), other components like computer, projector and mounting stand may be readily available in many schools and educational institutions. In such a situation, the cost of fabrication of the system is only about US$1000. In other countries or in the future, prices may vary based on the technology, governmental levies, popularity and demand.
The game
The developed application produces output in two windows. One of them is a main window that opens in primary monitor and other one opens in a secondary screen, as depicted in Figure 1(b). The primary monitor is a part of the personal computer (PC) from where the game is invoked. This window has keys/drop-down menus for several configurations including the one to choose the language. The application runs in the main window. The secondary monitor is the flat surface on which projector projects or liquid crystal display (LCD) screen. Game was programmed in C-.05em C# using OpenTK 40 framework. The secondary window pops up in full-screen mode to generate the game. The game has provision for audio feedback, which was produced using Cgen.Audio, 41 a Microsoft.NET 42 -based audio library. The laser range finder was connected to the central processing unit through a universal serial bus cable. Serial communication was implemented using UrgCtrl library. 43 The details about the game are discussed in Appendix 2.
Calibration
Calibration of the laser range finder (URG sensor) is an integral part of the system. The methodology, results, and applications will be discussed in this section.
Methodology
The speciality of the sensor is that it can scan along a plane surface and allows detection over a large distance (5 m radial distance). It does not have high accuracy because of its use in mobile robots. But the current application requires better performance and thus a sensor calibration process is to be done. The laser range finder provides polar coordinates, which are then converted into Cartesian coordinates. These coordinates are found with respect to the sensor coordinate frame. Figure 2 shows the configuration of the coordinate systems of the projective screen (P) and the sensor (S). There are methods for obtaining transformation from a camera coordinate system to a sensor coordinate system 44 when such a sensor is used along with a camera. It is not suitable for the current application since we have a projective screen instead of a camera. Therefore, we have implemented the following methodology.
The equation to obtain the nominal coordinates on the projected or the screen coordinate system P is given by

where

The nominal value of the angle between the frames about Z axis is given by α and the translation is given by

which can be theoretically estimated by partial derivative of

where the 2 × 5 matrix

Matrix

where

In equation (5), m is the number of readings that were taken by making measurements in different areas of the workspace. Note that rj, θj, xj and yj, for

Measurement positions for calibration. (a) Measurement locations and (b) user action.
Moreover, the position errors would increase with the distance due to radial measurements. Hence, it will be suitable to make measurements at extreme points of the screen away from the sensor. Keeping the above points in mind, corrections required in the parameters are obtained from equation (5) as

where the components of Δζ, namely, dr and dθ values were used to update r and θ obtained from the sensor. The rest of the values can be used to update the nominal values of the parameters α, sx and sy used in the transformation matrix (
Once the calibration is done, it is possible to track the position of the user’s hand/finger accurately through appropriate feedback. This makes the system interactive, that is, the system can determine the position of the user’s finger or palm that touches the screen and give suitable feedback either through visual or audio signal. One advantage of this calibration methodology is that any type of screen can be easily calibrated and then be used as a touch sensitive screen at a very low cost. This will be discussed in ‘Recalibration’ sub section.
An illustration
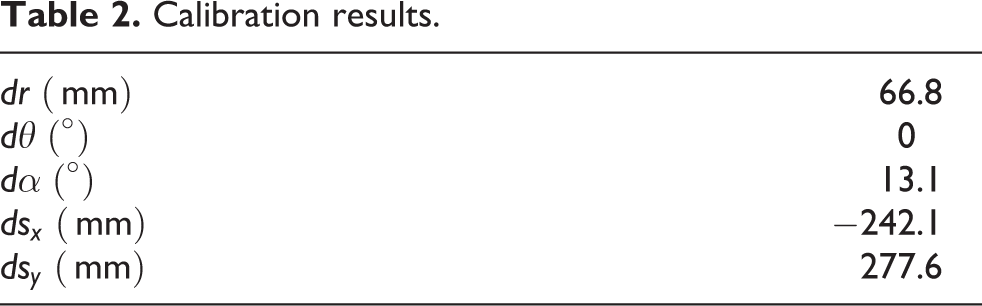
This sub section explains how the calibration was performed using five points. In practice, one should use more number of points for improved accuracy. First, the measurements (Figure 3(a)) of the five points on the surface where the projection was to be made were taken. The measurements are given in Table 1. The corrections obtained after applying the calibration formula (equation 6) are given in Table 2. Table 3 shows the nominal parameters and other projection specific parameters that were used for the computation. Once the corrections are implemented, it is possible to accurately determine the point on the screen that is being touched. Note that the correction in θ, that is, dθ of Table 2 was found to be zero. It was incorporated in the value of α as these are along the same axis.
Measurements of calibration points.
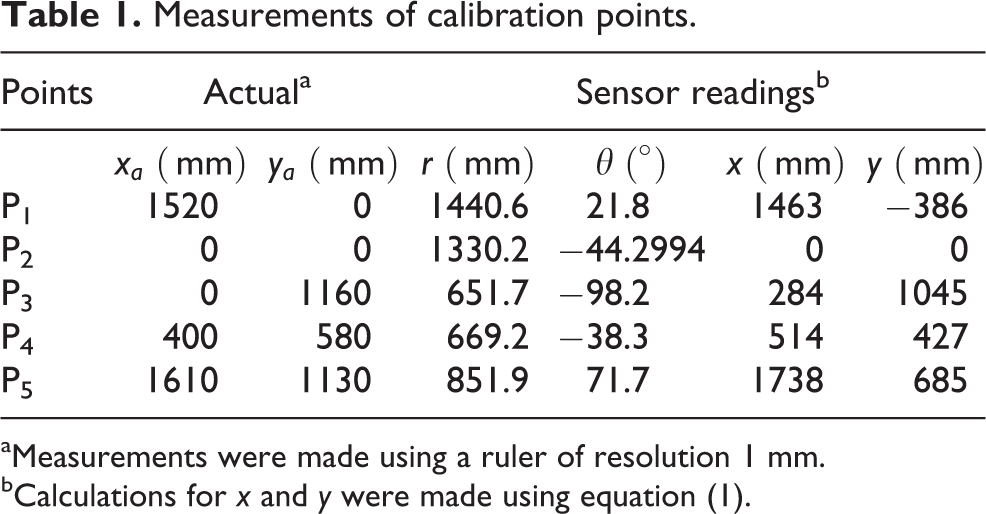
aMeasurements were made using a ruler of resolution 1 mm.
bCalculations for x and y were made using equation (1).
Calibration results.
Parameters used during calibration.

Varying number of points for calibration
To perform the calibration and to evaluate the performance of the algorithm with varying number of points, the following experiment was done. Screen size of 1550 × 1140 mm was considered with a total of 25 different points on it. Positions were chosen on a 5×5 grid, and measurements were taken using ruler of 1 mm resolution on the projector coordinate system P. Calibration was done multiple times by varying the number of points as 5, 10, 15 and 20. The remaining points, that is, 20, 15, 10 and 5, respectively, were used for evaluating the accuracy of the algorithm. The final errors obtained are shown in Table 4. Best results were obtained when using 20 points. The norm of the differences between the estimated and actual, averaged over the 5 points, gave 22.4 mm as the error of estimation. It is clear from Table 4 that the more the number of points used for calibration, the more is the accuracy.
Calibration considering different number of points.

Recalibration
Calibration is normally done as a separate step at the beginning of construction of a system. For a change in the orientation of the projected screen and the sensor, the calibration data need to be changed. Also, if a different screen was used, the calibration has to be redone too. The calibration methodology explained in ‘Methodology’ sub section was designed in such a way that it can be easily integrated with the game, and the whole system will be adaptable to different kinds of displays. For this, a user interface was designed, which is to be displayed on the projected screen to guide a user. Before starting the calibration, the user will have to enter approximate maximum dimension of the projective screen, distance and rotation between the two coordinate systems (Figure 2). Later, the user will have to touch some marked positions at the corners of the screen (similar to those shown in Figure 3), which is indicated in Figure 4. The laser range finder, which is running on a different thread of the program, will be able to record reading for position of the hand on the projective screen within 10 s. Once this process is finished for all the points, the required calibration values can be calculated and saved in a file for future use. To test the applicability of the recalibration algorithm, it was tested on screens of several types and sizes. Besides the projected surface of Figure 1, LCD screen of Figure 5 was also calibrated. A video showing a normal LCD screen working as a touch-sensitive screen can be seen at https://www.youtube.com/watch?v=GNEbfTbyrmM.

Screen for calibration.

Ordinary LCD screen converted to touch sensitive screen. LCD: liquid crystal display.
The algorithm has been tested on three different screen sizes. First, a projector was used to produce displays of different sizes, which are shown in Table 5. The corresponding errors were calculated using the methodology discussed in ‘Varying number of points for calibration’ sub section with 20 points for calibration and 5 points for the measurement of errors. It can be noted that the calibration performed well for all the different screen sizes. The size of keys in the game is in the order of 150 mm for 710 × 540 mm screen, which is shown in Figure 6. For this, the error is only 10.4 mm which is quite acceptable for the detection of touch. For larger sized displays, the errors obtained are higher as expected but acceptable. After the calibration, the game was also run on all the screens without any issues.
Calibration for different screen sizes


Arrangement of four keys on the displayed screen.
Learning-based prediction
As briefly mentioned in ‘Introduction’ section, the usage styles of different people may affect the performance of the interactive system. This issue and the possible solution are discussed in this section.
Problem
To have an understanding about the issue arising due to varied usage styles, some graphical explanation will be provided. Figure 7(a) shows the user touching the planar surface on which the game is to be displayed. Figure 7(b) shows the points detected by the sensor and the corresponding mean points that were obtained. It can be easily inferred that the sensor detects only a contour of the palm which is different from the centre of the palm. Added to it, response to a projected graphical user interface key varies from one person to another. This has been observed while demonstrating the IDAT in IREX 2013. 19 The reason for this variation can be due to the way a person holds his hand while responding to the interface, that is, either as a fist, single finger or using palm surface. Such a variation also might be attributed to the perception of the centre of the key by the user.

Coordinate data captured by sensor. (a) User making a choice by placing the hand and (b) multiple readings from sensor.
Other variation includes the size of the palm. There is a significant variation in palm sizes depending on genders and ages. So, there is a need of customization for each person. The kinematics of human arm makes it convenient to make planar movements within a circular or elliptical boundary. However, the boundary of the projected key was defined by straight lines. The errors due to these variations can be compensated using an online learning–based approach, which is explained below.
Learning-based approach
What we want to know is the key which a user intends to select. To accommodate the variation in the user’s habits, a learning-based methodology is proposed here to predict the user’s intention. Any user who starts a game has to initially make some choices. Using these data, his or her hand movements can be learnt. A Bayesian learning method
46
was used to learn the pattern of hand placement. For this, consider that the person was supposed to touch the point with coordinates
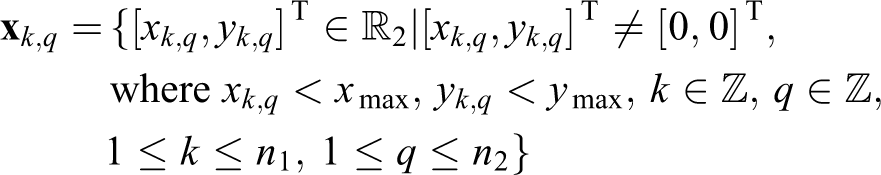
where n1 is the number of readings obtained from the sensor in one out of n2 cycles of measurements. Note that the sensor works at 1 Hz speed and therefore produces multiple scans when the arm is placed on the screen. Multiple scan profiles are shown in Figure 7(b) whose mean values are very close to one another (not distinguishable in the figure). Hence, one may use few scan data instead of multiple scans (e.g. 15 scans as shown in the figure). The values of xmax and ymax are defined by considering an approximate maximum size of the screen. Based on the sensor data, the calculated coordinates can be represented by

where E[

where d is the dimension of the vector

With this formulation, errors due to varying usage patterns can be corrected. Boundaries of the decision regions for each key will be defined by a quadric curve, which fits best the movement of the human arm. The training for model can be done using a few slides at the beginning of the game where the user may be asked to touch particular regions of the projective screen or the data can be gathered as the user keeps interacting with the device. Once the training of the model is complete, the estimated parameters can be used to decide whether a particular region has been selected or not based on the value of the log likelihood given by equation (8). At the initial stage of the game, the values of mean and covariance can be initialized as the coordinates of the centre of the key and the half size of length and breadth of the key, respectively. As the game progresses, these values can be updated.
Experimental results
As discussed earlier, parameters corresponding to the hand positions of a user while selecting a particular key were to be learnt. This implies that the mean

where
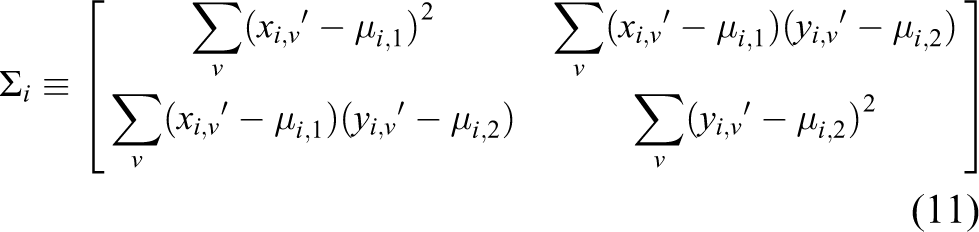
in which
Training the model
Since the performance measurement for human arm positioning in response to visual stimulus was not available in literature, we had to design an experiment to calculate these parameters. We relied on the methodology by which performance measurement for industrial manipulators was made. This is based on the notion that the kinematics of human arm can be compared to that of an industrial manipulator which is modelled to mimic human arm anthropometry. The quantification of performance measurement for such an industrial robot is based on computing mean and standard deviation as per ISO 9283.
47
Hence, the training was done using the conditions given in ISO 9283 for measuring the repeatability of an industrial robot. The user is made to choose four different options in a sequence. First, the user touches the key on top left corner, then the top right corner, followed by that on bottom right corner and finally on bottom left corner. This was repeated 30 times for a particular user. Once the experiment was done, the mean (

Discriminant function corresponding to key on top left.

Decision regions regarding a key is being pressed or not. (a) User 1 and (b) user 2.
Accuracy
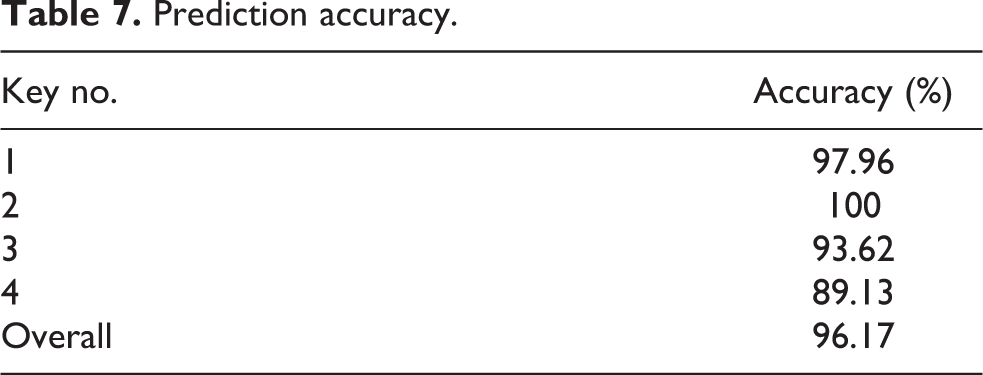
To ascertain the accuracy of the proposed method, the device was used by 10 different users (users were males of ages 20–35 years) and the coordinates of the points where they touched were recorded while playing the game. As discussed earlier, the users touched the keys in a sequence. More than 700 points corresponding to four different keys were recorded. The data were divided into 70% training data and the rest as testing data. The parameters estimated using the training data were used to make predictions. The confusion matrix that represents the predicted classification of the keys according to the proposed method is shown in Table 6. The accuracy of the prediction of each key is shown in Table 7. The overall accuracy of prediction is 96.17%. The points used in conducting the tests are shown in Figure 10.
Confusion matrix.

Prediction accuracy.

Data points used for testing.
Advantage
An advantage of the above statistical analysis is that it can be used to decide the suitable size of the keys to be displayed at the interface. Statistically, this should be of the order of six times the standard deviation in each axis. The maximum standard deviations in X and Y directions are 25.3 and 27.5 mm as per the data shown in Figure 10. Therefore, the size of the keys can be of the order of 151.6 and 165.1 mm along X and Y directions, respectively. It also represents the minimum possible distance between the centres of two keys. This inference can also be substantiated by visually inspecting Figure 10. An average square-shaped key of size 160 mm and the centre-to-centre distance of 165 mm or more between any two keys along X or Y directions would be sufficient. As shown in Figure 6, the key size is 159.8 mm and the centre-to-centre distances between two keys are 355 and 216 mm along X and Y directions, respectively.
Note that SAKSHAR was designed to teach alphabets (teaching mode) and test the learning outcome (details are explained in Appendix 2). This requires a person to use the device multiple times which implies that the user will touch the screen multiple times. Therefore, customization of the system for the personal use is viable. Such method can also be extended to similar interactive devices.
Studies regarding adaptive learning of a user’s intention were reported in the studies by Bi and Zhai and Yin et al. 48,49 But, no information about the experimental conditions to standardize the measurements was reported. To our knowledge, this is the first time that the variation in usage style for a large display is experimentally established.
Field trials
A suitable way in which the performance of such systems can be evaluated is through demonstrating it to multiple users and then evaluating their personal feedback/learning outcome. This section presents the field trials conducted to evaluate the suitability of the device in primary school education.
User survey
User survey was conducted by taking the device to a school to demonstrate to the students and teachers. Thereafter, personal feedbacks were obtained. The aspects for which feedback was obtained are Usability/Operability/Accessibility, Interest/Fun/Pleasure/Fulfilment and Usefulness/Availability/Effectiveness. The Feedback regarding Usability/Operability/Accessibility represents the ease with which people could operate the system. The feedback corresponding to Interest/Fun/Pleasure/Fulfilment represents how much the people are interested to play the game. Finally, the feedback corresponding to Usefulness/Availability/Effectiveness shows the extent to which the goal of SAKSHAR system, that is, helping children to learn alphabets, has been attained. For each category, a nine-point scale was provided to choose in which points 1, 5, and 9 represent bad, average and good, respectively.
A survey was conducted in Kendriya Vidyalaya School 50 of IIT Delhi Campus. Four students each from classes 1 to 5 were selected. Their age-wise distribution is shown in Figure 11(a). Equal number of boys and girls were ensured as indicated in Figure 11(b). Additionally, from each class, two students with best academic performance index and the other two with relatively lesser performance index were selected. The following procedure was adopted while collecting the user survey details. Initially, the students were given introduction to the device and then allowed to play the game a few times on his/her own allowing them to get acquainted with it. This allowed each student to familiarize with the device. Later, a student was asked to play the game from beginning till the end on his/her own without any assistance. After this, the student was verbally asked questions regarding the game. The student was asked to give grades to the specific feature of the device. Using superlatives and with reference to the school grading system, the student was made to understand the feedback system employed in our study. The feedback was then recorded. All communication with the students was made in Hindi since it is the mother tongue of all the students involved in the study. All the participating students were given sweets as gift at the end of the whole process. The feedback obtained by the students is represented in Figures 12(a) to (c). A majority of the students (70%) have reported that the device is easy to use by giving maximum, that is, 9 points. It is interesting to note that 95% of the students enjoyed using the device, whereas 65% of the people stated that the device is beneficial for them in learning alphabets by giving 9 points in the respective categories.
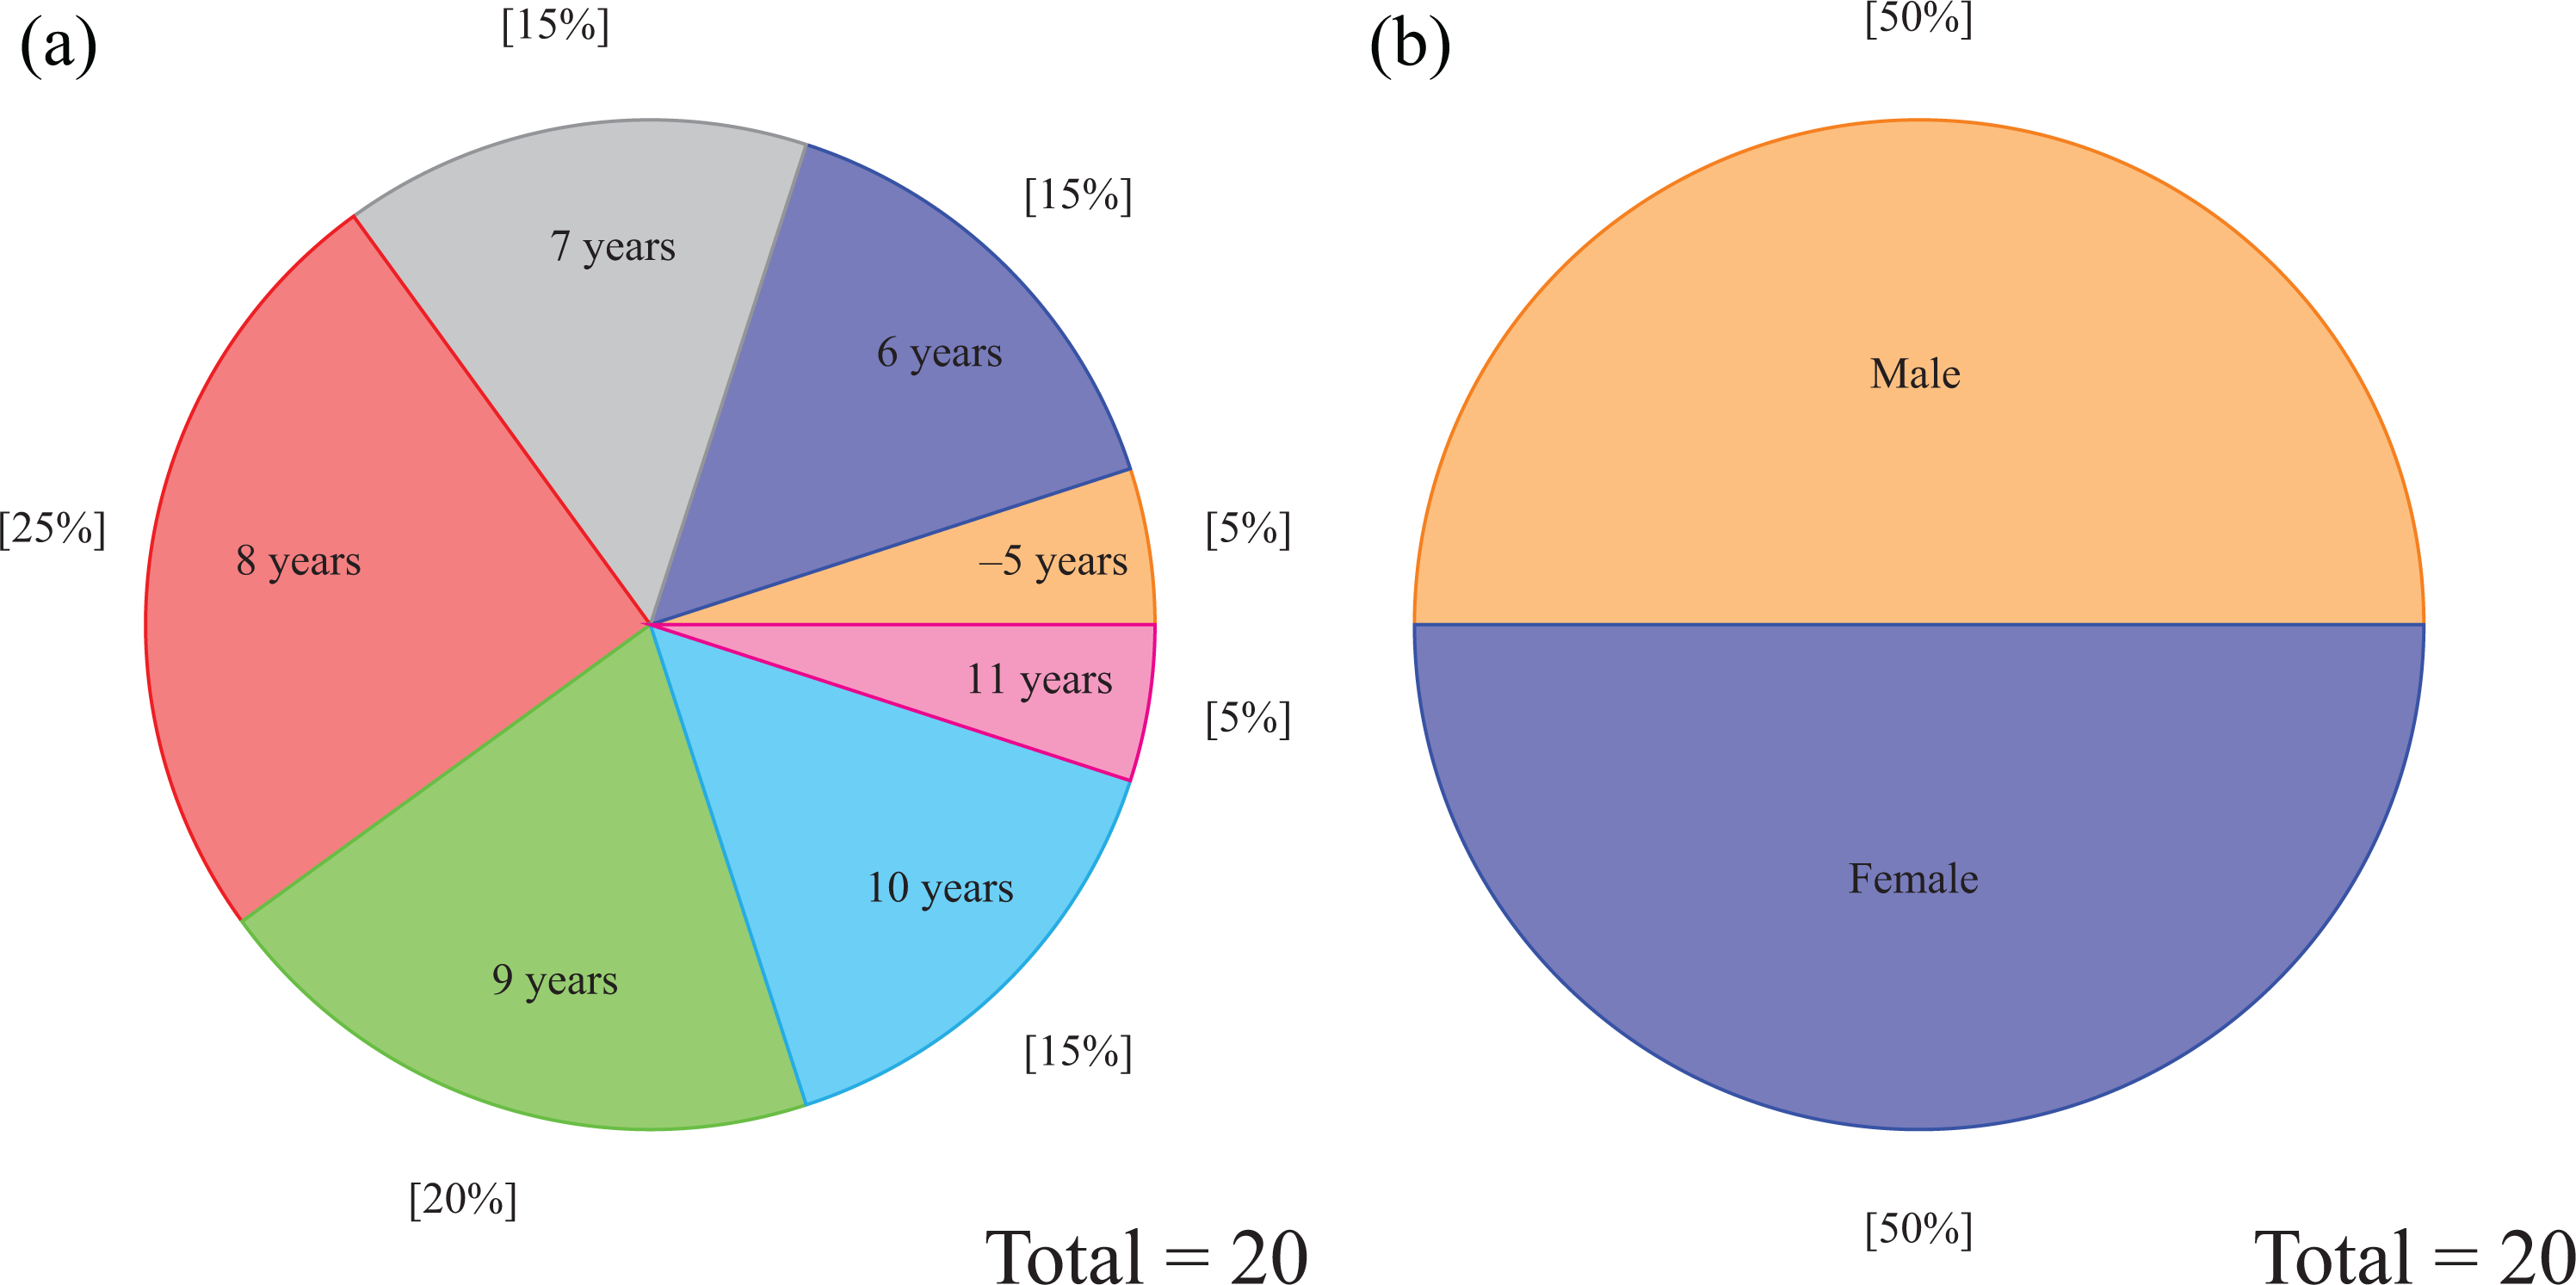
User’s age and gender. (a) Age group distribution and (b) gender distribution.

Survey results from trials in school. (a) Usability/Operability/Accessibility, (b) Interest/Fun/Pleasure/Fulfilment and (c) Usefulness/Availability/Effectiveness.
In order to ascertain the reliability of the user survey, the same was conducted twice separated by a period of 5 months. The first user survey results are shown in Figure 12. For the second survey, the variation in mean score was 0.6, 0.5 and 0.8, respectively, for Usability/Operability/Accessibility, Interest/Fun/Fulfilment and Usefulness/Availability/Effectiveness. For each metric, mean was calculated after adding the points given by all the children and dividing by the total number of children. The results obtained during both the surveys are therefore quite similar and thus user survey data can be considered reliable.
Improvement in learning outcome
To understand the real impact of the system, we conducted another trial to check the learning outcome of the students. We picked up a class of 19 students and conducted an assessment test (test 1) to check the comprehension of the students. The test consisted of questions where the picture of an object was followed by four different spellings of the name of the object as shown in Figure 13. The students had to identify the right spelling and had to mark their choice on article by ticking on it. We chose the questions such that the overall comprehension of the children would be tested. This was done after incorporating the opinion of the school teachers and few educationists. Points were given for the correct answer and no negative marks were given for the wrong answer. Adequate time was given to the students so that the test would check their understanding and not merely their speed. Keeping this in mind, a suitable upper limit was set on the time to attempt the paper. Based on the results obtained from the test, we divided the class into two groups of 12 and 7 students with similar performance indices. It was also ensured that both the groups had equal ratios of boys to girls. These groups were called group A and group B.

Questions for test.
Group A was then allowed to use the device and group B was taught using the regular teaching method similar to the one already used in the school. While teaching group B, we showed a video with the images of objects and their names. For each alphabet, the object was shown and the object name was pronounced. Additionally, spelling was explained. After teaching the students using these methods, another test (this is referred to as test 2) with the same design as the first one was conducted for both the groups. Improvement in score of group A was noticed. On an average, there was 12% increase in the marks of the students of group B, while there was a 33% increase in the marks of group A students who were taught using the SAKSHAR. The improvement in the scores of group A in the test are represented in Figure 14. The improvement in scores after and before being taught using regular teaching method for group B is shown in Figure 15. The improvement in the marks and understanding of the students in group A was 21% more than that of group B. This is mainly attributed to the involvement of the students with the interactive learning process rather than merely memorizing.
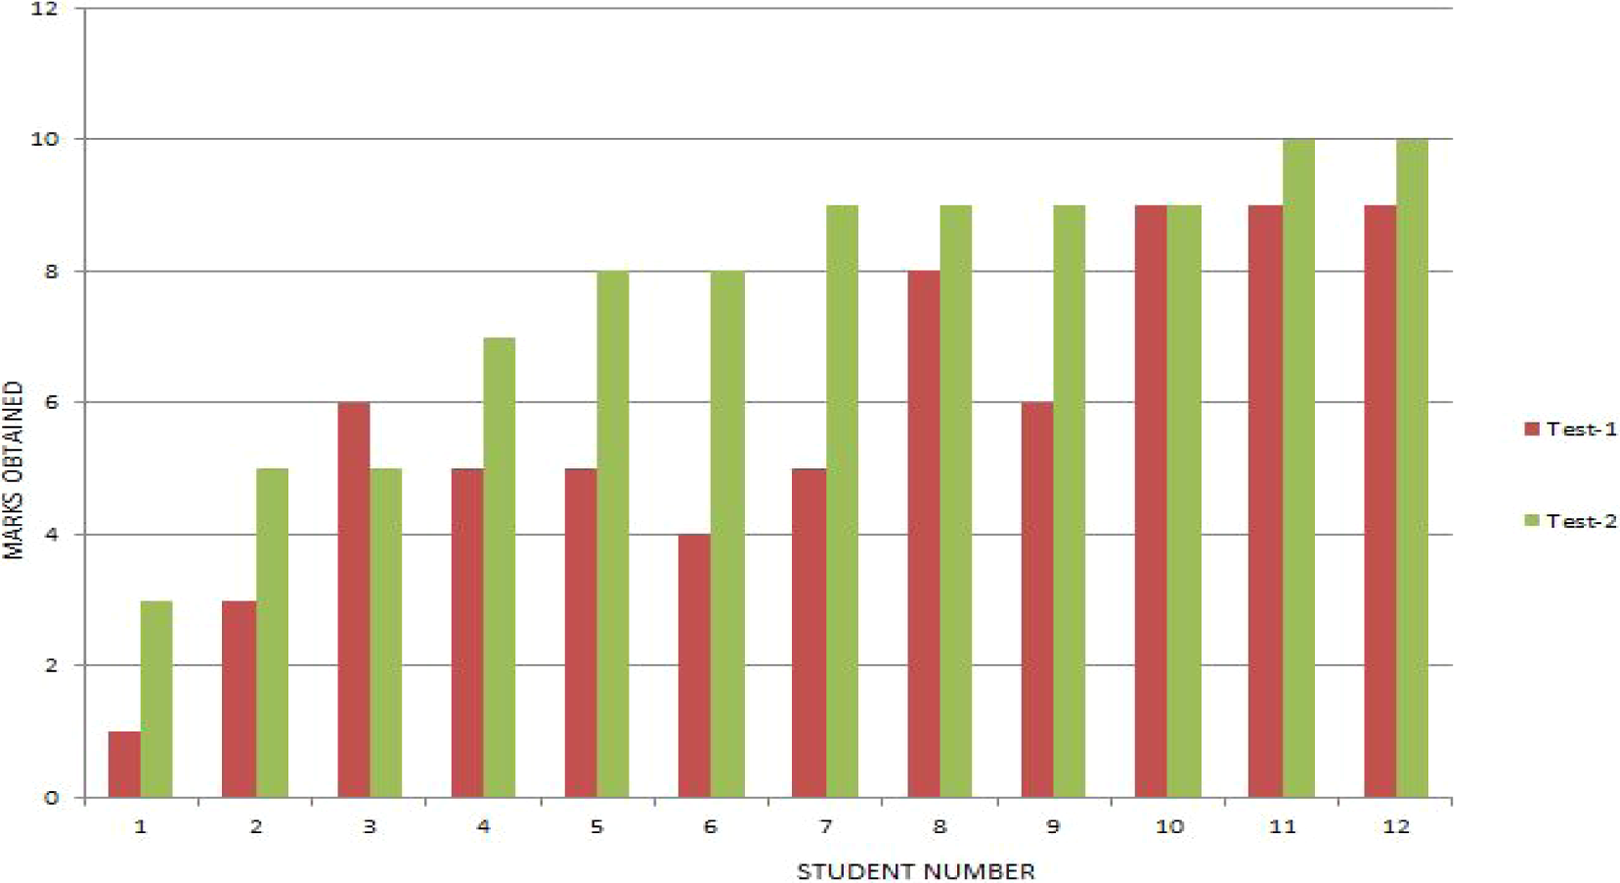
Group A tests.

Group B tests.
The results discussed here established that the device could prove to be a very useful learning aid especially in primary schools. The overall opinion about the SAKSHAR set-up was encouraging. There was also avenue for the people to give suggestions for improvement. Implementation of the system for teaching other subjects like geography, further lowering of costs using cheaper sensors, getting the system quickly available for purchase by users, and so on, were some of them. Efforts are now being made to implement some of the suggestions. For example, as discussed earlier, the learning-based prediction was made after evaluating the performance of the system during a feedback session.
Conclusions
A new device called SAKSHAR:IDVT was built for interactive learning of alphabets. Details of the development, particularly, the calibration of sensor, that is, the 2D sensor to project, to projector screen is an important contribution of this article. Even though the fundamental mathematics is well known, but using it for sensor to projector calibration based on the observed data made the device reliable. The generalized formulation can be used for implementation of interactive screen for different types of displays using the same sensor. The calibration algorithm enabled us to get very good results with regards to providing suitable audio/visual feedback by detecting the point of touch with respect to the projected display. A learning-based methodology to estimate user’s intentions was also proposed, which is another contribution of this article. This helps us to make suitable decisions about which key is being touched. This might have application in other touch-sensitive displays also. As an application, a game was developed using this platform with audiovisual feedback to encourage learning by primary school students. A video of the device being used can be seen at https://www.youtube.com/watch?v=zDDbn8U4El4. The game features multiple language-based user interfaces. In summary, the article has the following three main contributions: Development and performance measurement of a generalized calibration process which can be used to convert a surface or a large screen to an interactive one using 2D scanning laser range finder. Development and field test of IDVT which is a portable interactive screen that can be used in teaching alphabets to children. A new learning-based prediction of a user’s intention.
Footnotes
Acknowledgements
The authors would like to thank Suzuki Foundation, Kayamori Foundation of Informational Science Advancement and Waseda University for supporting this collaborative endeavour and sponsoring our research visits to Japan. The authors would like to present their sincere thanks to BRNS/BARC for their support regarding the setting up of Programme for Autonomous Robotics Laboratory at IIT Delhi where most of the development work took place. Mr Arun Dayal Udai and Ms Bharti helped in the sensor integration and Hindi content generation, respectively. Mrs Nidhi and Mrs Pinkoo Chawla from Kendriya Vidyalaya (KV) School, IIT Delhi helped in conducting the trials. Several KV students are also thanked for their participation.
Declaration of conflicting interests
The author(s) declared no potential conflicts of interest with respect to the research, authorship, and/or publication of this article.
Funding
The author(s) disclosed receipt of the following financial support for the research, authorship, and/or publication of this article: This work was supported by Suzuki Foundation (26-zyo-i29), Kayamori Foundation of Informational Science Advancement (K26kenXIX-453) and Waseda University (2014K-6191, 2014B-352, 2015B-346). This work was also supported by BRNS/BARC.